Fatal car crashes and road traffic accidents in Hammond, Indiana
- Fatal car crash and road traffic accident statistics for 2021
- Fatal accident count11
- Vehicles involved in fatal accidents17
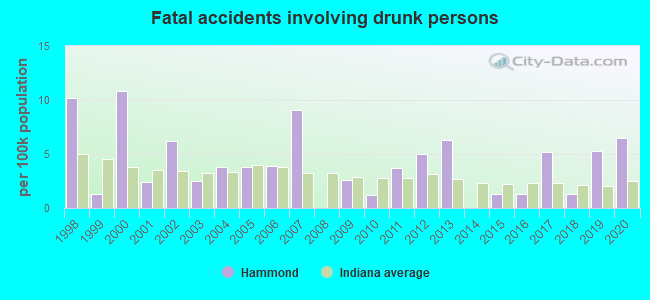
- Fatal accidents involving drunk persons0
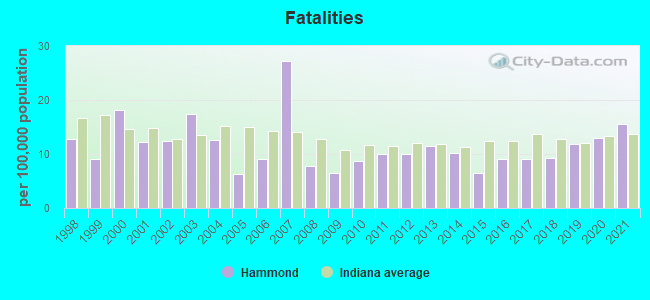
- Fatalities12
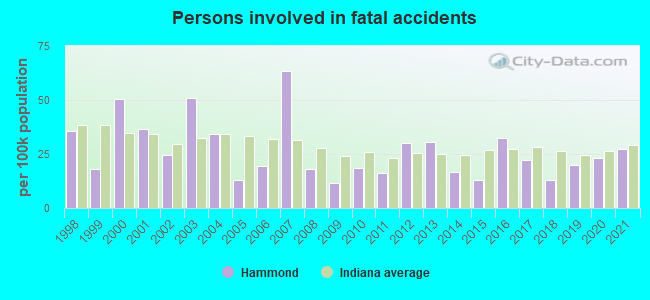
- Persons involved in fatal accidents21
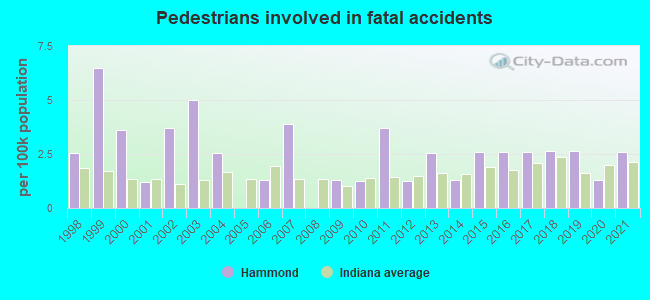
- Pedestrians involved in fatal accidents2
- Fatal car crash and road traffic accident statistics for 2020
- Fatal accident count10
- Vehicles involved in fatal accidents16
- Fatal accidents involving drunk persons5
- Fatalities10
- Persons involved in fatal accidents18
- Pedestrians involved in fatal accidents1
- Fatal car crash and road traffic accident statistics for 2019
- Fatal accident count8
- Vehicles involved in fatal accidents15
- Fatal accidents involving drunk persons4
- Fatalities9
- Persons involved in fatal accidents15
- Pedestrians involved in fatal accidents2
- Fatal car crash and road traffic accident statistics for 2018
- Fatal accident count7
- Vehicles involved in fatal accidents14
- Fatal accidents involving drunk persons1
- Fatalities7
- Persons involved in fatal accidents10
- Pedestrians involved in fatal accidents2

Data:
Latest news about accidents in Hammond, IN collected exclusively by city-data.com from local newspapers, TV, and radio stations
No street view available for this location
Hammond fatal accident statistics for 1998 - 2021
Average EMS response time
- Hammond(Based on 233 reports) 6.7 mins
- Lake County(Based on 1,093 reports) 7.7 mins
- Indiana(Based on 17,717 reports) 8.3 mins
Average hospital transport time
- Hammond(Based on 96 reports) 34.5 mins
- Lake County(Based on 406 reports) 40.4 mins
- Indiana(Based on 5,901 reports) 39.5 mins
Daylight
- Hammond(Based on 503 reports) 40.2%
- Lake County(Based on 2,849 reports) 39.7%
- Indiana(Based on 39,866 reports) 49.1%
Dark - Lighted
- Hammond(Based on 503 reports) 31.8%
- Lake County(Based on 2,849 reports) 22.5%
- Indiana(Based on 39,866 reports) 9.2%
Dark - Not Lighted
- Hammond(Based on 503 reports) 24.1%
- Lake County(Based on 2,849 reports) 33.7%
- Indiana(Based on 39,866 reports) 37.2%
Dawn
- Hammond(Based on 503 reports) 2.4%
- Lake County(Based on 2,849 reports) 2.1%
- Indiana(Based on 39,866 reports) 1.8%
Dusk
- Hammond(Based on 503 reports) 1.6%
- Lake County(Based on 2,849 reports) 1.6%
- Indiana(Based on 39,866 reports) 2.1%
Clear
- Hammond(Based on 505 reports) 85.3%
- Lake County(Based on 2,860 reports) 83.0%
- Indiana(Based on 39,942 reports) 80.9%
Rain
- Hammond(Based on 505 reports) 7.9%
- Lake County(Based on 2,860 reports) 8.1%
- Indiana(Based on 39,942 reports) 8.8%
Unknown
- Hammond(Based on 505 reports) 3.8%
- Lake County(Based on 2,860 reports) 3.5%
- Indiana(Based on 39,942 reports) 4.3%
Snow
- Hammond(Based on 505 reports) 1.8%
- Lake County(Based on 2,860 reports) 3.0%
- Indiana(Based on 39,942 reports) 2.9%
Sleet or Hail
- Hammond(Based on 505 reports) 0.6%
- Lake County(Based on 2,860 reports) 0.8%
- Indiana(Based on 39,942 reports) 0.7%
Fog, Smog, Smoke
- Hammond(Based on 505 reports) 0.2%
- Lake County(Based on 2,860 reports) 0.6%
- Indiana(Based on 39,942 reports) 1.2%
Cloudy
- Hammond(Based on 505 reports) 0.2%
- Lake County(Based on 2,860 reports) 0.5%
- Indiana(Based on 39,942 reports) 0.6%
Other
- Hammond(Based on 505 reports) 0.2%
- Lake County(Based on 2,860 reports) 0.1%
- Indiana(Based on 39,942 reports) 0.2%

Hammond fatal car crash and road traffic accident list for 2021
- Fatal accident count11
- Vehicles involved in fatal accidents17
- Fatalities12
- Persons involved in fatal accidents21
- Pedestrians involved in fatal accidents2
Daylight
- Hammond(Based on 11 reports) 45.5%
- Lake County(Based on 65 reports) 40.0%
- Indiana(Based on 860 reports) 49.5%
Dark - Lighted
- Hammond(Based on 11 reports) 36.4%
- Lake County(Based on 65 reports) 32.3%
- Indiana(Based on 860 reports) 15.6%
Dark - Not Lighted
- Hammond(Based on 11 reports) 9.1%
- Lake County(Based on 65 reports) 24.6%
- Indiana(Based on 860 reports) 29.5%
Dawn
- Hammond(Based on 11 reports) 9.1%
- Lake County(Based on 65 reports) 1.5%
- Indiana(Based on 860 reports) 1.9%
Clear
- Hammond(Based on 11 reports) 63.6%
- Lake County(Based on 65 reports) 67.7%
- Indiana(Based on 858 reports) 72.7%
Rain
- Hammond(Based on 11 reports) 18.2%
- Lake County(Based on 65 reports) 9.2%
- Indiana(Based on 858 reports) 7.3%
Unknown
- Hammond(Based on 11 reports) 9.1%
- Lake County(Based on 65 reports) 21.5%
- Indiana(Based on 858 reports) 16.8%
Snow
- Hammond(Based on 11 reports) 9.1%
- Lake County(Based on 65 reports) 1.5%
- Indiana(Based on 858 reports) 1.7%
| # | Date | Location | Vehicles | Drunk persons | Fatalites | Persons | Pedestrians |
|---|
| 1 | Jan 31, 2021 11:27 AM | I-80 | 2 | - | 1
| 1 | 1 |
| 2 | Mar 18, 2021 01:07 AM | I-80 Ramp | 1 | - | 1
| 1 | - |
| 3 | Apr 20, 2021 03:11 PM | Us-41n | 4 | - | 2
| 6 | - |
| 4 | Apr 20, 2021 09:44 PM | Calumet Ave | 1 | - | 1
| 1 | - |
| 5 | May 4, 2021 11:03 PM | Us-41s | 1 | - | 1
| 1 | - |
| 6 | May 30, 2021 08:47 AM | I-80 | 2 | - | 1
| 3 | - |
| 7 | Oct 2, 2021 11:16 PM | Us-12 | 1 | - | 1
| 1 | - |
| 8 | Oct 9, 2021 05:50 AM | I-90 | 1 | - | 1
| 1 | - |
| 9 | Nov 1, 2021 06:25 AM | I-80 | 1 | - | 1
| 1 | - |
| 10 | Nov 8, 2021 03:16 PM | Kennedy Ave, Martha St | 1 | - | 1
| 1 | 1 |
| 11 | Jun 4, 2021 10:34 AM | Hohman Ave | 2 | - | 1
| 4 | - |
Hammond fatal car crash and road traffic accident list for 2020
- Fatal accident count10
- Vehicles involved in fatal accidents16
- Fatal accidents involving drunk persons5
- Fatalities10
- Persons involved in fatal accidents18
- Pedestrians involved in fatal accidents1
Dark - Lighted
- Hammond(Based on 10 reports) 60.0%
- Lake County(Based on 52 reports) 36.5%
- Indiana(Based on 812 reports) 15.0%
Daylight
- Hammond(Based on 10 reports) 30.0%
- Lake County(Based on 52 reports) 40.4%
- Indiana(Based on 812 reports) 48.2%
Dark - Not Lighted
- Hammond(Based on 10 reports) 10.0%
- Lake County(Based on 52 reports) 21.2%
- Indiana(Based on 812 reports) 31.3%
Clear
- Hammond(Based on 10 reports) 70.0%
- Lake County(Based on 52 reports) 76.9%
- Indiana(Based on 814 reports) 72.7%
Unknown
- Hammond(Based on 10 reports) 30.0%
- Lake County(Based on 52 reports) 13.5%
- Indiana(Based on 814 reports) 17.6%
| # | Date | Location | Vehicles | Drunk persons | Fatalites | Persons | Pedestrians |
|---|
| 1 | Feb 1, 2020 08:34 PM | River Dr | 1 | 1
| 1 | 1 | - |
| 2 | Feb 2, 2020 02:30 AM | I-80 | 3 | 1
| 1 | 4 | - |
| 3 | May 14, 2020 08:08 AM | Us-41 | 1 | - | 1
| 1 | - |
| 4 | May 31, 2020 10:08 PM | Cedar Ave | 2 | - | 1
| 2 | - |
| 5 | Jul 11, 2020 02:15 AM | Us-41n | 1 | - | 1
| 1 | 1 |
| 6 | Jul 26, 2020 02:01 PM | Claude Ave | 1 | 1
| 1 | 1 | - |
| 7 | Aug 1, 2020 02:28 AM | Gostlin St, Columbia Ave | 2 | - | 1
| 3 | - |
| 8 | Aug 23, 2020 02:31 AM | Us-12s, 5th Avenue | 2 | 1
| 1 | 2 | - |
| 9 | Aug 26, 2020 03:25 PM | Willow Ct | 2 | - | 1
| 2 | - |
| 10 | Sep 11, 2020 02:43 AM | Us-20 | 1 | 1
| 1 | 1 | - |
Hammond fatal car crash and road traffic accident list for 2019
- Fatal accident count8
- Vehicles involved in fatal accidents15
- Fatal accidents involving drunk persons4
- Fatalities9
- Persons involved in fatal accidents15
- Pedestrians involved in fatal accidents2
Dark - Lighted
- Hammond(Based on 8 reports) 87.5%
- Lake County(Based on 42 reports) 47.6%
- Indiana(Based on 749 reports) 15.5%
Dark - Not Lighted
- Hammond(Based on 8 reports) 12.5%
- Lake County(Based on 42 reports) 26.2%
- Indiana(Based on 749 reports) 27.0%
Clear
- Hammond(Based on 8 reports) 62.5%
- Lake County(Based on 42 reports) 64.3%
- Indiana(Based on 750 reports) 68.1%
Unknown
- Hammond(Based on 8 reports) 25.0%
- Lake County(Based on 42 reports) 19.0%
- Indiana(Based on 750 reports) 19.7%
Rain
- Hammond(Based on 8 reports) 12.5%
- Lake County(Based on 42 reports) 14.3%
- Indiana(Based on 750 reports) 7.6%
| # | Date | Location | Vehicles | Drunk persons | Fatalites | Persons | Pedestrians |
|---|
| 1 | Feb 3, 2019 00:29 AM | I-80 Ramp | 1 | 1
| 1 | 1 | - |
| 2 | Mar 2, 2019 05:08 AM | Sr-152s | 1 | 1
| 1 | 1 | - |
| 3 | Feb 6, 2019 06:41 PM | 165th St | 3 | - | 1
| 1 | - |
| 4 | Apr 30, 2019 11:30 PM | I-80 | 3 | 1
| 1 | 3 | - |
| 5 | May 19, 2019 01:25 AM | 169th St | 2 | 1
| 1 | 2 | - |
| 6 | Jun 29, 2019 09:06 PM | Columbia Ave | 1 | - | 1
| 1 | 1 |
| 7 | Oct 7, 2019 09:57 PM | Us-12e, 108th Street | 3 | - | 2
| 5 | - |
| 8 | Oct 17, 2019 05:47 AM | Us-41s, 118th St | 1 | - | 1
| 1 | 1 |
Hammond fatal car crash and road traffic accident list for 2018
- Fatal accident count7
- Vehicles involved in fatal accidents14
- Fatal accidents involving drunk persons1
- Fatalities7
- Persons involved in fatal accidents10
- Pedestrians involved in fatal accidents2
Daylight
- Hammond(Based on 7 reports) 42.9%
- Lake County(Based on 47 reports) 51.1%
- Indiana(Based on 776 reports) 49.2%
Dark - Lighted
- Hammond(Based on 7 reports) 42.9%
- Lake County(Based on 47 reports) 31.9%
- Indiana(Based on 776 reports) 15.3%
Dark - Not Lighted
- Hammond(Based on 7 reports) 14.3%
- Lake County(Based on 47 reports) 17.0%
- Indiana(Based on 776 reports) 31.6%
Clear
- Hammond(Based on 7 reports) 100.0%
- Lake County(Based on 47 reports) 76.6%
- Indiana(Based on 774 reports) 69.0%
| # | Date | Location | Vehicles | Drunk persons | Fatalites | Persons | Pedestrians |
|---|
| 1 | May 16, 2018 04:40 AM | I-80 | 2 | - | 1
| 2 | - |
| 2 | Jul 30, 2018 02:14 AM | Grand Ave | 1 | 1
| 1 | 1 | - |
| 3 | Aug 25, 2018 05:50 PM | I-80 | 2 | - | 1
| 2 | - |
| 4 | Nov 5, 2018 11:00 AM | Hohman Ave | 5 | - | 1
| 1 | - |
| 5 | Dec 24, 2018 09:11 AM | Columbia Ave, Kenwood St | 2 | - | 1
| 2 | - |
| 6 | Dec 8, 2018 09:19 PM | I-90 | 1 | - | 1
| 1 | 1 |
| 7 | Dec 25, 2018 07:20 PM | I-80 | 1 | - | 1
| 1 | 1 |
Hammond fatal car crash and road traffic accident list for 2017
- Fatal accident count7
- Vehicles involved in fatal accidents12
- Fatal accidents involving drunk persons4
- Fatalities7
- Persons involved in fatal accidents17
- Pedestrians involved in fatal accidents2
Dark - Lighted
- Hammond(Based on 7 reports) 71.4%
- Lake County(Based on 49 reports) 34.7%
- Indiana(Based on 835 reports) 14.3%
Daylight
- Hammond(Based on 7 reports) 28.6%
- Lake County(Based on 49 reports) 36.7%
- Indiana(Based on 835 reports) 53.9%
Clear
- Hammond(Based on 7 reports) 100.0%
- Lake County(Based on 49 reports) 71.4%
- Indiana(Based on 836 reports) 71.5%
| # | Date | Location | Vehicles | Drunk persons | Fatalites | Persons | Pedestrians |
|---|
| 1 | Mar 18, 2017 02:52 AM | Us-41s, I-90 | 3 | 2
| 1 | 3 | - |
| 2 | Feb 15, 2017 04:41 PM | Gostlin, Columbia Ave | 2 | - | 1
| 4 | - |
| 3 | Apr 8, 2017 11:39 PM | Us-20 E | 2 | 1
| 1 | 5 | - |
| 4 | Jun 24, 2017 04:44 PM | Us-41n | 2 | - | 1
| 2 | - |
| 5 | Jul 1, 2017 09:06 PM | Columbia Ave | 1 | - | 1
| 1 | 1 |
| 6 | Aug 4, 2017 01:15 AM | I-94 | 1 | - | 1
| 1 | - |
| 7 | Sep 1, 2017 08:27 PM | Us-41n, Gostlin St | 1 | 1
| 1 | 1 | 1 |
Hammond fatal car crash and road traffic accident list for 2016
- Fatal accident count7
- Vehicles involved in fatal accidents13
- Fatal accidents involving drunk persons1
- Fatalities7
- Persons involved in fatal accidents25
- Pedestrians involved in fatal accidents2
Dark - Lighted
- Hammond(Based on 7 reports) 57.1%
- Lake County(Based on 48 reports) 33.3%
- Indiana(Based on 772 reports) 15.8%
Daylight
- Hammond(Based on 7 reports) 28.6%
- Lake County(Based on 48 reports) 43.8%
- Indiana(Based on 772 reports) 49.7%
Dark - Not Lighted
- Hammond(Based on 7 reports) 14.3%
- Lake County(Based on 48 reports) 18.8%
- Indiana(Based on 772 reports) 30.4%
Clear
- Hammond(Based on 7 reports) 71.4%
- Lake County(Based on 48 reports) 75.0%
- Indiana(Based on 770 reports) 67.1%
Unknown
- Hammond(Based on 7 reports) 28.6%
- Lake County(Based on 48 reports) 14.6%
- Indiana(Based on 770 reports) 20.9%
Hammond fatal car crash and road traffic accident list for 2015
- Fatal accident count5
- Vehicles involved in fatal accidents7
- Fatal accidents involving drunk persons1
- Fatalities5
- Persons involved in fatal accidents10
- Pedestrians involved in fatal accidents2
Daylight
- Hammond(Based on 5 reports) 40.0%
- Lake County(Based on 56 reports) 44.6%
- Indiana(Based on 748 reports) 51.9%
Dark - Lighted
- Hammond(Based on 5 reports) 40.0%
- Lake County(Based on 56 reports) 14.3%
- Indiana(Based on 748 reports) 4.4%
Dark - Not Lighted
- Hammond(Based on 5 reports) 20.0%
- Lake County(Based on 56 reports) 33.9%
- Indiana(Based on 748 reports) 39.3%
Clear
- Hammond(Based on 5 reports) 80.0%
- Lake County(Based on 56 reports) 78.6%
- Indiana(Based on 751 reports) 66.8%
Unknown
- Hammond(Based on 5 reports) 20.0%
- Lake County(Based on 56 reports) 14.3%
- Indiana(Based on 751 reports) 19.7%
Hammond fatal car crash and road traffic accident list for 2014
- Fatal accident count8
- Vehicles involved in fatal accidents12
- Fatalities8
- Persons involved in fatal accidents13
- Pedestrians involved in fatal accidents1
Daylight
- Hammond(Based on 8 reports) 50.0%
- Lake County(Based on 45 reports) 44.4%
- Indiana(Based on 703 reports) 51.2%
Dark - Not Lighted
- Hammond(Based on 8 reports) 50.0%
- Lake County(Based on 45 reports) 40.0%
- Indiana(Based on 703 reports) 38.8%
Clear
- Hammond(Based on 8 reports) 75.0%
- Lake County(Based on 45 reports) 75.6%
- Indiana(Based on 705 reports) 68.2%
Unknown
- Hammond(Based on 8 reports) 25.0%
- Lake County(Based on 45 reports) 17.8%
- Indiana(Based on 705 reports) 20.1%
| # | Date | Location | Vehicles | Drunk persons | Fatalites | Persons | Pedestrians |
|---|
| 1 | Jan 9, 2014 11:50 PM | I-90 | 1 | - | 1
| 2 | 1 |
| 2 | May 12, 2014 11:27 PM | I-80 | 2 | - | 1
| 2 | - |
| 3 | Jun 23, 2014 01:22 PM | Columbia Ave | 2 | - | 1
| 2 | - |
| 4 | Jul 8, 2014 09:09 PM | I-80 | 1 | - | 1
| 1 | - |
| 5 | Jul 20, 2014 08:51 AM | Us-41, Calumet Ave | 1 | - | 1
| 1 | - |
| 6 | Jul 24, 2014 06:16 PM | Us-41, Fayette St | 2 | - | 1
| 2 | - |
| 7 | Oct 17, 2014 06:08 PM | I-80 | 1 | - | 1
| 1 | - |
| 8 | Dec 30, 2014 11:12 AM | I-90 W | 2 | - | 1
| 2 | - |
Hammond fatal car crash and road traffic accident list for 2013
- Fatal accident count9
- Vehicles involved in fatal accidents14
- Fatal accidents involving drunk persons5
- Fatalities9
- Persons involved in fatal accidents24
- Pedestrians involved in fatal accidents2
Average EMS response time
- Hammond(Based on 8 reports) 11.6 mins
- Lake County(Based on 38 reports) 15.8 mins
- Indiana(Based on 670 reports) 9.6 mins
Dark - Not Lighted
- Hammond(Based on 9 reports) 55.6%
- Lake County(Based on 40 reports) 50.0%
- Indiana(Based on 709 reports) 38.8%
Daylight
- Hammond(Based on 9 reports) 22.2%
- Lake County(Based on 40 reports) 40.0%
- Indiana(Based on 709 reports) 51.2%
Dark - Lighted
- Hammond(Based on 9 reports) 11.1%
- Lake County(Based on 40 reports) 2.5%
- Indiana(Based on 709 reports) 3.8%
Dusk
- Hammond(Based on 9 reports) 11.1%
- Lake County(Based on 40 reports) 2.5%
- Indiana(Based on 709 reports) 2.7%
Clear
- Hammond(Based on 9 reports) 88.9%
- Lake County(Based on 40 reports) 62.5%
- Indiana(Based on 709 reports) 68.3%
Rain
- Hammond(Based on 9 reports) 11.1%
- Lake County(Based on 40 reports) 10.0%
- Indiana(Based on 709 reports) 6.3%
| # | Date | Location | Vehicles | Drunk persons | Fatalites | Persons | Pedestrians |
|---|
| 1 | May 9, 2013 01:39 AM | Sr-20 | 2 | 1
| 1 | 6 | - |
| 2 | Jul 13, 2013 02:36 AM | Us-41, 110th St | 2 | 1
| 1 | 2 | - |
| 3 | Aug 16, 2013 08:02 PM | Us-20 | 1 | 1
| 1 | 1 | - |
| 4 | Sep 1, 2013 12:25 AM | Us-41, 171st | 1 | - | 1
| 1 | 1 |
| 5 | Sep 12, 2013 07:05 PM | I-80 | 1 | - | 1
| 1 | 1 |
| 6 | Oct 19, 2013 08:40 PM | I-80 E | 2 | - | 1
| 3 | - |
| 7 | Oct 23, 2013 12:21 AM | Summer St | 2 | - | 1
| 3 | - |
| 8 | Sep 28, 2013 01:45 AM | I-80 | 1 | - | 1
| 1 | - |
| 9 | Nov 24, 2013 02:14 AM | Sheffield Ave | 2 | 2
| 1 | 6 | - |
Hammond fatal car crash and road traffic accident list for 2012
- Fatal accident count8
- Vehicles involved in fatal accidents16
- Fatal accidents involving drunk persons4
- Fatalities8
- Persons involved in fatal accidents24
- Pedestrians involved in fatal accidents1
Average EMS response time
- Hammond(Based on 8 reports) 6.6 mins
- Lake County(Based on 41 reports) 9.4 mins
- Indiana(Based on 679 reports) 8.0 mins
Daylight
- Hammond(Based on 8 reports) 50.0%
- Lake County(Based on 42 reports) 42.9%
- Indiana(Based on 720 reports) 52.1%
Dark - Not Lighted
- Hammond(Based on 8 reports) 37.5%
- Lake County(Based on 42 reports) 40.5%
- Indiana(Based on 720 reports) 37.8%
Dark - Lighted
- Hammond(Based on 8 reports) 12.5%
- Lake County(Based on 42 reports) 11.9%
- Indiana(Based on 720 reports) 5.6%
Clear
- Hammond(Based on 8 reports) 62.5%
- Lake County(Based on 42 reports) 81.0%
- Indiana(Based on 720 reports) 71.5%
Unknown
- Hammond(Based on 8 reports) 37.5%
- Lake County(Based on 42 reports) 14.3%
- Indiana(Based on 720 reports) 16.3%
| # | Date | Location | Vehicles | Drunk persons | Fatalites | Persons | Pedestrians |
|---|
| 1 | Mar 19, 2012 04:06 PM | Hohman Ave | 1 | - | 1
| 2 | - |
| 2 | May 8, 2012 06:15 PM | Sr-912 | 2 | 1
| 1 | 2 | - |
| 3 | Jun 10, 2012 01:49 PM | Columbia Ave | 2 | 1
| 1 | 5 | - |
| 4 | Sep 18, 2012 08:19 PM | I-80 Eb, Ramp B | 2 | - | 1
| 2 | - |
| 5 | Nov 11, 2012 02:35 AM | Columbia Ave, 165th Ave | 3 | 1
| 1 | 5 | - |
| 6 | Sep 22, 2012 04:34 AM | Sr-912 | 2 | - | 1
| 4 | 1 |
| 7 | Dec 18, 2012 06:37 PM | Us-20 W, Kennedy Ave | 2 | - | 1
| 2 | - |
| 8 | Dec 21, 2012 08:06 PM | Sr-312 | 2 | 1
| 1 | 2 | - |
Hammond fatal car crash and road traffic accident list for 2011
- Fatal accident count8
- Vehicles involved in fatal accidents14
- Fatal accidents involving drunk persons3
- Fatalities8
- Persons involved in fatal accidents13
- Pedestrians involved in fatal accidents3
Average EMS response time
- Hammond(Based on 8 reports) 4.3 mins
- Lake County(Based on 38 reports) 8.6 mins
- Indiana(Based on 634 reports) 9.2 mins
Daylight
- Hammond(Based on 8 reports) 37.5%
- Lake County(Based on 39 reports) 38.5%
- Indiana(Based on 674 reports) 53.0%
Dark - Lighted
- Hammond(Based on 8 reports) 25.0%
- Lake County(Based on 39 reports) 17.9%
- Indiana(Based on 674 reports) 5.2%
Dawn
- Hammond(Based on 8 reports) 25.0%
- Lake County(Based on 39 reports) 10.3%
- Indiana(Based on 674 reports) 2.4%
Dark - Not Lighted
- Hammond(Based on 8 reports) 12.5%
- Lake County(Based on 39 reports) 30.8%
- Indiana(Based on 674 reports) 36.5%
Clear
- Hammond(Based on 8 reports) 62.5%
- Lake County(Based on 39 reports) 69.2%
- Indiana(Based on 675 reports) 64.9%
Unknown
- Hammond(Based on 8 reports) 37.5%
- Lake County(Based on 39 reports) 25.6%
- Indiana(Based on 675 reports) 20.6%
Hammond fatal car crash and road traffic accident list for 2010
- Fatal accident count7
- Vehicles involved in fatal accidents11
- Fatal accidents involving drunk persons1
- Fatalities7
- Persons involved in fatal accidents15
- Pedestrians involved in fatal accidents1
Average EMS response time
- Hammond(Based on 6 reports) 8.2 mins
- Lake County(Based on 41 reports) 9.8 mins
- Indiana(Based on 659 reports) 8.0 mins
Daylight
- Hammond(Based on 7 reports) 71.4%
- Lake County(Based on 44 reports) 40.9%
- Indiana(Based on 701 reports) 53.6%
Dark - Not Lighted
- Hammond(Based on 7 reports) 14.3%
- Lake County(Based on 44 reports) 43.2%
- Indiana(Based on 701 reports) 36.2%
Dark - Lighted
- Hammond(Based on 7 reports) 14.3%
- Lake County(Based on 44 reports) 13.6%
- Indiana(Based on 701 reports) 6.0%
Clear
- Hammond(Based on 7 reports) 71.4%
- Lake County(Based on 44 reports) 72.7%
- Indiana(Based on 701 reports) 69.8%
Unknown
- Hammond(Based on 7 reports) 28.6%
- Lake County(Based on 44 reports) 15.9%
- Indiana(Based on 701 reports) 19.4%
Hammond fatal car crash and road traffic accident list for 2009
- Fatal accident count5
- Vehicles involved in fatal accidents6
- Fatal accidents involving drunk persons2
- Fatalities5
- Persons involved in fatal accidents9
- Pedestrians involved in fatal accidents1
Average EMS response time
- Hammond(Based on 5 reports) 8.2 mins
- Lake County(Based on 38 reports) 12.5 mins
- Indiana(Based on 596 reports) 8.9 mins
Dark - Not Lighted
- Hammond(Based on 5 reports) 40.0%
- Lake County(Based on 37 reports) 45.9%
- Indiana(Based on 631 reports) 39.1%
Daylight
- Hammond(Based on 5 reports) 40.0%
- Lake County(Based on 37 reports) 43.2%
- Indiana(Based on 631 reports) 51.7%
Dark - Lighted
- Hammond(Based on 5 reports) 20.0%
- Lake County(Based on 37 reports) 8.1%
- Indiana(Based on 631 reports) 5.2%
Clear
- Hammond(Based on 5 reports) 80.0%
- Lake County(Based on 38 reports) 86.8%
- Indiana(Based on 632 reports) 84.2%
Rain
- Hammond(Based on 5 reports) 20.0%
- Lake County(Based on 38 reports) 2.6%
- Indiana(Based on 632 reports) 8.2%
Hammond fatal car crash and road traffic accident list for 2008
- Fatal accident count6
- Vehicles involved in fatal accidents11
- Fatalities6
- Persons involved in fatal accidents14
Average EMS response time
- Hammond(Based on 6 reports) 12.3 mins
- Lake County(Based on 39 reports) 9.2 mins
- Indiana(Based on 681 reports) 8.3 mins
Daylight
- Hammond(Based on 6 reports) 83.3%
- Lake County(Based on 43 reports) 51.2%
- Indiana(Based on 721 reports) 52.8%
Dark - Not Lighted
- Hammond(Based on 6 reports) 16.7%
- Lake County(Based on 43 reports) 34.9%
- Indiana(Based on 721 reports) 40.5%
Clear
- Hammond(Based on 6 reports) 100.0%
- Lake County(Based on 43 reports) 95.3%
- Indiana(Based on 721 reports) 82.1%
| # | Date | Location | Vehicles | Drunk persons | Fatalites | Persons | Pedestrians |
|---|
| 1 | Feb 11, 2008 06:30 AM | I-80 | 2 | - | 1
| 2 | - |
| 2 | Feb 27, 2008 07:30 PM | I-90 | 1 | - | 1
| 1 | - |
| 3 | Apr 15, 2008 02:58 PM | Us-41, 129th Street | 3 | - | 1
| 5 | - |
| 4 | Jun 11, 2008 03:27 PM | Sheffield Ave, 143rd Ave | 2 | - | 1
| 3 | - |
| 5 | Aug 6, 2008 04:51 PM | Kennedy Ave, Janet Pl | 2 | - | 1
| 2 | - |
| 6 | Sep 24, 2008 11:05 AM | Kenwood St, Field St | 1 | - | 1
| 1 | - |
Hammond fatal car crash and road traffic accident list for 2007
- Fatal accident count17
- Vehicles involved in fatal accidents25
- Fatal accidents involving drunk persons7
- Fatalities21
- Persons involved in fatal accidents49
- Pedestrians involved in fatal accidents3
Average EMS response time
- Hammond(Based on 16 reports) 11.9 mins
- Lake County(Based on 44 reports) 10.6 mins
- Indiana(Based on 759 reports) 8.9 mins
Daylight
- Hammond(Based on 17 reports) 58.8%
- Lake County(Based on 46 reports) 50.0%
- Indiana(Based on 803 reports) 53.9%
Dark - Not Lighted
- Hammond(Based on 17 reports) 23.5%
- Lake County(Based on 46 reports) 32.6%
- Indiana(Based on 803 reports) 37.9%
Dawn
- Hammond(Based on 17 reports) 11.8%
- Lake County(Based on 46 reports) 6.5%
- Indiana(Based on 803 reports) 3.4%
Dark - Lighted
- Hammond(Based on 17 reports) 5.9%
- Lake County(Based on 46 reports) 10.9%
- Indiana(Based on 803 reports) 2.6%
Clear
- Hammond(Based on 17 reports) 82.4%
- Lake County(Based on 46 reports) 84.8%
- Indiana(Based on 804 reports) 88.1%
Rain
- Hammond(Based on 17 reports) 11.8%
- Lake County(Based on 46 reports) 8.7%
- Indiana(Based on 804 reports) 6.3%
Snow
- Hammond(Based on 17 reports) 5.9%
- Lake County(Based on 46 reports) 6.5%
- Indiana(Based on 804 reports) 3.9%
| # | Date | Location | Vehicles | Drunk persons | Fatalites | Persons | Pedestrians |
|---|
| 1 | Jan 29, 2007 04:08 AM | Sohl Ave | 2 | - | 1
| 1 | - |
| 2 | Mar 13, 2007 12:46 AM | Sheffield Ave, 131st | 2 | 1
| 1 | 2 | - |
| 3 | Apr 19, 2007 01:06 PM | Us-41, Casino Center Dr | 2 | - | 1
| 2 | - |
| 4 | Mar 29, 2007 08:15 AM | Sr-912, Calumet Ave | 1 | - | 1
| 1 | - |
| 5 | Jun 15, 2007 03:00 PM | Sr-912, Calumet Ave. | 1 | - | 1
| 2 | 1 |
| 6 | May 30, 2007 11:27 PM | 165th Street, Hohman | 2 | - | 1
| 5 | - |
| 7 | Jul 4, 2007 07:30 PM | I-90 | 2 | 1
| 1 | 2 | - |
| 8 | Aug 25, 2007 03:02 PM | Us-20, Kennedy Ave | 2 | 1
| 2 | 8 | - |
| 9 | Sep 1, 2007 09:49 AM | Johnson St, Hudson St | 1 | - | 3
| 5 | - |
| 10 | Sep 8, 2007 06:08 PM | Sr-912, Calumet - 5 | 1 | 1
| 1 | 1 | - |
| 11 | Sep 25, 2007 06:00 AM | I-90, 005 Ramp D | 1 | - | 1
| 1 | - |
| 12 | Oct 6, 2007 11:45 PM | I-80 | 1 | 1
| 1 | 1 | - |
| 13 | Oct 25, 2007 10:08 PM | Sr-41, Carroll Ave | 1 | - | 1
| 2 | 1 |
| 14 | Nov 14, 2007 03:52 AM | Michigan, Cline Ave | 2 | 1
| 1 | 3 | - |
| 15 | Nov 18, 2007 06:55 AM | I-80 | 1 | 1
| 2 | 2 | - |
| 16 | Dec 5, 2007 12:41 AM | 165th Street | 1 | - | 1
| 8 | 1 |
| 17 | Jul 17, 2007 04:45 PM | Kennedy, Cleveland | 2 | - | 1
| 3 | - |
Hammond fatal car crash and road traffic accident list for 2006
- Fatal accident count7
- Vehicles involved in fatal accidents11
- Fatal accidents involving drunk persons3
- Fatalities7
- Persons involved in fatal accidents15
- Pedestrians involved in fatal accidents1
Average EMS response time
- Hammond(Based on 7 reports) 5.6 mins
- Lake County(Based on 43 reports) 8.6 mins
- Indiana(Based on 773 reports) 8.7 mins
Daylight
- Hammond(Based on 7 reports) 57.1%
- Lake County(Based on 46 reports) 43.5%
- Indiana(Based on 820 reports) 49.6%
Dark - Not Lighted
- Hammond(Based on 7 reports) 28.6%
- Lake County(Based on 46 reports) 50.0%
- Indiana(Based on 820 reports) 45.6%
Dawn
- Hammond(Based on 7 reports) 14.3%
- Lake County(Based on 46 reports) 4.3%
- Indiana(Based on 820 reports) 1.8%
Clear
- Hammond(Based on 7 reports) 85.7%
- Lake County(Based on 46 reports) 89.1%
- Indiana(Based on 820 reports) 88.3%
Rain
- Hammond(Based on 7 reports) 14.3%
- Lake County(Based on 46 reports) 8.7%
- Indiana(Based on 820 reports) 8.3%
| # | Date | Location | Vehicles | Drunk persons | Fatalites | Persons | Pedestrians |
|---|
| 1 | Feb 10, 2006 05:01 AM | Us-12, Myrtle St | 3 | - | 1
| 1 | - |
| 2 | Feb 24, 2006 09:43 PM | Us-12, 110th St | 1 | - | 1
| 1 | - |
| 3 | Mar 26, 2006 05:01 AM | I-94 | 1 | 1
| 1 | 2 | - |
| 4 | Apr 20, 2006 11:01 AM | Calumet Ave, River Dr | 3 | - | 1
| 3 | - |
| 5 | Apr 3, 2006 01:10 AM | Kennedy Ave, 169th St | 1 | 1
| 1 | 1 | - |
| 6 | Jun 18, 2006 01:57 PM | Michigan St, Madden St | 1 | - | 1
| 2 | 1 |
| 7 | Oct 6, 2006 04:02 AM | Us-41, State Line Ave | 1 | 1
| 1 | 5 | - |
Hammond fatal car crash and road traffic accident list for 2005
- Fatal accident count5
- Vehicles involved in fatal accidents8
- Fatal accidents involving drunk persons3
- Fatalities5
- Persons involved in fatal accidents10
Average EMS response time
- Hammond(Based on 4 reports) 9.8 mins
- Lake County(Based on 52 reports) 9.1 mins
- Indiana(Based on 810 reports) 8.8 mins
Dark - Not Lighted
- Hammond(Based on 5 reports) 60.0%
- Lake County(Based on 56 reports) 51.8%
- Indiana(Based on 855 reports) 42.8%
Daylight
- Hammond(Based on 5 reports) 40.0%
- Lake County(Based on 56 reports) 48.2%
- Indiana(Based on 855 reports) 53.2%
Clear
- Hammond(Based on 5 reports) 100.0%
- Lake County(Based on 56 reports) 91.1%
- Indiana(Based on 855 reports) 87.7%
Hammond fatal car crash and road traffic accident list for 2004
- Fatal accident count10
- Vehicles involved in fatal accidents19
- Fatal accidents involving drunk persons3
- Fatalities10
- Persons involved in fatal accidents27
- Pedestrians involved in fatal accidents2
Average EMS response time
- Hammond(Based on 10 reports) 8.8 mins
- Lake County(Based on 50 reports) 7.1 mins
- Indiana(Based on 800 reports) 8.2 mins
Daylight
- Hammond(Based on 10 reports) 50.0%
- Lake County(Based on 55 reports) 36.4%
- Indiana(Based on 853 reports) 50.9%
Dark - Not Lighted
- Hammond(Based on 10 reports) 40.0%
- Lake County(Based on 55 reports) 54.5%
- Indiana(Based on 853 reports) 44.0%
Dusk
- Hammond(Based on 10 reports) 10.0%
- Lake County(Based on 55 reports) 3.6%
- Indiana(Based on 853 reports) 2.0%
Clear
- Hammond(Based on 10 reports) 80.0%
- Lake County(Based on 55 reports) 80.0%
- Indiana(Based on 857 reports) 84.5%
Rain
- Hammond(Based on 10 reports) 20.0%
- Lake County(Based on 55 reports) 12.7%
- Indiana(Based on 857 reports) 10.3%
| # | Date | Location | Vehicles | Drunk persons | Fatalites | Persons | Pedestrians |
|---|
| 1 | Jan 30, 2004 09:58 AM | I-80 | 2 | - | 1
| 2 | - |
| 2 | Feb 5, 2004 10:42 AM | I-80 | 2 | - | 1
| 5 | - |
| 3 | Jul 10, 2004 03:52 AM | I-80 | 1 | - | 1
| 1 | - |
| 4 | Jun 26, 2004 07:42 PM | 177th St | 2 | - | 1
| 2 | - |
| 5 | Aug 21, 2004 03:27 PM | 169th St, Kansas Ave | 2 | 1
| 1 | 3 | - |
| 6 | Oct 12, 2004 07:55 AM | Sr-912 | 1 | - | 1
| 1 | - |
| 7 | Nov 22, 2004 10:10 PM | I-80 | 3 | - | 1
| 3 | 1 |
| 8 | Oct 31, 2004 10:18 AM | Us-41, Michigan St | 4 | 1
| 1 | 6 | - |
| 9 | Nov 30, 2004 07:17 PM | 169th St, Woodmar Ave | 1 | - | 1
| 2 | 1 |
| 10 | Dec 24, 2004 01:16 AM | Gostlin St | 1 | 1
| 1 | 2 | - |
Hammond fatal car crash and road traffic accident list for 2003
- Fatal accident count14
- Vehicles involved in fatal accidents18
- Fatal accidents involving drunk persons2
- Fatalities14
- Persons involved in fatal accidents41
- Pedestrians involved in fatal accidents4
Average EMS response time
- Hammond(Based on 14 reports) 8.0 mins
- Lake County(Based on 41 reports) 9.8 mins
- Indiana(Based on 530 reports) 8.0 mins
Daylight
- Hammond(Based on 14 reports) 50.0%
- Lake County(Based on 53 reports) 50.9%
- Indiana(Based on 753 reports) 56.0%
Dark - Not Lighted
- Hammond(Based on 14 reports) 35.7%
- Lake County(Based on 53 reports) 30.2%
- Indiana(Based on 753 reports) 36.7%
Dark - Lighted
- Hammond(Based on 14 reports) 14.3%
- Lake County(Based on 53 reports) 13.2%
- Indiana(Based on 753 reports) 2.8%
Clear
- Hammond(Based on 14 reports) 78.6%
- Lake County(Based on 53 reports) 88.7%
- Indiana(Based on 753 reports) 82.3%
Rain
- Hammond(Based on 14 reports) 21.4%
- Lake County(Based on 53 reports) 7.5%
- Indiana(Based on 753 reports) 8.6%
| # | Date | Location | Vehicles | Drunk persons | Fatalites | Persons | Pedestrians |
|---|
| 1 | May 18, 2003 02:44 PM | Sr-312 | 2 | - | 1
| 6 | - |
| 2 | Jun 30, 2003 12:55 AM | I-90 | 1 | - | 1
| 2 | - |
| 3 | Jul 30, 2003 03:44 PM | Michigan St | 1 | - | 1
| 1 | - |
| 4 | Aug 3, 2003 12:55 AM | Indianapolis Blvd | 2 | - | 1
| 4 | - |
| 5 | Aug 21, 2003 03:16 AM | Johnson Ave | 1 | - | 1
| 2 | - |
| 6 | Sep 20, 2003 00:40 AM | I-80 | 1 | - | 1
| 1 | - |
| 7 | Sep 22, 2003 04:28 AM | Hohman Ave | 1 | - | 1
| 3 | 1 |
| 8 | Oct 1, 2003 03:25 AM | I-80 | 1 | - | 1
| 1 | - |
| 9 | Sep 22, 2003 01:59 AM | 165th Ave | 1 | 1
| 1 | 4 | - |
| 10 | Nov 7, 2003 04:20 PM | Sr-312 | 1 | - | 1
| 2 | 1 |
| 11 | Aug 8, 2003 02:05 PM | 5th St | 2 | - | 1
| 4 | - |
| 12 | Nov 15, 2003 12:44 AM | I-80 | 2 | - | 1
| 6 | - |
| 13 | Aug 18, 2003 09:03 PM | Us-41 | 1 | - | 1
| 3 | 1 |
| 14 | Nov 21, 2003 12:00 PM | Northcote Ave | 1 | 1
| 1 | 2 | 1 |
Hammond fatal car crash and road traffic accident list for 2002
- Fatal accident count10
- Vehicles involved in fatal accidents17
- Fatal accidents involving drunk persons5
- Fatalities10
- Persons involved in fatal accidents20
- Pedestrians involved in fatal accidents3
Dark - Lighted
- Hammond(Based on 10 reports) 60.0%
- Lake County(Based on 51 reports) 31.4%
- Indiana(Based on 709 reports) 10.2%
Daylight
- Hammond(Based on 10 reports) 30.0%
- Lake County(Based on 51 reports) 41.2%
- Indiana(Based on 709 reports) 51.9%
Dark - Not Lighted
- Hammond(Based on 10 reports) 10.0%
- Lake County(Based on 51 reports) 25.5%
- Indiana(Based on 709 reports) 32.2%
Clear
- Hammond(Based on 10 reports) 100.0%
- Lake County(Based on 51 reports) 90.2%
- Indiana(Based on 714 reports) 87.7%
| # | Date | Location | Vehicles | Drunk persons | Fatalites | Persons | Pedestrians |
|---|
| 1 | Mar 27, 2002 03:05 AM | I-80 | 3 | 1
| 1 | 4 | - |
| 2 | Jul 7, 2002 08:57 PM | 165 Street | 1 | - | 1
| 1 | - |
| 3 | Jul 16, 2002 01:16 AM | 165 Street | 1 | 1
| 1 | 1 | - |
| 4 | Aug 3, 2002 06:13 AM | I-80 | 2 | - | 1
| 2 | - |
| 5 | Sep 5, 2002 03:21 PM | Hohman Ave | 2 | - | 1
| 2 | - |
| 6 | Sep 27, 2002 05:17 AM | Sheffield Ave | 1 | 1
| 1 | 1 | - |
| 7 | Sep 24, 2002 07:51 AM | I-80 | 3 | - | 1
| 3 | - |
| 8 | Oct 31, 2002 10:05 PM | Sheffield Ave | 1 | 1
| 1 | 1 | - |
| 9 | Nov 17, 2002 08:35 PM | 165th St | 1 | - | 1
| 2 | 1 |
| 10 | Dec 5, 2002 11:21 PM | I-80 | 2 | 1
| 1 | 3 | 2 |
Hammond fatal car crash and road traffic accident list for 2001
- Fatal accident count9
- Vehicles involved in fatal accidents20
- Fatal accidents involving drunk persons2
- Fatalities10
- Persons involved in fatal accidents30
- Pedestrians involved in fatal accidents1
Daylight
- Hammond(Based on 9 reports) 55.6%
- Lake County(Based on 55 reports) 45.5%
- Indiana(Based on 825 reports) 57.3%
Dark - Lighted
- Hammond(Based on 9 reports) 44.4%
- Lake County(Based on 55 reports) 32.7%
- Indiana(Based on 825 reports) 10.8%
Clear
- Hammond(Based on 9 reports) 100.0%
- Lake County(Based on 55 reports) 89.1%
- Indiana(Based on 825 reports) 85.1%
| # | Date | Location | Vehicles | Drunk persons | Fatalites | Persons | Pedestrians |
|---|
| 1 | Apr 14, 2001 12:24 AM | Us-41 | 2 | - | 1
| 2 | - |
| 2 | Apr 14, 2001 10:33 AM | Sr-312 | 1 | - | 1
| 2 | 1 |
| 3 | May 25, 2001 01:55 AM | I-80 | 4 | - | 1
| 10 | - |
| 4 | Jun 29, 2001 11:56 PM | Tapper Ave | 2 | 2
| 2 | 4 | - |
| 5 | May 14, 2001 09:30 PM | 179th Street | 1 | - | 1
| 2 | - |
| 6 | Aug 17, 2001 01:00 PM | Calumet Ave | 2 | - | 1
| 2 | - |
| 7 | Aug 18, 2001 01:25 AM | I-80 | 5 | - | 1
| 5 | - |
| 8 | Oct 20, 2001 09:33 AM | State Street | 1 | - | 1
| 1 | - |
| 9 | Nov 1, 2001 01:18 PM | Michigan Street | 2 | - | 1
| 2 | - |
Hammond fatal car crash and road traffic accident list for 2000
- Fatal accident count14
- Vehicles involved in fatal accidents19
- Fatal accidents involving drunk persons9
- Fatalities15
- Persons involved in fatal accidents42
- Pedestrians involved in fatal accidents3
Dark - Lighted
- Hammond(Based on 14 reports) 50.0%
- Lake County(Based on 54 reports) 35.2%
- Indiana(Based on 790 reports) 13.5%
Daylight
- Hammond(Based on 14 reports) 35.7%
- Lake County(Based on 54 reports) 50.0%
- Indiana(Based on 790 reports) 56.1%
Dark - Not Lighted
- Hammond(Based on 14 reports) 14.3%
- Lake County(Based on 54 reports) 13.0%
- Indiana(Based on 790 reports) 27.5%
Clear
- Hammond(Based on 14 reports) 85.7%
- Lake County(Based on 54 reports) 87.0%
- Indiana(Based on 793 reports) 85.0%
Rain
- Hammond(Based on 14 reports) 7.1%
- Lake County(Based on 54 reports) 7.4%
- Indiana(Based on 793 reports) 8.4%
Snow
- Hammond(Based on 14 reports) 7.1%
- Lake County(Based on 54 reports) 5.6%
- Indiana(Based on 793 reports) 3.8%
| # | Date | Location | Vehicles | Drunk persons | Fatalites | Persons | Pedestrians |
|---|
| 1 | Feb 4, 2000 02:22 AM | Us-41 | 1 | 1
| 1 | 1 | - |
| 2 | Feb 17, 2000 07:06 PM | Wilow Ct | 1 | 1
| 1 | 1 | - |
| 3 | Apr 21, 2000 05:08 PM | 169th Street | 2 | - | 1
| 2 | - |
| 4 | May 12, 2000 10:55 PM | I-90 | 1 | 1
| 1 | 2 | - |
| 5 | Jul 3, 2000 87:99 PM | I-90 | 1 | 1
| 1 | 1 | - |
| 6 | Jul 30, 2000 11:59 PM | Michigan Street | 1 | 1
| 1 | 2 | 1 |
| 7 | Jul 31, 2000 04:16 AM | I-80 Eb | 1 | - | 2
| 13 | - |
| 8 | Aug 16, 2000 00:49 AM | Hohman Ave | 2 | 2
| 1 | 4 | - |
| 9 | Aug 3, 2000 05:30 PM | 173rd Street | 2 | - | 1
| 3 | - |
| 10 | Sep 2, 2000 10:38 AM | May St | 1 | - | 1
| 2 | 1 |
| 11 | Sep 17, 2000 03:12 PM | Gostlin St | 1 | 1
| 1 | 1 | - |
| 12 | Sep 18, 2000 03:06 PM | I-80 | 1 | - | 1
| 4 | 1 |
| 13 | Oct 24, 2000 07:30 PM | 169th St | 2 | - | 1
| 4 | - |
| 14 | Nov 12, 2000 11:40 PM | I-80 | 2 | 1
| 1 | 2 | - |
Hammond fatal car crash and road traffic accident list for 1999
- Fatal accident count5
- Vehicles involved in fatal accidents7
- Fatal accidents involving drunk persons1
- Fatalities7
- Persons involved in fatal accidents14
- Pedestrians involved in fatal accidents5
Daylight
- Hammond(Based on 5 reports) 80.0%
- Lake County(Based on 51 reports) 52.9%
- Indiana(Based on 891 reports) 55.6%
Dark - Lighted
- Hammond(Based on 5 reports) 20.0%
- Lake County(Based on 51 reports) 23.5%
- Indiana(Based on 891 reports) 10.9%
Clear
- Hammond(Based on 5 reports) 80.0%
- Lake County(Based on 51 reports) 90.2%
- Indiana(Based on 892 reports) 87.7%
Snow
- Hammond(Based on 5 reports) 20.0%
- Lake County(Based on 51 reports) 2.0%
- Indiana(Based on 892 reports) 2.7%
| # | Date | Location | Vehicles | Drunk persons | Fatalites | Persons | Pedestrians |
|---|
| 1 | Jan 3, 1999 09:25 AM | I-80/94 | 1 | - | 1
| 2 | 1 |
| 2 | Feb 13, 1999 10:22 PM | Lyman Ave | 1 | 1
| 2 | 2 | - |
| 3 | Jul 3, 1999 08:52 AM | State Street | 2 | - | 1
| 2 | - |
| 4 | Nov 7, 1999 08:12 AM | Stateline Ave | 1 | - | 1
| 5 | 4 |
| 5 | Nov 12, 1999 12:28 AM | 165th St | 2 | - | 2
| 3 | - |
Hammond fatal car crash and road traffic accident list for 1998
- Fatal accident count9
- Vehicles involved in fatal accidents19
- Fatal accidents involving drunk persons8
- Fatalities10
- Persons involved in fatal accidents28
- Pedestrians involved in fatal accidents2
Dark - Lighted
- Hammond(Based on 9 reports) 77.8%
- Lake County(Based on 67 reports) 40.3%
- Indiana(Based on 883 reports) 11.9%
Daylight
- Hammond(Based on 9 reports) 22.2%
- Lake County(Based on 67 reports) 34.3%
- Indiana(Based on 883 reports) 49.7%
Clear
- Hammond(Based on 9 reports) 66.7%
- Lake County(Based on 67 reports) 86.6%
- Indiana(Based on 884 reports) 86.3%
Rain
- Hammond(Based on 9 reports) 22.2%
- Lake County(Based on 67 reports) 9.0%
- Indiana(Based on 884 reports) 9.3%
Fog, Smog, Smoke
- Hammond(Based on 9 reports) 11.1%
- Lake County(Based on 67 reports) 1.5%
- Indiana(Based on 884 reports) 1.7%
| # | Date | Location | Vehicles | Drunk persons | Fatalites | Persons | Pedestrians |
|---|
| 1 | Feb 6, 1998 09:30 PM | I-80 | 3 | 1
| 1 | 5 | - |
| 2 | Feb 8, 1998 01:40 AM | Grand Ave | 1 | - | 2
| 2 | - |
| 3 | Feb 10, 1998 02:02 AM | I-80 | 3 | - | 1
| 4 | 1 |
| 4 | Mar 31, 1998 07:50 AM | Us-41 | 2 | 2
| 1 | 2 | - |
| 5 | Apr 9, 1998 04:24 PM | 165th St | 2 | 2
| 1 | 3 | - |
| 6 | Sep 2, 1998 08:54 PM | Kennedy Avenue | 1 | - | 1
| 2 | 1 |
| 7 | Sep 26, 1998 03:34 AM | Us-41 | 2 | 1
| 1 | 3 | - |
| 8 | Sep 28, 1998 08:35 PM | I-80 | 2 | - | 1
| 2 | - |
| 9 | Oct 9, 1998 10:56 PM | Us-20 | 3 | 2
| 1 | 5 | - |
Hammond fatal car crash and road traffic accident list for 1997
- Fatal accident count11
- Vehicles involved in fatal accidents18
- Fatal accidents involving drunk persons2
- Fatalities11
- Persons involved in fatal accidents28
- Pedestrians involved in fatal accidents4
Average EMS response time
- Hammond(Based on 8 reports) 6.6 mins
- Lake County(Based on 42 reports) 6.4 mins
- Indiana(Based on 563 reports) 7.9 mins
Average hospital transport time
- Hammond(Based on 7 reports) 23.1 mins
- Lake County(Based on 33 reports) 38.4 mins
- Indiana(Based on 399 reports) 38.8 mins
Dark - Lighted
- Hammond(Based on 11 reports) 45.5%
- Lake County(Based on 60 reports) 33.3%
- Indiana(Based on 843 reports) 13.3%
Daylight
- Hammond(Based on 11 reports) 36.4%
- Lake County(Based on 60 reports) 41.7%
- Indiana(Based on 843 reports) 52.6%
Dark - Not Lighted
- Hammond(Based on 11 reports) 18.2%
- Lake County(Based on 60 reports) 21.7%
- Indiana(Based on 843 reports) 30.2%
Clear
- Hammond(Based on 11 reports) 100.0%
- Lake County(Based on 60 reports) 86.7%
- Indiana(Based on 846 reports) 82.3%
| # | Date | Location | Vehicles | Drunk persons | Fatalites | Persons | Pedestrians |
|---|
| 1 | Jan 28, 1997 00:38 AM | Douglas St | 1 | - | 1
| 2 | 1 |
| 2 | Mar 15, 1997 07:16 PM | 20 | 2 | - | 1
| 3 | - |
| 3 | May 24, 1997 04:44 AM | 20 | 1 | - | 1
| 2 | 1 |
| 4 | May 24, 1997 10:53 AM | Southeaste | 2 | - | 1
| 5 | - |
| 5 | Jun 30, 1997 02:29 AM | Sheffield | 1 | 1
| 1 | 2 | - |
| 6 | Jul 17, 1997 05:54 PM | 12 | 2 | - | 1
| 2 | - |
| 7 | Aug 15, 1997 00:01 AM | 41 | 1 | - | 1
| 2 | 1 |
| 8 | Sep 27, 1997 03:34 PM | Kennedy Av | 3 | - | 1
| 3 | - |
| 9 | Oct 4, 1997 01:10 AM | 20 | 1 | 1
| 1 | 1 | - |
| 10 | Dec 5, 1997 01:14 PM | 41 | 3 | - | 1
| 4 | - |
| 11 | Dec 27, 1997 05:44 PM | Calumet Av | 1 | - | 1
| 2 | 1 |
Hammond fatal car crash and road traffic accident list for 1996
- Fatal accident count12
- Vehicles involved in fatal accidents18
- Fatal accidents involving drunk persons7
- Fatalities15
- Persons involved in fatal accidents34
Average EMS response time
- Hammond(Based on 10 reports) 5.9 mins
- Lake County(Based on 32 reports) 6.1 mins
- Indiana(Based on 602 reports) 9.1 mins
Average hospital transport time
- Hammond(Based on 9 reports) 24.3 mins
- Lake County(Based on 28 reports) 26.5 mins
- Indiana(Based on 432 reports) 34.6 mins
Dark - Lighted
- Hammond(Based on 12 reports) 58.3%
- Lake County(Based on 56 reports) 41.1%
- Indiana(Based on 869 reports) 13.0%
Daylight
- Hammond(Based on 12 reports) 33.3%
- Lake County(Based on 56 reports) 41.1%
- Indiana(Based on 869 reports) 53.7%
Dusk
- Hammond(Based on 12 reports) 8.3%
- Lake County(Based on 56 reports) 1.8%
- Indiana(Based on 869 reports) 2.0%
Clear
- Hammond(Based on 12 reports) 91.7%
- Lake County(Based on 56 reports) 82.1%
- Indiana(Based on 872 reports) 84.1%
Rain
- Hammond(Based on 12 reports) 8.3%
- Lake County(Based on 56 reports) 3.6%
- Indiana(Based on 872 reports) 7.3%
| # | Date | Location | Vehicles | Drunk persons | Fatalites | Persons | Pedestrians |
|---|
| 1 | Jan 14, 1996 00:02 AM | 41 | 3 | 1
| 2 | 6 | - |
| 2 | Jan 29, 1996 12:30 AM | I80 | 2 | - | 1
| 4 | - |
| 3 | Apr 12, 1996 11:13 AM | 165th St | 3 | - | 1
| 7 | - |
| 4 | May 3, 1996 01:10 AM | Kennedy Av | 1 | 1
| 1 | 1 | - |
| 5 | Jul 21, 1996 02:12 PM | Sheffield | 1 | - | 1
| 1 | - |
| 6 | Aug 21, 1996 00:16 AM | I90 | 1 | 1
| 1 | 1 | - |
| 7 | Aug 25, 1996 10:51 PM | Michigan | 2 | 2
| 1 | 4 | - |
| 8 | Oct 22, 1996 04:40 PM | I90 | 1 | - | 3
| 4 | - |
| 9 | Nov 24, 1996 03:00 AM | 312 | 1 | - | 1
| 1 | - |
| 10 | Dec 17, 1996 01:42 AM | Hohman | 1 | 1
| 1 | 2 | - |
| 11 | Dec 26, 1996 00:05 AM | Columbia | 1 | 1
| 1 | 2 | - |
| 12 | Dec 20, 1996 10:47 PM | I80 | 1 | - | 1
| 1 | - |
Hammond fatal car crash and road traffic accident list for 1995
- Fatal accident count9
- Vehicles involved in fatal accidents16
- Fatal accidents involving drunk persons2
- Fatalities9
- Persons involved in fatal accidents24
- Pedestrians involved in fatal accidents3
Average EMS response time
- Hammond(Based on 9 reports) 4.9 mins
- Lake County(Based on 33 reports) 6.4 mins
- Indiana(Based on 630 reports) 8.9 mins
Average hospital transport time
- Hammond(Based on 7 reports) 56.7 mins
- Lake County(Based on 23 reports) 36.3 mins
- Indiana(Based on 483 reports) 37.0 mins
Daylight
- Hammond(Based on 9 reports) 55.6%
- Lake County(Based on 60 reports) 43.3%
- Indiana(Based on 858 reports) 53.4%
Dark - Lighted
- Hammond(Based on 9 reports) 44.4%
- Lake County(Based on 60 reports) 26.7%
- Indiana(Based on 858 reports) 11.5%
Clear
- Hammond(Based on 9 reports) 88.9%
- Lake County(Based on 61 reports) 82.0%
- Indiana(Based on 860 reports) 84.1%
Snow
- Hammond(Based on 9 reports) 11.1%
- Lake County(Based on 61 reports) 3.3%
- Indiana(Based on 860 reports) 4.9%
| # | Date | Location | Vehicles | Drunk persons | Fatalites | Persons | Pedestrians |
|---|
| 1 | Feb 18, 1995 11:59 PM | 41 | 1 | - | 1
| 3 | 2 |
| 2 | May 5, 1995 06:43 AM | 41 | 2 | 1
| 1 | 2 | - |
| 3 | Aug 3, 1995 03:25 PM | River Driv | 2 | - | 1
| 4 | - |
| 4 | Aug 22, 1995 02:40 PM | Sheffield | 1 | - | 1
| 1 | - |
| 5 | Sep 2, 1995 01:55 AM | I80 | 1 | 1
| 1 | 2 | - |
| 6 | Nov 9, 1995 03:50 PM | 165th St | 3 | - | 1
| 3 | - |
| 7 | Nov 11, 1995 10:20 AM | I80 | 2 | - | 1
| 3 | - |
| 8 | Nov 19, 1995 01:33 AM | Calumet Av | 2 | - | 1
| 3 | - |
| 9 | Dec 7, 1995 07:16 PM | Kennedy Av | 2 | - | 1
| 3 | 1 |
Hammond fatal car crash and road traffic accident list for 1994
- Fatal accident count11
- Vehicles involved in fatal accidents19
- Fatal accidents involving drunk persons4
- Fatalities12
- Persons involved in fatal accidents34
- Pedestrians involved in fatal accidents2
Average EMS response time
- Hammond(Based on 11 reports) 6.4 mins
- Lake County(Based on 39 reports) 6.5 mins
- Indiana(Based on 562 reports) 9.2 mins
Average hospital transport time
- Hammond(Based on 9 reports) 24.7 mins
- Lake County(Based on 31 reports) 46.8 mins
- Indiana(Based on 427 reports) 37.6 mins
Daylight
- Hammond(Based on 11 reports) 54.5%
- Lake County(Based on 70 reports) 41.4%
- Indiana(Based on 869 reports) 52.8%
Dark - Lighted
- Hammond(Based on 11 reports) 36.4%
- Lake County(Based on 70 reports) 35.7%
- Indiana(Based on 869 reports) 10.7%
Dark - Not Lighted
- Hammond(Based on 11 reports) 9.1%
- Lake County(Based on 70 reports) 18.6%
- Indiana(Based on 869 reports) 31.3%
Clear
- Hammond(Based on 11 reports) 90.9%
- Lake County(Based on 70 reports) 87.1%
- Indiana(Based on 869 reports) 87.1%
Rain
- Hammond(Based on 11 reports) 9.1%
- Lake County(Based on 70 reports) 7.1%
- Indiana(Based on 869 reports) 8.6%
| # | Date | Location | Vehicles | Drunk persons | Fatalites | Persons | Pedestrians |
|---|
| 1 | Jan 1, 1994 03:37 PM | 165th St | 2 | - | 1
| 4 | - |
| 2 | Jan 17, 1994 10:50 AM | I80 | 1 | - | 1
| 1 | - |
| 3 | Feb 12, 1994 07:55 PM | I80 | 3 | 1
| 2 | 7 | - |
| 4 | Mar 5, 1994 00:48 AM | 169th St | 1 | 1
| 1 | 1 | - |
| 5 | Mar 29, 1994 07:48 AM | Michigan | 3 | 1
| 1 | 6 | - |
| 6 | Jun 18, 1994 11:55 AM | I80 | 2 | - | 1
| 4 | - |
| 7 | Jun 18, 1994 09:45 PM | Hohman Dr | 1 | - | 1
| 2 | 1 |
| 8 | Jun 5, 1994 10:15 PM | Calumet Av | 1 | 1
| 1 | 1 | - |
| 9 | Jul 18, 1994 02:48 PM | 41 | 2 | - | 1
| 2 | - |
| 10 | Nov 20, 1994 00:06 AM | 20 | 2 | - | 1
| 4 | - |
| 11 | Oct 10, 1994 12:14 AM | 312 | 1 | - | 1
| 2 | 1 |
Hammond fatal car crash and road traffic accident list for 1993
- Fatal accident count9
- Vehicles involved in fatal accidents13
- Fatal accidents involving drunk persons5
- Fatalities9
- Persons involved in fatal accidents18
- Pedestrians involved in fatal accidents2
Average EMS response time
- Hammond(Based on 8 reports) 6.1 mins
- Lake County(Based on 37 reports) 5.9 mins
- Indiana(Based on 638 reports) 8.4 mins
Average hospital transport time
- Hammond(Based on 6 reports) 91.2 mins
- Lake County(Based on 26 reports) 61.0 mins
- Indiana(Based on 494 reports) 38.0 mins
Dark - Lighted
- Hammond(Based on 9 reports) 44.4%
- Lake County(Based on 55 reports) 29.1%
- Indiana(Based on 791 reports) 10.9%
Dark - Not Lighted
- Hammond(Based on 9 reports) 33.3%
- Lake County(Based on 55 reports) 30.9%
- Indiana(Based on 791 reports) 30.3%
Dawn
- Hammond(Based on 9 reports) 11.1%
- Lake County(Based on 55 reports) 3.6%
- Indiana(Based on 791 reports) 2.8%
Daylight
- Hammond(Based on 9 reports) 11.1%
- Lake County(Based on 55 reports) 34.5%
- Indiana(Based on 791 reports) 53.1%
Clear
- Hammond(Based on 9 reports) 88.9%
- Lake County(Based on 55 reports) 83.6%
- Indiana(Based on 791 reports) 81.9%
Sleet or Hail
- Hammond(Based on 9 reports) 11.1%
- Lake County(Based on 55 reports) 3.6%
- Indiana(Based on 791 reports) 1.5%
| # | Date | Location | Vehicles | Drunk persons | Fatalites | Persons | Pedestrians |
|---|
| 1 | Jan 12, 1993 11:50 PM | 41 | 1 | 1
| 1 | 1 | - |
| 2 | Mar 13, 1993 10:51 PM | I90 | 2 | 1
| 1 | 2 | - |
| 3 | Apr 5, 1993 02:06 AM | 20 | 2 | 1
| 1 | 2 | - |
| 4 | Apr 3, 1993 08:08 PM | Chicago St | 2 | - | 1
| 5 | 1 |
| 5 | Jun 26, 1993 11:14 PM | Kennedy Av | 1 | 1
| 1 | 1 | - |
| 6 | Jul 9, 1993 05:52 AM | Alley | 1 | - | 1
| 2 | 1 |
| 7 | Sep 25, 1993 06:00 AM | I80 | 2 | - | 1
| 2 | - |
| 8 | Nov 23, 1993 01:08 AM | New York | 1 | 1
| 1 | 2 | - |
| 9 | Dec 7, 1993 09:14 PM | Osborn Ave | 1 | - | 1
| 1 | - |
Hammond fatal car crash and road traffic accident list for 1992
- Fatal accident count13
- Vehicles involved in fatal accidents19
- Fatal accidents involving drunk persons9
- Fatalities18
- Persons involved in fatal accidents41
- Pedestrians involved in fatal accidents1
Average EMS response time
- Hammond(Based on 13 reports) 5.7 mins
- Lake County(Based on 57 reports) 5.9 mins
- Indiana(Based on 724 reports) 8.2 mins
Average hospital transport time
- Hammond(Based on 10 reports) 23.6 mins
- Lake County(Based on 45 reports) 37.3 mins
- Indiana(Based on 570 reports) 41.7 mins
Dark - Lighted
- Hammond(Based on 13 reports) 53.8%
- Lake County(Based on 59 reports) 35.6%
- Indiana(Based on 796 reports) 12.4%
Daylight
- Hammond(Based on 13 reports) 38.5%
- Lake County(Based on 59 reports) 30.5%
- Indiana(Based on 796 reports) 48.7%
Dark - Not Lighted
- Hammond(Based on 13 reports) 7.7%
- Lake County(Based on 59 reports) 30.5%
- Indiana(Based on 796 reports) 35.4%
Clear
- Hammond(Based on 13 reports) 84.6%
- Lake County(Based on 59 reports) 83.1%
- Indiana(Based on 797 reports) 82.8%
Rain
- Hammond(Based on 13 reports) 7.7%
- Lake County(Based on 59 reports) 8.5%
- Indiana(Based on 797 reports) 11.2%
Sleet or Hail
- Hammond(Based on 13 reports) 7.7%
- Lake County(Based on 59 reports) 1.7%
- Indiana(Based on 797 reports) 0.6%
| # | Date | Location | Vehicles | Drunk persons | Fatalites | Persons | Pedestrians |
|---|
| 1 | Mar 8, 1992 09:31 PM | 175th St | 1 | 1
| 1 | 2 | - |
| 2 | Mar 17, 1992 05:29 PM | Harrison A | 2 | - | 1
| 4 | - |
| 3 | Mar 20, 1992 02:23 PM | 41 | 1 | 1
| 1 | 3 | - |
| 4 | Mar 22, 1992 04:00 AM | I80 | 2 | - | 1
| 3 | - |
| 5 | Apr 17, 1992 07:35 PM | 20 | 1 | 1
| 1 | 1 | - |
| 6 | May 25, 1992 00:30 AM | I80 | 2 | - | 1
| 11 | - |
| 7 | Jun 10, 1992 00:10 AM | Grand Ave | 1 | 1
| 1 | 1 | - |
| 8 | Jul 28, 1992 10:27 AM | 20 | 2 | 1
| 1 | 3 | - |
| 9 | Jul 27, 1992 11:45 PM | I80 | 1 | 1
| 1 | 1 | - |
| 10 | Sep 3, 1992 12:31 AM | 20 | 1 | 1
| 1 | 1 | - |
| 11 | Sep 9, 1992 12:42 AM | 20 | 2 | 1
| 2 | 3 | - |
| 12 | Sep 23, 1992 01:00 AM | 20 | 2 | 1
| 5 | 6 | - |
| 13 | Oct 4, 1992 09:13 PM | State St. | 1 | - | 1
| 2 | 1 |
Hammond fatal car crash and road traffic accident list for 1991
- Fatal accident count9
- Vehicles involved in fatal accidents13
- Fatal accidents involving drunk persons2
- Fatalities9
- Persons involved in fatal accidents23
- Pedestrians involved in fatal accidents4
Average EMS response time
- Hammond(Based on 8 reports) 5.6 mins
- Lake County(Based on 42 reports) 7.1 mins
- Indiana(Based on 804 reports) 8.3 mins
Average hospital transport time
- Hammond(Based on 8 reports) 22.6 mins
- Lake County(Based on 38 reports) 36.8 mins
- Indiana(Based on 603 reports) 42.8 mins
Dark - Lighted
- Hammond(Based on 9 reports) 66.7%
- Lake County(Based on 54 reports) 33.3%
- Indiana(Based on 901 reports) 14.5%
Daylight
- Hammond(Based on 9 reports) 22.2%
- Lake County(Based on 54 reports) 29.6%
- Indiana(Based on 901 reports) 45.1%
Dark - Not Lighted
- Hammond(Based on 9 reports) 11.1%
- Lake County(Based on 54 reports) 31.5%
- Indiana(Based on 901 reports) 36.2%
Clear
- Hammond(Based on 9 reports) 77.8%
- Lake County(Based on 55 reports) 85.5%
- Indiana(Based on 903 reports) 85.4%
Rain
- Hammond(Based on 9 reports) 22.2%
- Lake County(Based on 55 reports) 9.1%
- Indiana(Based on 903 reports) 8.9%
| # | Date | Location | Vehicles | Drunk persons | Fatalites | Persons | Pedestrians |
|---|
| 1 | Feb 6, 1991 07:35 PM | Sheffield | 2 | 1
| 1 | 3 | - |
| 2 | Jun 15, 1991 10:05 PM | 20 | 2 | - | 1
| 3 | - |
| 3 | Jul 29, 1991 11:42 PM | I80 | 1 | - | 1
| 2 | 1 |
| 4 | Sep 21, 1991 11:24 AM | 129th St | 1 | - | 1
| 1 | - |
| 5 | Oct 18, 1991 08:42 PM | 20 | 2 | 1
| 1 | 2 | - |
| 6 | Oct 24, 1991 12:50 AM | I80 | 2 | - | 1
| 2 | - |
| 7 | Nov 14, 1991 04:55 PM | 169th St | 1 | - | 1
| 2 | 1 |
| 8 | Sep 11, 1991 02:46 AM | 912 | 1 | - | 1
| 2 | 1 |
| 9 | Dec 23, 1991 05:29 PM | Columbia | 1 | - | 1
| 6 | 1 |
Hammond fatal car crash and road traffic accident list for 1990
- Fatal accident count16
- Vehicles involved in fatal accidents22
- Fatal accidents involving drunk persons8
- Fatalities19
- Persons involved in fatal accidents35
Average EMS response time
- Hammond(Based on 15 reports) 4.2 mins
- Lake County(Based on 60 reports) 5.5 mins
- Indiana(Based on 824 reports) 7.4 mins
Average hospital transport time
- Hammond(Based on 13 reports) 44.9 mins
- Lake County(Based on 53 reports) 49.6 mins
- Indiana(Based on 603 reports) 37.3 mins
Dark - Lighted
- Hammond(Based on 16 reports) 62.5%
- Lake County(Based on 69 reports) 37.7%
- Indiana(Based on 927 reports) 14.9%
Daylight
- Hammond(Based on 16 reports) 25.0%
- Lake County(Based on 69 reports) 24.6%
- Indiana(Based on 927 reports) 46.9%
Dark - Not Lighted
- Hammond(Based on 16 reports) 12.5%
- Lake County(Based on 69 reports) 27.5%
- Indiana(Based on 927 reports) 32.3%
Clear
- Hammond(Based on 16 reports) 100.0%
- Lake County(Based on 69 reports) 85.5%
- Indiana(Based on 928 reports) 84.3%
| # | Date | Location | Vehicles | Drunk persons | Fatalites | Persons | Pedestrians |
|---|
| 1 | Jan 6, 1990 00:11 AM | 912 | 1 | 1
| 1 | 1 | - |
| 2 | Mar 9, 1990 11:46 PM | 312 | 1 | 1
| 2 | 2 | - |
| 3 | Apr 2, 1990 10:08 PM | Kennedy | 1 | - | 1
| 1 | - |
| 4 | Apr 17, 1990 07:55 AM | Sheffield | 2 | - | 1
| 2 | - |
| 5 | Apr 28, 1990 01:48 AM | 165th St. | 2 | 1
| 1 | 3 | - |
| 6 | Jun 5, 1990 00:55 AM | I80 | 1 | - | 1
| 2 | - |
| 7 | Jun 21, 1990 07:17 PM | 312 | 1 | - | 1
| 2 | - |
| 8 | Jun 23, 1990 09:07 PM | Chicago St | 1 | - | 1
| 3 | - |
| 9 | Jun 28, 1990 05:37 PM | Columbia | 2 | 1
| 1 | 6 | - |
| 10 | Aug 24, 1990 03:26 AM | Kenwood St | 1 | 1
| 1 | 1 | - |
| 11 | Sep 2, 1990 05:34 AM | 41 | 2 | - | 1
| 2 | - |
| 12 | Sep 11, 1990 10:00 PM | Michigan | 2 | 1
| 3 | 3 | - |
| 13 | Sep 9, 1990 07:37 AM | 41 | 1 | 1
| 1 | 2 | - |
| 14 | Sep 22, 1990 05:35 AM | 169th St | 2 | - | 1
| 2 | - |
| 15 | Sep 28, 1990 09:39 PM | Hohman Ave | 1 | 1
| 1 | 1 | - |
| 16 | Dec 7, 1990 09:40 PM | I80 | 1 | - | 1
| 2 | - |
Hammond fatal car crash and road traffic accident list for 1989
- Fatal accident count9
- Vehicles involved in fatal accidents13
- Fatal accidents involving drunk persons5
- Fatalities9
- Persons involved in fatal accidents27
Average EMS response time
- Hammond(Based on 9 reports) 5.0 mins
- Lake County(Based on 61 reports) 5.4 mins
- Indiana(Based on 846 reports) 7.6 mins
Average hospital transport time
- Hammond(Based on 8 reports) 46.3 mins
- Lake County(Based on 51 reports) 38.6 mins
- Indiana(Based on 678 reports) 37.2 mins
Dark - Lighted
- Hammond(Based on 9 reports) 55.6%
- Lake County(Based on 69 reports) 42.0%
- Indiana(Based on 882 reports) 13.5%
Daylight
- Hammond(Based on 9 reports) 22.2%
- Lake County(Based on 69 reports) 33.3%
- Indiana(Based on 882 reports) 49.9%
Dawn
- Hammond(Based on 9 reports) 11.1%
- Lake County(Based on 69 reports) 2.9%
- Indiana(Based on 882 reports) 2.5%
Dusk
- Hammond(Based on 9 reports) 11.1%
- Lake County(Based on 69 reports) 2.9%
- Indiana(Based on 882 reports) 2.8%
Clear
- Hammond(Based on 9 reports) 77.8%
- Lake County(Based on 69 reports) 79.7%
- Indiana(Based on 882 reports) 82.2%
Rain
- Hammond(Based on 9 reports) 22.2%
- Lake County(Based on 69 reports) 13.0%
- Indiana(Based on 882 reports) 9.8%
| # | Date | Location | Vehicles | Drunk persons | Fatalites | Persons | Pedestrians |
|---|
| 1 | May 15, 1989 08:00 AM | Calumet Av | 1 | - | 1
| 2 | - |
| 2 | Apr 9, 1989 00:41 AM | Calumet | 2 | 1
| 1 | 2 | - |
| 3 | Jul 21, 1989 00:22 AM | Hoffman St | 1 | - | 1
| 1 | - |
| 4 | Jul 22, 1989 08:07 PM | Michigan | 3 | 1
| 1 | 9 | - |
| 5 | Aug 20, 1989 05:27 AM | Southeaste | 1 | 1
| 1 | 2 | - |
| 6 | Sep 10, 1989 07:39 PM | Chicago St | 1 | - | 1
| 2 | - |
| 7 | Sep 22, 1989 05:10 PM | I80 | 1 | - | 1
| 1 | - |
| 8 | Nov 27, 1989 11:46 PM | Sohl Ave. | 1 | 1
| 1 | 3 | - |
| 9 | Dec 26, 1989 01:10 AM | 20 | 2 | 1
| 1 | 5 | - |
Hammond fatal car crash and road traffic accident list for 1988
- Fatal accident count14
- Vehicles involved in fatal accidents22
- Fatal accidents involving drunk persons1
- Fatalities14
- Persons involved in fatal accidents45
Average EMS response time
- Hammond(Based on 14 reports) 3.9 mins
- Lake County(Based on 61 reports) 5.9 mins
- Indiana(Based on 901 reports) 7.6 mins
Average hospital transport time
- Hammond(Based on 9 reports) 22.1 mins
- Lake County(Based on 46 reports) 36.2 mins
- Indiana(Based on 663 reports) 39.0 mins
Daylight
- Hammond(Based on 14 reports) 42.9%
- Lake County(Based on 68 reports) 36.8%
- Indiana(Based on 955 reports) 49.4%
Dark - Lighted
- Hammond(Based on 14 reports) 35.7%
- Lake County(Based on 68 reports) 32.4%
- Indiana(Based on 955 reports) 13.2%
Dusk
- Hammond(Based on 14 reports) 7.1%
- Lake County(Based on 68 reports) 4.4%
- Indiana(Based on 955 reports) 2.4%
Dawn
- Hammond(Based on 14 reports) 7.1%
- Lake County(Based on 68 reports) 2.9%
- Indiana(Based on 955 reports) 1.8%
Dark - Not Lighted
- Hammond(Based on 14 reports) 7.1%
- Lake County(Based on 68 reports) 23.5%
- Indiana(Based on 955 reports) 33.2%
Clear
- Hammond(Based on 14 reports) 92.9%
- Lake County(Based on 68 reports) 85.3%
- Indiana(Based on 957 reports) 85.9%
Rain
- Hammond(Based on 14 reports) 7.1%
- Lake County(Based on 68 reports) 11.8%
- Indiana(Based on 957 reports) 8.5%
| # | Date | Location | Vehicles | Drunk persons | Fatalites | Persons | Pedestrians |
|---|
| 1 | Mar 4, 1988 09:43 AM | 912 | 2 | - | 1
| 2 | - |
| 2 | May 24, 1988 00:54 AM | Willow Ct | 1 | - | 1
| 2 | - |
| 3 | Jun 3, 1988 11:14 PM | Us 41 | 1 | - | 1
| 5 | - |
| 4 | Jun 6, 1988 12:38 AM | Us 12 | 1 | - | 1
| 2 | - |
| 5 | Jun 10, 1988 04:57 AM | Columbia | 1 | - | 1
| 1 | - |
| 6 | Jun 21, 1988 05:50 PM | Sohl Ave | 1 | - | 1
| 3 | - |
| 7 | May 30, 1988 04:00 PM | I-80 | 1 | - | 1
| 2 | - |
| 8 | Jul 12, 1988 09:07 PM | 169th | 2 | - | 1
| 7 | - |
| 9 | Jul 16, 1988 08:53 AM | Hohman Ave | 2 | - | 1
| 2 | - |
| 10 | Jul 29, 1988 08:02 PM | Calumet Av | 2 | - | 1
| 8 | - |
| 11 | Aug 19, 1988 11:26 PM | Calumet Av | 2 | - | 1
| 3 | - |
| 12 | Dec 2, 1988 04:48 PM | Calumet Av | 4 | 1
| 1 | 5 | - |
| 13 | Dec 10, 1988 11:24 PM | 165th St. | 1 | - | 1
| 1 | - |
| 14 | Dec 19, 1988 12:20 AM | 165th St. | 1 | - | 1
| 2 | - |
Hammond fatal car crash and road traffic accident list for 1987
- Fatal accident count12
- Vehicles involved in fatal accidents20
- Fatal accidents involving drunk persons5
- Fatalities12
- Persons involved in fatal accidents42
Average EMS response time
- Hammond(Based on 11 reports) 5.9 mins
- Lake County(Based on 57 reports) 7.0 mins
- Indiana(Based on 837 reports) 7.2 mins
Average hospital transport time
- Hammond(Based on 10 reports) 19.6 mins
- Lake County(Based on 30 reports) 33.1 mins
- Indiana(Based on 522 reports) 45.2 mins
Daylight
- Hammond(Based on 12 reports) 41.7%
- Lake County(Based on 75 reports) 42.7%
- Indiana(Based on 956 reports) 46.5%
Dark - Lighted
- Hammond(Based on 12 reports) 33.3%
- Lake County(Based on 75 reports) 32.0%
- Indiana(Based on 956 reports) 16.4%
Dusk
- Hammond(Based on 12 reports) 16.7%
- Lake County(Based on 75 reports) 2.7%
- Indiana(Based on 956 reports) 3.3%
Dawn
- Hammond(Based on 12 reports) 8.3%
- Lake County(Based on 75 reports) 1.3%
- Indiana(Based on 956 reports) 1.8%
Clear
- Hammond(Based on 12 reports) 100.0%
- Lake County(Based on 75 reports) 86.7%
- Indiana(Based on 956 reports) 86.4%
| # | Date | Location | Vehicles | Drunk persons | Fatalites | Persons | Pedestrians |
|---|
| 1 | Jan 5, 1987 06:05 AM | Parrish Av | 1 | 1
| 1 | 2 | - |
| 2 | Jan 12, 1987 10:10 AM | 165th | 1 | - | 1
| 2 | - |
| 3 | Mar 3, 1987 01:34 PM | 41 | 2 | - | 1
| 2 | - |
| 4 | Mar 6, 1987 05:45 PM | 41 | 3 | - | 1
| 7 | - |
| 5 | May 4, 1987 05:03 PM | 41 | 2 | 1
| 1 | 2 | - |
| 6 | May 28, 1987 01:52 AM | Hohman Ave | 2 | 1
| 1 | 6 | - |
| 7 | Jun 9, 1987 03:00 PM | I80 | 1 | - | 1
| 1 | - |
| 8 | Jun 1, 1987 08:19 PM | Calumetave | 2 | - | 1
| 3 | - |
| 9 | Jun 12, 1987 01:13 AM | Indplsblvd | 2 | 1
| 1 | 3 | - |
| 10 | Sep 6, 1987 09:02 PM | 177th | 1 | 1
| 1 | 9 | - |
| 11 | Oct 28, 1987 11:16 AM | Sheffield | 2 | - | 1
| 3 | - |
| 12 | Oct 30, 1987 10:46 PM | 169th | 1 | - | 1
| 2 | - |
Hammond fatal car crash and road traffic accident list for 1986
- Fatal accident count9
- Vehicles involved in fatal accidents16
- Fatal accidents involving drunk persons5
- Fatalities11
- Persons involved in fatal accidents26
Average EMS response time
- Hammond(Based on 9 reports) 4.9 mins
- Lake County(Based on 44 reports) 5.3 mins
- Indiana(Based on 838 reports) 7.5 mins
Daylight
- Hammond(Based on 9 reports) 44.4%
- Lake County(Based on 49 reports) 36.7%
- Indiana(Based on 930 reports) 44.8%
Dark - Lighted
- Hammond(Based on 9 reports) 44.4%
- Lake County(Based on 49 reports) 30.6%
- Indiana(Based on 930 reports) 14.8%
Dark - Not Lighted
- Hammond(Based on 9 reports) 11.1%
- Lake County(Based on 49 reports) 30.6%
- Indiana(Based on 930 reports) 37.4%
Clear
- Hammond(Based on 9 reports) 100.0%
- Lake County(Based on 50 reports) 90.0%
- Indiana(Based on 931 reports) 88.4%
| # | Date | Location | Vehicles | Drunk persons | Fatalites | Persons | Pedestrians |
|---|
| 1 | Feb 6, 1986 12:00 PM | 12 | 2 | 1
| 1 | 2 | - |
| 2 | Apr 11, 1986 07:12 PM | Summer St | 1 | - | 1
| 2 | - |
| 3 | May 2, 1986 07:42 AM | Columbia | 1 | 1
| 1 | 4 | - |
| 4 | May 6, 1986 04:01 PM | Sohl Ave | 2 | - | 1
| 2 | - |
| 5 | Jul 16, 1986 02:48 PM | 80 | 2 | - | 1
| 2 | - |
| 6 | Jul 17, 1986 06:10 PM | 80 | 3 | - | 1
| 5 | - |
| 7 | Aug 17, 1986 11:00 PM | Columbia | 1 | - | 1
| 2 | - |
| 8 | Nov 4, 1986 00:54 AM | Michiganst | 2 | 2
| 2 | 4 | - |
| 9 | Dec 24, 1986 05:08 AM | Chicago St | 2 | 1
| 2 | 3 | - |
Hammond fatal car crash and road traffic accident list for 1985
- Fatal accident count14
- Vehicles involved in fatal accidents24
- Fatal accidents involving drunk persons4
- Fatalities14
- Persons involved in fatal accidents36
Average EMS response time
- Hammond(Based on 13 reports) 5.1 mins
- Lake County(Based on 33 reports) 5.3 mins
- Indiana(Based on 753 reports) 7.4 mins
Daylight
- Hammond(Based on 14 reports) 64.3%
- Lake County(Based on 58 reports) 37.9%
- Indiana(Based on 879 reports) 46.8%
Dark - Lighted
- Hammond(Based on 14 reports) 35.7%
- Lake County(Based on 58 reports) 50.0%
- Indiana(Based on 879 reports) 16.0%
Clear
- Hammond(Based on 14 reports) 85.7%
- Lake County(Based on 58 reports) 87.9%
- Indiana(Based on 880 reports) 82.2%
Snow
- Hammond(Based on 14 reports) 14.3%
- Lake County(Based on 58 reports) 8.6%
- Indiana(Based on 880 reports) 5.7%
| # | Date | Location | Vehicles | Drunk persons | Fatalites | Persons | Pedestrians |
|---|
| 1 | Jan 8, 1985 87:99 PM | 165th | 2 | - | 1
| 3 | - |
| 2 | Jan 10, 1985 07:42 PM | 41 | 1 | 1
| 1 | 1 | - |
| 3 | Feb 25, 1985 11:20 AM | 80 | 1 | - | 1
| 2 | - |
| 4 | Mar 18, 1985 11:54 PM | 20 | 3 | 2
| 1 | 4 | - |
| 5 | May 25, 1985 01:02 PM | Kennedyave | 1 | 1
| 1 | 1 | - |
| 6 | May 13, 1985 02:18 PM | Kennedyave | 3 | - | 1
| 3 | - |
| 7 | May 18, 1985 11:15 AM | 108th St | 1 | - | 1
| 1 | - |
| 8 | Jul 9, 1985 06:10 PM | 912 | 2 | - | 1
| 2 | - |
| 9 | Sep 16, 1985 05:02 PM | 12 | 2 | - | 1
| 3 | - |
| 10 | Oct 5, 1985 00:43 AM | Forest Ave | 1 | - | 1
| 3 | - |
| 11 | Oct 15, 1985 11:11 PM | Michiganst | 1 | - | 1
| 2 | - |
| 12 | Oct 25, 1985 02:09 PM | Hohman Ave | 3 | - | 1
| 7 | - |
| 13 | Dec 1, 1985 10:45 PM | 80 | 2 | - | 1
| 3 | - |
| 14 | Apr 9, 1985 07:17 AM | 112th St | 1 | - | 1
| 1 | - |
Hammond fatal car crash and road traffic accident list for 1984
- Fatal accident count8
- Vehicles involved in fatal accidents12
- Fatal accidents involving drunk persons1
- Fatalities8
- Persons involved in fatal accidents17
Average EMS response time
- Hammond(Based on 3 reports) 4.3 mins
- Lake County(Based on 21 reports) 5.1 mins
- Indiana(Based on 434 reports) 7.3 mins
Daylight
- Hammond(Based on 8 reports) 62.5%
- Lake County(Based on 58 reports) 43.1%
- Indiana(Based on 835 reports) 43.0%
Dark - Lighted
- Hammond(Based on 8 reports) 25.0%
- Lake County(Based on 58 reports) 20.7%
- Indiana(Based on 835 reports) 13.1%
Dark - Not Lighted
- Hammond(Based on 8 reports) 12.5%
- Lake County(Based on 58 reports) 36.2%
- Indiana(Based on 835 reports) 39.2%
Clear
- Hammond(Based on 8 reports) 75.0%
- Lake County(Based on 58 reports) 81.0%
- Indiana(Based on 838 reports) 85.7%
Rain
- Hammond(Based on 8 reports) 12.5%
- Lake County(Based on 58 reports) 8.6%
- Indiana(Based on 838 reports) 8.2%
Sleet or Hail
- Hammond(Based on 8 reports) 12.5%
- Lake County(Based on 58 reports) 3.4%
- Indiana(Based on 838 reports) 1.3%
| # | Date | Location | Vehicles | Drunk persons | Fatalites | Persons | Pedestrians |
|---|
| 1 | Jan 10, 1984 05:31 PM | 169th | 1 | - | 1
| 2 | - |
| 2 | Feb 10, 1984 07:15 AM | 80 | 1 | - | 1
| 1 | - |
| 3 | Feb 27, 1984 12:45 AM | 912 | 1 | - | 1
| 1 | - |
| 4 | Apr 17, 1984 07:08 PM | Hohman Av | 1 | - | 1
| 2 | - |
| 5 | Jun 22, 1984 07:31 AM | 20 | 1 | - | 1
| 2 | - |
| 6 | Aug 28, 1984 05:05 PM | 41 | 5 | - | 1
| 6 | - |
| 7 | Aug 30, 1984 08:15 AM | Sheffield | 1 | - | 1
| 2 | - |
| 8 | Dec 4, 1984 08:31 PM | 177th | 1 | 1
| 1 | 1 | - |
Hammond fatal car crash and road traffic accident list for 1983
- Fatal accident count13
- Vehicles involved in fatal accidents20
- Fatal accidents involving drunk persons10
- Fatalities13
- Persons involved in fatal accidents41
Dark - Lighted
- Hammond(Based on 13 reports) 61.5%
- Lake County(Based on 70 reports) 42.9%
- Indiana(Based on 874 reports) 16.0%
Dark - Not Lighted
- Hammond(Based on 13 reports) 30.8%
- Lake County(Based on 70 reports) 27.1%
- Indiana(Based on 874 reports) 38.9%
Daylight
- Hammond(Based on 13 reports) 7.7%
- Lake County(Based on 70 reports) 28.6%
- Indiana(Based on 874 reports) 42.0%
Clear
- Hammond(Based on 13 reports) 92.3%
- Lake County(Based on 71 reports) 84.5%
- Indiana(Based on 876 reports) 83.6%
Rain
- Hammond(Based on 13 reports) 7.7%
- Lake County(Based on 71 reports) 9.9%
- Indiana(Based on 876 reports) 10.0%
| # | Date | Location | Vehicles | Drunk persons | Fatalites | Persons | Pedestrians |
|---|
| 1 | Jan 29, 1983 03:28 AM | 41 | 2 | 1
| 1 | 5 | - |
| 2 | Mar 12, 1983 03:25 AM | 80 | 1 | 1
| 1 | 1 | - |
| 3 | Mar 3, 1983 02:39 AM | 20 | 1 | 1
| 1 | 4 | - |
| 4 | Apr 6, 1983 11:54 PM | 152 | 2 | 1
| 1 | 3 | - |
| 5 | Apr 12, 1983 03:15 PM | Sheffield | 1 | - | 1
| 3 | - |
| 6 | May 10, 1983 10:21 PM | 20 | 2 | - | 1
| 3 | - |
| 7 | May 24, 1983 03:22 AM | 20 | 2 | 2
| 1 | 2 | - |
| 8 | Jan 28, 1983 03:00 AM | 80 | 2 | 1
| 1 | 5 | - |
| 9 | Aug 15, 1983 09:37 PM | Summer St | 1 | 1
| 1 | 2 | - |
| 10 | Sep 4, 1983 09:36 PM | Howard | 1 | - | 1
| 7 | - |
| 11 | Sep 9, 1983 10:03 PM | 20 | 2 | 1
| 1 | 3 | - |
| 12 | Sep 27, 1983 03:36 AM | Columbia | 2 | 1
| 1 | 2 | - |
| 13 | Oct 6, 1983 05:39 AM | 12 | 1 | - | 1
| 1 | - |
Hammond fatal car crash and road traffic accident list for 1982
- Fatal accident count13
- Vehicles involved in fatal accidents14
- Fatal accidents involving drunk persons3
- Fatalities14
- Persons involved in fatal accidents28
Daylight
- Hammond(Based on 13 reports) 38.5%
- Lake County(Based on 82 reports) 39.0%
- Indiana(Based on 845 reports) 37.6%
Dark - Not Lighted
- Hammond(Based on 13 reports) 30.8%
- Lake County(Based on 82 reports) 24.4%
- Indiana(Based on 845 reports) 40.0%
Dark - Lighted
- Hammond(Based on 13 reports) 23.1%
- Lake County(Based on 82 reports) 30.5%
- Indiana(Based on 845 reports) 17.6%
Dawn
- Hammond(Based on 13 reports) 7.7%
- Lake County(Based on 82 reports) 1.2%
- Indiana(Based on 845 reports) 1.5%
Clear
- Hammond(Based on 13 reports) 76.9%
- Lake County(Based on 82 reports) 81.7%
- Indiana(Based on 846 reports) 81.9%
Rain
- Hammond(Based on 13 reports) 23.1%
- Lake County(Based on 82 reports) 14.6%
- Indiana(Based on 846 reports) 11.9%
| # | Date | Location | Vehicles | Drunk persons | Fatalites | Persons | Pedestrians |
|---|
| 1 | Jan 20, 1982 05:24 AM | 246 | 1 | - | 1
| 1 | - |
| 2 | Apr 3, 1982 02:25 AM | 80 | 1 | 1
| 2 | 4 | - |
| 3 | Apr 25, 1982 04:00 AM | 80 | 1 | - | 1
| 2 | - |
| 4 | Apr 16, 1982 03:47 AM | N Coth Ave | 1 | 1
| 1 | 1 | - |
| 5 | Apr 23, 1982 02:55 PM | 114th | 1 | 1
| 1 | 2 | - |
| 6 | May 10, 1982 01:23 PM | Columbia | 1 | - | 1
| 2 | - |
| 7 | Jun 9, 1982 11:15 PM | 80 | 1 | - | 1
| 2 | - |
| 8 | Jul 3, 1982 06:41 AM | Michiganst | 1 | - | 1
| 1 | - |
| 9 | Jul 6, 1982 01:09 AM | 912 | 1 | - | 1
| 1 | - |
| 10 | Aug 3, 1982 01:31 PM | Columbia | 2 | - | 1
| 6 | - |
| 11 | Nov 11, 1982 06:19 AM | 165th St | 1 | - | 1
| 1 | - |
| 12 | Sep 30, 1982 09:34 AM | 80 | 1 | - | 1
| 3 | - |
| 13 | Nov 16, 1982 10:40 PM | 80 | 1 | - | 1
| 2 | - |
Hammond fatal car crash and road traffic accident list for 1981
- Fatal accident count24
- Vehicles involved in fatal accidents35
- Fatal accidents involving drunk persons6
- Fatalities27
- Persons involved in fatal accidents59
Dark - Lighted
- Hammond(Based on 22 reports) 54.5%
- Lake County(Based on 95 reports) 40.0%
- Indiana(Based on 995 reports) 17.8%
Daylight
- Hammond(Based on 22 reports) 27.3%
- Lake County(Based on 95 reports) 30.5%
- Indiana(Based on 995 reports) 39.3%
Dark - Not Lighted
- Hammond(Based on 22 reports) 9.1%
- Lake County(Based on 95 reports) 22.1%
- Indiana(Based on 995 reports) 38.4%
Dawn
- Hammond(Based on 22 reports) 4.5%
- Lake County(Based on 95 reports) 4.2%
- Indiana(Based on 995 reports) 1.4%
Dusk
- Hammond(Based on 22 reports) 4.5%
- Lake County(Based on 95 reports) 3.2%
- Indiana(Based on 995 reports) 3.1%
Clear
- Hammond(Based on 24 reports) 75.0%
- Lake County(Based on 98 reports) 81.6%
- Indiana(Based on 1,000 reports) 81.5%
Rain
- Hammond(Based on 24 reports) 12.5%
- Lake County(Based on 98 reports) 8.2%
- Indiana(Based on 1,000 reports) 9.3%
Snow
- Hammond(Based on 24 reports) 4.2%
- Lake County(Based on 98 reports) 7.1%
- Indiana(Based on 1,000 reports) 3.2%
Cloudy
- Hammond(Based on 24 reports) 4.2%
- Lake County(Based on 98 reports) 2.0%
- Indiana(Based on 1,000 reports) 0.9%
Other
- Hammond(Based on 24 reports) 4.2%
- Lake County(Based on 98 reports) 1.0%
- Indiana(Based on 1,000 reports) 3.4%
Hammond fatal car crash and road traffic accident list for 1980
- Fatal accident count20
- Vehicles involved in fatal accidents24
- Fatal accidents involving drunk persons4
- Fatalities21
- Persons involved in fatal accidents47
Dark - Not Lighted
- Hammond(Based on 20 reports) 60.0%
- Lake County(Based on 94 reports) 63.8%
- Indiana(Based on 1,026 reports) 53.6%
Daylight
- Hammond(Based on 20 reports) 40.0%
- Lake County(Based on 94 reports) 35.1%
- Indiana(Based on 1,026 reports) 41.5%
Clear
- Hammond(Based on 20 reports) 90.0%
- Lake County(Based on 96 reports) 86.5%
- Indiana(Based on 1,029 reports) 83.4%
Rain
- Hammond(Based on 20 reports) 10.0%
- Lake County(Based on 96 reports) 7.3%
- Indiana(Based on 1,029 reports) 9.1%
Hammond fatal car crash and road traffic accident list for 1979
- Fatal accident count19
- Vehicles involved in fatal accidents33
- Fatal accidents involving drunk persons3
- Fatalities20
- Persons involved in fatal accidents54
Dark - Not Lighted
- Hammond(Based on 19 reports) 63.2%
- Lake County(Based on 104 reports) 63.5%
- Indiana(Based on 1,143 reports) 54.9%
Daylight
- Hammond(Based on 19 reports) 36.8%
- Lake County(Based on 104 reports) 32.7%
- Indiana(Based on 1,143 reports) 38.9%
Clear
- Hammond(Based on 19 reports) 89.5%
- Lake County(Based on 104 reports) 83.7%
- Indiana(Based on 1,147 reports) 81.6%
Rain
- Hammond(Based on 19 reports) 10.5%
- Lake County(Based on 104 reports) 12.5%
- Indiana(Based on 1,147 reports) 11.5%
Hammond fatal car crash and road traffic accident list for 1978
- Fatal accident count10
- Vehicles involved in fatal accidents17
- Fatal accidents involving drunk persons4
- Fatalities11
- Persons involved in fatal accidents25
Dark - Not Lighted
- Hammond(Based on 10 reports) 50.0%
- Lake County(Based on 94 reports) 62.8%
- Indiana(Based on 1,096 reports) 52.6%
Daylight
- Hammond(Based on 10 reports) 50.0%
- Lake County(Based on 94 reports) 35.1%
- Indiana(Based on 1,096 reports) 41.9%
Clear
- Hammond(Based on 10 reports) 90.0%
- Lake County(Based on 95 reports) 81.1%
- Indiana(Based on 1,108 reports) 81.1%
Snow
- Hammond(Based on 10 reports) 10.0%
- Lake County(Based on 95 reports) 6.3%
- Indiana(Based on 1,108 reports) 2.8%
Hammond fatal car crash and road traffic accident list for 1977
- Fatal accident count16
- Vehicles involved in fatal accidents32
- Fatal accidents involving drunk persons6
- Fatalities17
- Persons involved in fatal accidents42
Daylight
- Hammond(Based on 16 reports) 56.3%
- Lake County(Based on 91 reports) 39.6%
- Indiana(Based on 1,057 reports) 45.3%
Dark - Not Lighted
- Hammond(Based on 16 reports) 43.8%
- Lake County(Based on 91 reports) 58.2%
- Indiana(Based on 1,057 reports) 50.6%
Clear
- Hammond(Based on 16 reports) 87.5%
- Lake County(Based on 91 reports) 87.9%
- Indiana(Based on 1,061 reports) 82.8%
Rain
- Hammond(Based on 16 reports) 12.5%
- Lake County(Based on 91 reports) 9.9%
- Indiana(Based on 1,061 reports) 10.9%
Hammond fatal car crash and road traffic accident list for 1976
- Fatal accident count14
- Vehicles involved in fatal accidents20
- Fatalities16
- Persons involved in fatal accidents39
Dark - Not Lighted
- Hammond(Based on 14 reports) 64.3%
- Lake County(Based on 88 reports) 48.9%
- Indiana(Based on 973 reports) 47.5%
Daylight
- Hammond(Based on 14 reports) 35.7%
- Lake County(Based on 88 reports) 48.9%
- Indiana(Based on 973 reports) 48.0%
Clear
- Hammond(Based on 14 reports) 92.9%
- Lake County(Based on 88 reports) 87.5%
- Indiana(Based on 976 reports) 83.1%
Rain
- Hammond(Based on 14 reports) 7.1%
- Lake County(Based on 88 reports) 8.0%
- Indiana(Based on 976 reports) 9.6%
Hammond fatal car crash and road traffic accident list for 1975
- Fatal accident count14
- Vehicles involved in fatal accidents20
- Fatalities16
- Persons involved in fatal accidents39
Dark - Not Lighted
- Hammond(Based on 14 reports) 64.3%
- Lake County(Based on 88 reports) 48.9%
- Indiana(Based on 973 reports) 47.5%
Daylight
- Hammond(Based on 14 reports) 35.7%
- Lake County(Based on 88 reports) 48.9%
- Indiana(Based on 973 reports) 48.0%
Clear
- Hammond(Based on 14 reports) 92.9%
- Lake County(Based on 88 reports) 87.5%
- Indiana(Based on 976 reports) 83.1%
Rain
- Hammond(Based on 14 reports) 7.1%
- Lake County(Based on 88 reports) 8.0%
- Indiana(Based on 976 reports) 9.6%