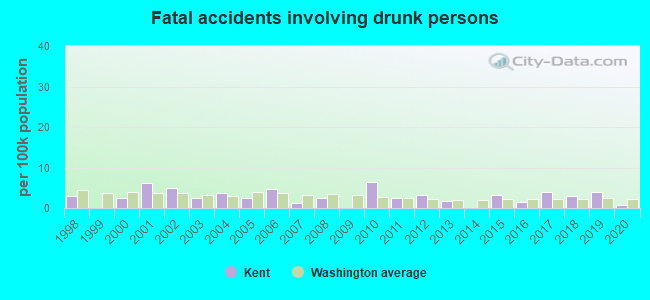
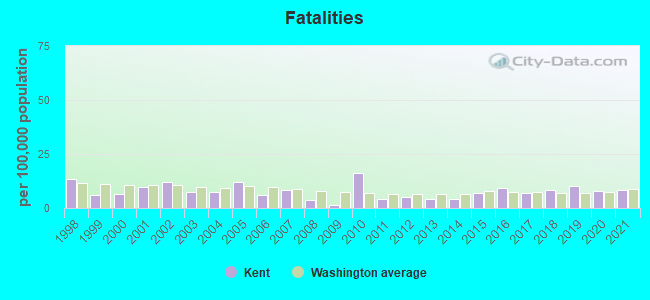
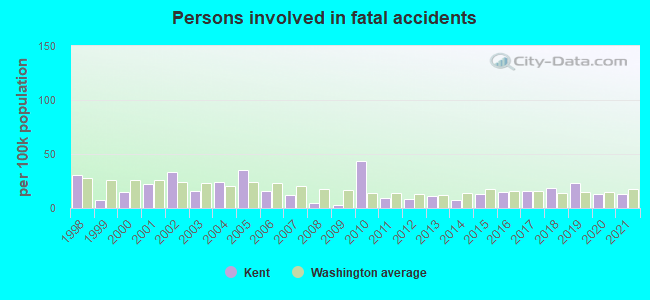
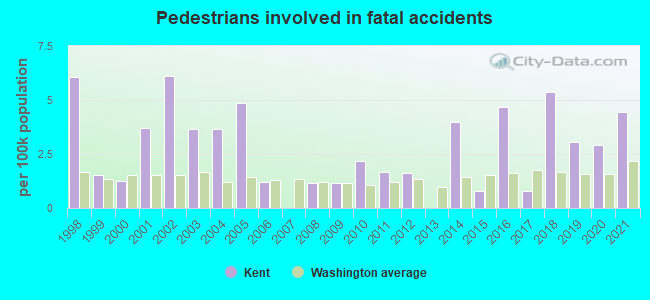
Fatal car crashes and road traffic accidents in Kent, Washington
- Fatal car crash and road traffic accident statistics for 2021
- Fatal accident count11
- Vehicles involved in fatal accidents17
- Fatal accidents involving drunk persons0
- Fatalities11
- Persons involved in fatal accidents18
- Pedestrians involved in fatal accidents6
- Fatal car crash and road traffic accident statistics for 2020
- Fatal accident count11
- Vehicles involved in fatal accidents15
- Fatal accidents involving drunk persons1
- Fatalities11
- Persons involved in fatal accidents18
- Pedestrians involved in fatal accidents4
- Fatal car crash and road traffic accident statistics for 2019
- Fatal accident count13
- Vehicles involved in fatal accidents23
- Fatal accidents involving drunk persons5
- Fatalities13
- Persons involved in fatal accidents30
- Pedestrians involved in fatal accidents4
- Fatal car crash and road traffic accident statistics for 2018
- Fatal accident count11
- Vehicles involved in fatal accidents21
- Fatal accidents involving drunk persons4
- Fatalities11
- Persons involved in fatal accidents24
- Pedestrians involved in fatal accidents7

Data:
Latest news about accidents in Kent, WA collected exclusively by city-data.com from local newspapers, TV, and radio stations
No street view available for this location
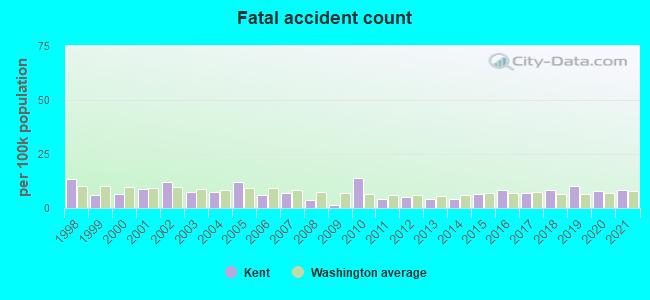
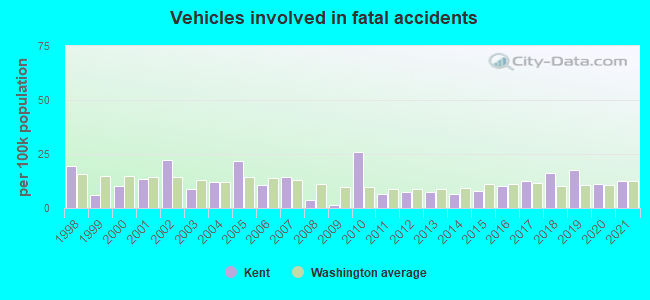
Kent fatal accident statistics for 1998 - 2021
Average EMS response time
- Kent(Based on 185 reports) 5.3 mins
- King County(Based on 3,619 reports) 5.6 mins
- Washington(Based on 17,122 reports) 8.2 mins
Average hospital transport time
- Kent(Based on 85 reports) 55.9 mins
- King County(Based on 1,630 reports) 52.1 mins
- Washington(Based on 8,762 reports) 49.2 mins
Daylight
- Kent(Based on 315 reports) 38.1%
- King County(Based on 5,652 reports) 41.0%
- Washington(Based on 27,943 reports) 45.6%
Dark - Lighted
- Kent(Based on 315 reports) 36.5%
- King County(Based on 5,652 reports) 34.4%
- Washington(Based on 27,943 reports) 18.4%
Dark - Not Lighted
- Kent(Based on 315 reports) 21.3%
- King County(Based on 5,652 reports) 20.6%
- Washington(Based on 27,943 reports) 31.6%
Dusk
- Kent(Based on 315 reports) 1.9%
- King County(Based on 5,652 reports) 1.9%
- Washington(Based on 27,943 reports) 2.1%
Dawn
- Kent(Based on 315 reports) 1.3%
- King County(Based on 5,652 reports) 1.3%
- Washington(Based on 27,943 reports) 1.5%
Dark - Unknown Lighting
- Kent(Based on 315 reports) 1.0%
- King County(Based on 5,652 reports) 0.8%
- Washington(Based on 27,943 reports) 0.7%
Clear
- Kent(Based on 315 reports) 71.4%
- King County(Based on 5,648 reports) 76.4%
- Washington(Based on 27,933 reports) 80.2%
Rain
- Kent(Based on 315 reports) 17.8%
- King County(Based on 5,648 reports) 16.4%
- Washington(Based on 27,933 reports) 12.1%
Unknown
- Kent(Based on 315 reports) 7.9%
- King County(Based on 5,648 reports) 4.2%
- Washington(Based on 27,933 reports) 3.2%
Fog, Smog, Smoke
- Kent(Based on 315 reports) 2.5%
- King County(Based on 5,648 reports) 1.3%
- Washington(Based on 27,933 reports) 1.9%
Snow
- Kent(Based on 315 reports) 0.3%
- King County(Based on 5,648 reports) 0.7%
- Washington(Based on 27,933 reports) 1.5%

Kent fatal car crash and road traffic accident list for 2021
- Fatal accident count11
- Vehicles involved in fatal accidents17
- Fatalities11
- Persons involved in fatal accidents18
- Pedestrians involved in fatal accidents6
Dark - Lighted
- Kent(Based on 11 reports) 45.5%
- King County(Based on 125 reports) 41.6%
- Washington(Based on 593 reports) 23.9%
Daylight
- Kent(Based on 11 reports) 27.3%
- King County(Based on 125 reports) 42.4%
- Washington(Based on 593 reports) 46.7%
Dark - Unknown Lighting
- Kent(Based on 11 reports) 18.2%
- King County(Based on 125 reports) 3.2%
- Washington(Based on 593 reports) 1.9%
Dark - Not Lighted
- Kent(Based on 11 reports) 9.1%
- King County(Based on 125 reports) 10.4%
- Washington(Based on 593 reports) 21.9%
Clear
- Kent(Based on 11 reports) 54.5%
- King County(Based on 126 reports) 50.8%
- Washington(Based on 594 reports) 63.8%
Unknown
- Kent(Based on 11 reports) 27.3%
- King County(Based on 126 reports) 26.2%
- Washington(Based on 594 reports) 19.4%
Fog, Smog, Smoke
- Kent(Based on 11 reports) 9.1%
- King County(Based on 126 reports) 0.8%
- Washington(Based on 594 reports) 1.5%
Rain
- Kent(Based on 11 reports) 9.1%
- King County(Based on 126 reports) 20.6%
- Washington(Based on 594 reports) 13.1%
| # | Date | Location | Vehicles | Drunk persons | Fatalites | Persons | Pedestrians |
|---|
| 1 | Jan 16, 2021 00:37 AM | 132nd Ave Se | 1 | - | 1
| 1 | - |
| 2 | Mar 19, 2021 03:23 AM | Sr-018 | 1 | - | 1
| 1 | 1 |
| 3 | Apr 24, 2021 04:28 PM | Central Ave N | 2 | - | 1
| 2 | - |
| 4 | Jun 8, 2021 02:18 PM | Sr-181, Washington Ave N | 1 | - | 1
| 1 | 1 |
| 5 | Jul 11, 2021 02:43 AM | Sr-167 | 2 | - | 1
| 1 | 1 |
| 6 | Jun 10, 2021 08:00 PM | Veterans Dr | 2 | - | 1
| 2 | - |
| 7 | Aug 15, 2021 02:39 AM | W Smith St | 1 | - | 1
| 1 | 1 |
| 8 | Oct 30, 2021 04:23 AM | Sr-167, S 228th St | 1 | - | 1
| 1 | 1 |
| 9 | Nov 21, 2021 03:08 AM | 124th Ave Se, Se 202nd Pl | 2 | - | 1
| 2 | - |
| 10 | Dec 4, 2021 01:44 AM | I-5 | 3 | - | 1
| 5 | - |
| 11 | Nov 24, 2021 07:45 PM | Sr-167 | 1 | - | 1
| 1 | 1 |
Kent fatal car crash and road traffic accident list for 2020
- Fatal accident count11
- Vehicles involved in fatal accidents15
- Fatal accidents involving drunk persons1
- Fatalities11
- Persons involved in fatal accidents18
- Pedestrians involved in fatal accidents4
Dark - Lighted
- Kent(Based on 11 reports) 45.5%
- King County(Based on 102 reports) 44.1%
- Washington(Based on 522 reports) 22.4%
Daylight
- Kent(Based on 11 reports) 36.4%
- King County(Based on 102 reports) 41.2%
- Washington(Based on 522 reports) 46.4%
Dawn
- Kent(Based on 11 reports) 9.1%
- King County(Based on 102 reports) 1.0%
- Washington(Based on 522 reports) 2.1%
Dark - Not Lighted
- Kent(Based on 11 reports) 9.1%
- King County(Based on 102 reports) 10.8%
- Washington(Based on 522 reports) 24.7%
Clear
- Kent(Based on 11 reports) 45.5%
- King County(Based on 101 reports) 61.4%
- Washington(Based on 524 reports) 69.1%
Unknown
- Kent(Based on 11 reports) 45.5%
- King County(Based on 101 reports) 23.8%
- Washington(Based on 524 reports) 14.9%
Snow
- Kent(Based on 11 reports) 9.1%
- King County(Based on 101 reports) 1.0%
- Washington(Based on 524 reports) 0.8%
| # | Date | Location | Vehicles | Drunk persons | Fatalites | Persons | Pedestrians |
|---|
| 1 | Jan 13, 2020 10:15 PM | I-5 | 1 | - | 1
| 1 | - |
| 2 | Feb 19, 2020 06:57 AM | Orillia Rd S | 2 | - | 1
| 2 | - |
| 3 | May 16, 2020 03:10 AM | I-5 | 1 | - | 1
| 2 | - |
| 4 | Jun 2, 2020 05:41 PM | 68th Ave S | 1 | - | 1
| 3 | - |
| 5 | Jun 21, 2020 03:11 PM | 144th Ave Se, Se 259th Pl | 1 | - | 1
| 1 | - |
| 6 | Jul 16, 2020 10:00 PM | Cr-S 272nd St | 1 | - | 1
| 1 | 1 |
| 7 | Jul 18, 2020 02:34 AM | Sr-515 | 1 | - | 1
| 2 | 1 |
| 8 | Oct 3, 2020 04:51 PM | Se 208th St, 108th Ave Se | 3 | - | 1
| 3 | 1 |
| 9 | May 24, 2020 09:52 PM | 111pl Pl Se | 1 | - | 1
| - | 1 |
| 10 | Feb 29, 2020 01:33 AM | 84th Ave S | 1 | 1
| 1 | 1 | - |
| 11 | Sep 2, 2020 05:53 AM | Sr-181, S 228th St | 2 | - | 1
| 2 | - |
Kent fatal car crash and road traffic accident list for 2019
- Fatal accident count13
- Vehicles involved in fatal accidents23
- Fatal accidents involving drunk persons5
- Fatalities13
- Persons involved in fatal accidents30
- Pedestrians involved in fatal accidents4
Dark - Lighted
- Kent(Based on 13 reports) 38.5%
- King County(Based on 95 reports) 43.2%
- Washington(Based on 488 reports) 21.7%
Daylight
- Kent(Based on 13 reports) 30.8%
- King County(Based on 95 reports) 38.9%
- Washington(Based on 488 reports) 45.3%
Dark - Not Lighted
- Kent(Based on 13 reports) 23.1%
- King County(Based on 95 reports) 13.7%
- Washington(Based on 488 reports) 27.7%
Dawn
- Kent(Based on 13 reports) 7.7%
- King County(Based on 95 reports) 2.1%
- Washington(Based on 488 reports) 2.5%
Clear
- Kent(Based on 12 reports) 66.7%
- King County(Based on 94 reports) 56.4%
- Washington(Based on 487 reports) 67.8%
Unknown
- Kent(Based on 12 reports) 25.0%
- King County(Based on 94 reports) 24.5%
- Washington(Based on 487 reports) 15.6%
Fog, Smog, Smoke
- Kent(Based on 12 reports) 8.3%
- King County(Based on 94 reports) 4.3%
- Washington(Based on 487 reports) 2.9%
| # | Date | Location | Vehicles | Drunk persons | Fatalites | Persons | Pedestrians |
|---|
| 1 | Jan 5, 2019 06:23 PM | I-5 | 1 | - | 1
| 1 | - |
| 2 | Feb 24, 2019 06:07 PM | Sr-515, Se 204th St | 1 | 1
| 1 | 1 | 1 |
| 3 | Jun 6, 2019 00:20 AM | Sr-167 | 3 | 1
| 1 | 3 | - |
| 4 | Jun 28, 2019 08:52 PM | Se 256th St, 137th Ave Se | 2 | 1
| 1 | 2 | - |
| 5 | Jun 30, 2019 10:09 PM | Sr-516 | 4 | - | 1
| 10 | - |
| 6 | Aug 23, 2019 10:43 PM | Reith Rd | 1 | 1
| 1 | 1 | 1 |
| 7 | Oct 2, 2019 02:39 PM | Sr-516, Sr-167 | 2 | - | 1
| 2 | - |
| 8 | Oct 11, 2019 01:59 PM | Sr-167 | 3 | - | 1
| 4 | - |
| 9 | Oct 15, 2019 10:47 PM | Sr-99 | 1 | - | 1
| 1 | - |
| 10 | Dec 17, 2019 06:19 PM | Sr-515, Se 235th St | 1 | - | 1
| 1 | 1 |
| 11 | Dec 19, 2019 03:42 AM | Sr-516 | 1 | - | 1
| 1 | 1 |
| 12 | Dec 16, 2019 01:04 PM | Sr-181, Oberto Dr | 2 | - | 1
| 2 | - |
| 13 | Jul 16, 2019 06:07 AM | Sr-167 | 1 | 1
| 1 | 1 | - |
Kent fatal car crash and road traffic accident list for 2018
- Fatal accident count11
- Vehicles involved in fatal accidents21
- Fatal accidents involving drunk persons4
- Fatalities11
- Persons involved in fatal accidents24
- Pedestrians involved in fatal accidents7
Daylight
- Kent(Based on 11 reports) 45.5%
- King County(Based on 101 reports) 39.6%
- Washington(Based on 483 reports) 45.3%
Dark - Lighted
- Kent(Based on 11 reports) 36.4%
- King County(Based on 101 reports) 35.6%
- Washington(Based on 483 reports) 23.4%
Dark - Not Lighted
- Kent(Based on 11 reports) 18.2%
- King County(Based on 101 reports) 17.8%
- Washington(Based on 483 reports) 26.3%
Rain
- Kent(Based on 11 reports) 54.5%
- King County(Based on 100 reports) 21.0%
- Washington(Based on 482 reports) 12.7%
Clear
- Kent(Based on 11 reports) 45.5%
- King County(Based on 100 reports) 59.0%
- Washington(Based on 482 reports) 71.0%
| # | Date | Location | Vehicles | Drunk persons | Fatalites | Persons | Pedestrians |
|---|
| 1 | Mar 22, 2018 11:23 AM | Sr-181, W Meeker St | 2 | - | 1
| 2 | - |
| 2 | Jul 25, 2018 05:16 PM | Sr-99 | 2 | - | 1
| 3 | 1 |
| 3 | Aug 3, 2018 02:49 AM | Sr-516 | 4 | 2
| 1 | 4 | - |
| 4 | Jul 22, 2018 01:55 AM | Sr-516 | 4 | - | 1
| 6 | 1 |
| 5 | Aug 18, 2018 06:12 PM | Sr-515, Se 253 Pl | 2 | - | 1
| 2 | - |
| 6 | Oct 6, 2018 10:28 PM | Sr-515 | 1 | 1
| 1 | 1 | 1 |
| 7 | Oct 9, 2018 05:38 AM | Reith Rd S, S 253rd St | 2 | - | 1
| 2 | - |
| 8 | Oct 27, 2018 10:36 PM | Sr-181 | 1 | - | 1
| 1 | - |
| 9 | Nov 14, 2018 02:00 PM | Sr-516, State Ave N | 1 | - | 1
| 1 | 3 |
| 10 | Dec 18, 2018 05:21 AM | Sr-167 Ramp S102109, 84th Ave | 1 | - | 1
| 1 | 1 |
| 11 | Dec 23, 2018 03:46 PM | Reiten Rd, E Guiberson St | 1 | 1
| 1 | 1 | - |
Kent fatal car crash and road traffic accident list for 2017
- Fatal accident count9
- Vehicles involved in fatal accidents16
- Fatal accidents involving drunk persons5
- Fatalities9
- Persons involved in fatal accidents20
- Pedestrians involved in fatal accidents1
Dark - Lighted
- Kent(Based on 9 reports) 77.8%
- King County(Based on 109 reports) 44.0%
- Washington(Based on 530 reports) 22.6%
Daylight
- Kent(Based on 9 reports) 11.1%
- King County(Based on 109 reports) 42.2%
- Washington(Based on 530 reports) 46.8%
Dusk
- Kent(Based on 9 reports) 11.1%
- King County(Based on 109 reports) 2.8%
- Washington(Based on 530 reports) 3.2%
Clear
- Kent(Based on 8 reports) 62.5%
- King County(Based on 102 reports) 62.7%
- Washington(Based on 493 reports) 66.5%
Fog, Smog, Smoke
- Kent(Based on 8 reports) 12.5%
- King County(Based on 102 reports) 2.0%
- Washington(Based on 493 reports) 2.4%
Rain
- Kent(Based on 8 reports) 12.5%
- King County(Based on 102 reports) 17.6%
- Washington(Based on 493 reports) 12.4%
Unknown
- Kent(Based on 8 reports) 12.5%
- King County(Based on 102 reports) 15.7%
- Washington(Based on 493 reports) 15.2%
| # | Date | Location | Vehicles | Drunk persons | Fatalites | Persons | Pedestrians |
|---|
| 1 | Feb 11, 2017 07:56 PM | Sr-99, S 252nd St | 2 | - | 1
| 4 | - |
| 2 | Apr 22, 2017 08:59 PM | Sr-99 | 1 | - | 1
| 1 | 1 |
| 3 | Apr 14, 2017 03:53 AM | Sr-181, S 216th St | 2 | - | 1
| 2 | - |
| 4 | Jul 11, 2017 03:39 AM | 145 Ave Se | 1 | 1
| 1 | 1 | - |
| 5 | Jul 16, 2017 03:38 AM | I-5 | 1 | 1
| 1 | 1 | - |
| 6 | Aug 23, 2017 06:48 AM | Sr-99, S 240 St | 4 | - | 1
| 5 | - |
| 7 | Aug 17, 2017 08:28 PM | Military Rd S | 2 | 1
| 1 | 2 | - |
| 8 | Nov 25, 2017 07:17 PM | Sr-515 | 1 | 1
| 1 | 1 | - |
| 9 | Dec 8, 2017 00:42 AM | Sr-181, S 196th St | 2 | 1
| 1 | 3 | - |
Kent fatal car crash and road traffic accident list for 2016
- Fatal accident count11
- Vehicles involved in fatal accidents13
- Fatal accidents involving drunk persons2
- Fatalities12
- Persons involved in fatal accidents19
- Pedestrians involved in fatal accidents6
Average EMS response time
- Kent(Based on 3 reports) 5.7 mins
- King County(Based on 32 reports) 12.1 mins
- Washington(Based on 110 reports) 19.3 mins
Dark - Lighted
- Kent(Based on 11 reports) 45.5%
- King County(Based on 96 reports) 37.5%
- Washington(Based on 500 reports) 22.6%
Daylight
- Kent(Based on 11 reports) 36.4%
- King County(Based on 96 reports) 47.9%
- Washington(Based on 500 reports) 50.4%
Dark - Not Lighted
- Kent(Based on 11 reports) 9.1%
- King County(Based on 96 reports) 9.4%
- Washington(Based on 500 reports) 21.8%
Dusk
- Kent(Based on 11 reports) 9.1%
- King County(Based on 96 reports) 4.2%
- Washington(Based on 500 reports) 3.0%
Clear
- Kent(Based on 11 reports) 63.6%
- King County(Based on 94 reports) 62.8%
- Washington(Based on 489 reports) 68.5%
Rain
- Kent(Based on 11 reports) 36.4%
- King County(Based on 94 reports) 13.8%
- Washington(Based on 489 reports) 12.9%
| # | Date | Location | Vehicles | Drunk persons | Fatalites | Persons | Pedestrians |
|---|
| 1 | Feb 24, 2016 07:33 PM | Sr-99 | 1 | - | 1
| 1 | 1 |
| 2 | Mar 13, 2016 07:27 PM | Sr-516, Weiland St | 2 | - | 2
| 4 | - |
| 3 | Mar 29, 2016 05:48 AM | S 240th St, 94th Ave S | 1 | - | 1
| 1 | 1 |
| 4 | May 3, 2016 01:39 PM | Sr-515 | 1 | - | 1
| 1 | 1 |
| 5 | Jun 9, 2016 02:15 PM | 84th Ave S, S 200th St | 2 | - | 1
| 3 | - |
| 6 | Sep 9, 2016 05:43 PM | Sr-515 | 1 | - | 1
| 1 | 1 |
| 7 | Oct 25, 2016 07:12 PM | Sr-516, 141st Ave Se | 1 | - | 1
| 1 | 1 |
| 8 | Oct 29, 2016 12:14 AM | Se 277th St | 1 | - | 1
| 1 | - |
| 9 | Nov 19, 2016 06:22 PM | Se 240 St | 1 | - | 1
| 2 | 1 |
| 10 | Dec 12, 2016 10:32 PM | 64th Ave S, S 238th Pl | 1 | 1
| 1 | 3 | - |
| 11 | Dec 27, 2016 01:50 AM | 116th Ave Se, Se 208th St | 1 | 1
| 1 | 1 | - |
Kent fatal car crash and road traffic accident list for 2015
- Fatal accident count8
- Vehicles involved in fatal accidents10
- Fatal accidents involving drunk persons4
- Fatalities9
- Persons involved in fatal accidents16
- Pedestrians involved in fatal accidents1
Dark - Lighted
- Kent(Based on 7 reports) 42.9%
- King County(Based on 99 reports) 37.4%
- Washington(Based on 496 reports) 19.2%
Daylight
- Kent(Based on 7 reports) 28.6%
- King County(Based on 99 reports) 41.4%
- Washington(Based on 496 reports) 51.4%
Dark - Not Lighted
- Kent(Based on 7 reports) 28.6%
- King County(Based on 99 reports) 18.2%
- Washington(Based on 496 reports) 24.2%
Clear
- Kent(Based on 8 reports) 75.0%
- King County(Based on 100 reports) 71.0%
- Washington(Based on 493 reports) 70.4%
Unknown
- Kent(Based on 8 reports) 12.5%
- King County(Based on 100 reports) 15.0%
- Washington(Based on 493 reports) 12.8%
Rain
- Kent(Based on 8 reports) 12.5%
- King County(Based on 100 reports) 14.0%
- Washington(Based on 493 reports) 12.6%
| # | Date | Location | Vehicles | Drunk persons | Fatalites | Persons | Pedestrians |
|---|
| 1 | Apr 24, 2015 09:02 PM | S 259th St | 1 | 1
| 1 | 1 | - |
| 2 | Jun 16, 2015 08:18 AM | Sr-99, Private Rd | 1 | - | 1
| 2 | - |
| 3 | Aug 13, 2015 11:15 PM | Sr-167 | 2 | - | 1
| 3 | - |
| 4 | Sep 16, 2015 87:99 PM | Sr-516, 124th Ave Se | 1 | 1
| 2 | 2 | - |
| 5 | Oct 2, 2015 05:27 PM | 84th Ave S | 1 | 1
| 1 | 1 | - |
| 6 | Nov 12, 2015 11:09 PM | Sr-99 | 1 | - | 1
| 1 | 1 |
| 7 | Dec 11, 2015 11:00 PM | I-5 | 1 | 1
| 1 | 1 | - |
| 8 | Dec 26, 2015 03:45 AM | S 196th St, 72 Ave S | 2 | - | 1
| 5 | - |
Kent fatal car crash and road traffic accident list for 2014
- Fatal accident count5
- Vehicles involved in fatal accidents8
- Fatalities5
- Persons involved in fatal accidents9
- Pedestrians involved in fatal accidents5
Daylight
- Kent(Based on 5 reports) 60.0%
- King County(Based on 77 reports) 41.6%
- Washington(Based on 425 reports) 50.1%
Dark - Lighted
- Kent(Based on 5 reports) 20.0%
- King County(Based on 77 reports) 45.5%
- Washington(Based on 425 reports) 22.4%
Dusk
- Kent(Based on 5 reports) 20.0%
- King County(Based on 77 reports) 2.6%
- Washington(Based on 425 reports) 2.4%
Clear
- Kent(Based on 5 reports) 60.0%
- King County(Based on 77 reports) 64.9%
- Washington(Based on 422 reports) 69.7%
Rain
- Kent(Based on 5 reports) 40.0%
- King County(Based on 77 reports) 18.2%
- Washington(Based on 422 reports) 9.7%
Kent fatal car crash and road traffic accident list for 2013
- Fatal accident count5
- Vehicles involved in fatal accidents9
- Fatal accidents involving drunk persons2
- Fatalities5
- Persons involved in fatal accidents14
Daylight
- Kent(Based on 5 reports) 40.0%
- King County(Based on 77 reports) 42.9%
- Washington(Based on 397 reports) 47.9%
Dark - Lighted
- Kent(Based on 5 reports) 40.0%
- King County(Based on 77 reports) 36.4%
- Washington(Based on 397 reports) 22.7%
Dark - Not Lighted
- Kent(Based on 5 reports) 20.0%
- King County(Based on 77 reports) 19.5%
- Washington(Based on 397 reports) 24.9%
Clear
- Kent(Based on 5 reports) 40.0%
- King County(Based on 76 reports) 57.9%
- Washington(Based on 396 reports) 64.4%
Unknown
- Kent(Based on 5 reports) 40.0%
- King County(Based on 76 reports) 28.9%
- Washington(Based on 396 reports) 22.2%
Rain
- Kent(Based on 5 reports) 20.0%
- King County(Based on 76 reports) 7.9%
- Washington(Based on 396 reports) 8.6%
Kent fatal car crash and road traffic accident list for 2012
- Fatal accident count6
- Vehicles involved in fatal accidents9
- Fatal accidents involving drunk persons4
- Fatalities6
- Persons involved in fatal accidents10
- Pedestrians involved in fatal accidents2
Average EMS response time
- Kent(Based on 3 reports) 5.3 mins
- King County(Based on 45 reports) 5.3 mins
- Washington(Based on 155 reports) 8.0 mins
Dark - Lighted
- Kent(Based on 6 reports) 66.7%
- King County(Based on 84 reports) 38.1%
- Washington(Based on 398 reports) 17.8%
Daylight
- Kent(Based on 6 reports) 33.3%
- King County(Based on 84 reports) 39.3%
- Washington(Based on 398 reports) 48.2%
Unknown
- Kent(Based on 6 reports) 50.0%
- King County(Based on 85 reports) 23.5%
- Washington(Based on 399 reports) 15.0%
Clear
- Kent(Based on 6 reports) 33.3%
- King County(Based on 85 reports) 63.5%
- Washington(Based on 399 reports) 66.9%
Rain
- Kent(Based on 6 reports) 16.7%
- King County(Based on 85 reports) 12.9%
- Washington(Based on 399 reports) 13.3%
Kent fatal car crash and road traffic accident list for 2011
- Fatal accident count5
- Vehicles involved in fatal accidents8
- Fatal accidents involving drunk persons3
- Fatalities5
- Persons involved in fatal accidents11
- Pedestrians involved in fatal accidents2
Average EMS response time
- Kent(Based on 4 reports) 5.0 mins
- King County(Based on 60 reports) 6.0 mins
- Washington(Based on 312 reports) 8.1 mins
Daylight
- Kent(Based on 5 reports) 40.0%
- King County(Based on 71 reports) 46.5%
- Washington(Based on 423 reports) 48.2%
Dark - Lighted
- Kent(Based on 5 reports) 40.0%
- King County(Based on 71 reports) 32.4%
- Washington(Based on 423 reports) 17.7%
Dark - Not Lighted
- Kent(Based on 5 reports) 20.0%
- King County(Based on 71 reports) 18.3%
- Washington(Based on 423 reports) 30.5%
Unknown
- Kent(Based on 5 reports) 60.0%
- King County(Based on 69 reports) 24.6%
- Washington(Based on 421 reports) 16.9%
Clear
- Kent(Based on 5 reports) 40.0%
- King County(Based on 69 reports) 68.1%
- Washington(Based on 421 reports) 72.2%
Kent fatal car crash and road traffic accident list for 2010
- Fatal accident count13
- Vehicles involved in fatal accidents24
- Fatal accidents involving drunk persons6
- Fatalities15
- Persons involved in fatal accidents40
- Pedestrians involved in fatal accidents2
Average EMS response time
- Kent(Based on 12 reports) 5.6 mins
- King County(Based on 75 reports) 5.7 mins
- Washington(Based on 398 reports) 8.8 mins
Average hospital transport time
- Kent(Based on 3 reports) 50.7 mins
- King County(Based on 17 reports) 43.9 mins
- Washington(Based on 127 reports) 37.7 mins
Daylight
- Kent(Based on 13 reports) 38.5%
- King County(Based on 78 reports) 38.5%
- Washington(Based on 420 reports) 47.1%
Dark - Not Lighted
- Kent(Based on 13 reports) 23.1%
- King County(Based on 78 reports) 15.4%
- Washington(Based on 420 reports) 27.1%
Dark - Lighted
- Kent(Based on 13 reports) 15.4%
- King County(Based on 78 reports) 39.7%
- Washington(Based on 420 reports) 21.7%
Dusk
- Kent(Based on 13 reports) 15.4%
- King County(Based on 78 reports) 2.6%
- Washington(Based on 420 reports) 2.1%
Dawn
- Kent(Based on 13 reports) 7.7%
- King County(Based on 78 reports) 2.6%
- Washington(Based on 420 reports) 1.2%
Clear
- Kent(Based on 13 reports) 61.5%
- King County(Based on 78 reports) 57.7%
- Washington(Based on 418 reports) 63.2%
Unknown
- Kent(Based on 13 reports) 30.8%
- King County(Based on 78 reports) 29.5%
- Washington(Based on 418 reports) 20.1%
Fog, Smog, Smoke
- Kent(Based on 13 reports) 7.7%
- King County(Based on 78 reports) 1.3%
- Washington(Based on 418 reports) 2.4%
| # | Date | Location | Vehicles | Drunk persons | Fatalites | Persons | Pedestrians |
|---|
| 1 | Jan 3, 2010 03:58 AM | 64th Ave S | 1 | 1
| 1 | 4 | - |
| 2 | Jan 9, 2010 03:34 PM | Washington Ave N, W Morton St | 2 | - | 1
| 2 | - |
| 3 | Apr 22, 2010 00:24 AM | 144 Ave Se | 1 | 1
| 1 | 1 | - |
| 4 | Jun 5, 2010 04:35 AM | Sr-167 | 3 | - | 1
| 4 | - |
| 5 | Apr 5, 2010 05:24 PM | Sr-167 | 2 | - | 1
| 3 | - |
| 6 | Jul 14, 2010 05:30 PM | 68 Ave S | 2 | - | 1
| 2 | - |
| 7 | Aug 24, 2010 08:45 PM | Sr-515, Se 208th St | 3 | - | 2
| 4 | - |
| 8 | Sep 14, 2010 05:01 PM | S 272, 46 Ave S | 2 | - | 1
| 2 | - |
| 9 | Sep 25, 2010 07:30 PM | 108 Ave Se | 1 | - | 1
| 1 | 1 |
| 10 | Oct 3, 2010 05:25 AM | Sr-516, Meeker St | 1 | 1
| 1 | 3 | 1 |
| 11 | Oct 16, 2010 09:44 AM | 108th Ave Se, Se 208th Se | 2 | - | 1
| 5 | - |
| 12 | Dec 17, 2010 11:41 PM | Se 274 Way | 1 | 1
| 1 | 5 | - |
| 13 | Dec 5, 2010 03:09 AM | Sr-516 | 3 | 2
| 2 | 4 | - |
Kent fatal car crash and road traffic accident list for 2009
| # | Date | Location | Vehicles | Drunk persons | Fatalites | Persons | Pedestrians |
|---|
| 1 | Dec 16, 2009 05:49 PM | Sr-515 | 1 | - | 1
| 2 | 1 |
Kent fatal car crash and road traffic accident list for 2008
| # | Date | Location | Vehicles | Drunk persons | Fatalites | Persons | Pedestrians |
|---|
| 1 | Mar 12, 2008 10:41 PM | Sr-516 | 1 | 1
| 1 | 2 | 1 |
| 2 | Sep 10, 2008 00:24 AM | Sr-99, S 244th St | 1 | 1
| 1 | 1 | - |
| 3 | Dec 1, 2008 03:44 AM | 76th Ave S | 1 | - | 1
| 1 | - |
Kent fatal car crash and road traffic accident list for 2007
- Fatal accident count6
- Vehicles involved in fatal accidents12
- Fatal accidents involving drunk persons1
- Fatalities7
- Persons involved in fatal accidents10
Average EMS response time
- Kent(Based on 6 reports) 6.7 mins
- King County(Based on 75 reports) 5.6 mins
- Washington(Based on 417 reports) 8.8 mins
Average hospital transport time
- Kent(Based on 2 reports) 69.0 mins
- King County(Based on 38 reports) 57.6 mins
- Washington(Based on 196 reports) 60.7 mins
Dark - Lighted
- Kent(Based on 6 reports) 50.0%
- King County(Based on 90 reports) 31.1%
- Washington(Based on 529 reports) 18.3%
Dark - Not Lighted
- Kent(Based on 6 reports) 33.3%
- King County(Based on 90 reports) 13.3%
- Washington(Based on 529 reports) 26.8%
Daylight
- Kent(Based on 6 reports) 16.7%
- King County(Based on 90 reports) 53.3%
- Washington(Based on 529 reports) 50.3%
Clear
- Kent(Based on 6 reports) 83.3%
- King County(Based on 90 reports) 85.6%
- Washington(Based on 531 reports) 86.6%
Rain
- Kent(Based on 6 reports) 16.7%
- King County(Based on 90 reports) 11.1%
- Washington(Based on 531 reports) 9.6%
| # | Date | Location | Vehicles | Drunk persons | Fatalites | Persons | Pedestrians |
|---|
| 1 | Mar 24, 2007 01:25 AM | Sr-167 | 1 | - | 2
| 2 | - |
| 2 | May 2, 2007 10:19 PM | I-5 | 1 | - | 1
| 1 | - |
| 3 | May 1, 2007 12:37 AM | I-5 | 2 | - | 1
| 1 | - |
| 4 | Jul 24, 2007 01:00 AM | Auburn Wy N | 1 | - | 1
| 3 | - |
| 5 | Nov 13, 2007 07:58 PM | Lake Fenwick Rd S | 6 | - | 1
| 2 | - |
| 6 | Dec 9, 2007 11:37 PM | Sr-515, Sr-516 | 1 | 1
| 1 | 1 | - |
Kent fatal car crash and road traffic accident list for 2006
- Fatal accident count5
- Vehicles involved in fatal accidents9
- Fatal accidents involving drunk persons4
- Fatalities5
- Persons involved in fatal accidents13
- Pedestrians involved in fatal accidents1
Average EMS response time
- Kent(Based on 5 reports) 5.2 mins
- King County(Based on 96 reports) 5.8 mins
- Washington(Based on 445 reports) 8.3 mins
Dark - Not Lighted
- Kent(Based on 5 reports) 60.0%
- King County(Based on 120 reports) 23.3%
- Washington(Based on 573 reports) 29.0%
Daylight
- Kent(Based on 5 reports) 20.0%
- King County(Based on 120 reports) 42.5%
- Washington(Based on 573 reports) 49.2%
Dark - Lighted
- Kent(Based on 5 reports) 20.0%
- King County(Based on 120 reports) 30.8%
- Washington(Based on 573 reports) 18.0%
Clear
- Kent(Based on 5 reports) 80.0%
- King County(Based on 120 reports) 82.5%
- Washington(Based on 578 reports) 86.5%
Fog, Smog, Smoke
- Kent(Based on 5 reports) 20.0%
- King County(Based on 120 reports) 1.7%
- Washington(Based on 578 reports) 0.9%
| # | Date | Location | Vehicles | Drunk persons | Fatalites | Persons | Pedestrians |
|---|
| 1 | Mar 24, 2006 02:32 AM | 132nd Ave Se | 1 | - | 1
| 1 | - |
| 2 | Aug 19, 2006 04:23 AM | Sr-516 | 1 | 1
| 1 | 2 | 1 |
| 3 | Sep 22, 2006 02:03 AM | S 272nd St | 2 | 1
| 1 | 2 | - |
| 4 | Oct 21, 2006 05:23 AM | N Valley Hwy | 2 | 1
| 1 | 2 | - |
| 5 | Jul 23, 2006 87:99 PM | S 277th St | 3 | 1
| 1 | 6 | - |
Kent fatal car crash and road traffic accident list for 2005
- Fatal accident count10
- Vehicles involved in fatal accidents18
- Fatal accidents involving drunk persons2
- Fatalities10
- Persons involved in fatal accidents29
- Pedestrians involved in fatal accidents4
Average EMS response time
- Kent(Based on 9 reports) 5.7 mins
- King County(Based on 86 reports) 5.4 mins
- Washington(Based on 355 reports) 7.9 mins
Average hospital transport time
- Kent(Based on 7 reports) 46.0 mins
- King County(Based on 53 reports) 46.2 mins
- Washington(Based on 207 reports) 55.5 mins
Daylight
- Kent(Based on 10 reports) 60.0%
- King County(Based on 121 reports) 46.3%
- Washington(Based on 579 reports) 49.9%
Dark - Lighted
- Kent(Based on 10 reports) 30.0%
- King County(Based on 121 reports) 31.4%
- Washington(Based on 579 reports) 16.2%
Dark - Not Lighted
- Kent(Based on 10 reports) 10.0%
- King County(Based on 121 reports) 19.8%
- Washington(Based on 579 reports) 29.4%
Clear
- Kent(Based on 10 reports) 90.0%
- King County(Based on 122 reports) 85.2%
- Washington(Based on 580 reports) 84.1%
Rain
- Kent(Based on 10 reports) 10.0%
- King County(Based on 122 reports) 13.1%
- Washington(Based on 580 reports) 10.9%
| # | Date | Location | Vehicles | Drunk persons | Fatalites | Persons | Pedestrians |
|---|
| 1 | Jan 28, 2005 11:07 PM | Sr-99, Sr-516 | 2 | - | 1
| 4 | - |
| 2 | Jan 1, 2005 02:43 AM | E Valley Hwy | 1 | - | 1
| 2 | 1 |
| 3 | Mar 13, 2005 04:28 AM | I-5 | 2 | 1
| 1 | 3 | - |
| 4 | Apr 9, 2005 09:57 PM | Sr-167 | 1 | - | 1
| 2 | 1 |
| 5 | Jan 30, 2005 10:52 AM | Se 240th St, 116th Ave Se | 3 | - | 1
| 5 | - |
| 6 | Jun 2, 2005 01:55 PM | S 212th St | 1 | - | 1
| 2 | 1 |
| 7 | Aug 19, 2005 03:59 PM | Se Kent-Kangley Rd | 2 | - | 1
| 3 | - |
| 8 | Sep 8, 2005 04:54 PM | I-5 | 3 | - | 1
| 3 | - |
| 9 | Nov 26, 2005 06:45 PM | Sr-99 | 1 | 1
| 1 | 2 | 1 |
| 10 | Nov 16, 2005 06:10 PM | E James St, Hazel Ave N | 2 | - | 1
| 3 | - |
Kent fatal car crash and road traffic accident list for 2004
- Fatal accident count6
- Vehicles involved in fatal accidents10
- Fatal accidents involving drunk persons3
- Fatalities6
- Persons involved in fatal accidents20
- Pedestrians involved in fatal accidents3
Average EMS response time
- Kent(Based on 6 reports) 5.5 mins
- King County(Based on 93 reports) 5.9 mins
- Washington(Based on 416 reports) 9.3 mins
Average hospital transport time
- Kent(Based on 6 reports) 37.0 mins
- King County(Based on 69 reports) 57.3 mins
- Washington(Based on 281 reports) 55.4 mins
Daylight
- Kent(Based on 6 reports) 50.0%
- King County(Based on 102 reports) 51.0%
- Washington(Based on 506 reports) 50.2%
Dark - Not Lighted
- Kent(Based on 6 reports) 33.3%
- King County(Based on 102 reports) 19.6%
- Washington(Based on 506 reports) 30.4%
Dark - Lighted
- Kent(Based on 6 reports) 16.7%
- King County(Based on 102 reports) 24.5%
- Washington(Based on 506 reports) 15.0%
Clear
- Kent(Based on 6 reports) 50.0%
- King County(Based on 102 reports) 86.3%
- Washington(Based on 509 reports) 86.8%
Rain
- Kent(Based on 6 reports) 50.0%
- King County(Based on 102 reports) 11.8%
- Washington(Based on 509 reports) 9.6%
| # | Date | Location | Vehicles | Drunk persons | Fatalites | Persons | Pedestrians |
|---|
| 1 | Jan 24, 2004 06:14 AM | 68th Ave S, 196th St | 2 | 1
| 1 | 3 | - |
| 2 | Mar 4, 2004 04:55 PM | Sr-515, Se 232th Pl | 1 | 1
| 1 | 1 | - |
| 3 | Mar 31, 2004 11:08 AM | 124th Ave Se, Kent Kangley Rd | 2 | - | 1
| 2 | - |
| 4 | May 23, 2004 05:12 PM | 68th Ave S, S 212th St | 2 | - | 1
| 4 | - |
| 5 | May 29, 2004 10:20 PM | Pacific Hwy S | 2 | 1
| 1 | 4 | - |
| 6 | Sep 13, 2004 05:20 AM | I-5 | 1 | - | 1
| 6 | 3 |
Kent fatal car crash and road traffic accident list for 2003
- Fatal accident count6
- Vehicles involved in fatal accidents7
- Fatal accidents involving drunk persons2
- Fatalities6
- Persons involved in fatal accidents13
- Pedestrians involved in fatal accidents3
Average EMS response time
- Kent(Based on 6 reports) 5.0 mins
- King County(Based on 93 reports) 5.9 mins
- Washington(Based on 446 reports) 9.3 mins
Average hospital transport time
- Kent(Based on 6 reports) 75.5 mins
- King County(Based on 78 reports) 46.7 mins
- Washington(Based on 327 reports) 52.5 mins
Dark - Lighted
- Kent(Based on 6 reports) 33.3%
- King County(Based on 97 reports) 44.3%
- Washington(Based on 532 reports) 18.0%
Daylight
- Kent(Based on 6 reports) 33.3%
- King County(Based on 97 reports) 39.2%
- Washington(Based on 532 reports) 49.8%
Dark - Not Lighted
- Kent(Based on 6 reports) 33.3%
- King County(Based on 97 reports) 13.4%
- Washington(Based on 532 reports) 27.4%
Clear
- Kent(Based on 6 reports) 83.3%
- King County(Based on 98 reports) 85.7%
- Washington(Based on 539 reports) 83.7%
Rain
- Kent(Based on 6 reports) 16.7%
- King County(Based on 98 reports) 11.2%
- Washington(Based on 539 reports) 10.9%
| # | Date | Location | Vehicles | Drunk persons | Fatalites | Persons | Pedestrians |
|---|
| 1 | Mar 24, 2003 08:35 PM | S 212th St | 2 | - | 1
| 4 | - |
| 2 | Apr 11, 2003 12:03 AM | E Smith St | 1 | - | 1
| 2 | 1 |
| 3 | Jun 28, 2003 06:35 PM | 116th Ave Se | 1 | 1
| 1 | 1 | - |
| 4 | Jul 22, 2003 00:39 AM | Central Ave N | 1 | - | 1
| 2 | 1 |
| 5 | Oct 27, 2003 11:51 PM | Se 240th St | 1 | 1
| 1 | 1 | - |
| 6 | Nov 28, 2003 07:55 PM | I-5 | 1 | - | 1
| 3 | 1 |
Kent fatal car crash and road traffic accident list for 2002
- Fatal accident count10
- Vehicles involved in fatal accidents18
- Fatal accidents involving drunk persons4
- Fatalities10
- Persons involved in fatal accidents27
- Pedestrians involved in fatal accidents5
Average EMS response time
- Kent(Based on 10 reports) 4.8 mins
- King County(Based on 94 reports) 5.7 mins
- Washington(Based on 548 reports) 9.3 mins
Average hospital transport time
- Kent(Based on 7 reports) 46.3 mins
- King County(Based on 67 reports) 49.3 mins
- Washington(Based on 415 reports) 54.2 mins
Daylight
- Kent(Based on 10 reports) 70.0%
- King County(Based on 96 reports) 43.8%
- Washington(Based on 583 reports) 47.2%
Dark - Lighted
- Kent(Based on 10 reports) 20.0%
- King County(Based on 96 reports) 35.4%
- Washington(Based on 583 reports) 14.8%
Dark - Not Lighted
- Kent(Based on 10 reports) 10.0%
- King County(Based on 96 reports) 17.7%
- Washington(Based on 583 reports) 34.5%
Clear
- Kent(Based on 10 reports) 90.0%
- King County(Based on 96 reports) 83.3%
- Washington(Based on 586 reports) 87.0%
Rain
- Kent(Based on 10 reports) 10.0%
- King County(Based on 96 reports) 13.5%
- Washington(Based on 586 reports) 8.5%
| # | Date | Location | Vehicles | Drunk persons | Fatalites | Persons | Pedestrians |
|---|
| 1 | Jan 28, 2002 09:25 PM | Sr-516 | 3 | 1
| 1 | 3 | - |
| 2 | Jan 21, 2002 04:47 PM | Central Av S | 1 | - | 1
| 3 | 2 |
| 3 | Mar 2, 2002 11:35 PM | 84th St | 2 | 1
| 1 | 2 | - |
| 4 | Mar 12, 2002 10:40 AM | Sr-515 | 3 | - | 1
| 6 | - |
| 5 | May 5, 2002 07:20 AM | Se 240th St | 2 | 1
| 1 | 2 | - |
| 6 | Jun 13, 2002 09:39 AM | Washington Ave S | 1 | - | 1
| 2 | 1 |
| 7 | Jun 29, 2002 03:59 AM | Sr-181 | 2 | 1
| 1 | 2 | - |
| 8 | Aug 13, 2002 05:50 PM | Sr-167 | 2 | - | 1
| 3 | - |
| 9 | Sep 10, 2002 06:53 PM | Se 248th St | 1 | - | 1
| 2 | 1 |
| 10 | Sep 28, 2002 02:49 AM | I-5 | 1 | - | 1
| 2 | 1 |
Kent fatal car crash and road traffic accident list for 2001
- Fatal accident count7
- Vehicles involved in fatal accidents11
- Fatal accidents involving drunk persons5
- Fatalities8
- Persons involved in fatal accidents18
- Pedestrians involved in fatal accidents3
Average EMS response time
- Kent(Based on 7 reports) 5.1 mins
- King County(Based on 104 reports) 5.6 mins
- Washington(Based on 521 reports) 8.4 mins
Average hospital transport time
- Kent(Based on 5 reports) 45.4 mins
- King County(Based on 86 reports) 50.4 mins
- Washington(Based on 411 reports) 53.4 mins
Dark - Lighted
- Kent(Based on 7 reports) 71.4%
- King County(Based on 107 reports) 36.4%
- Washington(Based on 567 reports) 17.3%
Daylight
- Kent(Based on 7 reports) 28.6%
- King County(Based on 107 reports) 39.3%
- Washington(Based on 567 reports) 48.3%
Clear
- Kent(Based on 7 reports) 57.1%
- King County(Based on 107 reports) 86.0%
- Washington(Based on 568 reports) 82.0%
Rain
- Kent(Based on 7 reports) 42.9%
- King County(Based on 107 reports) 12.1%
- Washington(Based on 568 reports) 13.9%
| # | Date | Location | Vehicles | Drunk persons | Fatalites | Persons | Pedestrians |
|---|
| 1 | Feb 14, 2001 03:32 PM | 68aves | 2 | 1
| 1 | 2 | - |
| 2 | Feb 15, 2001 06:32 AM | 84thaves | 2 | - | 1
| 2 | - |
| 3 | Mar 24, 2001 07:41 PM | Sr-515 | 1 | 1
| 1 | 2 | 1 |
| 4 | Aug 22, 2001 03:45 PM | Militaryrds | 1 | - | 1
| 3 | 2 |
| 5 | Jul 28, 2001 01:36 AM | S212thst | 2 | - | 2
| 3 | - |
| 6 | Aug 4, 2001 02:01 AM | Wjamesst | 2 | 2
| 1 | 5 | - |
| 7 | Dec 24, 2001 00:48 AM | Se240thst | 1 | 1
| 1 | 1 | - |
Kent fatal car crash and road traffic accident list for 2000
- Fatal accident count5
- Vehicles involved in fatal accidents8
- Fatal accidents involving drunk persons2
- Fatalities5
- Persons involved in fatal accidents12
- Pedestrians involved in fatal accidents1
Average EMS response time
- Kent(Based on 4 reports) 5.3 mins
- King County(Based on 104 reports) 6.0 mins
- Washington(Based on 536 reports) 8.9 mins
Average hospital transport time
- Kent(Based on 5 reports) 70.2 mins
- King County(Based on 79 reports) 63.1 mins
- Washington(Based on 400 reports) 56.1 mins
Daylight
- Kent(Based on 5 reports) 60.0%
- King County(Based on 107 reports) 42.1%
- Washington(Based on 570 reports) 47.5%
Dark - Lighted
- Kent(Based on 5 reports) 20.0%
- King County(Based on 107 reports) 42.1%
- Washington(Based on 570 reports) 20.5%
Dark - Not Lighted
- Kent(Based on 5 reports) 20.0%
- King County(Based on 107 reports) 12.1%
- Washington(Based on 570 reports) 26.3%
Rain
- Kent(Based on 5 reports) 80.0%
- King County(Based on 107 reports) 18.7%
- Washington(Based on 572 reports) 14.0%
Clear
- Kent(Based on 5 reports) 20.0%
- King County(Based on 107 reports) 78.5%
- Washington(Based on 572 reports) 78.8%
| # | Date | Location | Vehicles | Drunk persons | Fatalites | Persons | Pedestrians |
|---|
| 1 | Feb 21, 2000 07:39 AM | Sekentkangleyrd | 2 | - | 1
| 2 | - |
| 2 | Jun 24, 2000 09:23 AM | S277thst | 1 | - | 1
| 1 | - |
| 3 | Aug 22, 2000 02:40 PM | 84thaves | 2 | - | 1
| 4 | - |
| 4 | Sep 29, 2000 09:54 PM | Sr-167 | 1 | - | 1
| 2 | 1 |
| 5 | Dec 27, 2000 00:30 AM | Sr-167 | 2 | 2
| 1 | 3 | - |
Kent fatal car crash and road traffic accident list for 1999
- Fatal accident count4
- Vehicles involved in fatal accidents4
- Fatalities4
- Persons involved in fatal accidents5
- Pedestrians involved in fatal accidents1
Average EMS response time
- Kent(Based on 4 reports) 5.8 mins
- King County(Based on 88 reports) 5.5 mins
- Washington(Based on 539 reports) 8.2 mins
Average hospital transport time
- Kent(Based on 2 reports) 100.0 mins
- King County(Based on 60 reports) 51.3 mins
- Washington(Based on 404 reports) 50.8 mins
Daylight
- Kent(Based on 4 reports) 50.0%
- King County(Based on 91 reports) 38.5%
- Washington(Based on 572 reports) 50.5%
Dark - Lighted
- Kent(Based on 4 reports) 25.0%
- King County(Based on 91 reports) 42.9%
- Washington(Based on 572 reports) 15.9%
Dark - Not Lighted
- Kent(Based on 4 reports) 25.0%
- King County(Based on 91 reports) 14.3%
- Washington(Based on 572 reports) 28.5%
Clear
- Kent(Based on 4 reports) 75.0%
- King County(Based on 91 reports) 75.8%
- Washington(Based on 574 reports) 80.5%
Rain
- Kent(Based on 4 reports) 25.0%
- King County(Based on 91 reports) 20.9%
- Washington(Based on 574 reports) 15.0%
| # | Date | Location | Vehicles | Drunk persons | Fatalites | Persons | Pedestrians |
|---|
| 1 | Mar 27, 1999 09:45 AM | Sr-18 | 1 | - | 1
| 1 | - |
| 2 | May 8, 1999 09:18 PM | Sr-515 | 1 | - | 1
| 2 | 1 |
| 3 | Nov 25, 1999 06:20 AM | Sr-167 | 1 | - | 1
| 1 | - |
| 4 | Oct 16, 1999 11:40 AM | Wwillisst | 1 | - | 1
| 1 | - |
Kent fatal car crash and road traffic accident list for 1998
- Fatal accident count9
- Vehicles involved in fatal accidents13
- Fatal accidents involving drunk persons2
- Fatalities9
- Persons involved in fatal accidents20
- Pedestrians involved in fatal accidents4
Average EMS response time
- Kent(Based on 8 reports) 5.8 mins
- King County(Based on 95 reports) 5.5 mins
- Washington(Based on 522 reports) 8.2 mins
Average hospital transport time
- Kent(Based on 4 reports) 39.8 mins
- King County(Based on 54 reports) 52.2 mins
- Washington(Based on 363 reports) 49.4 mins
Daylight
- Kent(Based on 9 reports) 44.4%
- King County(Based on 107 reports) 51.4%
- Washington(Based on 590 reports) 50.8%
Dark - Lighted
- Kent(Based on 9 reports) 33.3%
- King County(Based on 107 reports) 27.1%
- Washington(Based on 590 reports) 16.9%
Dawn
- Kent(Based on 9 reports) 11.1%
- King County(Based on 107 reports) 1.9%
- Washington(Based on 590 reports) 1.2%
Dark - Not Lighted
- Kent(Based on 9 reports) 11.1%
- King County(Based on 107 reports) 18.7%
- Washington(Based on 590 reports) 29.3%
Clear
- Kent(Based on 9 reports) 88.9%
- King County(Based on 107 reports) 77.6%
- Washington(Based on 590 reports) 81.7%
Rain
- Kent(Based on 9 reports) 11.1%
- King County(Based on 107 reports) 19.6%
- Washington(Based on 590 reports) 13.2%
| # | Date | Location | Vehicles | Drunk persons | Fatalites | Persons | Pedestrians |
|---|
| 1 | May 29, 1998 03:45 AM | Sr-99 | 1 | - | 1
| 2 | 1 |
| 2 | Jul 15, 1998 04:56 AM | Sr-99 | 1 | - | 1
| 2 | 1 |
| 3 | Jul 20, 1998 11:29 AM | S216thst | 2 | - | 1
| 2 | - |
| 4 | Jul 23, 1998 03:42 AM | Sr-99 | 1 | - | 1
| 2 | 1 |
| 5 | Aug 4, 1998 00:27 AM | Sr-516 | 2 | 1
| 1 | 2 | - |
| 6 | Sep 18, 1998 03:20 AM | Sr-167 | 1 | 1
| 1 | 1 | - |
| 7 | Mar 11, 1998 03:15 PM | Scentral | 1 | - | 1
| 2 | 1 |
| 8 | Jan 25, 1998 12:08 AM | Westvalleyhwy | 2 | - | 1
| 5 | - |
| 9 | Oct 15, 1998 01:00 PM | Sr-181 | 2 | - | 1
| 2 | - |
Kent fatal car crash and road traffic accident list for 1997
- Fatal accident count4
- Vehicles involved in fatal accidents6
- Fatal accidents involving drunk persons1
- Fatalities4
- Persons involved in fatal accidents7
- Pedestrians involved in fatal accidents1
Average EMS response time
- Kent(Based on 3 reports) 6.0 mins
- King County(Based on 103 reports) 5.7 mins
- Washington(Based on 537 reports) 8.3 mins
Average hospital transport time
- Kent(Based on 2 reports) 98.0 mins
- King County(Based on 65 reports) 50.7 mins
- Washington(Based on 410 reports) 47.7 mins
Dark - Lighted
- Kent(Based on 4 reports) 75.0%
- King County(Based on 114 reports) 32.5%
- Washington(Based on 585 reports) 16.9%
Daylight
- Kent(Based on 4 reports) 25.0%
- King County(Based on 114 reports) 43.9%
- Washington(Based on 585 reports) 46.7%
Clear
- Kent(Based on 4 reports) 75.0%
- King County(Based on 114 reports) 78.9%
- Washington(Based on 587 reports) 79.6%
Rain
- Kent(Based on 4 reports) 25.0%
- King County(Based on 114 reports) 19.3%
- Washington(Based on 587 reports) 15.5%
| # | Date | Location | Vehicles | Drunk persons | Fatalites | Persons | Pedestrians |
|---|
| 1 | Feb 11, 1997 07:08 PM | 181 | 2 | - | 1
| 3 | 1 |
| 2 | Jun 3, 1997 09:55 PM | S228thst | 1 | 1
| 1 | 1 | - |
| 3 | Mar 21, 1997 12:35 AM | I5 | 1 | - | 1
| 1 | - |
| 4 | Dec 27, 1997 04:48 AM | 181 | 2 | - | 1
| 2 | - |
Kent fatal car crash and road traffic accident list for 1996
- Fatal accident count4
- Vehicles involved in fatal accidents6
- Fatal accidents involving drunk persons2
- Fatalities4
- Persons involved in fatal accidents9
- Pedestrians involved in fatal accidents2
Average EMS response time
- Kent(Based on 4 reports) 4.5 mins
- King County(Based on 115 reports) 6.1 mins
- Washington(Based on 572 reports) 7.7 mins
Average hospital transport time
- Kent(Based on 3 reports) 52.7 mins
- King County(Based on 68 reports) 48.8 mins
- Washington(Based on 414 reports) 48.6 mins
Dark - Lighted
- Kent(Based on 4 reports) 75.0%
- King County(Based on 120 reports) 26.7%
- Washington(Based on 643 reports) 13.8%
Daylight
- Kent(Based on 4 reports) 25.0%
- King County(Based on 120 reports) 41.7%
- Washington(Based on 643 reports) 48.8%
Clear
- Kent(Based on 4 reports) 75.0%
- King County(Based on 120 reports) 81.7%
- Washington(Based on 643 reports) 82.1%
Rain
- Kent(Based on 4 reports) 25.0%
- King County(Based on 120 reports) 15.0%
- Washington(Based on 643 reports) 12.3%
| # | Date | Location | Vehicles | Drunk persons | Fatalites | Persons | Pedestrians |
|---|
| 1 | Aug 12, 1996 07:00 PM | Jamesst | 2 | - | 1
| 3 | - |
| 2 | Jun 23, 1996 01:49 AM | 516 | 2 | 1
| 1 | 2 | - |
| 3 | Nov 25, 1996 06:30 PM | S252nd | 1 | 1
| 1 | 2 | 1 |
| 4 | Dec 11, 1996 09:45 PM | 99 | 1 | - | 1
| 2 | 1 |
Kent fatal car crash and road traffic accident list for 1995
- Fatal accident count8
- Vehicles involved in fatal accidents14
- Fatal accidents involving drunk persons2
- Fatalities8
- Persons involved in fatal accidents27
- Pedestrians involved in fatal accidents3
Average EMS response time
- Kent(Based on 8 reports) 5.5 mins
- King County(Based on 105 reports) 5.0 mins
- Washington(Based on 508 reports) 8.0 mins
Average hospital transport time
- Kent(Based on 2 reports) 65.0 mins
- King County(Based on 72 reports) 54.4 mins
- Washington(Based on 379 reports) 50.7 mins
Daylight
- Kent(Based on 8 reports) 62.5%
- King County(Based on 111 reports) 40.5%
- Washington(Based on 575 reports) 47.3%
Dark - Not Lighted
- Kent(Based on 8 reports) 25.0%
- King County(Based on 111 reports) 18.0%
- Washington(Based on 575 reports) 31.7%
Dark - Lighted
- Kent(Based on 8 reports) 12.5%
- King County(Based on 111 reports) 36.0%
- Washington(Based on 575 reports) 16.9%
Clear
- Kent(Based on 8 reports) 62.5%
- King County(Based on 111 reports) 76.6%
- Washington(Based on 576 reports) 84.7%
Rain
- Kent(Based on 8 reports) 37.5%
- King County(Based on 111 reports) 21.6%
- Washington(Based on 576 reports) 12.5%
| # | Date | Location | Vehicles | Drunk persons | Fatalites | Persons | Pedestrians |
|---|
| 1 | Jan 31, 1995 06:33 AM | 516 | 1 | - | 1
| 2 | 1 |
| 2 | May 23, 1995 07:35 PM | S228th | 2 | - | 1
| 6 | - |
| 3 | Jul 29, 1995 04:58 PM | I5 | 1 | 1
| 1 | 1 | - |
| 4 | Sep 17, 1995 05:18 PM | 167 | 1 | - | 1
| 3 | - |
| 5 | Sep 18, 1995 03:10 PM | 167 | 2 | 1
| 1 | 2 | - |
| 6 | Sep 19, 1995 09:52 AM | 167 | 4 | - | 1
| 5 | - |
| 7 | Sep 30, 1995 01:05 AM | 99 | 1 | - | 1
| 2 | 1 |
| 8 | Nov 23, 1995 05:30 AM | I5 | 2 | - | 1
| 6 | 1 |
Kent fatal car crash and road traffic accident list for 1994
- Fatal accident count7
- Vehicles involved in fatal accidents11
- Fatal accidents involving drunk persons4
- Fatalities7
- Persons involved in fatal accidents28
- Pedestrians involved in fatal accidents2
Average EMS response time
- Kent(Based on 6 reports) 4.3 mins
- King County(Based on 104 reports) 5.3 mins
- Washington(Based on 513 reports) 7.7 mins
Average hospital transport time
- Kent(Based on 4 reports) 54.3 mins
- King County(Based on 65 reports) 50.1 mins
- Washington(Based on 384 reports) 49.6 mins
Daylight
- Kent(Based on 7 reports) 42.9%
- King County(Based on 108 reports) 47.2%
- Washington(Based on 574 reports) 47.9%
Dark - Not Lighted
- Kent(Based on 7 reports) 42.9%
- King County(Based on 108 reports) 20.4%
- Washington(Based on 574 reports) 31.7%
Dark - Lighted
- Kent(Based on 7 reports) 14.3%
- King County(Based on 108 reports) 27.8%
- Washington(Based on 574 reports) 16.2%
Clear
- Kent(Based on 7 reports) 100.0%
- King County(Based on 108 reports) 81.5%
- Washington(Based on 575 reports) 84.2%
| # | Date | Location | Vehicles | Drunk persons | Fatalites | Persons | Pedestrians |
|---|
| 1 | Feb 16, 1994 11:01 PM | 516 | 3 | 2
| 1 | 4 | - |
| 2 | May 13, 1994 11:51 PM | 124thavese | 2 | - | 1
| 7 | - |
| 3 | Jul 30, 1994 02:30 AM | Fragerrd | 1 | 1
| 1 | 4 | - |
| 4 | May 30, 1994 00:15 AM | S218thst | 1 | 1
| 1 | 2 | - |
| 5 | Jul 14, 1994 12:15 AM | 516 | 2 | - | 1
| 7 | - |
| 6 | Aug 31, 1994 05:41 PM | Wjames | 1 | - | 1
| 2 | 1 |
| 7 | Sep 22, 1994 04:45 PM | Ejamesst | 1 | - | 1
| 2 | 1 |
Kent fatal car crash and road traffic accident list for 1993
| # | Date | Location | Vehicles | Drunk persons | Fatalites | Persons | Pedestrians |
|---|
| 1 | Apr 5, 1993 03:44 PM | 181 | 1 | - | 1
| 2 | 1 |
| 2 | Oct 2, 1993 11:30 PM | 516 | 1 | 1
| 1 | 2 | - |
| 3 | May 18, 1993 87:99 PM | Fragerrd | 1 | 1
| 1 | 1 | - |
Kent fatal car crash and road traffic accident list for 1992
- Fatal accident count6
- Vehicles involved in fatal accidents10
- Fatal accidents involving drunk persons3
- Fatalities6
- Persons involved in fatal accidents13
- Pedestrians involved in fatal accidents2
Average EMS response time
- Kent(Based on 6 reports) 3.8 mins
- King County(Based on 109 reports) 5.6 mins
- Washington(Based on 550 reports) 7.3 mins
Average hospital transport time
- Kent(Based on 6 reports) 49.5 mins
- King County(Based on 88 reports) 53.2 mins
- Washington(Based on 448 reports) 48.6 mins
Dark - Lighted
- Kent(Based on 6 reports) 50.0%
- King County(Based on 115 reports) 38.3%
- Washington(Based on 591 reports) 18.1%
Daylight
- Kent(Based on 6 reports) 33.3%
- King County(Based on 115 reports) 38.3%
- Washington(Based on 591 reports) 45.5%
Dark - Not Lighted
- Kent(Based on 6 reports) 16.7%
- King County(Based on 115 reports) 17.4%
- Washington(Based on 591 reports) 32.7%
Clear
- Kent(Based on 6 reports) 100.0%
- King County(Based on 115 reports) 76.5%
- Washington(Based on 592 reports) 84.1%
| # | Date | Location | Vehicles | Drunk persons | Fatalites | Persons | Pedestrians |
|---|
| 1 | Feb 8, 1992 10:58 PM | Russelrd | 1 | 1
| 1 | 1 | - |
| 2 | Mar 13, 1992 07:58 PM | 84thaves | 2 | 1
| 1 | 3 | - |
| 3 | Apr 10, 1992 11:22 PM | 99 | 1 | - | 1
| 2 | 1 |
| 4 | May 18, 1992 12:44 AM | 516 | 4 | - | 1
| 4 | - |
| 5 | Jun 12, 1992 07:30 PM | Fragerrd | 1 | 1
| 1 | 1 | - |
| 6 | Dec 7, 1992 07:42 PM | Wsmithst | 1 | - | 1
| 2 | 1 |
Kent fatal car crash and road traffic accident list for 1991
- Fatal accident count5
- Vehicles involved in fatal accidents12
- Fatal accidents involving drunk persons3
- Fatalities5
- Persons involved in fatal accidents17
- Pedestrians involved in fatal accidents3
Average EMS response time
- Kent(Based on 5 reports) 3.8 mins
- King County(Based on 107 reports) 5.0 mins
- Washington(Based on 544 reports) 8.3 mins
Average hospital transport time
- Kent(Based on 3 reports) 42.3 mins
- King County(Based on 70 reports) 59.7 mins
- Washington(Based on 415 reports) 48.5 mins
Daylight
- Kent(Based on 5 reports) 80.0%
- King County(Based on 113 reports) 50.4%
- Washington(Based on 601 reports) 45.6%
Dark - Not Lighted
- Kent(Based on 5 reports) 20.0%
- King County(Based on 113 reports) 21.2%
- Washington(Based on 601 reports) 35.1%
Clear
- Kent(Based on 5 reports) 80.0%
- King County(Based on 113 reports) 79.6%
- Washington(Based on 602 reports) 81.7%
Fog, Smog, Smoke
- Kent(Based on 5 reports) 20.0%
- King County(Based on 113 reports) 1.8%
- Washington(Based on 602 reports) 2.8%
| # | Date | Location | Vehicles | Drunk persons | Fatalites | Persons | Pedestrians |
|---|
| 1 | Jan 29, 1991 06:10 PM | 516 | 5 | 1
| 1 | 6 | - |
| 2 | Feb 16, 1991 05:16 PM | 516 | 2 | 2
| 1 | 2 | - |
| 3 | Feb 24, 1991 05:05 PM | 167 | 1 | - | 1
| 3 | 2 |
| 4 | Jul 2, 1991 01:50 PM | 516 | 2 | - | 1
| 3 | 1 |
| 5 | Dec 16, 1991 03:43 PM | 84thaves | 2 | - | 1
| 3 | - |
Kent fatal car crash and road traffic accident list for 1990
- Fatal accident count8
- Vehicles involved in fatal accidents23
- Fatal accidents involving drunk persons1
- Fatalities8
- Persons involved in fatal accidents34
Average EMS response time
- Kent(Based on 6 reports) 5.7 mins
- King County(Based on 139 reports) 4.9 mins
- Washington(Based on 623 reports) 7.1 mins
Average hospital transport time
- Kent(Based on 5 reports) 52.8 mins
- King County(Based on 95 reports) 54.5 mins
- Washington(Based on 459 reports) 46.1 mins
Daylight
- Kent(Based on 8 reports) 62.5%
- King County(Based on 152 reports) 51.3%
- Washington(Based on 725 reports) 44.8%
Dark - Lighted
- Kent(Based on 8 reports) 25.0%
- King County(Based on 152 reports) 24.3%
- Washington(Based on 725 reports) 15.3%
Dusk
- Kent(Based on 8 reports) 12.5%
- King County(Based on 152 reports) 2.0%
- Washington(Based on 725 reports) 2.2%
Clear
- Kent(Based on 8 reports) 75.0%
- King County(Based on 152 reports) 79.6%
- Washington(Based on 726 reports) 82.1%
Rain
- Kent(Based on 8 reports) 25.0%
- King County(Based on 152 reports) 17.8%
- Washington(Based on 726 reports) 14.5%
| # | Date | Location | Vehicles | Drunk persons | Fatalites | Persons | Pedestrians |
|---|
| 1 | Jan 3, 1990 04:20 PM | Fourthave | 2 | - | 1
| 3 | - |
| 2 | Feb 8, 1990 02:05 PM | 516 | 11 | - | 1
| 17 | - |
| 3 | Mar 10, 1990 06:10 PM | I5 | 1 | - | 1
| 1 | - |
| 4 | Jun 22, 1990 05:30 PM | Ejamesst | 4 | - | 1
| 5 | - |
| 5 | Jul 17, 1990 08:30 AM | 167 | 2 | - | 1
| 2 | - |
| 6 | Aug 22, 1990 10:40 PM | 99 | 1 | 1
| 1 | 2 | - |
| 7 | Sep 21, 1990 04:00 PM | Scentralav | 1 | - | 1
| 2 | - |
| 8 | Nov 9, 1990 07:12 PM | 99 | 1 | - | 1
| 2 | - |
Kent fatal car crash and road traffic accident list for 1989
- Fatal accident count8
- Vehicles involved in fatal accidents13
- Fatal accidents involving drunk persons5
- Fatalities8
- Persons involved in fatal accidents15
Average EMS response time
- Kent(Based on 7 reports) 5.1 mins
- King County(Based on 121 reports) 5.3 mins
- Washington(Based on 572 reports) 7.9 mins
Average hospital transport time
- Kent(Based on 3 reports) 74.0 mins
- King County(Based on 80 reports) 54.8 mins
- Washington(Based on 441 reports) 44.2 mins
Dark - Not Lighted
- Kent(Based on 8 reports) 62.5%
- King County(Based on 140 reports) 27.9%
- Washington(Based on 694 reports) 37.3%
Dark - Lighted
- Kent(Based on 8 reports) 37.5%
- King County(Based on 140 reports) 32.1%
- Washington(Based on 694 reports) 16.3%
Clear
- Kent(Based on 8 reports) 87.5%
- King County(Based on 140 reports) 84.3%
- Washington(Based on 694 reports) 84.0%
Rain
- Kent(Based on 8 reports) 12.5%
- King County(Based on 140 reports) 10.7%
- Washington(Based on 694 reports) 11.4%
| # | Date | Location | Vehicles | Drunk persons | Fatalites | Persons | Pedestrians |
|---|
| 1 | Feb 26, 1989 09:40 PM | 167 | 2 | - | 1
| 2 | - |
| 2 | Feb 28, 1989 06:25 PM | 516 | 2 | 1
| 1 | 2 | - |
| 3 | Apr 9, 1989 01:15 AM | Militryrds | 1 | 1
| 1 | 1 | - |
| 4 | Jun 13, 1989 11:55 PM | I5 | 2 | 1
| 1 | 2 | - |
| 5 | Jul 25, 1989 02:20 AM | Se240th | 2 | - | 1
| 2 | - |
| 6 | Aug 24, 1989 01:20 AM | I5 | 2 | 1
| 1 | 2 | - |
| 7 | Oct 10, 1989 10:17 PM | 84thaves | 1 | - | 1
| 2 | - |
| 8 | Dec 4, 1989 08:30 PM | 167 | 1 | 1
| 1 | 2 | - |
Kent fatal car crash and road traffic accident list for 1988
| # | Date | Location | Vehicles | Drunk persons | Fatalites | Persons | Pedestrians |
|---|
| 1 | Jan 8, 1988 06:24 PM | 99 | 1 | - | 1
| 2 | - |
| 2 | Jan 19, 1988 03:00 AM | Fragerrds | 1 | 1
| 2 | 3 | - |
| 3 | Oct 31, 1988 06:50 PM | Ejamesst | 1 | - | 1
| 2 | - |
Kent fatal car crash and road traffic accident list for 1987
- Fatal accident count6
- Vehicles involved in fatal accidents10
- Fatal accidents involving drunk persons2
- Fatalities6
- Persons involved in fatal accidents19
Average EMS response time
- Kent(Based on 6 reports) 4.5 mins
- King County(Based on 122 reports) 4.8 mins
- Washington(Based on 548 reports) 6.9 mins
Average hospital transport time
- Kent(Based on 5 reports) 69.8 mins
- King County(Based on 88 reports) 52.1 mins
- Washington(Based on 443 reports) 42.0 mins
Daylight
- Kent(Based on 6 reports) 66.7%
- King County(Based on 143 reports) 44.1%
- Washington(Based on 691 reports) 46.0%
Dark - Lighted
- Kent(Based on 6 reports) 16.7%
- King County(Based on 143 reports) 30.8%
- Washington(Based on 691 reports) 15.5%
Dark - Not Lighted
- Kent(Based on 6 reports) 16.7%
- King County(Based on 143 reports) 22.4%
- Washington(Based on 691 reports) 34.9%
Clear
- Kent(Based on 6 reports) 100.0%
- King County(Based on 143 reports) 84.6%
- Washington(Based on 691 reports) 85.7%
| # | Date | Location | Vehicles | Drunk persons | Fatalites | Persons | Pedestrians |
|---|
| 1 | Mar 8, 1987 02:30 AM | 516 | 2 | 1
| 1 | 3 | - |
| 2 | Jul 161987 06:05 PM | | 2 | 1
| 1 | 5 | - |
| 3 | Jul 22, 1987 07:32 PM | Ncentral | 3 | - | 1
| 5 | - |
| 4 | Jun 24, 1987 05:27 PM | 42ndaves | 1 | - | 1
| 2 | - |
| 5 | Sep 71987 09:30 PM | | 1 | - | 1
| 2 | - |
| 6 | Oct 17, 1987 02:14 PM | 516 | 1 | - | 1
| 2 | - |
Kent fatal car crash and road traffic accident list for 1986
- Fatal accident count7
- Vehicles involved in fatal accidents14
- Fatal accidents involving drunk persons6
- Fatalities8
- Persons involved in fatal accidents30
Average EMS response time
- Kent(Based on 7 reports) 5.0 mins
- King County(Based on 140 reports) 4.8 mins
- Washington(Based on 524 reports) 6.3 mins
Daylight
- Kent(Based on 7 reports) 42.9%
- King County(Based on 153 reports) 42.5%
- Washington(Based on 648 reports) 42.6%
Dark - Lighted
- Kent(Based on 7 reports) 28.6%
- King County(Based on 153 reports) 32.0%
- Washington(Based on 648 reports) 18.5%
Dark - Not Lighted
- Kent(Based on 7 reports) 28.6%
- King County(Based on 153 reports) 20.9%
- Washington(Based on 648 reports) 34.7%
Clear
- Kent(Based on 7 reports) 71.4%
- King County(Based on 153 reports) 77.8%
- Washington(Based on 648 reports) 83.6%
Fog, Smog, Smoke
- Kent(Based on 7 reports) 28.6%
- King County(Based on 153 reports) 2.6%
- Washington(Based on 648 reports) 3.5%
| # | Date | Location | Vehicles | Drunk persons | Fatalites | Persons | Pedestrians |
|---|
| 1 | Feb 24, 1986 09:50 AM | 181 | 3 | - | 2
| 4 | - |
| 2 | Apr 13, 1986 01:15 AM | 181 | 1 | 1
| 1 | 2 | - |
| 3 | Jun 11, 1986 08:04 PM | Reithrd | 1 | - | 1
| 2 | - |
| 4 | Aug 3, 1986 00:45 AM | 97thpls | 1 | 1
| 1 | 1 | - |
| 5 | Oct 7, 1986 05:24 PM | 516 | 4 | 1
| 1 | 10 | - |
| 6 | Nov 29, 1986 01:59 AM | 099 | 2 | 2
| 1 | 5 | - |
| 7 | Dec 6, 1986 08:30 PM | 181 | 2 | 1
| 1 | 6 | - |
Kent fatal car crash and road traffic accident list for 1985
- Fatal accident count4
- Vehicles involved in fatal accidents5
- Fatal accidents involving drunk persons1
- Fatalities4
- Persons involved in fatal accidents10
Average EMS response time
- Kent(Based on 2 reports) 3.5 mins
- King County(Based on 134 reports) 5.4 mins
- Washington(Based on 573 reports) 6.8 mins
Daylight
- Kent(Based on 4 reports) 75.0%
- King County(Based on 141 reports) 48.2%
- Washington(Based on 643 reports) 47.1%
Dark - Not Lighted
- Kent(Based on 4 reports) 25.0%
- King County(Based on 141 reports) 21.3%
- Washington(Based on 643 reports) 30.5%
Clear
- Kent(Based on 4 reports) 75.0%
- King County(Based on 143 reports) 78.3%
- Washington(Based on 645 reports) 85.4%
Rain
- Kent(Based on 4 reports) 25.0%
- King County(Based on 143 reports) 14.7%
- Washington(Based on 645 reports) 8.2%
| # | Date | Location | Vehicles | Drunk persons | Fatalites | Persons | Pedestrians |
|---|
| 1 | May 15, 1985 05:04 PM | Wcrowst | 1 | - | 1
| 2 | - |
| 2 | May 8, 1985 07:49 PM | Crowrd | 1 | - | 1
| 5 | - |
| 3 | Sep 10, 1985 04:40 AM | 181 | 1 | 1
| 1 | 1 | - |
| 4 | Oct 24, 1985 12:55 AM | S212thst | 2 | - | 1
| 2 | - |
Kent fatal car crash and road traffic accident list for 1984
- Fatal accident count5
- Vehicles involved in fatal accidents8
- Fatal accidents involving drunk persons2
- Fatalities6
- Persons involved in fatal accidents9
Average EMS response time
- Kent(Based on 4 reports) 3.8 mins
- King County(Based on 129 reports) 4.5 mins
- Washington(Based on 579 reports) 6.9 mins
Daylight
- Kent(Based on 5 reports) 40.0%
- King County(Based on 139 reports) 47.5%
- Washington(Based on 673 reports) 47.8%
Dark - Lighted
- Kent(Based on 5 reports) 40.0%
- King County(Based on 139 reports) 31.7%
- Washington(Based on 673 reports) 15.5%
Dark - Not Lighted
- Kent(Based on 5 reports) 20.0%
- King County(Based on 139 reports) 19.4%
- Washington(Based on 673 reports) 34.6%
Clear
- Kent(Based on 5 reports) 100.0%
- King County(Based on 139 reports) 78.4%
- Washington(Based on 674 reports) 82.2%
| # | Date | Location | Vehicles | Drunk persons | Fatalites | Persons | Pedestrians |
|---|
| 1 | Jun 6, 1984 02:20 AM | Fragerrd | 1 | 1
| 1 | 1 | - |
| 2 | Aug 241984 04:10 PM | | 2 | - | 1
| 2 | - |
| 3 | Sep 9, 1984 05:15 AM | 516 | 1 | - | 1
| 1 | - |
| 4 | Sep 24, 1984 04:20 PM | S240thst | 3 | - | 2
| 4 | - |
| 5 | Oct 23, 1984 11:59 PM | Wgowest | 1 | 1
| 1 | 1 | - |
Kent fatal car crash and road traffic accident list for 1983
| # | Date | Location | Vehicles | Drunk persons | Fatalites | Persons | Pedestrians |
|---|
| 1 | Apr 61983 09:30 AM | | 1 | - | 1
| 1 | - |
| 2 | Apr 211983 01:05 PM | | 2 | - | 1
| 2 | - |
| 3 | Sep 301983 11:54 PM | | 1 | - | 1
| 1 | - |
Kent fatal car crash and road traffic accident list for 1982
- Fatal accident count7
- Vehicles involved in fatal accidents10
- Fatal accidents involving drunk persons5
- Fatalities9
- Persons involved in fatal accidents20
Average EMS response time
- Kent(Based on 6 reports) 7.8 mins
- King County(Based on 109 reports) 5.6 mins
- Washington(Based on 489 reports) 7.6 mins
Dark - Lighted
- Kent(Based on 7 reports) 42.9%
- King County(Based on 134 reports) 37.3%
- Washington(Based on 671 reports) 20.0%
Daylight
- Kent(Based on 7 reports) 28.6%
- King County(Based on 134 reports) 36.6%
- Washington(Based on 671 reports) 39.5%
Dark - Not Lighted
- Kent(Based on 7 reports) 28.6%
- King County(Based on 134 reports) 23.1%
- Washington(Based on 671 reports) 36.5%
Clear
- Kent(Based on 7 reports) 85.7%
- King County(Based on 134 reports) 82.1%
- Washington(Based on 671 reports) 86.9%
Rain
- Kent(Based on 7 reports) 14.3%
- King County(Based on 134 reports) 17.9%
- Washington(Based on 671 reports) 11.0%
| # | Date | Location | Vehicles | Drunk persons | Fatalites | Persons | Pedestrians |
|---|
| 1 | Jan 19, 1982 08:50 AM | S212 | 1 | - | 1
| 1 | - |
| 2 | Apr 6, 1982 02:15 AM | 099 | 1 | 1
| 1 | 2 | - |
| 3 | Aug 22, 1982 01:55 AM | Se240th | 2 | 2
| 1 | 5 | - |
| 4 | Oct 19, 1982 10:32 PM | 099 | 2 | - | 1
| 5 | - |
| 5 | Dec 17, 1982 02:42 PM | S212th | 2 | - | 3
| 3 | - |
| 6 | Dec 11, 1982 05:05 PM | 515 | 1 | 1
| 1 | 3 | - |
| 7 | Oct 29, 1982 08:50 PM | 005 | 1 | 1
| 1 | 1 | - |
Kent fatal car crash and road traffic accident list for 1981
- Fatal accident count8
- Vehicles involved in fatal accidents11
- Fatal accidents involving drunk persons4
- Fatalities9
- Persons involved in fatal accidents18
Average EMS response time
- Kent(Based on 7 reports) 6.4 mins
- King County(Based on 135 reports) 6.4 mins
- Washington(Based on 552 reports) 8.4 mins
Dark - Lighted
- Kent(Based on 8 reports) 50.0%
- King County(Based on 178 reports) 33.1%
- Washington(Based on 783 reports) 20.1%
Daylight
- Kent(Based on 8 reports) 37.5%
- King County(Based on 178 reports) 32.6%
- Washington(Based on 783 reports) 37.4%
Dark - Not Lighted
- Kent(Based on 8 reports) 12.5%
- King County(Based on 178 reports) 30.9%
- Washington(Based on 783 reports) 38.4%
Clear
- Kent(Based on 8 reports) 62.5%
- King County(Based on 178 reports) 73.6%
- Washington(Based on 784 reports) 80.0%
Rain
- Kent(Based on 8 reports) 37.5%
- King County(Based on 178 reports) 21.9%
- Washington(Based on 784 reports) 14.5%
Kent fatal car crash and road traffic accident list for 1980
- Fatal accident count8
- Vehicles involved in fatal accidents12
- Fatal accidents involving drunk persons3
- Fatalities8
- Persons involved in fatal accidents16
Average EMS response time
- Kent(Based on 3 reports) 2.3 mins
- King County(Based on 155 reports) 4.7 mins
- Washington(Based on 577 reports) 7.7 mins
Daylight
- Kent(Based on 8 reports) 50.0%
- King County(Based on 203 reports) 30.5%
- Washington(Based on 847 reports) 37.2%
Dark - Lighted
- Kent(Based on 8 reports) 25.0%
- King County(Based on 203 reports) 33.5%
- Washington(Based on 847 reports) 19.6%
Dark - Not Lighted
- Kent(Based on 8 reports) 25.0%
- King County(Based on 203 reports) 31.0%
- Washington(Based on 847 reports) 38.5%
Clear
- Kent(Based on 8 reports) 75.0%
- King County(Based on 203 reports) 84.2%
- Washington(Based on 847 reports) 83.8%
Rain
- Kent(Based on 8 reports) 25.0%
- King County(Based on 203 reports) 14.8%
- Washington(Based on 847 reports) 10.6%
Kent fatal car crash and road traffic accident list for 1979
- Fatal accident count12
- Vehicles involved in fatal accidents14
- Fatal accidents involving drunk persons7
- Fatalities12
- Persons involved in fatal accidents22
Average EMS response time
- Kent(Based on 4 reports) 5.5 mins
- King County(Based on 78 reports) 8.9 mins
- Washington(Based on 250 reports) 10.6 mins
Dark - Lighted
- Kent(Based on 12 reports) 41.7%
- King County(Based on 217 reports) 36.9%
- Washington(Based on 892 reports) 18.4%
Dark - Not Lighted
- Kent(Based on 12 reports) 41.7%
- King County(Based on 217 reports) 27.2%
- Washington(Based on 892 reports) 37.0%
Daylight
- Kent(Based on 12 reports) 16.7%
- King County(Based on 217 reports) 31.3%
- Washington(Based on 892 reports) 40.8%
Clear
- Kent(Based on 12 reports) 66.7%
- King County(Based on 219 reports) 78.1%
- Washington(Based on 894 reports) 83.1%
Rain
- Kent(Based on 12 reports) 33.3%
- King County(Based on 219 reports) 18.7%
- Washington(Based on 894 reports) 12.9%
Kent fatal car crash and road traffic accident list for 1978
- Fatal accident count7
- Vehicles involved in fatal accidents14
- Fatal accidents involving drunk persons4
- Fatalities8
- Persons involved in fatal accidents23
Dark - Not Lighted
- Kent(Based on 7 reports) 42.9%
- King County(Based on 215 reports) 23.7%
- Washington(Based on 864 reports) 35.0%
Daylight
- Kent(Based on 7 reports) 28.6%
- King County(Based on 215 reports) 36.7%
- Washington(Based on 864 reports) 41.6%
Dark - Lighted
- Kent(Based on 7 reports) 28.6%
- King County(Based on 215 reports) 35.8%
- Washington(Based on 864 reports) 19.4%
Clear
- Kent(Based on 7 reports) 85.7%
- King County(Based on 215 reports) 80.0%
- Washington(Based on 865 reports) 83.9%
Rain
- Kent(Based on 7 reports) 14.3%
- King County(Based on 215 reports) 17.7%
- Washington(Based on 865 reports) 12.7%
Kent fatal car crash and road traffic accident list for 1977
- Fatal accident count6
- Vehicles involved in fatal accidents7
- Fatal accidents involving drunk persons4
- Fatalities6
- Persons involved in fatal accidents17
Dark - Lighted
- Kent(Based on 5 reports) 60.0%
- King County(Based on 154 reports) 33.1%
- Washington(Based on 796 reports) 17.2%
Dark - Unknown Lighting
- Kent(Based on 5 reports) 20.0%
- King County(Based on 154 reports) 5.2%
- Washington(Based on 796 reports) 4.8%
Daylight
- Kent(Based on 5 reports) 20.0%
- King County(Based on 154 reports) 31.2%
- Washington(Based on 796 reports) 40.2%
Clear
- Kent(Based on 6 reports) 83.3%
- King County(Based on 155 reports) 80.0%
- Washington(Based on 797 reports) 81.4%
Rain
- Kent(Based on 6 reports) 16.7%
- King County(Based on 155 reports) 18.1%
- Washington(Based on 797 reports) 14.7%
Kent fatal car crash and road traffic accident list for 1976
- Fatal accident count4
- Vehicles involved in fatal accidents6
- Fatal accidents involving drunk persons3
- Fatalities4
- Persons involved in fatal accidents11
Dark - Not Lighted
- Kent(Based on 4 reports) 50.0%
- King County(Based on 151 reports) 26.5%
- Washington(Based on 667 reports) 33.4%
Dark - Lighted
- Kent(Based on 4 reports) 25.0%
- King County(Based on 151 reports) 35.1%
- Washington(Based on 667 reports) 21.6%
Daylight
- Kent(Based on 4 reports) 25.0%
- King County(Based on 151 reports) 33.1%
- Washington(Based on 667 reports) 40.0%
Clear
- Kent(Based on 4 reports) 100.0%
- King County(Based on 151 reports) 74.2%
- Washington(Based on 668 reports) 81.9%
Kent fatal car crash and road traffic accident list for 1975
- Fatal accident count4
- Vehicles involved in fatal accidents6
- Fatal accidents involving drunk persons3
- Fatalities4
- Persons involved in fatal accidents11
Dark - Not Lighted
- Kent(Based on 4 reports) 50.0%
- King County(Based on 151 reports) 26.5%
- Washington(Based on 667 reports) 33.4%
Dark - Lighted
- Kent(Based on 4 reports) 25.0%
- King County(Based on 151 reports) 35.1%
- Washington(Based on 667 reports) 21.6%
Daylight
- Kent(Based on 4 reports) 25.0%
- King County(Based on 151 reports) 33.1%
- Washington(Based on 667 reports) 40.0%
Clear
- Kent(Based on 4 reports) 100.0%
- King County(Based on 151 reports) 74.2%
- Washington(Based on 668 reports) 81.9%