Fatal car crashes and road traffic accidents in Maryville, Tennessee
- Fatal car crash and road traffic accident statistics for 2021
- Fatal accident count2
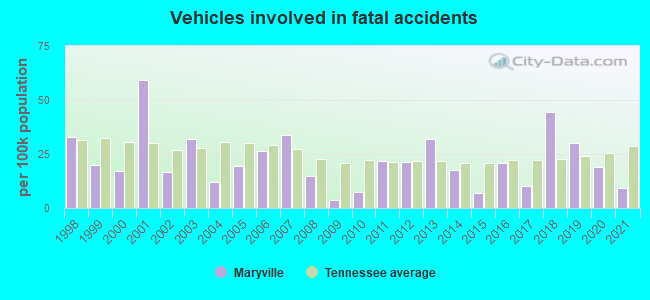
- Vehicles involved in fatal accidents3
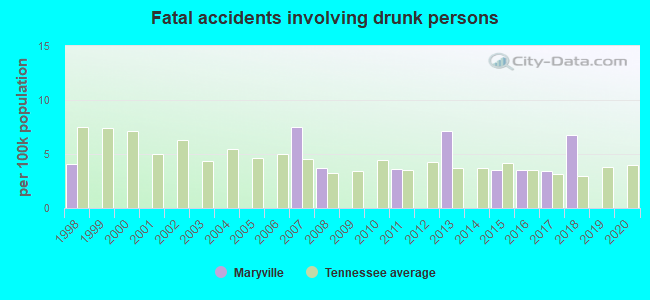
- Fatal accidents involving drunk persons0
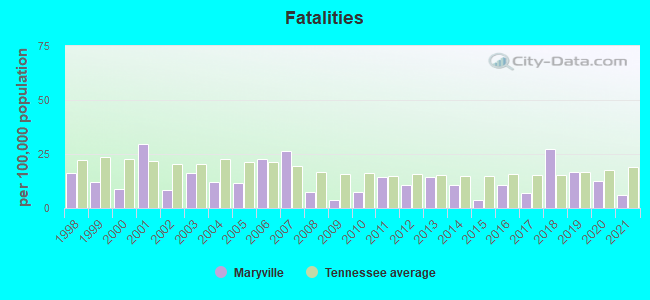
- Fatalities2
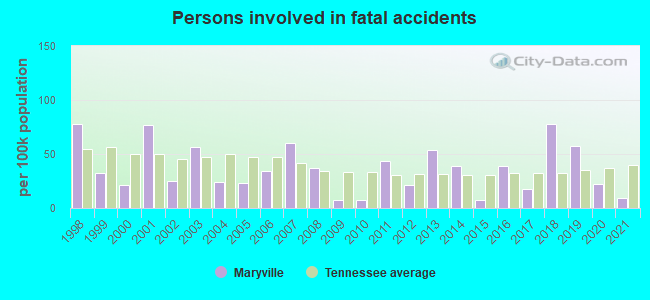
- Persons involved in fatal accidents3
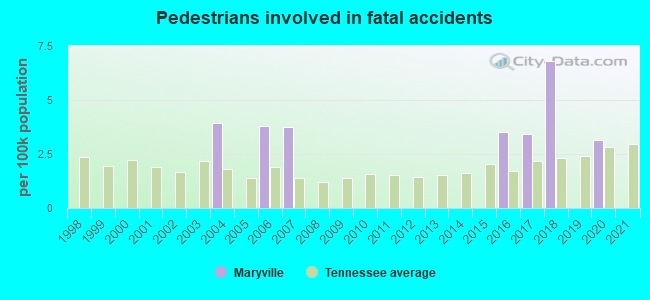
- Pedestrians involved in fatal accidents0
- Fatal car crash and road traffic accident statistics for 2020
- Fatal accident count4
- Vehicles involved in fatal accidents6
- Fatal accidents involving drunk persons0
- Fatalities4
- Persons involved in fatal accidents7
- Pedestrians involved in fatal accidents1
- Fatal car crash and road traffic accident statistics for 2019
- Fatal accident count5
- Vehicles involved in fatal accidents9
- Fatal accidents involving drunk persons0
- Fatalities5
- Persons involved in fatal accidents17
- Pedestrians involved in fatal accidents0
- Fatal car crash and road traffic accident statistics for 2018
- Fatal accident count8
- Vehicles involved in fatal accidents13
- Fatal accidents involving drunk persons2
- Fatalities8
- Persons involved in fatal accidents23
- Pedestrians involved in fatal accidents2

Data:
Latest news about accidents in Maryville, TN collected exclusively by city-data.com from local newspapers, TV, and radio stations
No street view available for this location
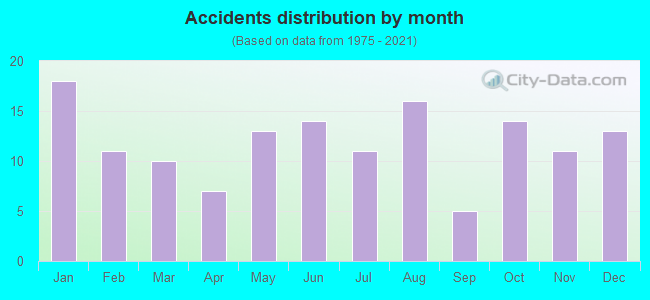
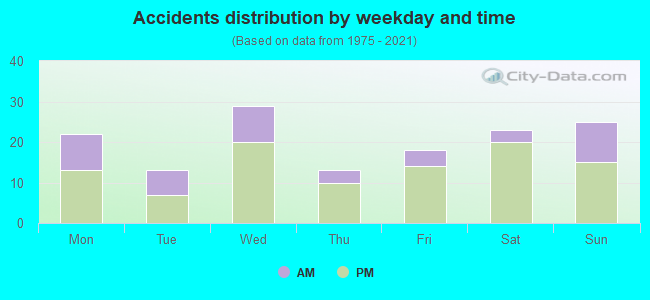
Maryville fatal accident statistics for 1998 - 2021
Average EMS response time
- Maryville(Based on 52 reports) 6.8 mins
- Blount County(Based on 255 reports) 11.8 mins
- Tennessee(Based on 21,602 reports) 10.1 mins
Average hospital transport time
- Maryville(Based on 21 reports) 33.6 mins
- Blount County(Based on 80 reports) 33.5 mins
- Tennessee(Based on 6,802 reports) 44.6 mins
Daylight
- Maryville(Based on 143 reports) 62.2%
- Blount County(Based on 822 reports) 60.8%
- Tennessee(Based on 48,382 reports) 48.8%
Dark - Lighted
- Maryville(Based on 143 reports) 21.7%
- Blount County(Based on 822 reports) 6.8%
- Tennessee(Based on 48,382 reports) 15.1%
Dark - Not Lighted
- Maryville(Based on 143 reports) 13.3%
- Blount County(Based on 822 reports) 29.8%
- Tennessee(Based on 48,382 reports) 32.1%
Dawn
- Maryville(Based on 143 reports) 1.4%
- Blount County(Based on 822 reports) 0.9%
- Tennessee(Based on 48,382 reports) 1.5%
Dusk
- Maryville(Based on 143 reports) 1.4%
- Blount County(Based on 822 reports) 1.6%
- Tennessee(Based on 48,382 reports) 2.0%
Clear
- Maryville(Based on 143 reports) 84.6%
- Blount County(Based on 827 reports) 83.6%
- Tennessee(Based on 48,725 reports) 84.0%
Rain
- Maryville(Based on 143 reports) 7.7%
- Blount County(Based on 827 reports) 9.7%
- Tennessee(Based on 48,725 reports) 10.0%
Unknown
- Maryville(Based on 143 reports) 6.3%
- Blount County(Based on 827 reports) 4.7%
- Tennessee(Based on 48,725 reports) 2.7%
Snow
- Maryville(Based on 143 reports) 0.7%
- Blount County(Based on 827 reports) 0.4%
- Tennessee(Based on 48,725 reports) 0.8%
Other
- Maryville(Based on 143 reports) 0.7%
- Blount County(Based on 827 reports) 0.1%
- Tennessee(Based on 48,725 reports) 0.0%

Maryville fatal car crash and road traffic accident list for 2021
Maryville fatal car crash and road traffic accident list for 2020
- Fatal accident count4
- Vehicles involved in fatal accidents6
- Fatalities4
- Persons involved in fatal accidents7
- Pedestrians involved in fatal accidents1
Average EMS response time
- Maryville(Based on 4 reports) 6.3 mins
- Blount County(Based on 13 reports) 13.4 mins
- Tennessee(Based on 1,014 reports) 9.6 mins
Average hospital transport time
- Maryville(Based on 4 reports) 22.3 mins
- Blount County(Based on 11 reports) 34.4 mins
- Tennessee(Based on 628 reports) 35.9 mins
Dark - Not Lighted
- Maryville(Based on 4 reports) 50.0%
- Blount County(Based on 13 reports) 23.1%
- Tennessee(Based on 1,106 reports) 25.7%
Dark - Lighted
- Maryville(Based on 4 reports) 50.0%
- Blount County(Based on 13 reports) 23.1%
- Tennessee(Based on 1,106 reports) 22.3%
Clear
- Maryville(Based on 4 reports) 75.0%
- Blount County(Based on 13 reports) 84.6%
- Tennessee(Based on 1,099 reports) 78.9%
Unknown
- Maryville(Based on 4 reports) 25.0%
- Blount County(Based on 13 reports) 15.4%
- Tennessee(Based on 1,099 reports) 9.8%
Maryville fatal car crash and road traffic accident list for 2019
- Fatal accident count5
- Vehicles involved in fatal accidents9
- Fatalities5
- Persons involved in fatal accidents17
Average EMS response time
- Maryville(Based on 5 reports) 20.4 mins
- Blount County(Based on 18 reports) 18.1 mins
- Tennessee(Based on 1,016 reports) 13.9 mins
Average hospital transport time
- Maryville(Based on 5 reports) 22.6 mins
- Blount County(Based on 17 reports) 25.2 mins
- Tennessee(Based on 648 reports) 33.8 mins
Daylight
- Maryville(Based on 5 reports) 80.0%
- Blount County(Based on 18 reports) 61.1%
- Tennessee(Based on 1,026 reports) 48.8%
Dark - Not Lighted
- Maryville(Based on 5 reports) 20.0%
- Blount County(Based on 18 reports) 27.8%
- Tennessee(Based on 1,026 reports) 28.6%
Clear
- Maryville(Based on 5 reports) 60.0%
- Blount County(Based on 18 reports) 66.7%
- Tennessee(Based on 1,028 reports) 77.9%
Unknown
- Maryville(Based on 5 reports) 40.0%
- Blount County(Based on 18 reports) 16.7%
- Tennessee(Based on 1,028 reports) 10.3%
Maryville fatal car crash and road traffic accident list for 2018
- Fatal accident count8
- Vehicles involved in fatal accidents13
- Fatal accidents involving drunk persons2
- Fatalities8
- Persons involved in fatal accidents23
- Pedestrians involved in fatal accidents2
Average EMS response time
- Maryville(Based on 8 reports) 7.0 mins
- Blount County(Based on 22 reports) 13.5 mins
- Tennessee(Based on 951 reports) 10.5 mins
Average hospital transport time
- Maryville(Based on 5 reports) 24.4 mins
- Blount County(Based on 12 reports) 29.8 mins
- Tennessee(Based on 605 reports) 40.3 mins
Daylight
- Maryville(Based on 8 reports) 62.5%
- Blount County(Based on 22 reports) 59.1%
- Tennessee(Based on 961 reports) 51.1%
Dark - Lighted
- Maryville(Based on 8 reports) 37.5%
- Blount County(Based on 22 reports) 13.6%
- Tennessee(Based on 961 reports) 18.4%
Clear
- Maryville(Based on 8 reports) 50.0%
- Blount County(Based on 22 reports) 54.5%
- Tennessee(Based on 969 reports) 74.4%
Unknown
- Maryville(Based on 8 reports) 37.5%
- Blount County(Based on 22 reports) 31.8%
- Tennessee(Based on 969 reports) 14.1%
Rain
- Maryville(Based on 8 reports) 12.5%
- Blount County(Based on 22 reports) 13.6%
- Tennessee(Based on 969 reports) 10.1%
| # | Date | Location | Vehicles | Drunk persons | Fatalites | Persons | Pedestrians |
|---|
| 1 | Jan 1, 2018 02:07 AM | Sr-336 Montvale Rd | 1 | 1
| 1 | 1 | - |
| 2 | Jan 2, 2018 03:09 PM | Foothills Mall Dr, W Broadway Ave | 2 | - | 1
| 2 | - |
| 3 | Mar 10, 2018 03:19 AM | Us-321 Sr-73 E Lamar Alexander, Gateway Rd | 2 | 1
| 1 | 3 | - |
| 4 | May 21, 2018 10:00 AM | Us-321 Sr-73 E Lamar Alexander, Parliament Dr | 2 | - | 1
| 2 | - |
| 5 | Jun 2, 2018 07:04 PM | Jamestown Way | 1 | - | 1
| 1 | 1 |
| 6 | Jul 17, 2018 03:18 PM | Cr-Grandview Dr | 1 | - | 1
| 1 | - |
| 7 | Aug 21, 2018 08:37 AM | Us-411 Sr-33, Us-129 Sr-115 Calderwood Hwy | 3 | - | 1
| 10 | - |
| 8 | Nov 14, 2018 07:46 PM | Us-321 Sr-73 E Lamar Alexander, Bmh Physician Office Building | 1 | - | 1
| 3 | 1 |
Maryville fatal car crash and road traffic accident list for 2017
Maryville fatal car crash and road traffic accident list for 2016
Maryville fatal car crash and road traffic accident list for 2015
Maryville fatal car crash and road traffic accident list for 2014
Maryville fatal car crash and road traffic accident list for 2013
- Fatal accident count4
- Vehicles involved in fatal accidents9
- Fatal accidents involving drunk persons2
- Fatalities4
- Persons involved in fatal accidents15
Daylight
- Maryville(Based on 4 reports) 100.0%
- Blount County(Based on 24 reports) 70.8%
- Tennessee(Based on 903 reports) 53.5%
Clear
- Maryville(Based on 4 reports) 75.0%
- Blount County(Based on 24 reports) 58.3%
- Tennessee(Based on 907 reports) 73.0%
Rain
- Maryville(Based on 4 reports) 25.0%
- Blount County(Based on 24 reports) 16.7%
- Tennessee(Based on 907 reports) 10.4%
Maryville fatal car crash and road traffic accident list for 2012
Maryville fatal car crash and road traffic accident list for 2011
- Fatal accident count4
- Vehicles involved in fatal accidents6
- Fatal accidents involving drunk persons1
- Fatalities4
- Persons involved in fatal accidents12
Daylight
- Maryville(Based on 4 reports) 75.0%
- Blount County(Based on 16 reports) 62.5%
- Tennessee(Based on 867 reports) 53.7%
Dark - Lighted
- Maryville(Based on 4 reports) 25.0%
- Blount County(Based on 16 reports) 12.5%
- Tennessee(Based on 867 reports) 14.4%
Clear
- Maryville(Based on 4 reports) 75.0%
- Blount County(Based on 15 reports) 73.3%
- Tennessee(Based on 863 reports) 79.5%
Unknown
- Maryville(Based on 4 reports) 25.0%
- Blount County(Based on 15 reports) 20.0%
- Tennessee(Based on 863 reports) 9.4%
Maryville fatal car crash and road traffic accident list for 2010
Maryville fatal car crash and road traffic accident list for 2009
| # | Date | Location | Vehicles | Drunk persons | Fatalites | Persons | Pedestrians |
|---|
| 1 | Mar 20, 2009 02:21 PM | Us-Sr35 | 1 | - | 1
| 2 | - |
Maryville fatal car crash and road traffic accident list for 2008
| # | Date | Location | Vehicles | Drunk persons | Fatalites | Persons | Pedestrians |
|---|
| 1 | Jun 7, 2008 06:48 AM | Us-Sr73 | 1 | - | 1
| 1 | - |
| 2 | Jun 8, 2008 04:03 PM | Us-Sr73, Sr-33 | 3 | 1
| 1 | 9 | - |
Maryville fatal car crash and road traffic accident list for 2007
- Fatal accident count6
- Vehicles involved in fatal accidents9
- Fatal accidents involving drunk persons2
- Fatalities7
- Persons involved in fatal accidents16
- Pedestrians involved in fatal accidents1
Daylight
- Maryville(Based on 6 reports) 66.7%
- Blount County(Based on 26 reports) 57.7%
- Tennessee(Based on 1,106 reports) 51.1%
Dark - Not Lighted
- Maryville(Based on 6 reports) 16.7%
- Blount County(Based on 26 reports) 26.9%
- Tennessee(Based on 1,106 reports) 32.5%
Dark - Lighted
- Maryville(Based on 6 reports) 16.7%
- Blount County(Based on 26 reports) 15.4%
- Tennessee(Based on 1,106 reports) 12.9%
Clear
- Maryville(Based on 6 reports) 100.0%
- Blount County(Based on 26 reports) 96.2%
- Tennessee(Based on 1,111 reports) 88.4%
Maryville fatal car crash and road traffic accident list for 2006
- Fatal accident count5
- Vehicles involved in fatal accidents7
- Fatalities6
- Persons involved in fatal accidents9
- Pedestrians involved in fatal accidents1
Dark - Lighted
- Maryville(Based on 5 reports) 60.0%
- Blount County(Based on 23 reports) 17.4%
- Tennessee(Based on 1,152 reports) 15.2%
Daylight
- Maryville(Based on 5 reports) 40.0%
- Blount County(Based on 23 reports) 47.8%
- Tennessee(Based on 1,152 reports) 50.9%
Clear
- Maryville(Based on 5 reports) 80.0%
- Blount County(Based on 23 reports) 91.3%
- Tennessee(Based on 1,161 reports) 86.9%
Rain
- Maryville(Based on 5 reports) 20.0%
- Blount County(Based on 23 reports) 8.7%
- Tennessee(Based on 1,161 reports) 9.3%
Maryville fatal car crash and road traffic accident list for 2005
| # | Date | Location | Vehicles | Drunk persons | Fatalites | Persons | Pedestrians |
|---|
| 1 | Jun 30, 2005 10:26 AM | Us-Sr35 | 2 | - | 1
| 2 | - |
| 2 | Aug 15, 2005 10:42 AM | Us-Sr73 | 1 | - | 1
| 1 | - |
| 3 | Nov 29, 2005 01:42 PM | Us-Sr73, Chantillyln | 2 | - | 1
| 3 | - |
Maryville fatal car crash and road traffic accident list for 2004
| # | Date | Location | Vehicles | Drunk persons | Fatalites | Persons | Pedestrians |
|---|
| 1 | Jan 24, 2004 12:48 AM | Eharperave, Parhamst | 1 | - | 1
| 2 | 1 |
| 2 | Oct 1, 2004 07:24 PM | Us-Sr35 | 1 | - | 1
| 2 | - |
| 3 | Dec 18, 2004 10:43 AM | Sr-336 | 1 | - | 1
| 2 | - |
Maryville fatal car crash and road traffic accident list for 2003
| # | Date | Location | Vehicles | Drunk persons | Fatalites | Persons | Pedestrians |
|---|
| 1 | Apr 15, 2003 03:56 PM | Us-Sr73 | 3 | - | 2
| 4 | - |
| 2 | Apr 27, 2003 06:33 PM | Us-Sr33 | 3 | - | 1
| 7 | - |
| 3 | Jan 19, 2003 11:57 AM | Us-Sr73 | 2 | - | 1
| 3 | - |
Maryville fatal car crash and road traffic accident list for 2002
| # | Date | Location | Vehicles | Drunk persons | Fatalites | Persons | Pedestrians |
|---|
| 1 | May 29, 2002 08:56 AM | Sr-336 | 2 | - | 1
| 3 | - |
| 2 | Sep 10, 2002 11:09 AM | Oldknoxvillepk | 2 | - | 1
| 3 | - |
Maryville fatal car crash and road traffic accident list for 2001
- Fatal accident count7
- Vehicles involved in fatal accidents14
- Fatalities7
- Persons involved in fatal accidents18
Daylight
- Maryville(Based on 7 reports) 71.4%
- Blount County(Based on 29 reports) 69.0%
- Tennessee(Based on 1,113 reports) 50.8%
Dark - Lighted
- Maryville(Based on 7 reports) 28.6%
- Blount County(Based on 29 reports) 6.9%
- Tennessee(Based on 1,113 reports) 13.4%
Clear
- Maryville(Based on 7 reports) 100.0%
- Blount County(Based on 29 reports) 96.6%
- Tennessee(Based on 1,126 reports) 85.5%
| # | Date | Location | Vehicles | Drunk persons | Fatalites | Persons | Pedestrians |
|---|
| 1 | Mar 6, 2001 03:33 PM | Us-Sr73 | 2 | - | 1
| 2 | - |
| 2 | Mar 26, 2001 06:07 PM | Us-Sr73 | 2 | - | 1
| 2 | - |
| 3 | May 22, 2001 04:01 PM | Us-Sr73 | 4 | - | 1
| 6 | - |
| 4 | Oct 4, 2001 05:08 PM | Us-Sr73 | 2 | - | 1
| 2 | - |
| 5 | Oct 19, 2001 11:24 AM | Us-Sr73 | 2 | - | 1
| 3 | - |
| 6 | Nov 2, 2001 04:38 AM | Sr-336 | 1 | - | 1
| 1 | - |
| 7 | Aug 5, 2001 10:59 PM | Sr-33 | 1 | - | 1
| 2 | - |
Maryville fatal car crash and road traffic accident list for 2000
| # | Date | Location | Vehicles | Drunk persons | Fatalites | Persons | Pedestrians |
|---|
| 1 | Feb 26, 2000 03:10 PM | Us-Sr35 | 2 | - | 1
| 3 | - |
| 2 | Feb 22, 2000 06:51 AM | Us-Sr73 | 2 | - | 1
| 2 | - |
Maryville fatal car crash and road traffic accident list for 1999
| # | Date | Location | Vehicles | Drunk persons | Fatalites | Persons | Pedestrians |
|---|
| 1 | Aug 28, 1999 06:34 PM | Us-Sr73 | 2 | - | 2
| 4 | - |
| 2 | Dec 30, 1999 02:02 PM | Us-Sr73 | 3 | - | 1
| 4 | - |
Maryville fatal car crash and road traffic accident list for 1998
- Fatal accident count4
- Vehicles involved in fatal accidents8
- Fatal accidents involving drunk persons1
- Fatalities4
- Persons involved in fatal accidents19
Average EMS response time
- Maryville(Based on 3 reports) 4.0 mins
- Blount County(Based on 15 reports) 10.2 mins
- Tennessee(Based on 560 reports) 10.8 mins
Daylight
- Maryville(Based on 4 reports) 75.0%
- Blount County(Based on 19 reports) 73.7%
- Tennessee(Based on 1,105 reports) 49.7%
Dark - Not Lighted
- Maryville(Based on 4 reports) 25.0%
- Blount County(Based on 19 reports) 26.3%
- Tennessee(Based on 1,105 reports) 31.3%
Clear
- Maryville(Based on 4 reports) 100.0%
- Blount County(Based on 19 reports) 89.5%
- Tennessee(Based on 1,110 reports) 86.2%
| # | Date | Location | Vehicles | Drunk persons | Fatalites | Persons | Pedestrians |
|---|
| 1 | Feb 1, 1998 10:50 AM | Sr-33 | 2 | - | 1
| 5 | - |
| 2 | May 2, 1998 05:03 PM | Us-Sr73 | 3 | - | 1
| 9 | - |
| 3 | Jun 19, 1998 05:44 PM | Us-Sr115 | 2 | - | 1
| 3 | - |
| 4 | Jul 24, 1998 10:19 PM | Bigspringsrd | 1 | 1
| 1 | 2 | - |
Maryville fatal car crash and road traffic accident list for 1997
| # | Date | Location | Vehicles | Drunk persons | Fatalites | Persons | Pedestrians |
|---|
| 1 | Aug 5, 1997 12:15 AM | Sr73 | 2 | - | 1
| 4 | - |
| 2 | Dec 8, 1997 12:14 AM | Homeave | 1 | - | 1
| 2 | 1 |
Maryville fatal car crash and road traffic accident list for 1996
| # | Date | Location | Vehicles | Drunk persons | Fatalites | Persons | Pedestrians |
|---|
| 1 | Mar 9, 1996 06:46 PM | Sr336 | 2 | - | 1
| 3 | - |
| 2 | Aug 2, 1996 12:23 AM | Sr33 | 4 | - | 1
| 11 | - |
Maryville fatal car crash and road traffic accident list for 1995
| # | Date | Location | Vehicles | Drunk persons | Fatalites | Persons | Pedestrians |
|---|
| 1 | Jun 6, 1995 05:17 PM | Sr73 | 3 | - | 1
| 6 | - |
| 2 | Sep 14, 1995 08:29 AM | Sr33 | 2 | - | 1
| 2 | - |
| 3 | Oct 13, 1995 03:25 PM | Sr33 | 2 | - | 1
| 2 | - |
Maryville fatal car crash and road traffic accident list for 1994
| # | Date | Location | Vehicles | Drunk persons | Fatalites | Persons | Pedestrians |
|---|
| 1 | Jun 23, 1994 01:17 AM | Sr33 | 2 | - | 1
| 2 | - |
Maryville fatal car crash and road traffic accident list for 1993
| # | Date | Location | Vehicles | Drunk persons | Fatalites | Persons | Pedestrians |
|---|
| 1 | May 15, 1993 00:35 AM | Sr33 | 2 | 1
| 1 | 2 | - |
| 2 | May 25, 1993 07:59 AM | Wilkersonp | 1 | - | 1
| 2 | - |
| 3 | Dec 29, 1993 12:09 AM | Sr73 | 2 | - | 1
| 3 | - |
Maryville fatal car crash and road traffic accident list for 1992
| # | Date | Location | Vehicles | Drunk persons | Fatalites | Persons | Pedestrians |
|---|
| 1 | Dec 9, 1992 04:48 PM | Sr73 | 4 | - | 1
| 6 | - |
Maryville fatal car crash and road traffic accident list for 1991
| # | Date | Location | Vehicles | Drunk persons | Fatalites | Persons | Pedestrians |
|---|
| 1 | Aug 17, 1991 02:14 AM | Sr73 | 1 | 1
| 1 | 1 | - |
Maryville fatal car crash and road traffic accident list for 1990
- Fatal accident count6
- Vehicles involved in fatal accidents9
- Fatal accidents involving drunk persons3
- Fatalities6
- Persons involved in fatal accidents16
Daylight
- Maryville(Based on 6 reports) 50.0%
- Blount County(Based on 22 reports) 63.6%
- Tennessee(Based on 1,032 reports) 46.2%
Dark - Lighted
- Maryville(Based on 6 reports) 33.3%
- Blount County(Based on 22 reports) 9.1%
- Tennessee(Based on 1,032 reports) 14.7%
Dark - Not Lighted
- Maryville(Based on 6 reports) 16.7%
- Blount County(Based on 22 reports) 27.3%
- Tennessee(Based on 1,032 reports) 34.7%
Clear
- Maryville(Based on 6 reports) 83.3%
- Blount County(Based on 23 reports) 87.0%
- Tennessee(Based on 1,045 reports) 85.0%
Rain
- Maryville(Based on 6 reports) 16.7%
- Blount County(Based on 23 reports) 13.0%
- Tennessee(Based on 1,045 reports) 10.6%
| # | Date | Location | Vehicles | Drunk persons | Fatalites | Persons | Pedestrians |
|---|
| 1 | Jan 5, 1990 10:36 PM | Sr35 | 1 | 1
| 1 | 1 | - |
| 2 | Mar 26, 1990 03:50 PM | Sr73 | 2 | - | 1
| 4 | - |
| 3 | May 28, 1990 04:55 PM | Oldnilesfe | 2 | 1
| 1 | 3 | - |
| 4 | Oct 4, 1990 01:44 PM | Sr73 | 1 | - | 1
| 2 | - |
| 5 | Nov 23, 1990 05:59 PM | Sr33 | 1 | 1
| 1 | 2 | - |
| 6 | Dec 1, 1990 07:21 PM | Sr33 | 2 | - | 1
| 4 | - |
Maryville fatal car crash and road traffic accident list for 1989
- Fatal accident count4
- Vehicles involved in fatal accidents7
- Fatal accidents involving drunk persons2
- Fatalities4
- Persons involved in fatal accidents11
Average EMS response time
- Maryville(Based on 2 reports) 5.0 mins
- Blount County(Based on 5 reports) 8.4 mins
- Tennessee(Based on 737 reports) 10.4 mins
Daylight
- Maryville(Based on 4 reports) 75.0%
- Blount County(Based on 9 reports) 55.6%
- Tennessee(Based on 969 reports) 47.1%
Dark - Lighted
- Maryville(Based on 4 reports) 25.0%
- Blount County(Based on 9 reports) 11.1%
- Tennessee(Based on 969 reports) 13.9%
Clear
- Maryville(Based on 4 reports) 75.0%
- Blount County(Based on 9 reports) 77.8%
- Tennessee(Based on 977 reports) 81.8%
Rain
- Maryville(Based on 4 reports) 25.0%
- Blount County(Based on 9 reports) 22.2%
- Tennessee(Based on 977 reports) 13.4%
| # | Date | Location | Vehicles | Drunk persons | Fatalites | Persons | Pedestrians |
|---|
| 1 | Jun 10, 1989 01:26 PM | Sr73 | 2 | - | 1
| 4 | - |
| 2 | Jul 4, 1989 08:44 AM | Sr336 | 2 | - | 1
| 3 | - |
| 3 | Jul 13, 1989 12:38 AM | Sr73 | 2 | 1
| 1 | 2 | - |
| 4 | Dec 10, 1989 00:24 AM | Sr73 | 1 | 1
| 1 | 2 | - |
Maryville fatal car crash and road traffic accident list for 1988
| # | Date | Location | Vehicles | Drunk persons | Fatalites | Persons | Pedestrians |
|---|
| 1 | Jan 2, 1988 01:05 PM | Sr73 | 1 | 1
| 1 | 1 | - |
| 2 | Oct 2, 1988 09:00 PM | Sr115 | 1 | 1
| 1 | 3 | - |
Maryville fatal car crash and road traffic accident list for 1987
- Fatal accident count4
- Vehicles involved in fatal accidents7
- Fatal accidents involving drunk persons1
- Fatalities4
- Persons involved in fatal accidents8
Average EMS response time
- Maryville(Based on 3 reports) 6.0 mins
- Blount County(Based on 11 reports) 12.8 mins
- Tennessee(Based on 824 reports) 10.4 mins
Daylight
- Maryville(Based on 4 reports) 50.0%
- Blount County(Based on 16 reports) 37.5%
- Tennessee(Based on 1,084 reports) 43.1%
Dark - Lighted
- Maryville(Based on 4 reports) 50.0%
- Blount County(Based on 16 reports) 12.5%
- Tennessee(Based on 1,084 reports) 16.6%
Clear
- Maryville(Based on 4 reports) 75.0%
- Blount County(Based on 16 reports) 81.3%
- Tennessee(Based on 1,101 reports) 88.2%
Rain
- Maryville(Based on 4 reports) 25.0%
- Blount County(Based on 16 reports) 18.8%
- Tennessee(Based on 1,101 reports) 7.9%
| # | Date | Location | Vehicles | Drunk persons | Fatalites | Persons | Pedestrians |
|---|
| 1 | Jan 301987 12:24 AM | | 2 | - | 1
| 3 | - |
| 2 | Jun 121987 11:35 PM | | 3 | - | 1
| 3 | - |
| 3 | Nov 11, 1987 12:29 AM | M000000113 | 1 | - | 1
| 1 | - |
| 4 | Oct 301987 10:38 PM | | 1 | 1
| 1 | 1 | - |
Maryville fatal car crash and road traffic accident list for 1986
| # | Date | Location | Vehicles | Drunk persons | Fatalites | Persons | Pedestrians |
|---|
| 1 | Mar 51986 04:05 PM | | 3 | - | 1
| 6 | - |
| 2 | Jun 81986 11:36 PM | | 1 | - | 1
| 2 | - |
| 3 | Jun 29, 1986 03:59 AM | M000000140 | 1 | 1
| 2 | 2 | - |
Maryville fatal car crash and road traffic accident list for 1985
| # | Date | Location | Vehicles | Drunk persons | Fatalites | Persons | Pedestrians |
|---|
| 1 | Nov 21985 11:45 AM | | 2 | - | 1
| 4 | - |
Maryville fatal car crash and road traffic accident list for 1984
| # | Date | Location | Vehicles | Drunk persons | Fatalites | Persons | Pedestrians |
|---|
| 1 | Feb 3, 1984 10:38 PM | S115020106 | 2 | 1
| 1 | 3 | - |
| 2 | Aug 31, 1984 11:20 PM | 0665010140 | 1 | 1
| 2 | 3 | - |
Maryville fatal car crash and road traffic accident list for 1982
| # | Date | Location | Vehicles | Drunk persons | Fatalites | Persons | Pedestrians |
|---|
| 1 | Jul 6, 1982 01:31 PM | S115010106 | 2 | - | 1
| 2 | - |
| 2 | Oct 22, 1982 07:03 PM | S033010000 | 1 | - | 1
| 1 | - |
Maryville fatal car crash and road traffic accident list for 1981
- Fatal accident count4
- Vehicles involved in fatal accidents6
- Fatal accidents involving drunk persons1
- Fatalities5
- Persons involved in fatal accidents10
Average EMS response time
- Maryville(Based on 4 reports) 4.5 mins
- Blount County(Based on 13 reports) 8.8 mins
- Tennessee(Based on 865 reports) 8.9 mins
Dark - Lighted
- Maryville(Based on 4 reports) 75.0%
- Blount County(Based on 17 reports) 23.5%
- Tennessee(Based on 972 reports) 16.0%
Daylight
- Maryville(Based on 4 reports) 25.0%
- Blount County(Based on 17 reports) 47.1%
- Tennessee(Based on 972 reports) 41.4%
Clear
- Maryville(Based on 4 reports) 100.0%
- Blount County(Based on 17 reports) 94.1%
- Tennessee(Based on 983 reports) 89.1%
Maryville fatal car crash and road traffic accident list for 1976
- Fatal accident count7
- Vehicles involved in fatal accidents10
- Fatal accidents involving drunk persons2
- Fatalities8
- Persons involved in fatal accidents16
Daylight
- Maryville(Based on 7 reports) 42.9%
- Blount County(Based on 17 reports) 47.1%
- Tennessee(Based on 971 reports) 46.4%
Dark - Not Lighted
- Maryville(Based on 7 reports) 42.9%
- Blount County(Based on 17 reports) 47.1%
- Tennessee(Based on 971 reports) 34.9%
Dark - Lighted
- Maryville(Based on 7 reports) 14.3%
- Blount County(Based on 17 reports) 5.9%
- Tennessee(Based on 971 reports) 16.0%
Clear
- Maryville(Based on 7 reports) 100.0%
- Blount County(Based on 17 reports) 94.1%
- Tennessee(Based on 987 reports) 85.9%
Maryville fatal car crash and road traffic accident list for 1975
- Fatal accident count7
- Vehicles involved in fatal accidents10
- Fatal accidents involving drunk persons2
- Fatalities8
- Persons involved in fatal accidents16
Daylight
- Maryville(Based on 7 reports) 42.9%
- Blount County(Based on 17 reports) 47.1%
- Tennessee(Based on 971 reports) 46.4%
Dark - Not Lighted
- Maryville(Based on 7 reports) 42.9%
- Blount County(Based on 17 reports) 47.1%
- Tennessee(Based on 971 reports) 34.9%
Dark - Lighted
- Maryville(Based on 7 reports) 14.3%
- Blount County(Based on 17 reports) 5.9%
- Tennessee(Based on 971 reports) 16.0%
Clear
- Maryville(Based on 7 reports) 100.0%
- Blount County(Based on 17 reports) 94.1%
- Tennessee(Based on 987 reports) 85.9%