Apple Valley, Minnesota Submit your own pictures of this city and show them to the world
OSM Map
General Map
Google Map
MSN Map
OSM Map
General Map
Google Map
MSN Map
OSM Map
General Map
Google Map
MSN Map
OSM Map
General Map
Google Map
MSN Map
Please wait while loading the map...
Population in 2022: 55,416 (100% urban, 0% rural). Population change since 2000: +21.7%Males: 26,738 Females: 28,678
March 2022 cost of living index in Apple Valley: 114.5 (more than average, U.S. average is 100) Percentage of residents living in poverty in 2022: 5.9%for White Non-Hispanic residents , 14.4% for Black residents , 12.9% for Hispanic or Latino residents , 4.3% for American Indian residents , 7.5% for other race residents , 10.7% for two or more races residents )
Profiles of local businesses
Business Search - 14 Million verified businesses
Data:
Median household income ($)
Median household income (% change since 2000)
Household income diversity
Ratio of average income to average house value (%)
Ratio of average income to average rent
Median household income ($) - White
Median household income ($) - Black or African American
Median household income ($) - Asian
Median household income ($) - Hispanic or Latino
Median household income ($) - American Indian and Alaska Native
Median household income ($) - Multirace
Median household income ($) - Other Race
Median household income for houses/condos with a mortgage ($)
Median household income for apartments without a mortgage ($)
Races - White alone (%)
Races - White alone (% change since 2000)
Races - Black alone (%)
Races - Black alone (% change since 2000)
Races - American Indian alone (%)
Races - American Indian alone (% change since 2000)
Races - Asian alone (%)
Races - Asian alone (% change since 2000)
Races - Hispanic (%)
Races - Hispanic (% change since 2000)
Races - Native Hawaiian and Other Pacific Islander alone (%)
Races - Native Hawaiian and Other Pacific Islander alone (% change since 2000)
Races - Two or more races (%)
Races - Two or more races (% change since 2000)
Races - Other race alone (%)
Races - Other race alone (% change since 2000)
Racial diversity
Unemployment (%)
Unemployment (% change since 2000)
Unemployment (%) - White
Unemployment (%) - Black or African American
Unemployment (%) - Asian
Unemployment (%) - Hispanic or Latino
Unemployment (%) - American Indian and Alaska Native
Unemployment (%) - Multirace
Unemployment (%) - Other Race
Population density (people per square mile)
Population - Males (%)
Population - Females (%)
Population - Males (%) - White
Population - Males (%) - Black or African American
Population - Males (%) - Asian
Population - Males (%) - Hispanic or Latino
Population - Males (%) - American Indian and Alaska Native
Population - Males (%) - Multirace
Population - Males (%) - Other Race
Population - Females (%) - White
Population - Females (%) - Black or African American
Population - Females (%) - Asian
Population - Females (%) - Hispanic or Latino
Population - Females (%) - American Indian and Alaska Native
Population - Females (%) - Multirace
Population - Females (%) - Other Race
Coronavirus confirmed cases (May 01, 2024)
Deaths caused by coronavirus (May 01, 2024)
Coronavirus confirmed cases (per 100k population) (May 01, 2024)
Deaths caused by coronavirus (per 100k population) (May 01, 2024)
Daily increase in number of cases (May 01, 2024)
Weekly increase in number of cases (May 01, 2024)
Cases doubled (in days) (May 01, 2024)
Hospitalized patients (Apr 18, 2022)
Negative test results (Apr 18, 2022)
Total test results (Apr 18, 2022)
COVID Vaccine doses distributed (per 100k population) (Sep 19, 2023)
COVID Vaccine doses administered (per 100k population) (Sep 19, 2023)
COVID Vaccine doses distributed (Sep 19, 2023)
COVID Vaccine doses administered (Sep 19, 2023)
Likely homosexual households (%)
Likely homosexual households (% change since 2000)
Likely homosexual households - Lesbian couples (%)
Likely homosexual households - Lesbian couples (% change since 2000)
Likely homosexual households - Gay men (%)
Likely homosexual households - Gay men (% change since 2000)
Cost of living index
Median gross rent ($)
Median contract rent ($)
Median monthly housing costs ($)
Median house or condo value ($)
Median house or condo value ($ change since 2000)
Mean house or condo value by units in structure - 1, detached ($)
Mean house or condo value by units in structure - 1, attached ($)
Mean house or condo value by units in structure - 2 ($)
Mean house or condo value by units in structure by units in structure - 3 or 4 ($)
Mean house or condo value by units in structure - 5 or more ($)
Mean house or condo value by units in structure - Boat, RV, van, etc. ($)
Mean house or condo value by units in structure - Mobile home ($)
Median house or condo value ($) - White
Median house or condo value ($) - Black or African American
Median house or condo value ($) - Asian
Median house or condo value ($) - Hispanic or Latino
Median house or condo value ($) - American Indian and Alaska Native
Median house or condo value ($) - Multirace
Median house or condo value ($) - Other Race
Median resident age
Resident age diversity
Median resident age - Males
Median resident age - Females
Median resident age - White
Median resident age - Black or African American
Median resident age - Asian
Median resident age - Hispanic or Latino
Median resident age - American Indian and Alaska Native
Median resident age - Multirace
Median resident age - Other Race
Median resident age - Males - White
Median resident age - Males - Black or African American
Median resident age - Males - Asian
Median resident age - Males - Hispanic or Latino
Median resident age - Males - American Indian and Alaska Native
Median resident age - Males - Multirace
Median resident age - Males - Other Race
Median resident age - Females - White
Median resident age - Females - Black or African American
Median resident age - Females - Asian
Median resident age - Females - Hispanic or Latino
Median resident age - Females - American Indian and Alaska Native
Median resident age - Females - Multirace
Median resident age - Females - Other Race
Commute - mean travel time to work (minutes)
Travel time to work - Less than 5 minutes (%)
Travel time to work - Less than 5 minutes (% change since 2000)
Travel time to work - 5 to 9 minutes (%)
Travel time to work - 5 to 9 minutes (% change since 2000)
Travel time to work - 10 to 19 minutes (%)
Travel time to work - 10 to 19 minutes (% change since 2000)
Travel time to work - 20 to 29 minutes (%)
Travel time to work - 20 to 29 minutes (% change since 2000)
Travel time to work - 30 to 39 minutes (%)
Travel time to work - 30 to 39 minutes (% change since 2000)
Travel time to work - 40 to 59 minutes (%)
Travel time to work - 40 to 59 minutes (% change since 2000)
Travel time to work - 60 to 89 minutes (%)
Travel time to work - 60 to 89 minutes (% change since 2000)
Travel time to work - 90 or more minutes (%)
Travel time to work - 90 or more minutes (% change since 2000)
Marital status - Never married (%)
Marital status - Now married (%)
Marital status - Separated (%)
Marital status - Widowed (%)
Marital status - Divorced (%)
Median family income ($)
Median family income (% change since 2000)
Median non-family income ($)
Median non-family income (% change since 2000)
Median per capita income ($)
Median per capita income (% change since 2000)
Median family income ($) - White
Median family income ($) - Black or African American
Median family income ($) - Asian
Median family income ($) - Hispanic or Latino
Median family income ($) - American Indian and Alaska Native
Median family income ($) - Multirace
Median family income ($) - Other Race
Median year house/condo built
Median year apartment built
Year house built - Built 2005 or later (%)
Year house built - Built 2000 to 2004 (%)
Year house built - Built 1990 to 1999 (%)
Year house built - Built 1980 to 1989 (%)
Year house built - Built 1970 to 1979 (%)
Year house built - Built 1960 to 1969 (%)
Year house built - Built 1950 to 1959 (%)
Year house built - Built 1940 to 1949 (%)
Year house built - Built 1939 or earlier (%)
Average household size
Household density (households per square mile)
Average household size - White
Average household size - Black or African American
Average household size - Asian
Average household size - Hispanic or Latino
Average household size - American Indian and Alaska Native
Average household size - Multirace
Average household size - Other Race
Occupied housing units (%)
Vacant housing units (%)
Owner occupied housing units (%)
Renter occupied housing units (%)
Vacancy status - For rent (%)
Vacancy status - For sale only (%)
Vacancy status - Rented or sold, not occupied (%)
Vacancy status - For seasonal, recreational, or occasional use (%)
Vacancy status - For migrant workers (%)
Vacancy status - Other vacant (%)
Residents with income below the poverty level (%)
Residents with income below 50% of the poverty level (%)
Children below poverty level (%)
Poor families by family type - Married-couple family (%)
Poor families by family type - Male, no wife present (%)
Poor families by family type - Female, no husband present (%)
Poverty status for native-born residents (%)
Poverty status for foreign-born residents (%)
Poverty among high school graduates not in families (%)
Poverty among people who did not graduate high school not in families (%)
Residents with income below the poverty level (%) - White
Residents with income below the poverty level (%) - Black or African American
Residents with income below the poverty level (%) - Asian
Residents with income below the poverty level (%) - Hispanic or Latino
Residents with income below the poverty level (%) - American Indian and Alaska Native
Residents with income below the poverty level (%) - Multirace
Residents with income below the poverty level (%) - Other Race
Air pollution - Air Quality Index (AQI)
Air pollution - CO
Air pollution - NO2
Air pollution - SO2
Air pollution - Ozone
Air pollution - PM10
Air pollution - PM25
Air pollution - Pb
Crime - Murders per 100,000 population
Crime - Rapes per 100,000 population
Crime - Robberies per 100,000 population
Crime - Assaults per 100,000 population
Crime - Burglaries per 100,000 population
Crime - Thefts per 100,000 population
Crime - Auto thefts per 100,000 population
Crime - Arson per 100,000 population
Crime - City-data.com crime index
Crime - Violent crime index
Crime - Property crime index
Crime - Murders per 100,000 population (5 year average)
Crime - Rapes per 100,000 population (5 year average)
Crime - Robberies per 100,000 population (5 year average)
Crime - Assaults per 100,000 population (5 year average)
Crime - Burglaries per 100,000 population (5 year average)
Crime - Thefts per 100,000 population (5 year average)
Crime - Auto thefts per 100,000 population (5 year average)
Crime - Arson per 100,000 population (5 year average)
Crime - City-data.com crime index (5 year average)
Crime - Violent crime index (5 year average)
Crime - Property crime index (5 year average)
1996 Presidential Elections Results (%) - Democratic Party (Clinton)
1996 Presidential Elections Results (%) - Republican Party (Dole)
1996 Presidential Elections Results (%) - Other
2000 Presidential Elections Results (%) - Democratic Party (Gore)
2000 Presidential Elections Results (%) - Republican Party (Bush)
2000 Presidential Elections Results (%) - Other
2004 Presidential Elections Results (%) - Democratic Party (Kerry)
2004 Presidential Elections Results (%) - Republican Party (Bush)
2004 Presidential Elections Results (%) - Other
2008 Presidential Elections Results (%) - Democratic Party (Obama)
2008 Presidential Elections Results (%) - Republican Party (McCain)
2008 Presidential Elections Results (%) - Other
2012 Presidential Elections Results (%) - Democratic Party (Obama)
2012 Presidential Elections Results (%) - Republican Party (Romney)
2012 Presidential Elections Results (%) - Other
2016 Presidential Elections Results (%) - Democratic Party (Clinton)
2016 Presidential Elections Results (%) - Republican Party (Trump)
2016 Presidential Elections Results (%) - Other
2020 Presidential Elections Results (%) - Democratic Party (Biden)
2020 Presidential Elections Results (%) - Republican Party (Trump)
2020 Presidential Elections Results (%) - Other
Ancestries Reported - Arab (%)
Ancestries Reported - Czech (%)
Ancestries Reported - Danish (%)
Ancestries Reported - Dutch (%)
Ancestries Reported - English (%)
Ancestries Reported - French (%)
Ancestries Reported - French Canadian (%)
Ancestries Reported - German (%)
Ancestries Reported - Greek (%)
Ancestries Reported - Hungarian (%)
Ancestries Reported - Irish (%)
Ancestries Reported - Italian (%)
Ancestries Reported - Lithuanian (%)
Ancestries Reported - Norwegian (%)
Ancestries Reported - Polish (%)
Ancestries Reported - Portuguese (%)
Ancestries Reported - Russian (%)
Ancestries Reported - Scotch-Irish (%)
Ancestries Reported - Scottish (%)
Ancestries Reported - Slovak (%)
Ancestries Reported - Subsaharan African (%)
Ancestries Reported - Swedish (%)
Ancestries Reported - Swiss (%)
Ancestries Reported - Ukrainian (%)
Ancestries Reported - United States (%)
Ancestries Reported - Welsh (%)
Ancestries Reported - West Indian (%)
Ancestries Reported - Other (%)
Educational Attainment - No schooling completed (%)
Educational Attainment - Less than high school (%)
Educational Attainment - High school or equivalent (%)
Educational Attainment - Less than 1 year of college (%)
Educational Attainment - 1 or more years of college (%)
Educational Attainment - Associate degree (%)
Educational Attainment - Bachelor's degree (%)
Educational Attainment - Master's degree (%)
Educational Attainment - Professional school degree (%)
Educational Attainment - Doctorate degree (%)
School Enrollment - Nursery, preschool (%)
School Enrollment - Kindergarten (%)
School Enrollment - Grade 1 to 4 (%)
School Enrollment - Grade 5 to 8 (%)
School Enrollment - Grade 9 to 12 (%)
School Enrollment - College undergrad (%)
School Enrollment - Graduate or professional (%)
School Enrollment - Not enrolled in school (%)
School enrollment - Public schools (%)
School enrollment - Private schools (%)
School enrollment - Not enrolled (%)
Median number of rooms in houses and condos
Median number of rooms in apartments
Housing units lacking complete plumbing facilities (%)
Housing units lacking complete kitchen facilities (%)
Density of houses
Urban houses (%)
Rural houses (%)
Households with people 60 years and over (%)
Households with people 65 years and over (%)
Households with people 75 years and over (%)
Households with one or more nonrelatives (%)
Households with no nonrelatives (%)
Population in households (%)
Family households (%)
Nonfamily households (%)
Population in families (%)
Family households with own children (%)
Median number of bedrooms in owner occupied houses
Mean number of bedrooms in owner occupied houses
Median number of bedrooms in renter occupied houses
Mean number of bedrooms in renter occupied houses
Median number of vehichles in owner occupied houses
Mean number of vehichles in owner occupied houses
Median number of vehichles in renter occupied houses
Mean number of vehichles in renter occupied houses
Mortgage status - with mortgage (%)
Mortgage status - with second mortgage (%)
Mortgage status - with home equity loan (%)
Mortgage status - with both second mortgage and home equity loan (%)
Mortgage status - without a mortgage (%)
Average family size
Average family size - White
Average family size - Black or African American
Average family size - Asian
Average family size - Hispanic or Latino
Average family size - American Indian and Alaska Native
Average family size - Multirace
Average family size - Other Race
Geographical mobility - Same house 1 year ago (%)
Geographical mobility - Moved within same county (%)
Geographical mobility - Moved from different county within same state (%)
Geographical mobility - Moved from different state (%)
Geographical mobility - Moved from abroad (%)
Place of birth - Born in state of residence (%)
Place of birth - Born in other state (%)
Place of birth - Native, outside of US (%)
Place of birth - Foreign born (%)
Housing units in structures - 1, detached (%)
Housing units in structures - 1, attached (%)
Housing units in structures - 2 (%)
Housing units in structures - 3 or 4 (%)
Housing units in structures - 5 to 9 (%)
Housing units in structures - 10 to 19 (%)
Housing units in structures - 20 to 49 (%)
Housing units in structures - 50 or more (%)
Housing units in structures - Mobile home (%)
Housing units in structures - Boat, RV, van, etc. (%)
House/condo owner moved in on average (years ago)
Renter moved in on average (years ago)
Year householder moved into unit - Moved in 1999 to March 2000 (%)
Year householder moved into unit - Moved in 1995 to 1998 (%)
Year householder moved into unit - Moved in 1990 to 1994 (%)
Year householder moved into unit - Moved in 1980 to 1989 (%)
Year householder moved into unit - Moved in 1970 to 1979 (%)
Year householder moved into unit - Moved in 1969 or earlier (%)
Means of transportation to work - Drove car alone (%)
Means of transportation to work - Carpooled (%)
Means of transportation to work - Public transportation (%)
Means of transportation to work - Bus or trolley bus (%)
Means of transportation to work - Streetcar or trolley car (%)
Means of transportation to work - Subway or elevated (%)
Means of transportation to work - Railroad (%)
Means of transportation to work - Ferryboat (%)
Means of transportation to work - Taxicab (%)
Means of transportation to work - Motorcycle (%)
Means of transportation to work - Bicycle (%)
Means of transportation to work - Walked (%)
Means of transportation to work - Other means (%)
Working at home (%)
Industry diversity
Most Common Industries - Agriculture, forestry, fishing and hunting, and mining (%)
Most Common Industries - Agriculture, forestry, fishing and hunting (%)
Most Common Industries - Mining, quarrying, and oil and gas extraction (%)
Most Common Industries - Construction (%)
Most Common Industries - Manufacturing (%)
Most Common Industries - Wholesale trade (%)
Most Common Industries - Retail trade (%)
Most Common Industries - Transportation and warehousing, and utilities (%)
Most Common Industries - Transportation and warehousing (%)
Most Common Industries - Utilities (%)
Most Common Industries - Information (%)
Most Common Industries - Finance and insurance, and real estate and rental and leasing (%)
Most Common Industries - Finance and insurance (%)
Most Common Industries - Real estate and rental and leasing (%)
Most Common Industries - Professional, scientific, and management, and administrative and waste management services (%)
Most Common Industries - Professional, scientific, and technical services (%)
Most Common Industries - Management of companies and enterprises (%)
Most Common Industries - Administrative and support and waste management services (%)
Most Common Industries - Educational services, and health care and social assistance (%)
Most Common Industries - Educational services (%)
Most Common Industries - Health care and social assistance (%)
Most Common Industries - Arts, entertainment, and recreation, and accommodation and food services (%)
Most Common Industries - Arts, entertainment, and recreation (%)
Most Common Industries - Accommodation and food services (%)
Most Common Industries - Other services, except public administration (%)
Most Common Industries - Public administration (%)
Occupation diversity
Most Common Occupations - Management, business, science, and arts occupations (%)
Most Common Occupations - Management, business, and financial occupations (%)
Most Common Occupations - Management occupations (%)
Most Common Occupations - Business and financial operations occupations (%)
Most Common Occupations - Computer, engineering, and science occupations (%)
Most Common Occupations - Computer and mathematical occupations (%)
Most Common Occupations - Architecture and engineering occupations (%)
Most Common Occupations - Life, physical, and social science occupations (%)
Most Common Occupations - Education, legal, community service, arts, and media occupations (%)
Most Common Occupations - Community and social service occupations (%)
Most Common Occupations - Legal occupations (%)
Most Common Occupations - Education, training, and library occupations (%)
Most Common Occupations - Arts, design, entertainment, sports, and media occupations (%)
Most Common Occupations - Healthcare practitioners and technical occupations (%)
Most Common Occupations - Health diagnosing and treating practitioners and other technical occupations (%)
Most Common Occupations - Health technologists and technicians (%)
Most Common Occupations - Service occupations (%)
Most Common Occupations - Healthcare support occupations (%)
Most Common Occupations - Protective service occupations (%)
Most Common Occupations - Fire fighting and prevention, and other protective service workers including supervisors (%)
Most Common Occupations - Law enforcement workers including supervisors (%)
Most Common Occupations - Food preparation and serving related occupations (%)
Most Common Occupations - Building and grounds cleaning and maintenance occupations (%)
Most Common Occupations - Personal care and service occupations (%)
Most Common Occupations - Sales and office occupations (%)
Most Common Occupations - Sales and related occupations (%)
Most Common Occupations - Office and administrative support occupations (%)
Most Common Occupations - Natural resources, construction, and maintenance occupations (%)
Most Common Occupations - Farming, fishing, and forestry occupations (%)
Most Common Occupations - Construction and extraction occupations (%)
Most Common Occupations - Installation, maintenance, and repair occupations (%)
Most Common Occupations - Production, transportation, and material moving occupations (%)
Most Common Occupations - Production occupations (%)
Most Common Occupations - Transportation occupations (%)
Most Common Occupations - Material moving occupations (%)
People in Group quarters - Institutionalized population (%)
People in Group quarters - Correctional institutions (%)
People in Group quarters - Federal prisons and detention centers (%)
People in Group quarters - Halfway houses (%)
People in Group quarters - Local jails and other confinement facilities (including police lockups) (%)
People in Group quarters - Military disciplinary barracks (%)
People in Group quarters - State prisons (%)
People in Group quarters - Other types of correctional institutions (%)
People in Group quarters - Nursing homes (%)
People in Group quarters - Hospitals/wards, hospices, and schools for the handicapped (%)
People in Group quarters - Hospitals/wards and hospices for chronically ill (%)
People in Group quarters - Hospices or homes for chronically ill (%)
People in Group quarters - Military hospitals or wards for chronically ill (%)
People in Group quarters - Other hospitals or wards for chronically ill (%)
People in Group quarters - Hospitals or wards for drug/alcohol abuse (%)
People in Group quarters - Mental (Psychiatric) hospitals or wards (%)
People in Group quarters - Schools, hospitals, or wards for the mentally retarded (%)
People in Group quarters - Schools, hospitals, or wards for the physically handicapped (%)
People in Group quarters - Institutions for the deaf (%)
People in Group quarters - Institutions for the blind (%)
People in Group quarters - Orthopedic wards and institutions for the physically handicapped (%)
People in Group quarters - Wards in general hospitals for patients who have no usual home elsewhere (%)
People in Group quarters - Wards in military hospitals for patients who have no usual home elsewhere (%)
People in Group quarters - Juvenile institutions (%)
People in Group quarters - Long-term care (%)
People in Group quarters - Homes for abused, dependent, and neglected children (%)
People in Group quarters - Residential treatment centers for emotionally disturbed children (%)
People in Group quarters - Training schools for juvenile delinquents (%)
People in Group quarters - Short-term care, detention or diagnostic centers for delinquent children (%)
People in Group quarters - Type of juvenile institution unknown (%)
People in Group quarters - Noninstitutionalized population (%)
People in Group quarters - College dormitories (includes college quarters off campus) (%)
People in Group quarters - Military quarters (%)
People in Group quarters - On base (%)
People in Group quarters - Barracks, unaccompanied personnel housing (UPH), (Enlisted/Officer), ;and similar group living quarters for military personnel (%)
People in Group quarters - Transient quarters for temporary residents (%)
People in Group quarters - Military ships (%)
People in Group quarters - Group homes (%)
People in Group quarters - Homes or halfway houses for drug/alcohol abuse (%)
People in Group quarters - Homes for the mentally ill (%)
People in Group quarters - Homes for the mentally retarded (%)
People in Group quarters - Homes for the physically handicapped (%)
People in Group quarters - Other group homes (%)
People in Group quarters - Religious group quarters (%)
People in Group quarters - Dormitories (%)
People in Group quarters - Agriculture workers' dormitories on farms (%)
People in Group quarters - Job Corps and vocational training facilities (%)
People in Group quarters - Other workers' dormitories (%)
People in Group quarters - Crews of maritime vessels (%)
People in Group quarters - Other nonhousehold living situations (%)
People in Group quarters - Other noninstitutional group quarters (%)
Residents speaking English at home (%)
Residents speaking English at home - Born in the United States (%)
Residents speaking English at home - Native, born elsewhere (%)
Residents speaking English at home - Foreign born (%)
Residents speaking Spanish at home (%)
Residents speaking Spanish at home - Born in the United States (%)
Residents speaking Spanish at home - Native, born elsewhere (%)
Residents speaking Spanish at home - Foreign born (%)
Residents speaking other language at home (%)
Residents speaking other language at home - Born in the United States (%)
Residents speaking other language at home - Native, born elsewhere (%)
Residents speaking other language at home - Foreign born (%)
Class of Workers - Employee of private company (%)
Class of Workers - Self-employed in own incorporated business (%)
Class of Workers - Private not-for-profit wage and salary workers (%)
Class of Workers - Local government workers (%)
Class of Workers - State government workers (%)
Class of Workers - Federal government workers (%)
Class of Workers - Self-employed workers in own not incorporated business and Unpaid family workers (%)
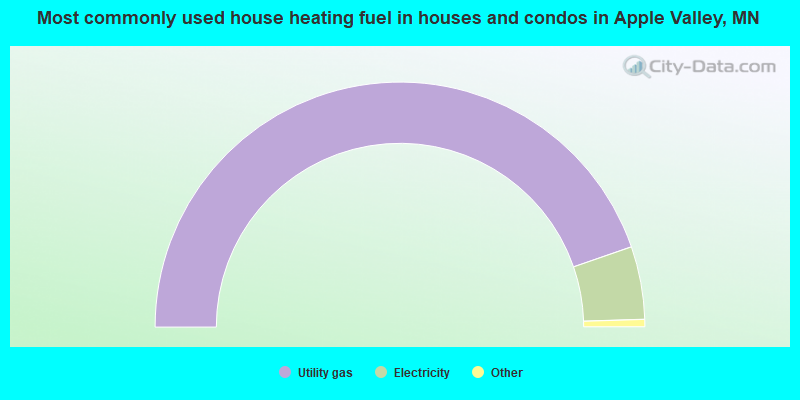
House heating fuel used in houses and condos - Utility gas (%)
House heating fuel used in houses and condos - Bottled, tank, or LP gas (%)
House heating fuel used in houses and condos - Electricity (%)
House heating fuel used in houses and condos - Fuel oil, kerosene, etc. (%)
House heating fuel used in houses and condos - Coal or coke (%)
House heating fuel used in houses and condos - Wood (%)
House heating fuel used in houses and condos - Solar energy (%)
House heating fuel used in houses and condos - Other fuel (%)
House heating fuel used in houses and condos - No fuel used (%)
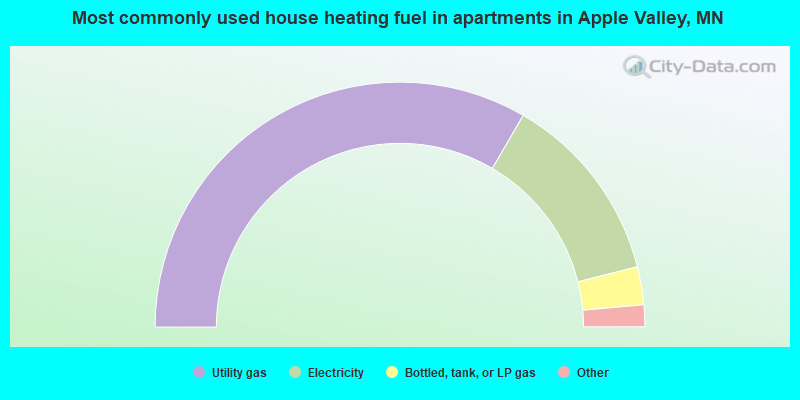
House heating fuel used in apartments - Utility gas (%)
House heating fuel used in apartments - Bottled, tank, or LP gas (%)
House heating fuel used in apartments - Electricity (%)
House heating fuel used in apartments - Fuel oil, kerosene, etc. (%)
House heating fuel used in apartments - Coal or coke (%)
House heating fuel used in apartments - Wood (%)
House heating fuel used in apartments - Solar energy (%)
House heating fuel used in apartments - Other fuel (%)
House heating fuel used in apartments - No fuel used (%)
Armed forces status - In Armed Forces (%)
Armed forces status - Civilian (%)
Armed forces status - Civilian - Veteran (%)
Armed forces status - Civilian - Nonveteran (%)
Fatal accidents locations in years 2005-2021
Fatal accidents locations in 2005
Fatal accidents locations in 2006
Fatal accidents locations in 2007
Fatal accidents locations in 2008
Fatal accidents locations in 2009
Fatal accidents locations in 2010
Fatal accidents locations in 2011
Fatal accidents locations in 2012
Fatal accidents locations in 2013
Fatal accidents locations in 2014
Fatal accidents locations in 2015
Fatal accidents locations in 2016
Fatal accidents locations in 2017
Fatal accidents locations in 2018
Fatal accidents locations in 2019
Fatal accidents locations in 2020
Fatal accidents locations in 2021
Alcohol use - People drinking some alcohol every month (%)
Alcohol use - People not drinking at all (%)
Alcohol use - Average days/month drinking alcohol
Alcohol use - Average drinks/week
Alcohol use - Average days/year people drink much
Audiometry - Average condition of hearing (%)
Audiometry - People that can hear a whisper from across a quiet room (%)
Audiometry - People that can hear normal voice from across a quiet room (%)
Audiometry - Ears ringing, roaring, buzzing (%)
Audiometry - Had a job exposure to loud noise (%)
Audiometry - Had off-work exposure to loud noise (%)
Blood Pressure & Cholesterol - Has high blood pressure (%)
Blood Pressure & Cholesterol - Checking blood pressure at home (%)
Blood Pressure & Cholesterol - Frequently checking blood cholesterol (%)
Blood Pressure & Cholesterol - Has high cholesterol level (%)
Consumer Behavior - Money monthly spent on food at supermarket/grocery store
Consumer Behavior - Money monthly spent on food at other stores
Consumer Behavior - Money monthly spent on eating out
Consumer Behavior - Money monthly spent on carryout/delivered foods
Consumer Behavior - Income spent on food at supermarket/grocery store (%)
Consumer Behavior - Income spent on food at other stores (%)
Consumer Behavior - Income spent on eating out (%)
Consumer Behavior - Income spent on carryout/delivered foods (%)
Current Health Status - General health condition (%)
Current Health Status - Blood donors (%)
Current Health Status - Has blood ever tested for HIV virus (%)
Current Health Status - Left-handed people (%)
Dermatology - People using sunscreen (%)
Diabetes - Diabetics (%)
Diabetes - Had a blood test for high blood sugar (%)
Diabetes - People taking insulin (%)
Diet Behavior & Nutrition - Diet health (%)
Diet Behavior & Nutrition - Milk product consumption (# of products/month)
Diet Behavior & Nutrition - Meals not home prepared (#/week)
Diet Behavior & Nutrition - Meals from fast food or pizza place (#/week)
Diet Behavior & Nutrition - Ready-to-eat foods (#/month)
Diet Behavior & Nutrition - Frozen meals/pizza (#/month)
Drug Use - People that ever used marijuana or hashish (%)
Drug Use - Ever used hard drugs (%)
Drug Use - Ever used any form of cocaine (%)
Drug Use - Ever used heroin (%)
Drug Use - Ever used methamphetamine (%)
Health Insurance - People covered by health insurance (%)
Kidney Conditions-Urology - Avg. # of times urinating at night
Medical Conditions - People with asthma (%)
Medical Conditions - People with anemia (%)
Medical Conditions - People with psoriasis (%)
Medical Conditions - People with overweight (%)
Medical Conditions - Elderly people having difficulties in thinking or remembering (%)
Medical Conditions - People who ever received blood transfusion (%)
Medical Conditions - People having trouble seeing even with glass/contacts (%)
Medical Conditions - People with arthritis (%)
Medical Conditions - People with gout (%)
Medical Conditions - People with congestive heart failure (%)
Medical Conditions - People with coronary heart disease (%)
Medical Conditions - People with angina pectoris (%)
Medical Conditions - People who ever had heart attack (%)
Medical Conditions - People who ever had stroke (%)
Medical Conditions - People with emphysema (%)
Medical Conditions - People with thyroid problem (%)
Medical Conditions - People with chronic bronchitis (%)
Medical Conditions - People with any liver condition (%)
Medical Conditions - People who ever had cancer or malignancy (%)
Mental Health - People who have little interest in doing things (%)
Mental Health - People feeling down, depressed, or hopeless (%)
Mental Health - People who have trouble sleeping or sleeping too much (%)
Mental Health - People feeling tired or having little energy (%)
Mental Health - People with poor appetite or overeating (%)
Mental Health - People feeling bad about themself (%)
Mental Health - People who have trouble concentrating on things (%)
Mental Health - People moving or speaking slowly or too fast (%)
Mental Health - People having thoughts they would be better off dead (%)
Oral Health - Average years since last visit a dentist
Oral Health - People embarrassed because of mouth (%)
Oral Health - People with gum disease (%)
Oral Health - General health of teeth and gums (%)
Oral Health - Average days a week using dental floss/device
Oral Health - Average days a week using mouthwash for dental problem
Oral Health - Average number of teeth
Pesticide Use - Households using pesticides to control insects (%)
Pesticide Use - Households using pesticides to kill weeds (%)
Physical Activity - People doing vigorous-intensity work activities (%)
Physical Activity - People doing moderate-intensity work activities (%)
Physical Activity - People walking or bicycling (%)
Physical Activity - People doing vigorous-intensity recreational activities (%)
Physical Activity - People doing moderate-intensity recreational activities (%)
Physical Activity - Average hours a day doing sedentary activities
Physical Activity - Average hours a day watching TV or videos
Physical Activity - Average hours a day using computer
Physical Functioning - People having limitations keeping them from working (%)
Physical Functioning - People limited in amount of work they can do (%)
Physical Functioning - People that need special equipment to walk (%)
Physical Functioning - People experiencing confusion/memory problems (%)
Physical Functioning - People requiring special healthcare equipment (%)
Prescription Medications - Average number of prescription medicines taking
Preventive Aspirin Use - Adults 40+ taking low-dose aspirin (%)
Reproductive Health - Vaginal deliveries (%)
Reproductive Health - Cesarean deliveries (%)
Reproductive Health - Deliveries resulted in a live birth (%)
Reproductive Health - Pregnancies resulted in a delivery (%)
Reproductive Health - Women breastfeeding newborns (%)
Reproductive Health - Women that had a hysterectomy (%)
Reproductive Health - Women that had both ovaries removed (%)
Reproductive Health - Women that have ever taken birth control pills (%)
Reproductive Health - Women taking birth control pills (%)
Reproductive Health - Women that have ever used Depo-Provera or injectables (%)
Reproductive Health - Women that have ever used female hormones (%)
Sexual Behavior - People 18+ that ever had sex (vaginal, anal, or oral) (%)
Sexual Behavior - Males 18+ that ever had vaginal sex with a woman (%)
Sexual Behavior - Males 18+ that ever performed oral sex on a woman (%)
Sexual Behavior - Males 18+ that ever had anal sex with a woman (%)
Sexual Behavior - Males 18+ that ever had any sex with a man (%)
Sexual Behavior - Females 18+ that ever had vaginal sex with a man (%)
Sexual Behavior - Females 18+ that ever performed oral sex on a man (%)
Sexual Behavior - Females 18+ that ever had anal sex with a man (%)
Sexual Behavior - Females 18+ that ever had any kind of sex with a woman (%)
Sexual Behavior - Average age people first had sex
Sexual Behavior - Average number of female sex partners in lifetime (males 18+)
Sexual Behavior - Average number of female vaginal sex partners in lifetime (males 18+)
Sexual Behavior - Average age people first performed oral sex on a woman (18+)
Sexual Behavior - Average number of woman performed oral sex on in lifetime (18+)
Sexual Behavior - Average number of male sex partners in lifetime (males 18+)
Sexual Behavior - Average number of male anal sex partners in lifetime (males 18+)
Sexual Behavior - Average age people first performed oral sex on a man (18+)
Sexual Behavior - Average number of male oral sex partners in lifetime (18+)
Sexual Behavior - People using protection when performing oral sex (%)
Sexual Behavior - Average number of times people have vaginal or anal sex a year
Sexual Behavior - People having sex without condom (%)
Sexual Behavior - Average number of male sex partners in lifetime (females 18+)
Sexual Behavior - Average number of male vaginal sex partners in lifetime (females 18+)
Sexual Behavior - Average number of female sex partners in lifetime (females 18+)
Sexual Behavior - Circumcised males 18+ (%)
Sleep Disorders - Average hours sleeping at night
Sleep Disorders - People that has trouble sleeping (%)
Smoking-Cigarette Use - People smoking cigarettes (%)
Taste & Smell - People 40+ having problems with smell (%)
Taste & Smell - People 40+ having problems with taste (%)
Taste & Smell - People 40+ that ever had wisdom teeth removed (%)
Taste & Smell - People 40+ that ever had tonsils teeth removed (%)
Taste & Smell - People 40+ that ever had a loss of consciousness because of a head injury (%)
Taste & Smell - People 40+ that ever had a broken nose or other serious injury to face or skull (%)
Taste & Smell - People 40+ that ever had two or more sinus infections (%)
Weight - Average height (inches)
Weight - Average weight (pounds)
Weight - Average BMI
Weight - People that are obese (%)
Weight - People that ever were obese (%)
Weight - People trying to lose weight (%)
According to our research of Minnesota and other state lists, there were 2 registered sex offenders living in Apple Valley, Minnesota as of May 01, 2024 . The ratio of all residents to sex offenders in Apple Valley is 25,675 to 1.The ratio of registered sex offenders to all residents in this city is much lower than the state average.
Officers per 1,000 residents here:
0.94Minnesota average:
1.76
Latest news from Apple Valley, MN collected exclusively by city-data.com from local newspapers, TV, and radio stations
Apple Valley, MN City Guides: Ancestries: German (17.6%), Norwegian (6.7%), European (5.4%), English (5.3%), Irish (3.9%), American (3.9%).
Current Local Time:
Land area: 17.3 square miles.
Population density: 3,196 people per square mile (average).
7,035 residents are foreign born (4.4% Asia , 3.8% Africa , 3.0% Latin America ).
This city:
12.5%Minnesota:
8.5%
Median real estate property taxes paid for housing units with mortgages in 2022: $3,413 (1.0%)Median real estate property taxes paid for housing units with no mortgage in 2022: $3,282 (0.9%)
Nearest city with pop. 50,000+: Burnsville, MN
Nearest city with pop. 200,000+: St. Paul, MN
Nearest city with pop. 1,000,000+: Chicago, IL
Nearest cities:
Coates, MN (2.9 miles)
Latitude: 44.74 N, Longitude: 93.21 W
Daytime population change due to commuting: -9,363 (-16.7%)Workers who live and work in this city: 9,748 (33.6%)
Apple Valley tourist attractions:
Single-family new house construction building permits:
2022: 41 buildings , average cost: $250,1002021: 63 buildings , average cost: $228,6002020: 5 buildings , average cost: $273,6002019: 29 buildings , average cost: $341,3002018: 67 buildings , average cost: $265,4002017: 177 buildings , average cost: $242,8002016: 161 buildings , average cost: $271,2002015: 120 buildings , average cost: $284,4002014: 71 buildings , average cost: $311,9002013: 63 buildings , average cost: $306,6002012: 47 buildings , average cost: $261,4002011: 31 buildings , average cost: $255,8002010: 49 buildings , average cost: $263,8002009: 31 buildings , average cost: $257,8002008: 21 buildings , average cost: $261,0002007: 52 buildings , average cost: $244,6002006: 40 buildings , average cost: $241,8002005: 55 buildings , average cost: $200,8002004: 147 buildings , average cost: $170,0002003: 231 buildings , average cost: $140,6002002: 184 buildings , average cost: $124,7002001: 226 buildings , average cost: $106,4002000: 184 buildings , average cost: $113,3001999: 294 buildings , average cost: $126,2001998: 386 buildings , average cost: $141,1001997: 373 buildings , average cost: $119,100Unemployment in December 2023:
Population change in the 1990s: +10,556 (+30.2%).
Most common occupations in Apple Valley, MN (%)
Both Males Females
Computer specialists (5.2%)
Sales representatives, services, wholesale and manufacturing (5.1%)
Other office and administrative support workers, including supervisors (4.5%)
Other management occupations, except farmers and farm managers (4.2%)
Other sales and related occupations, including supervisors (4.0%)
Retail sales workers, except cashiers (3.8%)
Secretaries and administrative assistants (3.2%)
Computer specialists (7.1%)
Sales representatives, services, wholesale and manufacturing (6.6%)
Other management occupations, except farmers and farm managers (4.7%)
Other sales and related occupations, including supervisors (4.2%)
Vehicle and mobile equipment mechanics, installers, and repairers (3.9%)
Retail sales workers, except cashiers (3.8%)
Electrical equipment mechanics and other installation, maintenance, and repair workers, including supervisors (3.6%)
Other office and administrative support workers, including supervisors (6.9%)
Secretaries and administrative assistants (6.6%)
Information and record clerks, except customer service representatives (4.3%)
Preschool, kindergarten, elementary, and middle school teachers (4.2%)
Registered nurses (4.0%)
Other sales and related occupations, including supervisors (3.8%)
Retail sales workers, except cashiers (3.7%)
Tornado activity:
Apple Valley-area historical tornado activity is slightly above Minnesota state average. It is 34% greater than the overall U.S. average.
On 5/6/1965, a category F4 (max. wind speeds 207-260 mph) tornado 17.5 miles away from the Apple Valley city center caused between $5,000,000 and $50,000,000 in damages.
On 5/6/1965, a category F4 tornado 18.4 miles away from the city center killed 6 people and injured 158 people and caused between $5,000,000 and $50,000,000 in damages.
Earthquake activity:
Apple Valley-area historical earthquake activity is significantly above Minnesota state average. It is 56% smaller than the overall U.S. average. On 7/9/1975 at 14:54:15, a magnitude 4.6 (4.6 MB, Class: Light, Intensity: IV - V) earthquake occurred 152.2 miles away from the city center On 6/5/1993 at 01:24:53, a magnitude 4.1 (4.1 LG, Depth: 6.2 mi) earthquake occurred 163.6 miles away from Apple Valley center On 3/4/1983 at 06:32:18, a magnitude 4.6 (4.4 MB, 4.6 LG, 4.4 ML) earthquake occurred 308.2 miles away from the city center On 10/20/1995 at 15:57:18, a magnitude 3.7 (3.7 LG, Depth: 3.1 mi, Class: Light, Intensity: II - III) earthquake occurred 192.1 miles away from the city center On 2/9/1994 at 08:45:35, a magnitude 3.1 (3.1 LG, Depth: 3.1 mi) earthquake occurred 89.7 miles away from Apple Valley center On 11/3/2002 at 20:41:56, a magnitude 4.3 (4.3 MB, Depth: 3.1 mi) earthquake occurred 315.3 miles away from the city center Magnitude types: regional Lg-wave magnitude (LG), body-wave magnitude (MB), local magnitude (ML) Natural disasters: The number of natural disasters in Dakota County (15) is near the US average (15).Major Disasters (Presidential) Declared: 11Emergencies Declared: 3Floods: 11, Storms: 7, Tornadoes: 5, Drought: 1, Hurricane: 1, Wind: 1, Other: 1 (Note: some incidents may be assigned to more than one category). Hospitals and medical centers in Apple Valley: APPLE VALLEY HEALTH CARE CENTER (14650 GARRETT AVENUE)
AUGUSTANA HCC OF APPLE VALLEY (14650 GARRETT AVENUE)
Other hospitals and medical centers near Apple Valley: BURNSVILLE DIALYSIS OF DAVITA (Dialysis Facility, about 4 miles away; BURNSVILLE, MN)
EBENEZER RIDGES GERIATRIC CARE CENTER (Nursing Home, about 4 miles away; BURNSVILLE, MN)
DCI KENNELLY (Hospital, about 4 miles away; BURNSVILLE, MN)
ALLIANCE HEALTH SERVICES INC (Home Health Center, about 4 miles away; EAGAN, MN)
FAIRVIEW RIDGES HOSPITAL (about 4 miles away; BURNSVILLE, MN)
SUPERIOR HOME HEALTH CARE INC (Home Health Center, about 5 miles away; LAKEVILLE, MN)
MSOCS LAKEVILLE JONQUIL (Hospital, about 5 miles away; LAKEVILLE, MN)
Amtrak station near Apple Valley: 16 miles: ST. PAUL/MINNEAPOLIS (ST. PAUL, 730 TRANSFER RD.) Services: ticket office, fully wheelchair accessible, enclosed waiting area, public restrooms, public payphones, vending machines, free short-term parking, free long-term parking, call for car rental service, taxi stand.
Colleges/universities with over 2000 students nearest to Apple Valley:
Dakota County Technical College (about 7 miles; Rosemount, MN ; Full-time enrollment: 2,478)
Normandale Community College (about 9 miles; Bloomington, MN ; FT enrollment: 7,048)
Inver Hills Community College (about 10 miles; Inver Grove Heights, MN ; FT enrollment: 4,049)
St Catherine University (about 13 miles; Saint Paul, MN ; FT enrollment: 3,771)
Macalester College (about 14 miles; Saint Paul, MN ; FT enrollment: 2,174)
University of St Thomas (about 14 miles; Saint Paul, MN ; FT enrollment: 8,762)
Concordia University-Saint Paul (about 15 miles; Saint Paul, MN ; FT enrollment: 2,501)
Biggest public high schools in Apple Valley: TEA Location: 6950 WEST 146TH STREET, STE 11, Grades: KG-12)
ROSEMOUNT AREA LEARNING CENTER Location: 5840 149TH ST WEST, Grades: 9-12)COOPERATIVE AREA LEARNING PRG. Location: 5840 149TH STREET WEST, Grades: 5-12)
APPLE VALLEY SENIOR HIGH Location: 14450 HAYES RD, Grades: 9-12)TRANSITION PLUS Location: 5840 149TH ST WEST, Grades: 11-12)ABE DIPLOMA PROGRAM Location: 4679 144TH STREET WEST, Grades: 8-12)
SCHOOL OF ENVIRONMENTAL STUDIES Location: 12155 JOHNNY CAKE RIDGE RD, Grades: 11-12)DAKOTA RIDGE SCHOOL Location: 4629 144TH ST W, Grades: KG-12)EASTVIEW SENIOR HIGH Location: 6200 140TH ST W, Grades: 9-12)NEW CONNECTIONS Location: 4629 144TH STREET WEST, Grades: 7-12)
Biggest public elementary/middle schools in Apple Valley: PAIDEIA ACADEMY CHARTER SCHOOL Location: 7200 W 147TH ST, Grades: KG-8, Charter school )CEDAR PARK ELEMENTARY Location: 7500 WHITNEY DR, Grades: KG-5)DIAMOND PATH ELEMENTARY Location: 14455 DIAMOND PATH, Grades: KG-5)GREENLEAF ELEMENTARY Location: 13333 GALAXIE AVE, Grades: KG-5)SOUTHVIEW ELEMENTARY Location: 1025 WHITNEY DR, Grades: KG-5)VALLEY MIDDLE Location: 900 GARDEN VIEW DR, Grades: 6-8)WESTVIEW ELEMENTARY Location: 225 GARDEN VIEW DR, Grades: KG-5)SCOTT HIGHLANDS MIDDLE Location: 14011 PILOT KNOB RD, Grades: 6-8)HIGHLAND ELEMENTARY Location: 14001 PILOT KNOB RD, Grades: KG-5)
FALCON RIDGE MIDDLE Location: 12900 JOHNNY CAKE RIDGE RD, Grades: 6-8)Private elementary/middle school in Apple Valley:
See full list of schools located in Apple Valley User-submitted facts and corrections:
David Fischer (University of Minnesota hockey player/ 20th pick in 2006 NHL draft) added by Dan Bauer
Bob Martin (NBA basketball player)
Notable locations in Apple Valley: (A) , Apple Valley Golf Course (B) , Cedar Camp (C) , Camp Lokinda (D) , Apple Valley Fire Department Station 1 (E) , Apple Valley Fire Department Station 2 (F) , Apple Valley Fire Department Station 3 (G) . Display/hide their locations on the map
Shopping Centers: (1) , East Valley Plaza Shopping Center (2) , Granada Shopping Center (3) , Southport Center Shopping Center (4) , Time Square Center Shopping Center (5) . Display/hide their locations on the map
Churches in Apple Valley include: (A) , South Suburban Evangelical Free Church (B) , Shepherd of the Valley Lutheran Church (C) , Redeemed Gospel Church (D) , Apple Valley Baptist Church (E) , Mount Olivet Church (F) . Display/hide their locations on the map
Cemetery: (1) . Display/hide its location on the map
Lakes: (A) , Lac Lavon Lake (B) , Farquar Lake (C) . Display/hide their locations on the map
Parks in Apple Valley include: (1) , Keller Park (2) , Pennock Park (3) , Scott Highlands Park (4) , Westview Park (5) , Greenleaf Park (6) , Faith Park (7) , Moeller Park (8) , Summerfield Park (9) . Display/hide their locations on the map
Hotel:
Birthplace of: Dan Sexton - Ice hockey player, Derek Rackley - 2005 NFL player (Atlanta Falcons, born : Jul 18, 1977), Karl Goehring - NHL player (Columbus Blue Jackets, born : Aug 23, 1978), Kristina Koznick - Alpine skier, Mike Carman (ice hockey) - Ice hockey player, Darren Kent - College basketball player (Kansas State Wildcats), Mike Lundin - Ice hockey player, Craig Kusick, Jr. - Football player, Rebekah Bradford - Speed skater.
Dakota County has a predicted average indoor radon screening level greater than 4 pCi/L (pico curies per liter) - Highest Potential Drinking water stations with addresses in Apple Valley that have no violations reported:
APPLE VALLEY (Address: 7100 147th Street West Population served: 49,983, Primary Water Source Type: Groundwater)
Average household size: This city:
2.6 peopleMinnesota:
2.5 people
Percentage of family households: This city:
70.9%Whole state:
64.6%
Percentage of households with unmarried partners: This city:
5.4%Whole state:
6.9%
Likely homosexual households (counted as self-reported same-sex unmarried-partner households)
Lesbian couples: 0.3% of all households Gay men: 0.2% of all households
People in group quarters in Apple Valley in 2010:
189 people in nursing facilities/skilled-nursing facilities
109 people in group homes intended for adults
9 people in group homes for juveniles (non-correctional)
5 people in workers' group living quarters and job corps centers
4 people in residential treatment centers for adults
People in group quarters in Apple Valley in 2000:
192 people in nursing homes
43 people in homes for the mentally retarded
2 people in other group homes
Banks with most branches in Apple Valley (2011 data):
Wells Fargo Bank, National Association: Apple Valley Branch at 14325 Cedar Avenue South, branch established on 1992/08/17; Cobblestone Lake Branch at 15574 Pilot Knob Road, branch established on 2008/06/30. Info updated 2011/04/05: Bank assets: $1,161,490.0 mil, Deposits: $905,653.0 mil, headquarters in Sioux Falls, SD, positive income , 6395 total offices , Holding Company: Wells Fargo & Company
TCF National Bank: Apple Valley Cub Branch at 15350 Cedar Avenue, branch established on 1991/10/10; Apple Valley Branch at 7520 West 149th Street, branch established on 1923/01/01. Info updated 2009/11/23: Bank assets: $19,007.0 mil, Deposits: $12,377.0 mil, headquarters in Sioux Falls, SD, positive income , Commercial Lending Specialization, 441 total offices , Holding Company: Tcf Financial Corporation
Sterling State Bank: Apple Valley Branch at 4520 150th Street West, branch established on 2001/05/29; at 15359 Founders Lane, branch established on 2011/10/06. Info updated 2006/11/03: Bank assets: $308.5 mil, Deposits: $267.4 mil, headquarters in Austin, MN, positive income , Commercial Lending Specialization, 12 total offices , Holding Company: Sterling Financial Group, Inc.
Anchor Bank, National Association: Apple Valley Branch at 14665 Galaxie Avenue, branch established on 1997/03/03. Info updated 2009/11/24: Bank assets: $1,290.6 mil, Deposits: $1,116.1 mil, headquarters in Saint Paul, MN, positive income , Commercial Lending Specialization, 16 total offices , Holding Company: Anchor Bancorp, Inc.
Guaranty Bank: Apple Valley Branch at 15125 Cedar Avenue, branch established on 2003/08/26. Info updated 2011/07/21: Bank assets: $1,179.1 mil, Deposits: $1,102.7 mil, headquarters in Milwaukee, WI, negative income in the last year , Mortgage Lending Specialization, 166 total offices
American Bank of St. Paul: Apple Valley Branch at 14295 Cedar Avenue, branch established on 1987/03/04. Info updated 2006/11/03: Bank assets: $413.3 mil, Deposits: $387.8 mil, headquarters in Saint Paul, MN, negative income in the last year , Commercial Lending Specialization, 10 total offices , Holding Company: American Bancorporation
Merchants Bank, National Association: Apple Valley Branch at 7300 147th Street West, Suite 100, branch established on 1995/05/25. Info updated 2012/01/06: Bank assets: $1,241.1 mil, Deposits: $1,007.4 mil, headquarters in Winona, MN, positive income , Commercial Lending Specialization, 19 total offices , Holding Company: Merchants Financial Group, Inc.
Eagle Valley Bank, National Association: Apple Valley Branch at 14800 Galaxie Avenue, Ste 100, branch established on 2002/12/12. Info updated 2006/11/03: Bank assets: $150.4 mil, Deposits: $112.3 mil, headquarters in St. Croix Falls, WI, negative income in the last year , Commercial Lending Specialization, 5 total offices , Holding Company: Financial Services Of Saint Croix Falls, Inc.
U.S. Bank National Association: Apple Valley Branch at 15025 Garrett Avenue, branch established on 1979/05/16. Info updated 2012/01/30: Bank assets: $330,470.8 mil, Deposits: $236,091.5 mil, headquarters in Cincinnati, OH, positive income , 3121 total offices , Holding Company: U.S. Bancorp
3 other banks with 3 local branches
For population 15 years and over in Apple Valley:
Never married: 29.5%Now married: 56.0%Separated: 0.4%Widowed: 4.0%Divorced: 10.0% For population 25 years and over in Apple Valley:
High school or higher: 95.8%Bachelor's degree or higher: 45.8%Graduate or professional degree: 14.7%Unemployed: 3.2%Mean travel time to work (commute): 19.4 minutes
Education Gini index (Inequality in education) Here:
9.8Minnesota average:
10.9
Religion statistics for Apple Valley, MN (based on Dakota County data)
Religion Adherents Congregations Catholic 112,264 18 Evangelical Protestant 57,007 111 Mainline Protestant 55,850 56 Other 6,321 27 Orthodox 1,173 5 Black Protestant 313 2 None 165,624 -
Source: Clifford Grammich, Kirk Hadaway, Richard Houseal, Dale E.Jones, Alexei Krindatch, Richie Stanley and Richard H.Taylor. 2012. 2010 U.S.Religion Census: Religious Congregations & Membership Study. Association of Statisticians of American Religious Bodies. Jones, Dale E., et al. 2002. Congregations and Membership in the United States 2000. Nashville, TN: Glenmary Research Center. Graphs represent county-level data
Food Environment Statistics: Number of grocery stores : 35Dakota County :
0.90 / 10,000 pop.Minnesota :
1.83 / 10,000 pop.
Number of supercenters and club stores : 5This county :
0.13 / 10,000 pop.State :
0.13 / 10,000 pop.
Number of convenience stores (no gas) : 6Dakota County :
0.15 / 10,000 pop.Minnesota :
0.49 / 10,000 pop.
Number of convenience stores (with gas) : 118Dakota County :
3.03 / 10,000 pop.State :
3.90 / 10,000 pop.
Number of full-service restaurants : 196Here :
5.03 / 10,000 pop.State :
6.98 / 10,000 pop.
Adult diabetes rate : This county :
6.1%Minnesota :
6.5%
Adult obesity rate : Dakota County :
25.6%Minnesota :
25.9%
Low-income preschool obesity rate : This county :
12.6%State :
13.0%
Health and Nutrition: Healthy diet rate : Apple Valley:
49.5%Minnesota:
50.6%
Average overall health of teeth and gums : This city:
47.6%Minnesota:
48.4%
Average BMI : This city:
28.7Minnesota:
28.5
People feeling badly about themselves : Here:
22.2%Minnesota:
21.0%
People not drinking alcohol at all : Average hours sleeping at night : Apple Valley:
6.8Minnesota:
6.8
Overweight people : This city:
34.9%Minnesota:
33.5%
General health condition : Apple Valley:
57.6%Minnesota:
57.7%
Average condition of hearing : Apple Valley:
80.4%Minnesota:
79.3%
More about Health and Nutrition of Apple Valley, MN Residents
Local government employment and payroll (March 2022)
Function
Full-time employees
Monthly full-time payroll
Average yearly full-time wage
Part-time employees
Monthly part-time payroll
Police Protection - Officers
54 $478,002 $106,223 0 $0 Other Government Administration
30 $244,183 $97,673 11 $13,618 Parks and Recreation
30 $204,102 $81,641 47 $48,318 Streets and Highways
17 $100,845 $71,185 0 $0 Other and Unallocable
16 $107,557 $80,668 32 $18,151 Water Supply
14 $92,818 $79,558 0 $0 Financial Administration
11 $91,656 $99,988 0 $0 Police - Other
7 $44,011 $75,447 6 $12,608 Firefighters
4 $37,960 $113,880 63 $52,368 Natural Resources
3 $21,490 $85,960 0 $0 Fire - Other
1 $5,788 $69,456 0 $0
Totals for Government
187 $1,428,411 $91,663 159 $145,063
Apple Valley government finances - Expenditure in 2021 (per resident):
Construction - Regular Highways: $9,067,000 ($163.62)
Water Utilities: $2,920,000 ($52.69)Sewerage: $2,704,000 ($48.79)General Public Buildings: $814,000 ($14.69)Miscellaneous Commercial Activities - Other: $565,000 ($10.20)Parks and Recreation: $220,000 ($3.97)Protective Inspection and Regulation - Other: $16,000 ($0.29)General - Other: $5,000 ($0.09)Current Operations - Police Protection: $10,318,000 ($186.19)
Liquor Stores: $9,783,000 ($176.54)Regular Highways: $7,003,000 ($126.37)Parks and Recreation: $6,017,000 ($108.58)Water Utilities: $5,521,000 ($99.63)Sewerage: $5,390,000 ($97.26)Central Staff Services: $2,899,000 ($52.31)Local Fire Protection: $2,599,000 ($46.90)General - Other: $1,268,000 ($22.88)Protective Inspection and Regulation - Other: $1,175,000 ($21.20)Housing and Community Development: $1,171,000 ($21.13)Financial Administration: $1,043,000 ($18.82)Judicial and Legal Services: $548,000 ($9.89)General Public Buildings: $117,000 ($2.11)Parking Facilities: $5,000 ($0.09)General - Interest on Debt: $966,000 ($17.43)
Intergovernmental to Local - Other - Sewerage: $3,363,000 ($60.69)
Other Capital Outlay - Parks and Recreation: $588,000 ($10.61)
Regular Highways: $547,000 ($9.87)Police Protection: $415,000 ($7.49)Sewerage: $410,000 ($7.40)General - Other: $298,000 ($5.38)Water Utilities: $261,000 ($4.71)General Public Building: $213,000 ($3.84)Miscellaneous Commercial Activities - Other: $171,000 ($3.09)Local Fire Protection: $77,000 ($1.39)Protective Inspection and Regulation - Other: $33,000 ($0.60)Total Salaries and Wages: $19,176,000 ($346.04)
Water Utilities - Interest on Debt: $283,000 ($5.11)
Apple Valley government finances - Revenue in 2021 (per resident):
Charges - Sewerage: $8,330,000 ($150.32)
Other: $1,802,000 ($32.52)Parks and Recreation: $1,795,000 ($32.39)Federal Intergovernmental - Highways: $4,128,000 ($74.49)
Local Intergovernmental - Highways: $376,000 ($6.79)
Miscellaneous - Special Assessments: $6,114,000 ($110.33)
Interest Earnings: $2,842,000 ($51.28)Rents: $790,000 ($14.26)General Revenue - Other: $774,000 ($13.97)Fines and Forfeits: $169,000 ($3.05)Sale of Property: $119,000 ($2.15)Donations From Private Sources: $4,000 ($0.07)Revenue - Liquor Stores: $10,879,000 ($196.32)
Water Utilities: $5,418,000 ($97.77)State Intergovernmental - Highways: $4,680,000 ($84.45)
Tax - Property: $28,503,000 ($514.35)
Public Utilities Sales: $1,313,000 ($23.69)Other License: $1,093,000 ($19.72)Other: $143,000 ($2.58)
Apple Valley government finances - Debt in 2021 (per resident):
Long Term Debt - Beginning Outstanding - Unspecified Public Purpose: $24,055,000 ($434.08)
Outstanding Unspecified Public Purpose: $21,808,000 ($393.53)Retired Unspecified Public Purpose: $2,247,000 ($40.55)
Apple Valley government finances - Cash and Securities in 2021 (per resident):
Other Funds - Cash and Securities: $76,351,000 ($1377.78)
8.01% of this county's 2020 resident taxpayers moved to other counties in 2021 ($77,850 average adjusted gross income )
Here:
8.01%Minnesota average:
7.79%
0.01% of residents moved to foreign countries ($89 average AGI )Dakota County:
0.01%Minnesota average:
0.00%
Top counties to which taxpayers relocated from this county between 2020 and 2021:
Businesses in Apple Valley, MN
Name Count Name Count
AT&T 1 Kohl's 1 Ace Hardware 1 LA Fitness 1 AmericInn 1 MasterBrand Cabinets 1 Arby's 1 McDonald's 1 Bakers Square 1 Menards 1 Barnes & Noble 1 Nike 1 Bed Bath & Beyond 1 OfficeMax 1 Blockbuster 1 Panda Express 1 Buffalo Wild Wings 1 Panera Bread 1 Burlington Coat Factory 1 Papa John's Pizza 1 CVS 2 Payless 1 Caribou Coffee 1 Penske 1 Chipotle 1 Pizza Hut 1 Cold Stone Creamery 1 RadioShack 1 Curves 1 Red Robin 1 Dairy Queen 1 Ruby Tuesday 1 Dennys 1 Sam's Club 1 Discount Tire 1 Sprint Nextel 1 Domino's Pizza 1 Staples 1 Famous Footwear 1 Starbucks 2 Fashion Bug 1 T-Mobile 4 FedEx 6 Taco Bell 1 Firestone Complete Auto Care 1 Target 2 Ford 1 U-Haul 1 GNC 1 UPS 3 GameStop 1 Verizon Wireless 2 H&R Block 1 Walgreens 2 Home Depot 1 Walmart 1 IHOP 1 Wendy's 1 Jimmy John's 1 White Castle 1 KFC 1
Strongest AM radio stations in Apple Valley:
KKMS (980 AM; 5 kW; RICHFIELD, MN)
KFAN (1130 AM; 50 kW; MINNEAPOLIS, MN; Owner: AMFM RADIO LICENSES, L.L.C.)
WCTS (1030 AM; 50 kW; MAPLEWOOD, MN; Owner: CNTL. BAPT. THEO/AL SEMI MINNEAPOLIS)
WMNN (1330 AM; 10 kW; MINNEAPOLIS, MN; Owner: MINNESOTA PUBLIC RADIO.)
KSTP (1500 AM; 50 kW; ST. PAUL, MN; Owner: KSTP-AM, LLC (DELAWARE))
KTIS (900 AM; 25 kW; MINNEAPOLIS, MN; Owner: NORTHWESTERN COLLEGE)
WCCO (830 AM; 50 kW; MINNEAPOLIS, MN; Owner: INFINITY MEDIA CORPORATION)
KUOM (770 AM; daytime; 5 kW; MINNEAPOLIS, MN)
KSMM (1530 AM; 9 kW; SHAKOPEE, MN; Owner: STARBOARD BROADCASTING, INC.)
WWTC (1280 AM; 5 kW; MINNEAPOLIS, MN; Owner: SCA LICENSE CORPORATION)
WDGY (630 AM; 8 kW; HUDSON, WI; Owner: 630 RADIO, INCORPORATED)
KDIZ (1440 AM; 5 kW; GOLDEN VALLEY, MN; Owner: KQRS, INC.)
KYCR (1570 AM; 4 kW; GOLDEN VALLEY, MN; Owner: COMMON GROUND BROADCASTING COMPANY,)
Strongest FM radio stations in Apple Valley:
WGVX (105.1 FM; LAKEVILLE, MN; Owner: KQRS, INC.)
WCAL (89.3 FM; NORTHFIELD, MN; Owner: ST. OLAF COLLEGE)
KNOW-FM (91.1 FM; MINNEAPOLIS-ST. PAUL, MN; Owner: MINNESOTA PUBLIC RADIO)
WLTE (102.9 FM; MINNEAPOLIS, MN; Owner: INFINITY MEDIA CORPORATION)
KSTP-FM (94.5 FM; ST. PAUL, MN; Owner: KSTP-FM, LLC, A DELAWARE LLC)
KTCZ-FM (97.1 FM; MINNEAPOLIS, MN; Owner: AMFM RADIO LICENSES, L.L.C.)
KEEY-FM (102.1 FM; ST. PAUL, MN; Owner: AMFM RADIO LICENSES, L.L.C.)
KTIS-FM (98.5 FM; MINNEAPOLIS, MN; Owner: NORTHWESTERN COLLEGE)
KDWB-FM (101.3 FM; RICHFIELD, MN; Owner: AMFM RADIO LICENSES, L.L.C.)
KQRS-FM (92.5 FM; GOLDEN VALLEY, MN; Owner: KQRS, Inc.)
KSJN (99.5 FM; MINNEAPOLIS, MN; Owner: MINNESOTA PUBLIC RADIO)
KXXR (93.7 FM; MINNEAPOLIS, MN; Owner: KQRS, INC.)
K214DF (90.7 FM; GOLDEN VALLEY, MN; Owner: EDUCATIONAL MEDIA FOUNDATION)
K294AM (106.7 FM; WEST ST. PAUL, MN; Owner: FRESH AIR, INCORPORATED)
KFAI (90.3 FM; MINNEAPOLIS, MN; Owner: FRESH AIR, INC.)
KBEM-FM (88.5 FM; MINNEAPOLIS, MN; Owner: BD. OF EDUCATION, S.S.D. NO. 1)
KQQL (107.9 FM; ANOKA, MN; Owner: AMFM RADIO LICENSES, L.L.C.)
WGVZ (105.7 FM; EDEN PRAIRIE, MN; Owner: KQRS, INC.)
WXPT (104.1 FM; ST. LOUIS PARK, MN; Owner: THE AUDIO HOUSE, INC.)
KNOF (95.3 FM; ST. PAUL, MN; Owner: SELBY GOSPEL BROADCASTING CORPORATION)
TV broadcast stations around Apple Valley:
KMSP-TV (Channel 9; MINNEAPOLIS, MN; Owner: FOX TELEVISION STATIONS, INC.)
KARE (Channel 11; MINNEAPOLIS, MN; Owner: MULTIMEDIA HOLDINGS CORPORATION)
KSTP-TV (Channel 5; ST. PAUL, MN; Owner: HUBBARD BROADCASTING, INC.)
KTCA-TV (Channel 2; ST. PAUL, MN; Owner: TWIN CITIES PUBLIC TELEVISION, INC.)
K07UI (Channel 7; MINNEAPOLIS, ETC., MN; Owner: WORD OF GOD FELLOWSHIP, INC.)
WCCO-TV (Channel 4; MINNEAPOLIS, MN; Owner: CBS BROADCASTING INC.)
KTCI-TV (Channel 17; ST. PAUL, MN; Owner: TWIN CITIES PUBLIC TELEVISION, INC.)
KSTC-TV (Channel 45; MINNEAPOLIS, MN; Owner: HUBBARD BROADCASTING, INC.)
K58BS (Channel 58; MINNEAPOLIS, MN; Owner: TRINITY BROADCASTING NETWORK)
KMWB (Channel 23; MINNEAPOLIS, MN; Owner: KLGT LICENSEE, LLC)
K67HG (Channel 67; MINNEAPOLIS, MN; Owner: VENTANA TELEVISION, INC.)
WFTC (Channel 29; MINNEAPOLIS, MN; Owner: FOX TELEVISION STATIONS, INC.)
K14KH (Channel 14; MINNEAPOLIS, MN; Owner: THREE ANGELS BROADCASTING NETWORK)
K19ER (Channel 19; ST. PAUL, MN; Owner: CATHOLIC VIEWS BROADCASTS, INC.)
W62BD (Channel 62; MINNEAPOLIS, MN; Owner: WORD OF GOD FELLOWSHIP, INC.)
WBWX-CA (Channel 13; MINNEAPOLIS, MN; Owner: THE BOX WORLDWIDE LLC)
KPXM (Channel 41; ST. CLOUD, MN; Owner: PAXSON MINNEAPOLIS LICENSE, INC.)
National Bridge Inventory (NBI) Statistics 8 Number of bridges92ft / 27.5m Total length169,829 Total average daily traffic2,258 Total average daily truck traffic
Home Mortgage Disclosure Act Aggregated Statistics For Year 2009(Based on 10 full tracts) A) FHA, FSA/RHS & VA B) Conventional C) Refinancings D) Home Improvement Loans F) Non-occupant Loans on G) Loans On Manufactured Number Average Value Number Average Value Number Average Value Number Average Value Number Average Value Number Average Value
LOANS ORIGINATED 422 $172,720 279 $170,789 1,522 $196,344 66 $100,000 67 $142,299 11 $40,727 APPLICATIONS APPROVED, NOT ACCEPTED 26 $168,231 20 $151,450 138 $196,268 7 $28,571 4 $136,250 6 $68,833 APPLICATIONS DENIED 36 $183,222 37 $151,757 342 $212,082 22 $58,455 22 $132,864 7 $49,429 APPLICATIONS WITHDRAWN 34 $197,147 31 $210,290 286 $210,878 9 $67,000 11 $201,364 3 $39,667 FILES CLOSED FOR INCOMPLETENESS 3 $149,667 5 $224,800 119 $196,521 11 $100,091 3 $101,667 1 $11,000
Aggregated Statistics For Year 2008(Based on 10 full tracts) A) FHA, FSA/RHS & VA B) Conventional C) Refinancings D) Home Improvement Loans F) Non-occupant Loans on G) Loans On Manufactured Number Average Value Number Average Value Number Average Value Number Average Value Number Average Value Number Average Value
LOANS ORIGINATED 261 $191,552 419 $193,905 682 $187,444 83 $55,916 79 $161,456 28 $61,643 APPLICATIONS APPROVED, NOT ACCEPTED 13 $200,538 52 $140,038 120 $197,008 15 $64,067 13 $135,615 19 $49,053 APPLICATIONS DENIED 13 $235,231 78 $163,590 378 $197,225 64 $59,172 15 $214,000 25 $39,600 APPLICATIONS WITHDRAWN 18 $162,833 50 $204,540 154 $181,753 12 $76,750 12 $150,750 7 $64,286 FILES CLOSED FOR INCOMPLETENESS 4 $174,500 10 $239,800 57 $195,088 4 $71,250 2 $182,500 0 $0
Aggregated Statistics For Year 2007(Based on 10 full tracts) A) FHA, FSA/RHS & VA B) Conventional C) Refinancings D) Home Improvement Loans F) Non-occupant Loans on G) Loans On Manufactured Number Average Value Number Average Value Number Average Value Number Average Value Number Average Value Number Average Value
LOANS ORIGINATED 65 $201,923 800 $175,492 909 $168,961 152 $67,178 95 $170,716 38 $57,316 APPLICATIONS APPROVED, NOT ACCEPTED 2 $136,500 89 $161,663 194 $159,742 35 $76,286 8 $129,125 20 $62,550 APPLICATIONS DENIED 8 $216,875 108 $201,167 623 $185,698 70 $70,657 26 $159,731 19 $52,368 APPLICATIONS WITHDRAWN 6 $208,167 66 $220,227 234 $192,491 14 $126,286 11 $216,727 2 $59,000 FILES CLOSED FOR INCOMPLETENESS 0 $0 16 $257,312 57 $211,228 10 $97,700 6 $249,333 0 $0
Aggregated Statistics For Year 2006(Based on 10 full tracts) A) FHA, FSA/RHS & VA B) Conventional C) Refinancings D) Home Improvement Loans E) Loans on Dwellings For 5+ Families F) Non-occupant Loans on G) Loans On Manufactured Number Average Value Number Average Value Number Average Value Number Average Value Number Average Value Number Average Value Number Average Value
LOANS ORIGINATED 88 $189,330 1,254 $166,147 1,222 $160,723 175 $60,486 1 $23,000 140 $157,857 10 $28,500 APPLICATIONS APPROVED, NOT ACCEPTED 3 $248,667 135 $168,133 281 $165,940 30 $61,200 0 $0 24 $199,375 3 $25,333 APPLICATIONS DENIED 5 $181,000 221 $165,724 665 $175,328 92 $75,533 0 $0 47 $183,064 15 $35,267 APPLICATIONS WITHDRAWN 7 $207,143 137 $177,248 398 $196,327 36 $121,056 0 $0 28 $160,357 0 $0 FILES CLOSED FOR INCOMPLETENESS 0 $0 46 $172,413 141 $231,929 5 $133,400 0 $0 7 $187,286 0 $0
Aggregated Statistics For Year 2005(Based on 10 full tracts) A) FHA, FSA/RHS & VA B) Conventional C) Refinancings D) Home Improvement Loans E) Loans on Dwellings For 5+ Families F) Non-occupant Loans on G) Loans On Manufactured Number Average Value Number Average Value Number Average Value Number Average Value Number Average Value Number Average Value Number Average Value
LOANS ORIGINATED 93 $188,452 1,476 $165,908 1,572 $170,908 171 $68,895 6 $232,167 168 $151,839 11 $26,182 APPLICATIONS APPROVED, NOT ACCEPTED 2 $124,500 164 $157,079 198 $150,141 27 $88,556 0 $0 20 $162,300 4 $38,750 APPLICATIONS DENIED 6 $200,833 266 $147,117 654 $184,627 73 $57,137 1 $1,800,000 36 $174,167 31 $35,226 APPLICATIONS WITHDRAWN 4 $192,000 170 $173,788 530 $196,294 52 $171,558 0 $0 40 $162,275 2 $162,500 FILES CLOSED FOR INCOMPLETENESS 1 $294,000 44 $140,341 192 $221,833 10 $41,500 0 $0 4 $159,000 2 $41,500
Aggregated Statistics For Year 2004(Based on 10 full tracts) A) FHA, FSA/RHS & VA B) Conventional C) Refinancings D) Home Improvement Loans E) Loans on Dwellings For 5+ Families F) Non-occupant Loans on G) Loans On Manufactured Number Average Value Number Average Value Number Average Value Number Average Value Number Average Value Number Average Value Number Average Value
LOANS ORIGINATED 151 $178,801 1,493 $170,124 1,764 $167,911 172 $58,029 2 $2,967,500 107 $181,682 11 $34,364 APPLICATIONS APPROVED, NOT ACCEPTED 4 $183,000 99 $180,414 229 $171,930 28 $45,286 1 $5,120,000 11 $155,818 4 $49,750 APPLICATIONS DENIED 15 $189,067 193 $152,679 567 $182,309 92 $42,283 1 $123,000 38 $168,605 25 $40,720 APPLICATIONS WITHDRAWN 11 $170,364 120 $175,975 457 $182,595 37 $62,892 0 $0 22 $186,091 3 $36,667 FILES CLOSED FOR INCOMPLETENESS 0 $0 30 $163,167 189 $187,270 19 $78,684 0 $0 6 $165,333 3 $58,333
Aggregated Statistics For Year 2003(Based on 10 full tracts) A) FHA, FSA/RHS & VA B) Conventional C) Refinancings D) Home Improvement Loans E) Loans on Dwellings For 5+ Families F) Non-occupant Loans on Number Average Value Number Average Value Number Average Value Number Average Value Number Average Value Number Average Value
LOANS ORIGINATED 211 $171,739 1,386 $166,786 5,043 $158,158 183 $34,060 5 $2,564,600 188 $141,388 APPLICATIONS APPROVED, NOT ACCEPTED 9 $171,444 92 $145,098 408 $152,446 22 $31,182 0 $0 15 $137,200 APPLICATIONS DENIED 8 $174,625 133 $129,383 747 $166,212 77 $27,481 0 $0 21 $138,905 APPLICATIONS WITHDRAWN 19 $186,579 145 $170,214 619 $162,730 14 $54,786 0 $0 25 $139,480 FILES CLOSED FOR INCOMPLETENESS 2 $169,500 28 $166,107 138 $164,638 6 $27,667 0 $0 2 $99,500
Aggregated Statistics For Year 2002(Based on 4 full tracts) A) FHA, FSA/RHS & VA B) Conventional C) Refinancings D) Home Improvement Loans E) Loans on Dwellings For 5+ Families F) Non-occupant Loans on Number Average Value Number Average Value Number Average Value Number Average Value Number Average Value Number Average Value
LOANS ORIGINATED 95 $155,032 435 $163,791 1,277 $153,725 54 $36,333 2 $3,887,500 67 $152,791 APPLICATIONS APPROVED, NOT ACCEPTED 3 $162,667 45 $118,689 120 $147,183 13 $34,077 0 $0 4 $112,500 APPLICATIONS DENIED 4 $175,750 53 $84,170 226 $116,035 27 $40,556 0 $0 5 $196,800 APPLICATIONS WITHDRAWN 2 $203,500 31 $184,258 216 $143,769 7 $34,714 0 $0 5 $149,200 FILES CLOSED FOR INCOMPLETENESS 0 $0 10 $170,800 62 $164,452 2 $43,000 0 $0 2 $210,500
Aggregated Statistics For Year 2001(Based on 4 full tracts) A) FHA, FSA/RHS & VA B) Conventional C) Refinancings D) Home Improvement Loans E) Loans on Dwellings For 5+ Families F) Non-occupant Loans on Number Average Value Number Average Value Number Average Value Number Average Value Number Average Value Number Average Value
LOANS ORIGINATED 133 $145,977 381 $147,619 1,104 $132,619 76 $27,961 1 $200,000 33 $120,273 APPLICATIONS APPROVED, NOT ACCEPTED 3 $134,667 33 $131,121 85 $114,965 18 $26,833 0 $0 1 $130,000 APPLICATIONS DENIED 5 $133,400 75 $73,480 244 $104,385 36 $17,583 0 $0 2 $356,000 APPLICATIONS WITHDRAWN 4 $120,500 28 $175,143 217 $130,668 17 $40,412 0 $0 0 $0 FILES CLOSED FOR INCOMPLETENESS 1 $104,000 7 $163,857 51 $119,196 1 $8,000 0 $0 0 $0
Aggregated Statistics For Year 2000(Based on 4 full tracts) A) FHA, FSA/RHS & VA B) Conventional C) Refinancings D) Home Improvement Loans E) Loans on Dwellings For 5+ Families F) Non-occupant Loans on Number Average Value Number Average Value Number Average Value Number Average Value Number Average Value Number Average Value
LOANS ORIGINATED 89 $125,315 328 $133,662 254 $97,827 99 $21,909 1 $1,380,000 17 $94,824 APPLICATIONS APPROVED, NOT ACCEPTED 2 $136,500 27 $108,667 52 $74,250 18 $24,444 0 $0 0 $0 APPLICATIONS DENIED 3 $81,000 76 $42,487 103 $75,194 48 $24,062 0 $0 6 $57,333 APPLICATIONS WITHDRAWN 3 $137,333 20 $137,800 100 $105,550 15 $45,067 0 $0 2 $88,000 FILES CLOSED FOR INCOMPLETENESS 0 $0 2 $318,000 30 $126,867 0 $0 0 $0 0 $0
Aggregated Statistics For Year 1999(Based on 6 full tracts) A) FHA, FSA/RHS & VA B) Conventional C) Refinancings D) Home Improvement Loans E) Loans on Dwellings For 5+ Families F) Non-occupant Loans on Number Average Value Number Average Value Number Average Value Number Average Value Number Average Value Number Average Value
LOANS ORIGINATED 396 $117,860 1,136 $130,028 1,051 $105,522 212 $22,125 3 $113,303 39 $94,291 APPLICATIONS APPROVED, NOT ACCEPTED 9 $117,027 79 $116,848 179 $91,603 26 $32,466 0 $0 4 $158,892 APPLICATIONS DENIED 19 $110,198 180 $79,822 326 $75,958 85 $21,649 0 $0 12 $106,855 APPLICATIONS WITHDRAWN 15 $122,475 75 $137,185 250 $101,135 52 $64,030 0 $0 2 $186,500 FILES CLOSED FOR INCOMPLETENESS 1 $119,780 24 $121,864 66 $113,678 0 $0 0 $0 1 $235,580
Detailed mortgage data for all 10 tracts in Apple Valley, MN
Private Mortgage Insurance Companies Aggregated Statistics For Year 2009(Based on 10 full tracts) A) Conventional B) Refinancings C) Non-occupant Loans on D) Loans On Manufactured Number Average Value Number Average Value Number Average Value Number Average Value
LOANS ORIGINATED 58 $215,897 43 $236,279 0 $0 0 $0 APPLICATIONS APPROVED, NOT ACCEPTED 13 $176,154 9 $225,111 0 $0 1 $155,000 APPLICATIONS DENIED 11 $181,091 3 $224,333 1 $98,000 0 $0 APPLICATIONS WITHDRAWN 3 $228,000 4 $244,000 0 $0 0 $0 FILES CLOSED FOR INCOMPLETENESS 3 $131,667 1 $259,000 0 $0 0 $0
Aggregated Statistics For Year 2008(Based on 10 full tracts) A) Conventional B) Refinancings C) Non-occupant Loans on Number Average Value Number Average Value Number Average Value
LOANS ORIGINATED 134 $218,336 63 $219,540 6 $191,333 APPLICATIONS APPROVED, NOT ACCEPTED 33 $252,485 21 $243,524 1 $170,000 APPLICATIONS DENIED 8 $234,750 9 $241,444 3 $206,667 APPLICATIONS WITHDRAWN 3 $243,000 7 $229,143 1 $256,000 FILES CLOSED FOR INCOMPLETENESS 2 $218,000 1 $229,000 0 $0
Aggregated Statistics For Year 2007(Based on 10 full tracts) A) Conventional B) Refinancings C) Non-occupant Loans on Number Average Value Number Average Value Number Average Value
LOANS ORIGINATED 285 $207,067 92 $219,196 13 $190,538 APPLICATIONS APPROVED, NOT ACCEPTED 24 $234,667 15 $213,467 3 $210,667 APPLICATIONS DENIED 4 $259,000 0 $0 0 $0 APPLICATIONS WITHDRAWN 9 $221,111 8 $199,875 0 $0 FILES CLOSED FOR INCOMPLETENESS 1 $330,000 0 $0 0 $0
Aggregated Statistics For Year 2006(Based on 10 full tracts) A) Conventional B) Refinancings C) Non-occupant Loans on Number Average Value Number Average Value Number Average Value
LOANS ORIGINATED 153 $201,176 51 $219,667 5 $206,000 APPLICATIONS APPROVED, NOT ACCEPTED 12 $207,833 15 $251,267 2 $143,500 APPLICATIONS DENIED 1 $229,000 0 $0 0 $0 APPLICATIONS WITHDRAWN 8 $218,750 5 $223,000 3 $223,667 FILES CLOSED FOR INCOMPLETENESS 0 $0 0 $0 0 $0
Aggregated Statistics For Year 2005(Based on 10 full tracts) A) Conventional B) Refinancings C) Non-occupant Loans on Number Average Value Number Average Value Number Average Value
LOANS ORIGINATED 139 $202,971 68 $214,529 7 $195,714 APPLICATIONS APPROVED, NOT ACCEPTED 22 $198,909 20 $207,400 0 $0 APPLICATIONS DENIED 2 $227,000 2 $332,500 0 $0 APPLICATIONS WITHDRAWN 9 $197,333 6 $177,000 1 $99,000 FILES CLOSED FOR INCOMPLETENESS 0 $0 4 $202,500 0 $0
Aggregated Statistics For Year 2004(Based on 10 full tracts) A) Conventional B) Refinancings C) Non-occupant Loans on Number Average Value Number Average Value Number Average Value
LOANS ORIGINATED 248 $191,903 112 $188,848 16 $167,562 APPLICATIONS APPROVED, NOT ACCEPTED 33 $192,182 40 $188,650 4 $145,500 APPLICATIONS DENIED 4 $226,250 3 $205,667 1 $208,000 APPLICATIONS WITHDRAWN 12 $196,333 17 $180,941 3 $155,333 FILES CLOSED FOR INCOMPLETENESS 2 $266,000 6 $184,167 1 $225,000
Aggregated Statistics For Year 2003(Based on 10 full tracts) A) Conventional B) Refinancings C) Non-occupant Loans on Number Average Value Number Average Value Number Average Value
LOANS ORIGINATED 410 $191,471 434 $174,991 18 $167,444 APPLICATIONS APPROVED, NOT ACCEPTED 44 $194,182 62 $186,532 12 $187,000 APPLICATIONS DENIED 7 $176,429 6 $183,500 3 $192,000 APPLICATIONS WITHDRAWN 12 $187,833 22 $184,000 4 $223,000 FILES CLOSED FOR INCOMPLETENESS 5 $332,000 1 $255,000 1 $166,000
Aggregated Statistics For Year 2002(Based on 4 full tracts) A) Conventional B) Refinancings C) Non-occupant Loans on Number Average Value Number Average Value Number Average Value
LOANS ORIGINATED 119 $177,605 78 $165,269 12 $179,083 APPLICATIONS APPROVED, NOT ACCEPTED 16 $193,188 9 $153,444 3 $135,000 APPLICATIONS DENIED 2 $182,500 1 $126,000 0 $0 APPLICATIONS WITHDRAWN 2 $200,000 6 $162,333 1 $171,000 FILES CLOSED FOR INCOMPLETENESS 0 $0 0 $0 0 $0
Aggregated Statistics For Year 2001(Based on 4 full tracts) A) Conventional B) Refinancings C) Non-occupant Loans on Number Average Value Number Average Value Number Average Value
LOANS ORIGINATED 126 $158,063 93 $154,602 15 $138,867 APPLICATIONS APPROVED, NOT ACCEPTED 31 $193,387 12 $139,917 1 $159,000 APPLICATIONS DENIED 1 $213,000 1 $179,000 1 $213,000 APPLICATIONS WITHDRAWN 8 $332,500 3 $172,333 1 $160,000 FILES CLOSED FOR INCOMPLETENESS 0 $0 1 $117,000 0 $0
Aggregated Statistics For Year 2000(Based on 4 full tracts) A) Conventional B) Refinancings C) Non-occupant Loans on Number Average Value Number Average Value Number Average Value
LOANS ORIGINATED 118 $140,458 18 $129,056 6 $121,833 APPLICATIONS APPROVED, NOT ACCEPTED 9 $141,333 3 $146,667 0 $0 APPLICATIONS DENIED 4 $108,250 1 $117,000 2 $103,500 APPLICATIONS WITHDRAWN 2 $122,000 0 $0 1 $107,000 FILES CLOSED FOR INCOMPLETENESS 0 $0 1 $124,000 0 $0
Aggregated Statistics For Year 1999(Based on 6 full tracts) A) Conventional B) Refinancings C) Non-occupant Loans on Number Average Value Number Average Value Number Average Value
LOANS ORIGINATED 452 $141,742 159 $128,396 4 $76,645 APPLICATIONS APPROVED, NOT ACCEPTED 34 $151,510 11 $120,160 1 $183,000 APPLICATIONS DENIED 5 $194,214 3 $128,257 0 $0 APPLICATIONS WITHDRAWN 5 $188,718 5 $130,210 0 $0 FILES CLOSED FOR INCOMPLETENESS 2 $134,500 2 $106,470 0 $0
Apple Valley compared to Minnesota state average:
Unemployed percentage significantly below state average. Black race population percentage above state average. Median age below state average. Foreign-born population percentage above state average. Length of stay since moving in above state average. House age below state average. Percentage of population with a bachelor's degree or higher above state average. Apple Valley on our top lists :
#7 on the list of "Top 101 cities with the least people below 50% of the poverty level (population 50,000+)"
#12 on the list of "Top 101 cities with the coldest winters (population 50,000+)"
#13 on the list of "Top 101 cities with the largest temperature differences during a year (population 50,000+)"
#13 on the list of "Top 101 cities with the lowest daily low temperatures (population 50,000+)"
#23 on the list of "Top 101 cities with the lowest average temperatures (population 50,000+)"
#26 on the list of "Top 101 cities that people commute from (largest negative percentage daily daytime population change due to commuting) (population 50,000+)"
#29 on the list of "Top 101 cities with the lowest number of burglaries per 100,000 residents (population 50,000+)"
#30 on the list of "Top 101 cities with largest percentage of males in occupations: healthcare support occupations (population 50,000+)"
#32 on the list of "Top 101 cities with the lowest number of assaults per 100,000 residents (population 50,000+)"
#33 on the list of "Top 101 cities with the lowest number of police officers per 1000 residents (population 50,000+)"
#35 on the list of "Top 101 cities with the lowest number of auto thefts per 100,000 residents (population 50,000+)"
#40 on the list of "Top 101 cities with the largest city-data.com crime index increase from 2002 to 2012 (population 50,000+)"
#50 on the list of "Top 100 cities with biggest houses (pop. 50,000+)"
#51 on the list of "Top 101 cities with the smallest percentage of elementary and middle school students in private schools (5,000+ students)"
#57 on the list of "Top 101 cities with the smallest household incomes disparities (population 50,000+)"
#58 on the list of "Top 101 cities with the smallest percentage of likely homosexual households (counted as self-reported same-sex unmarried-partner households) (population 50,000+)"
#77 on the list of "Top 101 cities with largest percentage of males in industries: management of companies and enterprises (population 50,000+)"
#81 on the list of "Top 101 cities with the least people below the poverty level (population 50,000+)"
#85 on the list of "Top 101 cities with largest percentage of females in occupations: farming, fishing, and forestry occupations (population 50,000+)"
#88 on the list of "Top 101 cities with largest percentage of females in industries: transportation and warehousing (population 50,000+)"
#1 on the list of "Top 101 counties with the highest percentage of residents that visited a dentist within the past year"
#8 on the list of "Top 101 counties with the highest percentage of residents that exercised in the past month"
#9 on the list of "Top 101 counties with the lowest number of infant deaths per 1000 residents 2007-2013 (pop. 50,000+)"
#9 on the list of "Top 101 counties with the largest decrease in the number of infant deaths per 1000 residents 2000-2006 to 2007-2013 (pop. 50,000+)"
#15 on the list of "Top 101 counties with the best general health status score of residents (1-5), 3 years of data"
Top Patent Applicants
Wenzhong Zhu (58)
Junzhong Li (41)
Antoine Khoueir (40)
Charles A. Lemaire (37)
Keith E. Olson (35)
Paul R. Kraus (32)
Vincent E. Splett (19)
Shuiyuan Huang (16)
Bryan J. Root (16)
Robert J. Crawford (14)
Total of 1018 patent applications in 2008-2024.
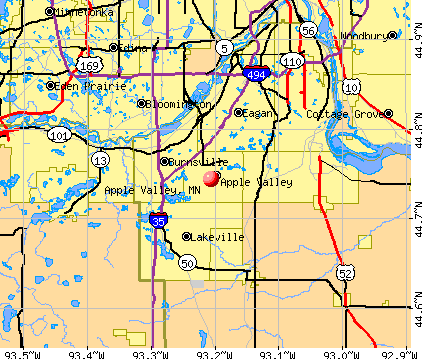


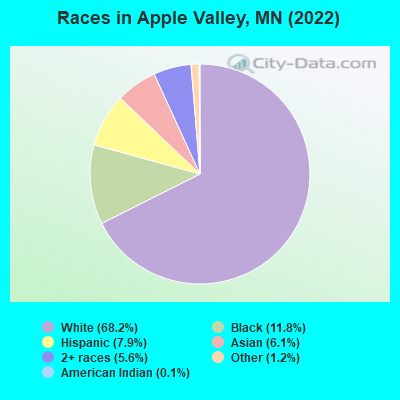
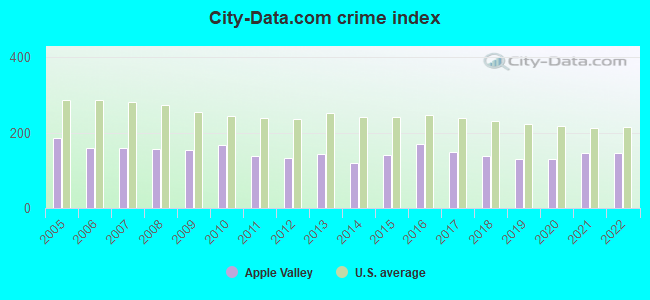
 Recent articles from our blog. Our writers, many of them Ph.D. graduates or candidates, create easy-to-read articles on a wide variety of topics.

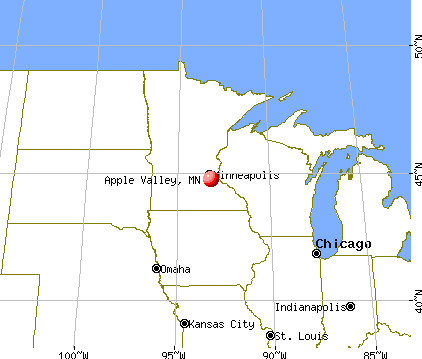
 (3.8 miles
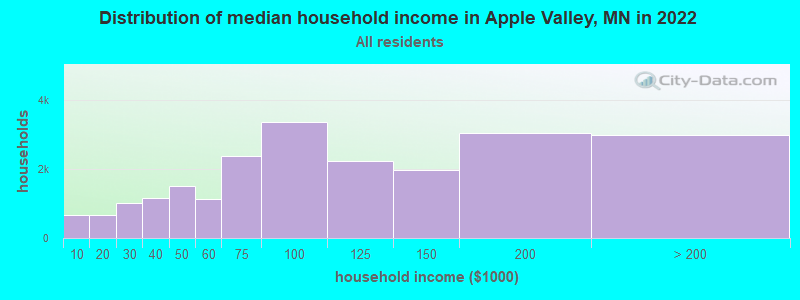
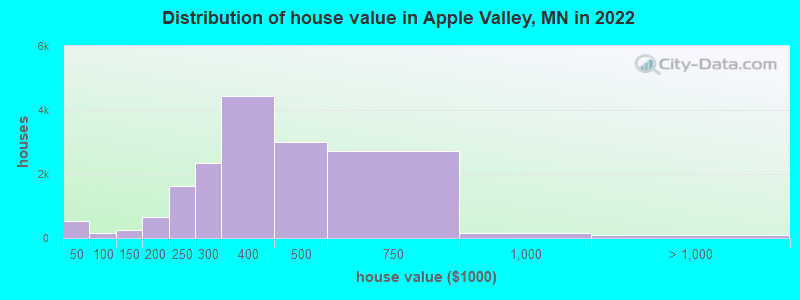
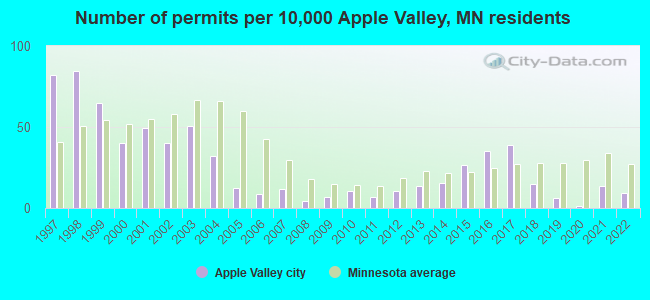
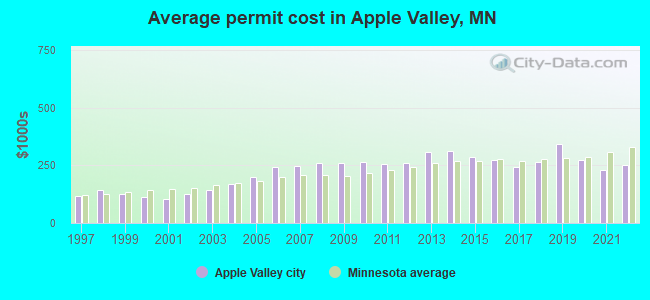
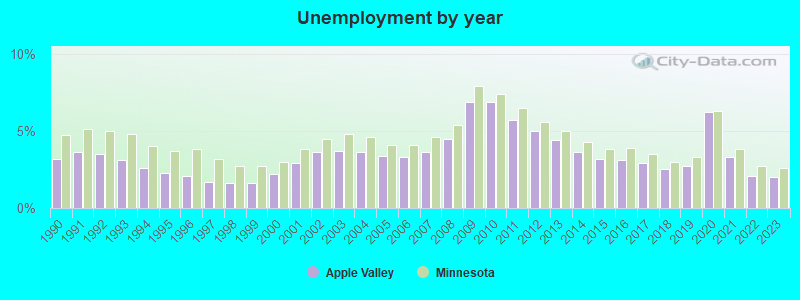
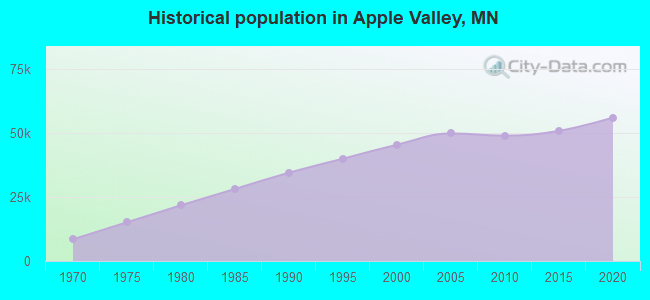
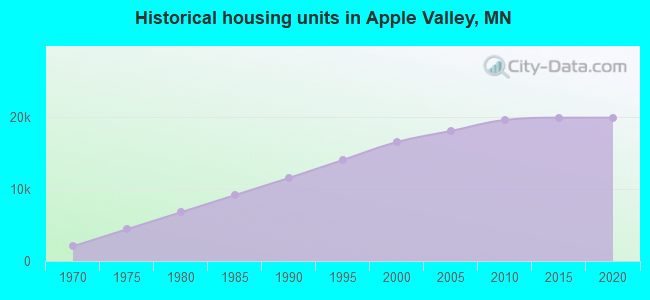
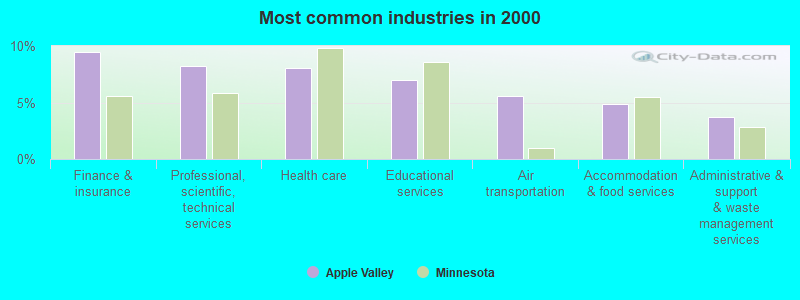
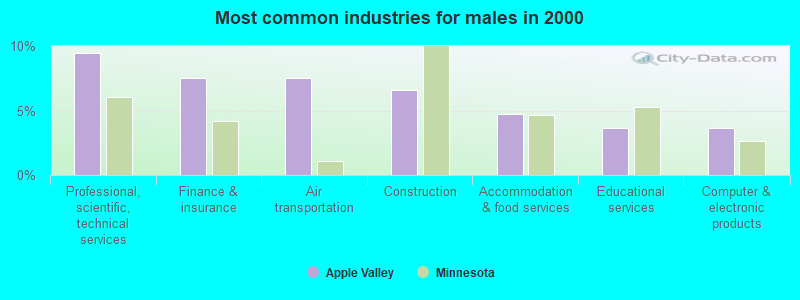
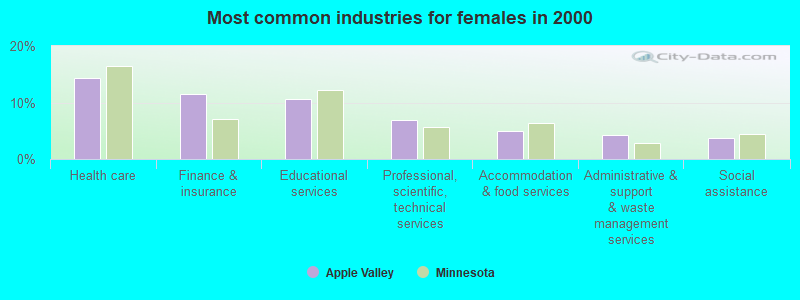
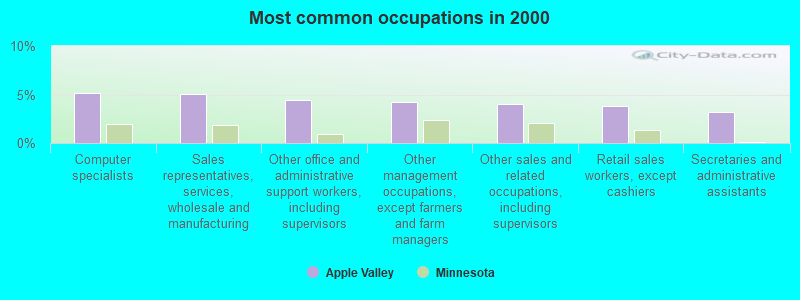
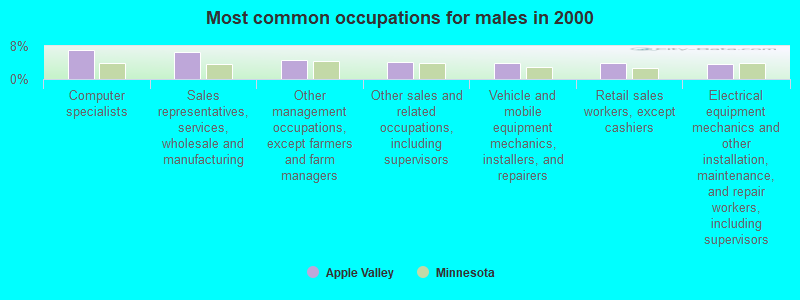
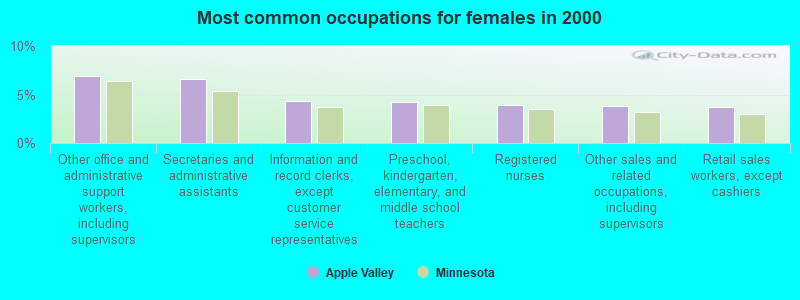
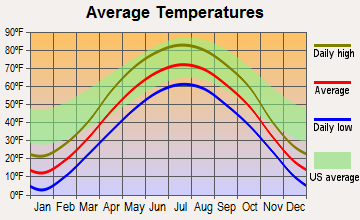
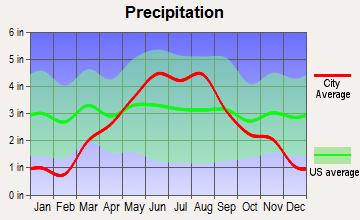
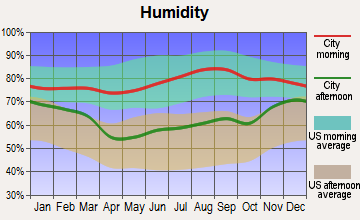
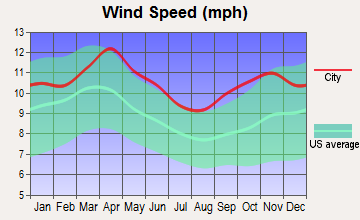
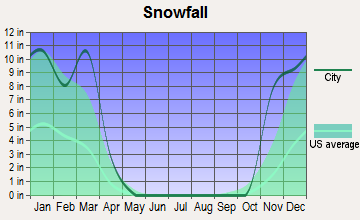
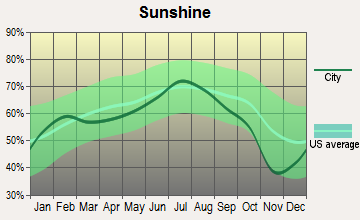
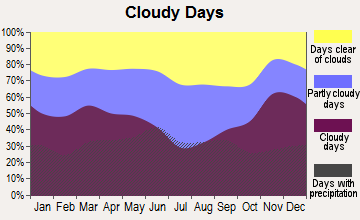
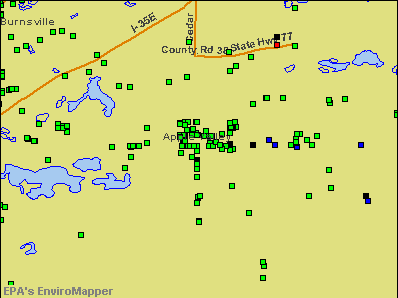

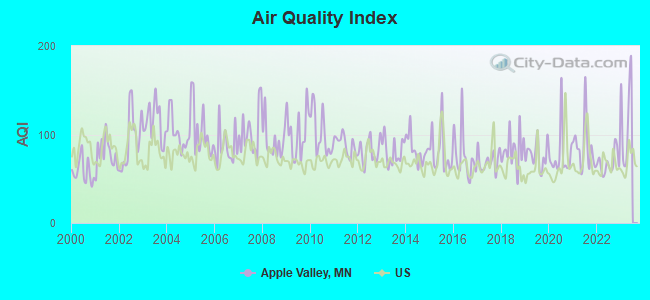
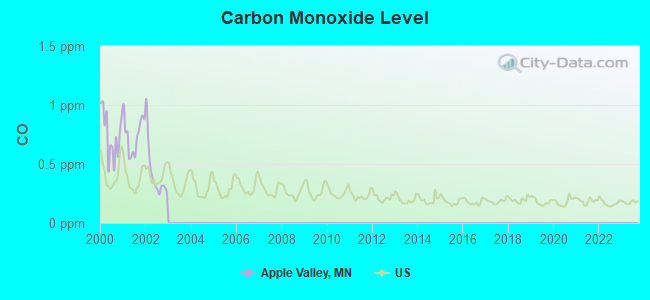
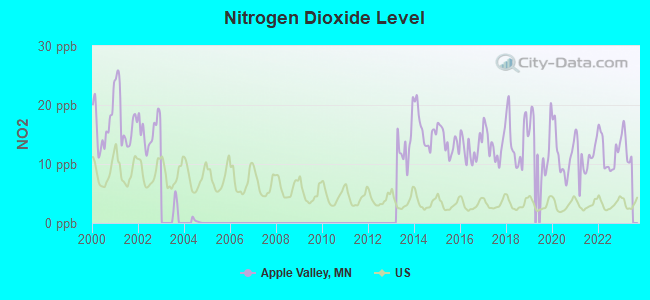
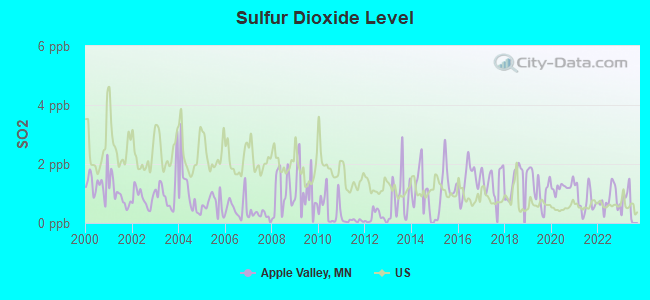
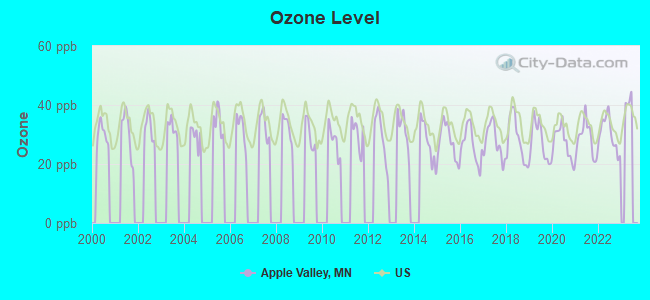
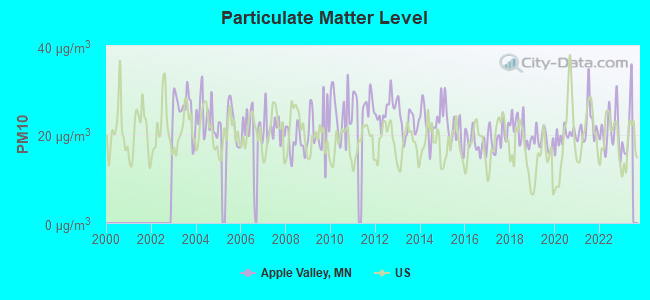
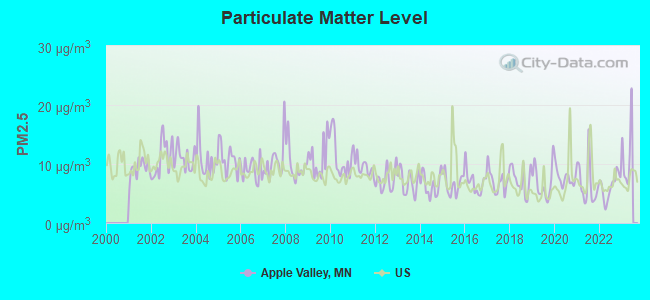
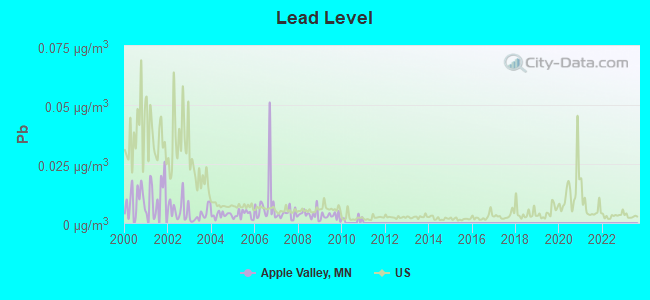

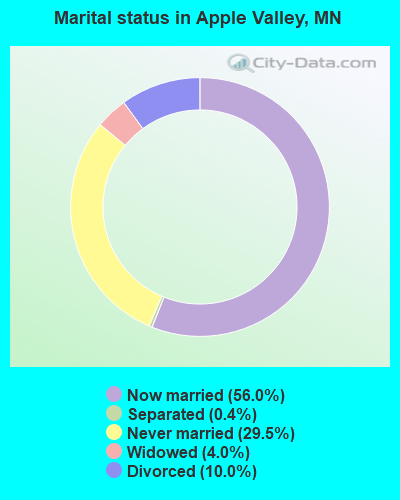
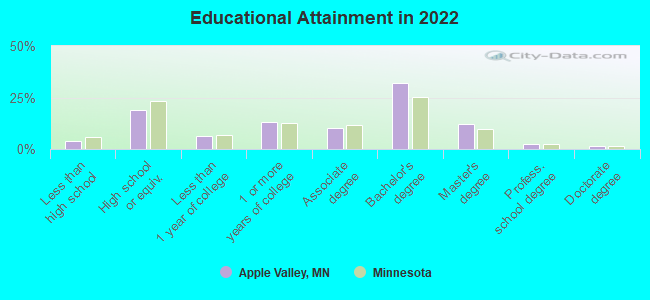
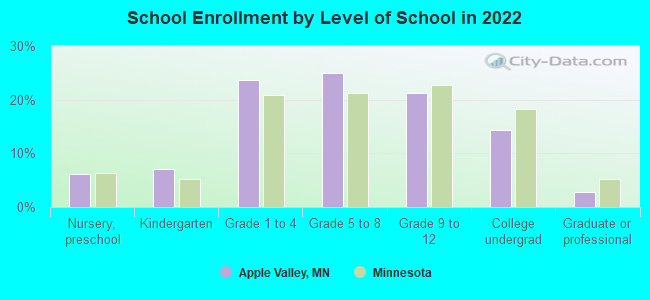
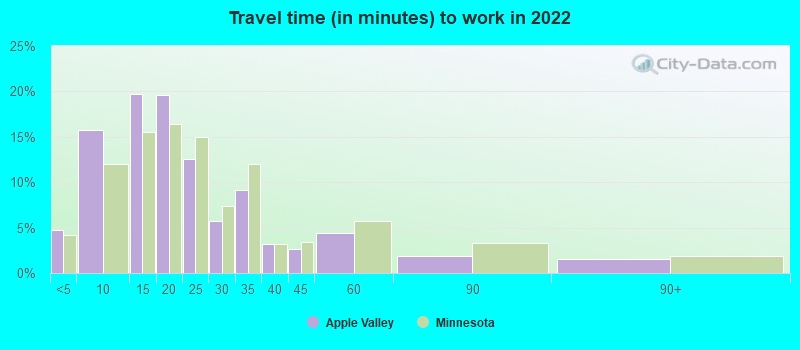

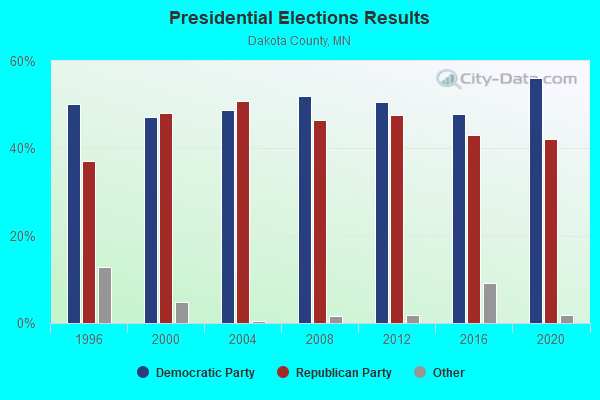
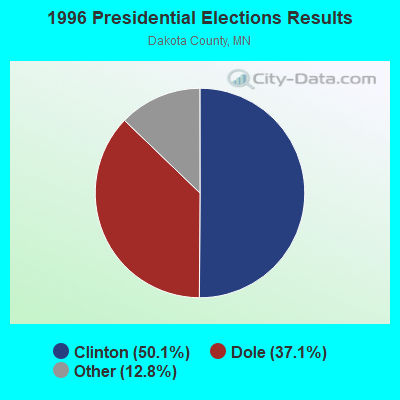
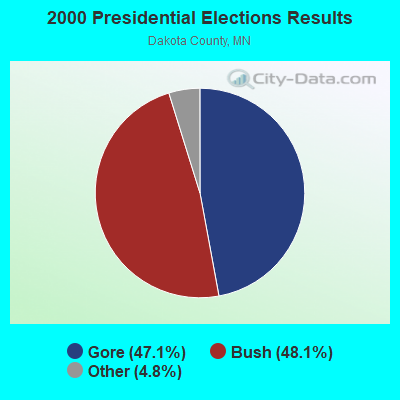
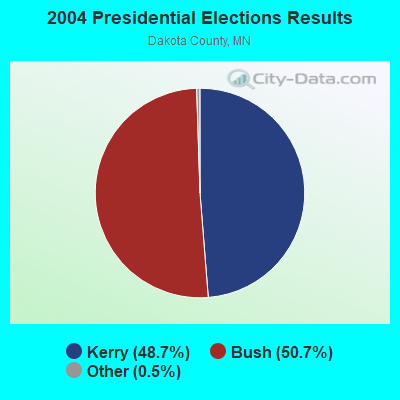
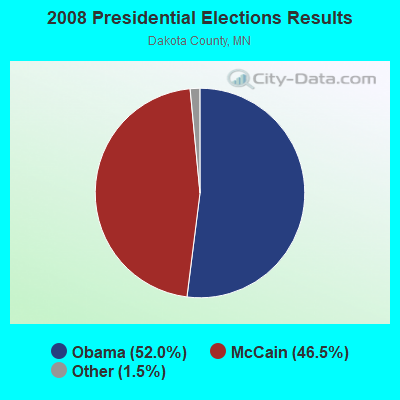
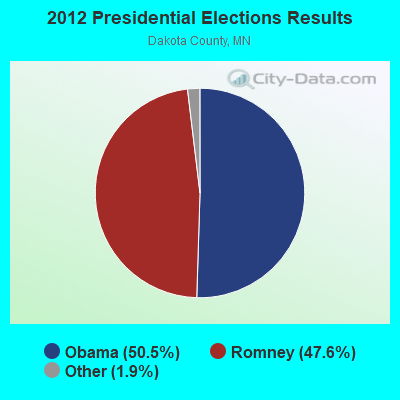
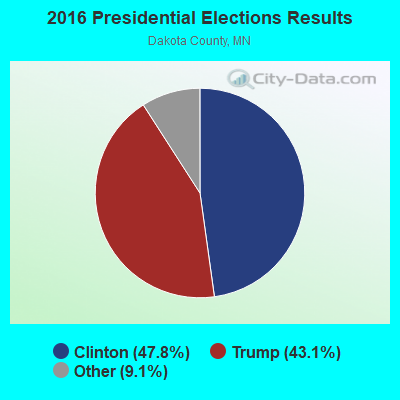
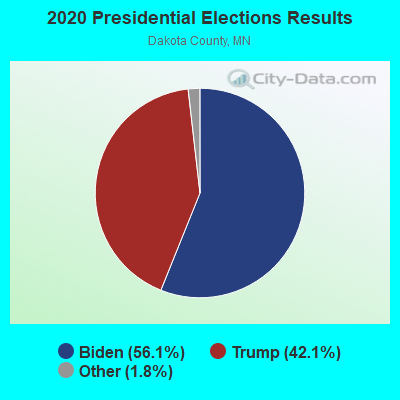
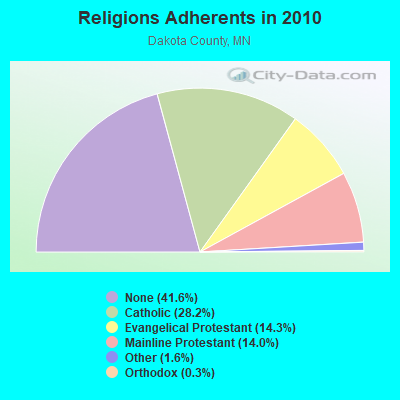
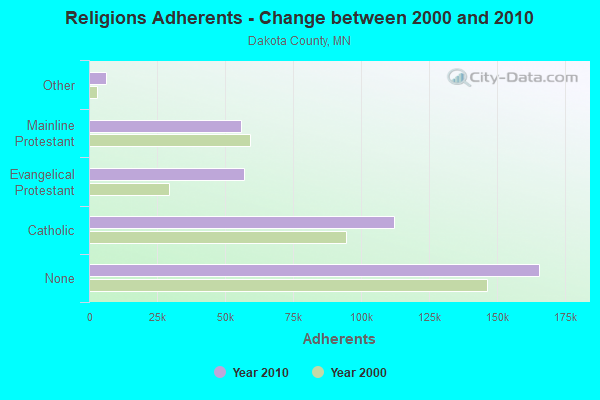
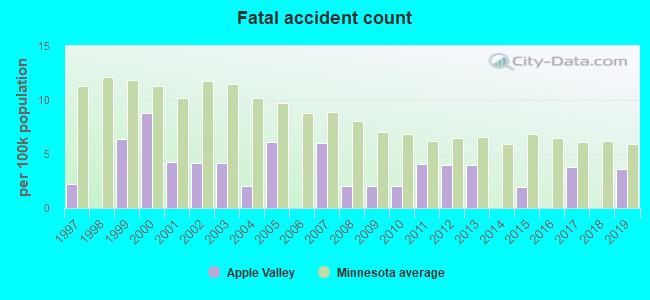
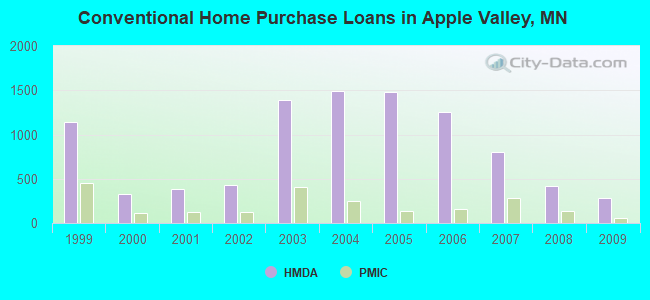
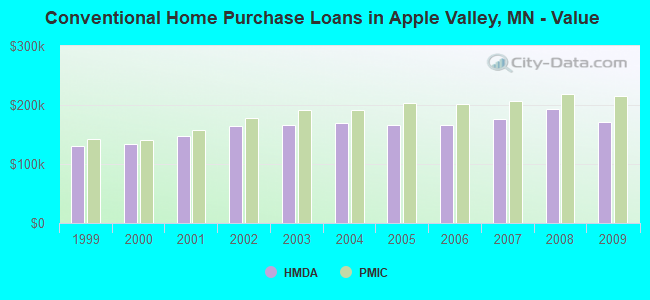
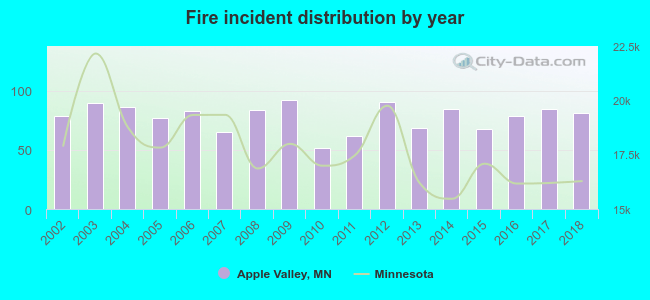 According to the data from the years 2002 - 2018 the average number of fire incidents per year is 78. The highest number of reported fires - 92 took place in 2009, and the least - 52 in 2010. The data has an increasing trend.
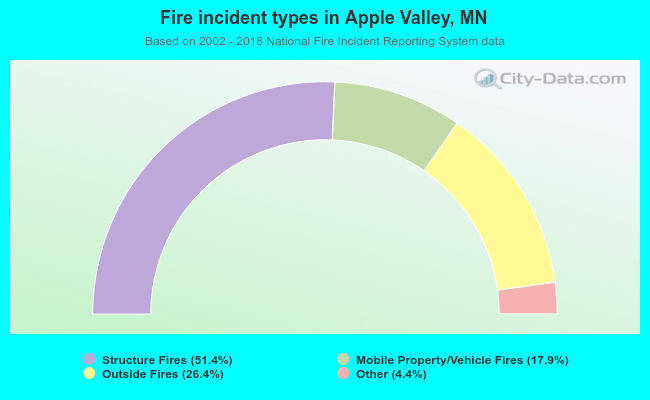 When looking into fire subcategories, the most incidents belonged to: Structure Fires (51.4%), and Outside Fires (26.4%).