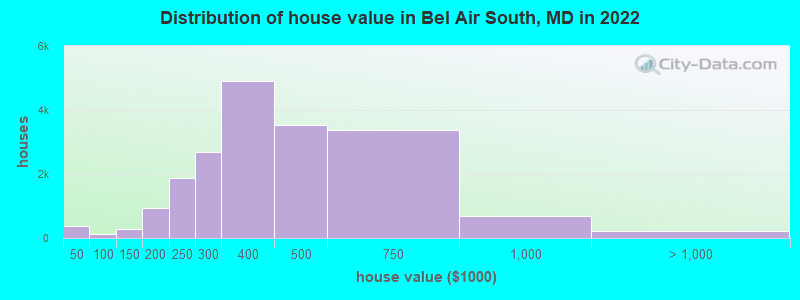
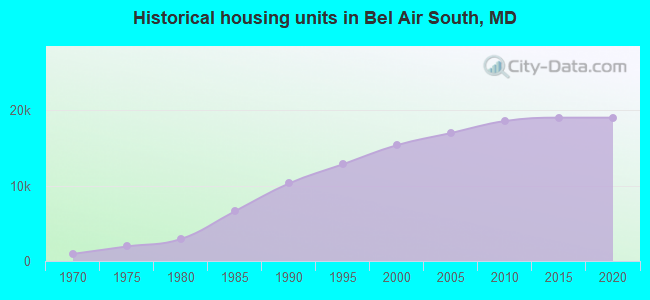
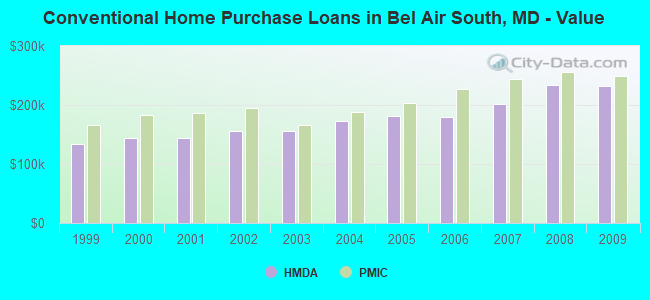
Estimated median house or condo value in 2022: $370,762 (it was $142,400 in 2000)
Bel Air South:
$370,762
MD:
$398,100
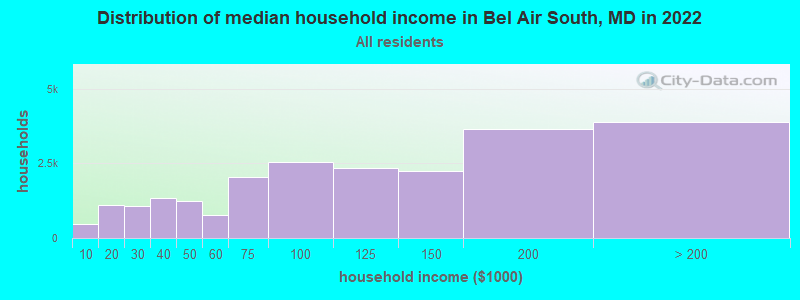
Mean prices in 2022:all housing units: $455,469; detached houses: $509,158; townhouses or other attached units: $349,595; in 2-unit structures: $311,721; in 3-to-4-unit structures: $366,789; in 5-or-more-unit structures: $302,058; mobile homes: $108,190
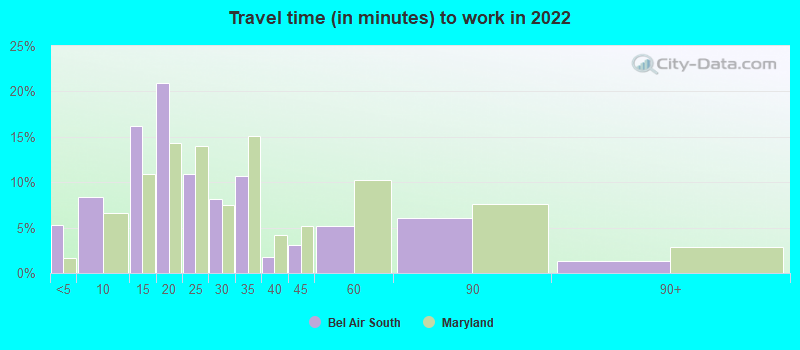
Median gross rent in 2022: $1,534.
March 2022 cost of living index in Bel Air South: 105.7 (more than average, U.S. average is 100)
Percentage of residents living in poverty in 2022: 4.1%
(3.7% for White Non-Hispanic residents, 7.1% for Black residents, 4.9% for Hispanic or Latino residents, 12.6% for other race residents, 3.0% for two or more races residents)
Latest news from Bel Air South, MD collected exclusively by city-data.com from local newspapers, TV, and radio stations
Ancestries: German (9.9%), Irish (8.5%), Italian (8.0%), American (7.9%), English (7.7%), Polish (3.9%).
Current Local Time: EST time zone
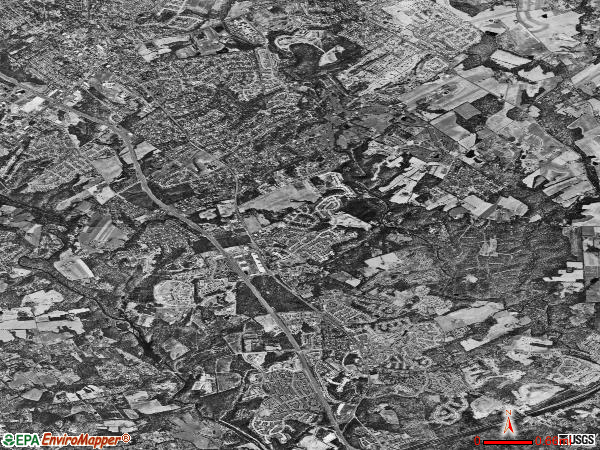
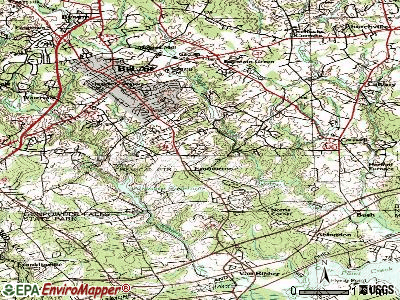
Land area: 15.7 square miles.
Population density: 3,037 people per square mile (average).
3,932 residents are foreign born (3.0% Asia, 1.3% Africa, 1.0% Europe, 0.9% Latin America).
This place:
6.8%
Maryland:
15.7%
Median real estate property taxes paid for housing units with mortgages in 2022: $3,120 (0.9%) Median real estate property taxes paid for housing units with no mortgage in 2022: $2,933 (0.8%)
Nearest city with pop. 50,000+: Towson, MD (17.3 miles , pop. 51,793).
Nearest city with pop. 200,000+: Baltimore, MD (20.9 miles , pop. 651,154).
Nearest city with pop. 1,000,000+: Philadelphia, PA (71.2 miles , pop. 1,517,550).
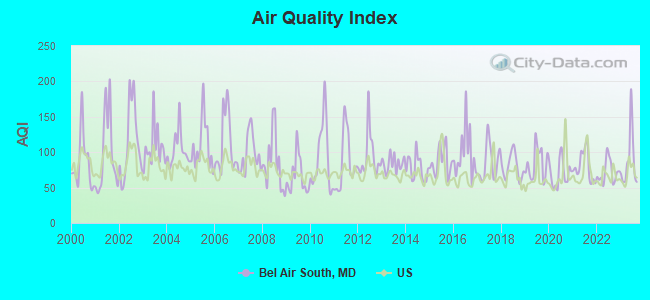
Air Quality Index (AQI) level in 2023 was 87.0. This is about average.
City:
87.0
U.S.:
72.6
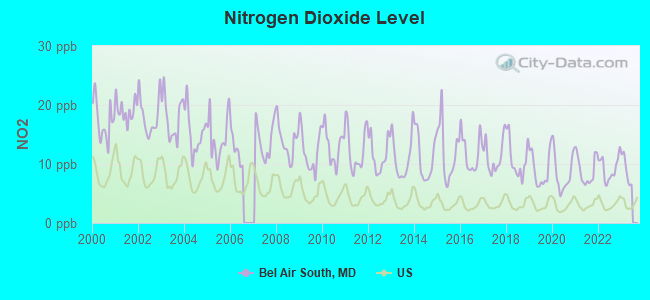
Nitrogen Dioxide (NO2) [ppb] level in 2022 was 9.24. This is significantly worse than average.Closest monitor was 2.8 miles away from the city center.
City:
9.24
U.S.:
5.11
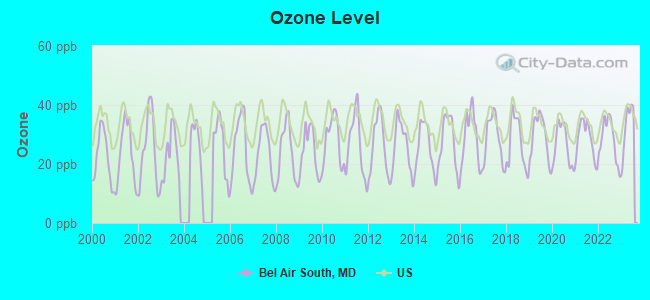
Ozone [ppb] level in 2023 was 33.1. This is about average.Closest monitor was 8.6 miles away from the city center.
City:
33.1
U.S.:
33.3
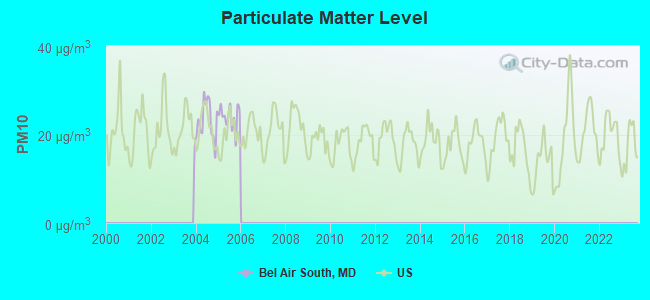
Particulate Matter (PM10) [µg/m3] level in 2005 was 24.0. This is worse than average.Closest monitor was 15.7 miles away from the city center.
City:
24.0
U.S.:
19.2
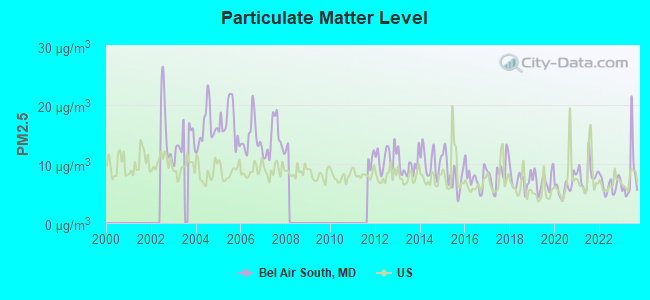
Particulate Matter (PM2.5) [µg/m3] level in 2023 was 8.03. This is about average.Closest monitor was 6.5 miles away from the city center.
City:
8.03
U.S.:
8.11
Tornado activity:
Bel Air South-area historical tornado activity is slightly above Maryland state average. It is 18% greater than the overall U.S. average.
On 6/9/1961, a category F3 (max. wind speeds 158-206 mph) tornado 24.7 miles away from the Bel Air South place center causedbetween $50,000 and $500,000 in damages.
On 7/27/1994, a category F3 tornado 32.7 miles away from the place center injured 11 peopleand causedbetween $500,000 and $5,000,000 in damages.
Earthquake activity:
Bel Air South-area historical earthquake activity is significantly above Maryland state average. It is 61% smaller than the overall U.S. average.
On 8/23/2011 at 17:51:04, a magnitude 5.8 (5.8 MW, Depth: 3.7 mi, Class: Moderate, Intensity: VI - VII) earthquake occurred 140.6 miles away from the city center On 1/16/1994 at 01:49:16, a magnitude 4.6 (4.6 MB, 4.6 LG, Depth: 3.1 mi, Class: Light, Intensity: IV - V) earthquake occurred 59.1 miles away from the city center On 9/25/1998 at 19:52:52, a magnitude 5.2 (4.8 MB, 4.3 MS, 5.2 LG, 4.5 MW, Depth: 3.1 mi) earthquake occurred 254.7 miles away from Bel Air South center On 1/16/1994 at 00:42:43, a magnitude 4.2 (4.2 MB, 4.0 LG, Depth: 3.1 mi) earthquake occurred 59.4 miles away from Bel Air South center On 11/30/2017 at 21:47:31, a magnitude 4.1 (4.1 MW, Depth: 6.1 mi) earthquake occurred 51.9 miles away from Bel Air South center On 8/25/2011 at 05:07:52, a magnitude 4.5 (4.5 ML, Depth: 4.2 mi) earthquake occurred 139.6 miles away from Bel Air South center Magnitude types: regional Lg-wave magnitude (LG), body-wave magnitude (MB), local magnitude (ML), surface-wave magnitude (MS), moment magnitude (MW)
Natural disasters:
The number of natural disasters in Harford County (17) is near the US average (15). Major Disasters (Presidential) Declared: 12 Emergencies Declared: 5
Causes of natural disasters: Hurricanes: 7, Snowstorms: 4, Winter Storms: 4, Tropical Storms: 2, Blizzard: 1, Flood: 1, Snowfall: 1, Storm: 1, Other: 1 (Note: some incidents may be assigned to more than one category).
Hospitals and medical centers near Bel Air South:
DAVITA - BELAIR (Dialysis Facility, about 1 miles away; BEL AIR, MD)
HARFORD HHA/HOSPICE (Hospital, about 4 miles away; BEL AIR, MD)
LORIEN HEALTH SYSTEMS - RIVERSIDE (Nursing Home, about 5 miles away; BELCAMP, MD)
FOREST HILL HEALTH AND REHABILITATION CENTER (Nursing Home, about 5 miles away; FOREST HILL, MD)
FOREST LANDING DIALYSIS (Dialysis Facility, about 6 miles away; FOREST HILL, MD)
ABERDEEN DIALYSIS (Dialysis Facility, about 8 miles away; ABERDEEN, MD)
GLEN MEADOWS RETIREMENT COM. (Nursing Home, about 12 miles away; GLEN ARM, MD)
Amtrak station near Bel Air South:
9 miles: ABERDEEN (S. PHILADELPHIA & BELAIR AVE.) . Services: free short-term parking, intercity bus service.
Operable nuclear power plants near Bel Air South:
16 miles: Peach Bottom 2 and 3 in Delta, PA.
Colleges/universities with over 2000 students nearest to Bel Air South:
Harford Community College (about 5 miles; Bel Air, MD; Full-time enrollment: 4,530)
The Community College of Baltimore County (about 14 miles; Baltimore, MD; FT enrollment: 15,217)
Towson University (about 18 miles; Towson, MD; FT enrollment: 19,618)
Morgan State University (about 18 miles; Baltimore, MD; FT enrollment: 7,113)
Loyola University Maryland (about 20 miles; Baltimore, MD; FT enrollment: 5,215)
Johns Hopkins University (about 21 miles; Baltimore, MD; FT enrollment: 20,568)
All-State Career-Baltimore (about 21 miles; Baltimore, MD; FT enrollment: 2,287)
Notable locations in Bel Air South: Bynum Run Picnic Area (A), Evermar Farms (B), Maryland Country Club (C), Wheel (D), Lorien Bel Air Assisted Living Center (E), Harford County Public Library - Abingdon Branch (F), Brightview Assisted Living of Bel Air (G). Display/hide their locations on the map
Shopping Centers: Fountain Green Plaza Shopping Center (1), Box Hill Square Shopping Center (2), Constant Friendship Shopping Center (3), Festival at Bel Air Shopping Center (4). Display/hide their locations on the map
Churches in Bel Air South include: Saint Marys Church (A), Christ Fellowship Church (B), Mount Carmel Church (C), Mount Zion Church (D), The Church of Jesus Christ of Latter Day Saints (E), Ekklesia Community Ministries (F), Christ Our King Presbyterian Church (G), Emmorton Baptist Church (H), Good Shepherd Lutheran Church (I). Display/hide their locations on the map
Parks in Bel Air South include: Singer Road Park (1), Constant Friendship Park (2), Winters Run Conservation Area (3), Harford Glen Park (4), Bynum Run Park (5). Display/hide their locations on the map
Harford County has a predicted average indoor radon screening level greater than 4 pCi/L (pico curies per liter) - Highest Potential
Average household size:
This place:
2.6 people
Maryland:
2.6 people
Percentage of family households:
This place:
71.1%
Whole state:
67.1%
Percentage of households with unmarried partners:
This place:
5.6%
Whole state:
6.4%
Likely homosexual households (counted as self-reported same-sex unmarried-partner households)
Lesbian couples: 0.3% of all households
Gay men: 0.2% of all households
147 people in nursing facilities/skilled-nursing facilities in 2010
133 people in group homes intended for adults in 2010
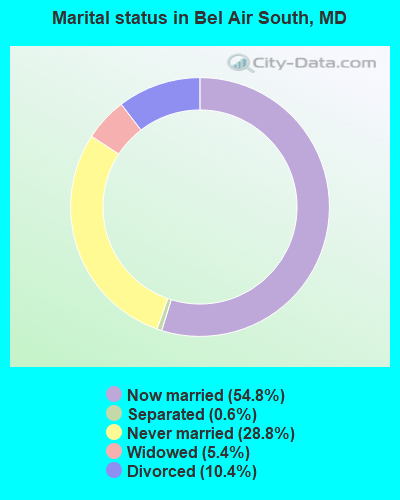
For population 15 years and over in Bel Air South:
Never married: 28.8%
Now married: 54.8%
Separated: 0.6%
Widowed: 5.4%
Divorced: 10.4%
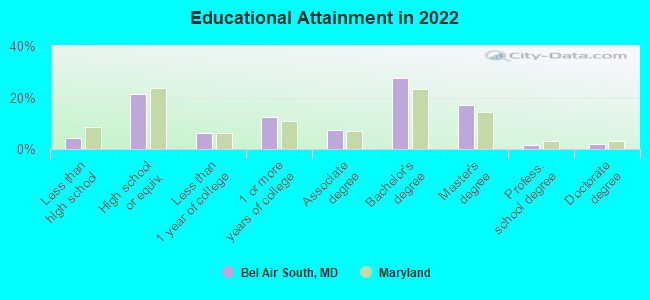
For population 25 years and over in Bel Air South:
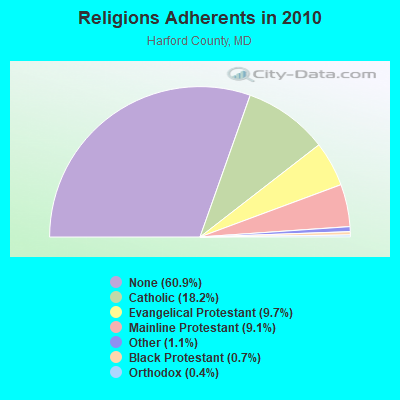
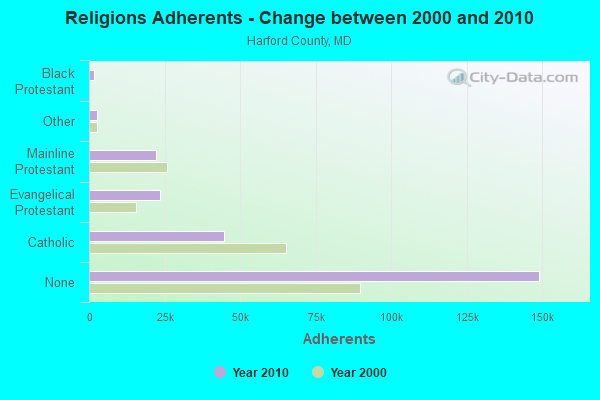
Religion statistics for Bel Air South, MD (based on Harford County data)
Religion
Adherents
Congregations
Catholic
44,618
9
Evangelical Protestant
23,645
97
Mainline Protestant
22,305
65
Other
2,675
10
Black Protestant
1,628
9
Orthodox
900
2
None
149,055
-
Source: Clifford Grammich, Kirk Hadaway, Richard Houseal, Dale E.Jones, Alexei Krindatch, Richie Stanley and Richard H.Taylor. 2012. 2010 U.S.Religion Census: Religious Congregations & Membership Study. Association of Statisticians of American Religious Bodies. Jones, Dale E., et al. 2002. Congregations and Membership in the United States 2000. Nashville, TN: Glenmary Research Center. Graphs represent county-level data
Kristin A Steiner, 11526 Rhody Dr (Lat: 39.476306 Lon: -76.310778), Type: 33.5, Overall height: 33.5 m, Registrant: Pm@mobilitie.Com, , Newpo-rt Beach, Phone: (949) 515-1500
Dale R Smith, 11526 Rhody Dr White Oak Forest 2md20730 (Lat: 39.476306 Lon: -76.310778), Type: 36.6, Overall height: 36.6 m, Registrant: Mobilitie Investments Ii, LLC, Pm@mobilitie.Com, , Newpo-rt Beach, Phone: (949) 515-1500
Dale R Smith, 11526 Rhody Dr White Oak Forest 2md20730 (Lat: 39.476306 Lon: -76.310778), Type: 36.6, Overall height: 36.6 m, Registrant: Mobilitie Investments Ii, LLC, Pm@mobilitie.Com, , Newpo-rt Beach, Phone: (949) 515-1500
Edward G Roach, 11526 Rhody Dr White Oak Forest 2md20730 (Lat: 39.476306 Lon: -76.310778), Type: 36.6, Overall height: 36.6 m, Registrant: Sba Monarch Towers Ii, LLC, Eroach@sbasite.Com, , Boca -Raton, Phone: (561) 995-7670
FCC Registered Microwave Towers:
1
7BAN104A, 1900 Emmerton Road (Lat: 39.504083 Lon: -76.328361), Type: Ltower, Structure height: 54.3 m, Call Sign: WQRC456, Assigned Frequencies: 11585.0 MHz, 11585.0 MHz, 11585.0 MHz, 11585.0 MHz, 11585.0 MHz, Grant Date: 06/26/2023, Expiration Date: 04/15/2033, Cancellation Date: 07/03/2023, Certifier: Dan Menser, Registrant: T-Mobile Usa, Inc., 12920 Se 38th St, Bellevue, WA 98006, Phone: (425) 383-8401, Fax: (425) 383-4040, Email:
Home Mortgage Disclosure Act Aggregated Statistics For Year 2009 (Based on 4 full and 5 partial tracts)
A) FHA, FSA/RHS & VA Home Purchase Loans
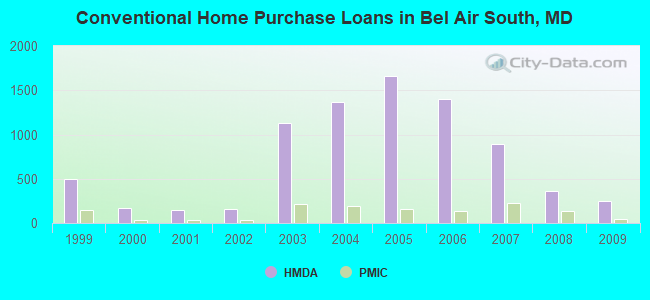
B) Conventional Home Purchase Loans
C) Refinancings
D) Home Improvement Loans
E) Loans on Dwellings For 5+ Families
F) Non-occupant Loans on < 5 Family Dwellings (A B C & D)
G) Loans On Manufactured Home Dwelling (A B C & D)
Number
Average Value
Number
Average Value
Number
Average Value
Number
Average Value
Number
Average Value
Number
Average Value
Number
Average Value
LOANS ORIGINATED
380
$237,242
252
$232,276
1,850
$228,094
73
$116,562
2
$9,800,000
93
$215,754
0
$0
APPLICATIONS APPROVED, NOT ACCEPTED
15
$257,807
23
$291,461
161
$227,971
10
$69,518
0
$0
5
$163,850
0
$0
APPLICATIONS DENIED
25
$240,302
21
$203,412
378
$250,133
33
$58,925
0
$0
21
$204,290
1
$40,770
APPLICATIONS WITHDRAWN
25
$234,615
29
$217,779
330
$246,296
6
$79,552
0
$0
11
$142,115
0
$0
FILES CLOSED FOR INCOMPLETENESS
5
$229,108
4
$352,730
96
$249,091
3
$74,500
0
$0
7
$262,884
0
$0
Aggregated Statistics For Year 2008 (Based on 4 full and 5 partial tracts)
A) FHA, FSA/RHS & VA Home Purchase Loans
B) Conventional Home Purchase Loans
C) Refinancings
D) Home Improvement Loans
F) Non-occupant Loans on < 5 Family Dwellings (A B C & D)
G) Loans On Manufactured Home Dwelling (A B C & D)
Number
Average Value
Number
Average Value
Number
Average Value
Number
Average Value
Number
Average Value
Number
Average Value
LOANS ORIGINATED
288
$256,419
365
$233,302
987
$215,926
131
$76,453
100
$199,034
1
$97,160
APPLICATIONS APPROVED, NOT ACCEPTED
8
$195,852
43
$240,854
105
$211,426
25
$73,100
4
$81,462
1
$33,760
APPLICATIONS DENIED
17
$316,689
27
$206,887
346
$228,218
63
$69,523
19
$167,178
1
$67,820
APPLICATIONS WITHDRAWN
17
$215,008
28
$249,115
217
$238,186
21
$105,028
5
$131,828
0
$0
FILES CLOSED FOR INCOMPLETENESS
2
$225,000
11
$262,609
50
$225,152
4
$43,600
12
$237,351
0
$0
Aggregated Statistics For Year 2007 (Based on 4 full and 5 partial tracts)
A) FHA, FSA/RHS & VA Home Purchase Loans
B) Conventional Home Purchase Loans
C) Refinancings
D) Home Improvement Loans
E) Loans on Dwellings For 5+ Families
F) Non-occupant Loans on < 5 Family Dwellings (A B C & D)
G) Loans On Manufactured Home Dwelling (A B C & D)
Number
Average Value
Number
Average Value
Number
Average Value
Number
Average Value
Number
Average Value
Number
Average Value
Number
Average Value
LOANS ORIGINATED
99
$255,502
894
$202,366
1,192
$199,733
209
$79,736
0
$0
94
$179,597
0
$0
APPLICATIONS APPROVED, NOT ACCEPTED
4
$283,292
99
$197,920
183
$188,748
43
$67,133
1
$138,060
14
$179,236
4
$57,882
APPLICATIONS DENIED
6
$218,468
99
$196,256
490
$217,468
90
$68,851
0
$0
33
$197,102
7
$79,364
APPLICATIONS WITHDRAWN
5
$274,600
77
$216,082
313
$206,395
31
$123,479
0
$0
14
$160,160
0
$0
FILES CLOSED FOR INCOMPLETENESS
1
$161,710
15
$213,455
94
$217,733
11
$73,627
0
$0
6
$214,057
0
$0
Aggregated Statistics For Year 2006 (Based on 4 full and 5 partial tracts)
A) FHA, FSA/RHS & VA Home Purchase Loans
B) Conventional Home Purchase Loans
C) Refinancings
D) Home Improvement Loans
E) Loans on Dwellings For 5+ Families
F) Non-occupant Loans on < 5 Family Dwellings (A B C & D)
G) Loans On Manufactured Home Dwelling (A B C & D)
Number
Average Value
Number
Average Value
Number
Average Value
Number
Average Value
Number
Average Value
Number
Average Value
Number
Average Value
LOANS ORIGINATED
88
$231,647
1,398
$180,450
1,637
$186,409
274
$72,662
1
$3,496,970
124
$148,068
1
$188,500
APPLICATIONS APPROVED, NOT ACCEPTED
8
$218,578
108
$200,968
198
$163,640
55
$38,716
0
$0
21
$158,602
3
$48,190
APPLICATIONS DENIED
10
$229,437
146
$180,513
556
$209,181
92
$80,141
0
$0
14
$191,841
3
$42,837
APPLICATIONS WITHDRAWN
7
$244,103
104
$192,326
527
$201,239
41
$100,416
1
$5,350,000
12
$114,524
1
$78,980
FILES CLOSED FOR INCOMPLETENESS
2
$319,905
27
$187,254
101
$205,142
14
$88,131
0
$0
6
$141,845
0
$0
Aggregated Statistics For Year 2005 (Based on 4 full and 5 partial tracts)
A) FHA, FSA/RHS & VA Home Purchase Loans
B) Conventional Home Purchase Loans
C) Refinancings
D) Home Improvement Loans
E) Loans on Dwellings For 5+ Families
F) Non-occupant Loans on < 5 Family Dwellings (A B C & D)
G) Loans On Manufactured Home Dwelling (A B C & D)
Number
Average Value
Number
Average Value
Number
Average Value
Number
Average Value
Number
Average Value
Number
Average Value
Number
Average Value
LOANS ORIGINATED
80
$215,780
1,656
$181,012
2,179
$186,322
260
$93,161
1
$194,280
167
$147,725
6
$94,147
APPLICATIONS APPROVED, NOT ACCEPTED
3
$208,667
115
$192,897
211
$173,968
34
$67,946
0
$0
16
$149,577
4
$55,140
APPLICATIONS DENIED
8
$188,544
164
$163,530
529
$183,387
118
$60,089
0
$0
14
$163,824
11
$63,483
APPLICATIONS WITHDRAWN
6
$214,775
152
$183,326
626
$194,154
68
$135,915
0
$0
11
$131,631
0
$0
FILES CLOSED FOR INCOMPLETENESS
1
$203,000
33
$155,160
140
$198,491
20
$58,450
0
$0
6
$132,957
0
$0
Aggregated Statistics For Year 2004 (Based on 4 full and 5 partial tracts)
A) FHA, FSA/RHS & VA Home Purchase Loans
B) Conventional Home Purchase Loans
C) Refinancings
D) Home Improvement Loans
F) Non-occupant Loans on < 5 Family Dwellings (A B C & D)
G) Loans On Manufactured Home Dwelling (A B C & D)
Number
Average Value
Number
Average Value
Number
Average Value
Number
Average Value
Number
Average Value
Number
Average Value
LOANS ORIGINATED
213
$173,828
1,366
$172,287
2,109
$158,858
199
$66,345
113
$126,923
3
$29,057
APPLICATIONS APPROVED, NOT ACCEPTED
11
$162,386
86
$192,963
277
$156,586
45
$42,416
9
$120,788
2
$36,010
APPLICATIONS DENIED
10
$171,618
112
$170,370
546
$154,067
150
$56,969
14
$119,100
5
$40,788
APPLICATIONS WITHDRAWN
14
$178,905
100
$173,301
622
$159,233
52
$76,765
14
$127,636
2
$41,455
FILES CLOSED FOR INCOMPLETENESS
5
$141,542
30
$184,881
117
$154,191
13
$43,258
2
$123,555
0
$0
Aggregated Statistics For Year 2003 (Based on 4 full and 5 partial tracts)
A) FHA, FSA/RHS & VA Home Purchase Loans
B) Conventional Home Purchase Loans
C) Refinancings
D) Home Improvement Loans
F) Non-occupant Loans on < 5 Family Dwellings (A B C & D)
Number
Average Value
Number
Average Value
Number
Average Value
Number
Average Value
Number
Average Value
LOANS ORIGINATED
351
$158,781
1,131
$155,365
4,377
$142,082
100
$22,843
113
$101,304
APPLICATIONS APPROVED, NOT ACCEPTED
11
$164,754
83
$150,992
433
$130,435
29
$28,533
11
$91,297
APPLICATIONS DENIED
11
$174,167
69
$146,127
597
$129,443
52
$27,506
15
$121,981
APPLICATIONS WITHDRAWN
17
$164,544
102
$147,826
714
$143,658
18
$41,552
9
$104,564
FILES CLOSED FOR INCOMPLETENESS
3
$164,943
12
$148,923
121
$153,229
2
$40,000
2
$56,585
Aggregated Statistics For Year 2002 (Based on 4 partial tracts)
A) FHA, FSA/RHS & VA Home Purchase Loans
B) Conventional Home Purchase Loans
C) Refinancings
D) Home Improvement Loans
F) Non-occupant Loans on < 5 Family Dwellings (A B C & D)
Number
Average Value
Number
Average Value
Number
Average Value
Number
Average Value
Number
Average Value
LOANS ORIGINATED
47
$154,702
157
$156,334
521
$146,763
19
$35,322
14
$121,754
APPLICATIONS APPROVED, NOT ACCEPTED
1
$77,270
11
$159,795
42
$128,106
3
$36,350
2
$130,455
APPLICATIONS DENIED
1
$200,060
10
$104,878
66
$123,172
13
$20,112
0
$0
APPLICATIONS WITHDRAWN
1
$154,880
10
$133,564
74
$143,934
2
$59,510
0
$0
FILES CLOSED FOR INCOMPLETENESS
1
$61,510
2
$137,160
11
$164,929
0
$0
0
$0
Aggregated Statistics For Year 2001 (Based on 4 partial tracts)
A) FHA, FSA/RHS & VA Home Purchase Loans
B) Conventional Home Purchase Loans
C) Refinancings
D) Home Improvement Loans
F) Non-occupant Loans on < 5 Family Dwellings (A B C & D)
Number
Average Value
Number
Average Value
Number
Average Value
Number
Average Value
Number
Average Value
LOANS ORIGINATED
41
$137,083
147
$143,284
357
$143,746
26
$21,513
11
$112,156
APPLICATIONS APPROVED, NOT ACCEPTED
1
$42,500
11
$121,773
26
$127,870
8
$33,079
0
$0
APPLICATIONS DENIED
1
$135,280
8
$123,584
64
$129,024
11
$17,557
0
$0
APPLICATIONS WITHDRAWN
2
$146,590
11
$175,480
50
$132,855
8
$21,106
1
$117,570
FILES CLOSED FOR INCOMPLETENESS
0
$0
1
$74,210
14
$109,626
0
$0
0
$0
Aggregated Statistics For Year 2000 (Based on 4 partial tracts)
A) FHA, FSA/RHS & VA Home Purchase Loans
B) Conventional Home Purchase Loans
C) Refinancings
D) Home Improvement Loans
E) Loans on Dwellings For 5+ Families
F) Non-occupant Loans on < 5 Family Dwellings (A B C & D)
Number
Average Value
Number
Average Value
Number
Average Value
Number
Average Value
Number
Average Value
Number
Average Value
LOANS ORIGINATED
32
$136,690
168
$143,225
59
$98,911
34
$26,393
1
$3,368,950
4
$95,920
APPLICATIONS APPROVED, NOT ACCEPTED
1
$172,080
16
$159,301
18
$68,751
14
$19,917
0
$0
0
$0
APPLICATIONS DENIED
0
$0
15
$152,162
38
$76,361
13
$28,748
0
$0
0
$0
APPLICATIONS WITHDRAWN
1
$158,640
13
$159,528
28
$69,812
5
$42,218
0
$0
0
$0
FILES CLOSED FOR INCOMPLETENESS
0
$0
2
$206,495
3
$191,437
1
$10,370
0
$0
0
$0
Aggregated Statistics For Year 1999 (Based on 7 partial tracts)
A) FHA, FSA/RHS & VA Home Purchase Loans
B) Conventional Home Purchase Loans
C) Refinancings
D) Home Improvement Loans
F) Non-occupant Loans on < 5 Family Dwellings (A B C & D)


 Recent articles from our blog. Our writers, many of them Ph.D. graduates or candidates, create easy-to-read articles on a wide variety of topics.

 (17.3 miles