Carpinteria Valley, California
Submit your own pictures of this place and show them to the world
- OSM Map
- General Map
- Google Map
- MSN Map

| Males: 9,590 | |
| Females: 9,552 |
| Median resident age: | 37.7 years |
| California median age: | 33.3 years |
Zip code: 93013
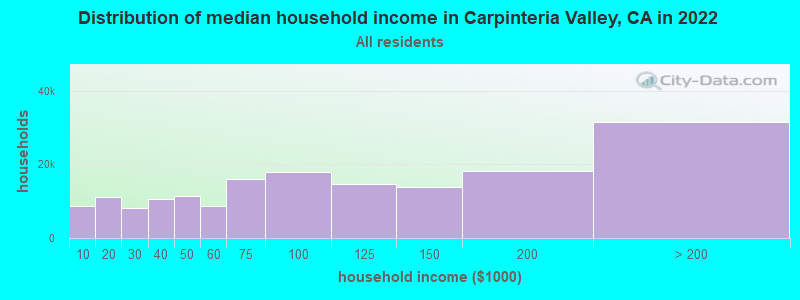
| Carpinteria Valley: | $103,172 |
| CA: | $91,551 |
Estimated per capita income in 2022: $52,925 (it was $27,260 in 2000)
Carpinteria Valley CCD income, earnings, and wages data
Estimated median house or condo value in 2022: over $1,000,000 (it was $363,700 in 2000)
| Carpinteria Valley: | over $1,000,000 |
| CA: | $715,900 |
Mean prices in 2022: all housing units: over $1,000,000; detached houses: over $1,000,000; townhouses or other attached units: $846,704; in 2-unit structures: $831,856; in 3-to-4-unit structures: $952,887; in 5-or-more-unit structures: $595,438; mobile homes: $232,814; occupied boats, rvs, vans, etc.: $45,964
Carpinteria Valley, CA residents, houses, and apartments details
Detailed information about poverty and poor residents in Carpinteria Valley, CA


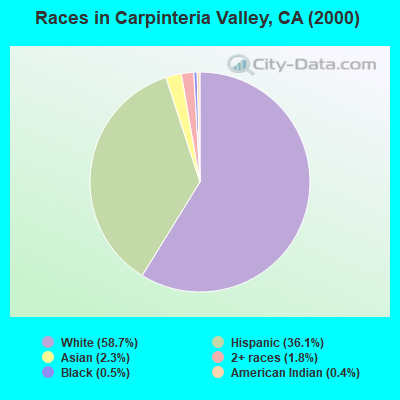
- 11,22258.7%White alone
- 6,89636.1%Hispanic
- 4442.3%Asian alone
- 3501.8%Two or more races
- 970.5%Black alone
- 740.4%American Indian alone
- 180.09%Native Hawaiian and Other
Pacific Islander alone - 70.04%Other race alone
 Recent articles from our blog. Our writers, many of them Ph.D. graduates or candidates, create easy-to-read articles on a wide variety of topics.
Current Local Time: PST time zone
Land area: 52.2 square miles.
Population density: 367 people per square mile (very low).

| Carpinteria Valley CCD: | 0.8% ($2,873) |
| California: | 0.8% ($1,564) |
Nearest city with pop. 50,000+: Santa Barbara, CA  (10.6 miles , pop. 92,325).
Nearest city with pop. 200,000+: Los Angeles, CA (69.6 miles , pop. 3,694,820).
Nearest cities:
), ), ), )Latitude: 34.40 N, Longitude: 119.53 W
Area code commonly used in this area: 805

| Here: | 4.5% |
| California: | 5.1% |
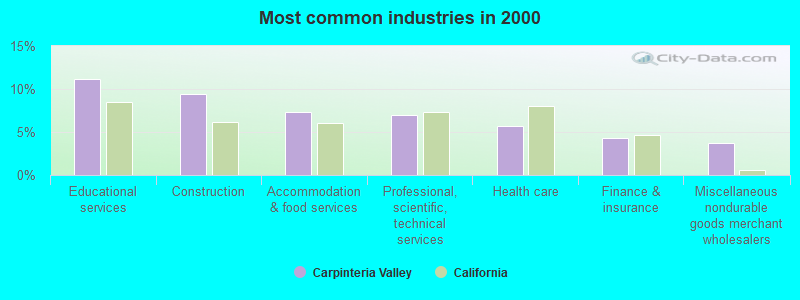
- Educational services (11.1%)
- Construction (9.4%)
- Accommodation & food services (7.3%)
- Professional, scientific, technical services (6.9%)
- Health care (5.7%)
- Finance & insurance (4.3%)
- Miscellaneous nondurable goods merchant wholesalers (3.8%)
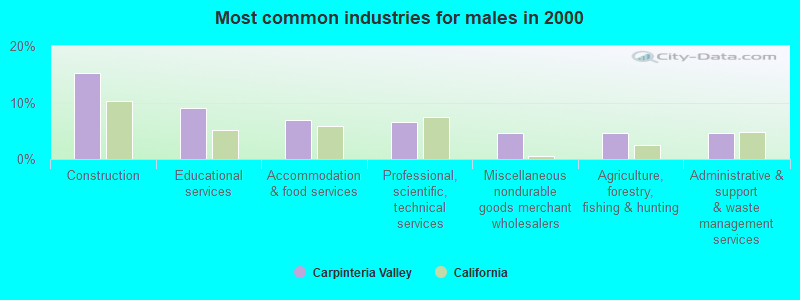
- Construction (15.2%)
- Educational services (9.1%)
- Accommodation & food services (6.9%)
- Professional, scientific, technical services (6.5%)
- Miscellaneous nondurable goods merchant wholesalers (4.7%)
- Agriculture, forestry, fishing & hunting (4.6%)
- Administrative & support & waste management services (4.6%)
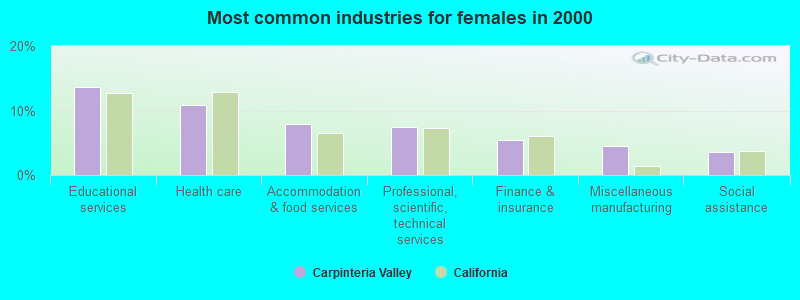
- Educational services (13.6%)
- Health care (10.9%)
- Accommodation & food services (7.9%)
- Professional, scientific, technical services (7.4%)
- Finance & insurance (5.4%)
- Miscellaneous manufacturing (4.4%)
- Social assistance (3.5%)
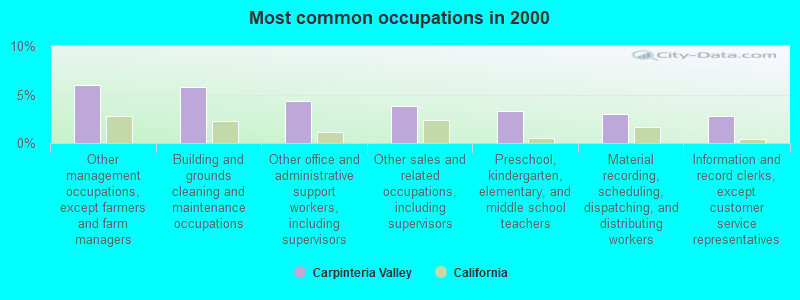
- Other management occupations, except farmers and farm managers (6.0%)
- Building and grounds cleaning and maintenance occupations (5.8%)
- Other office and administrative support workers, including supervisors (4.3%)
- Other sales and related occupations, including supervisors (3.8%)
- Preschool, kindergarten, elementary, and middle school teachers (3.2%)
- Material recording, scheduling, dispatching, and distributing workers (3.0%)
- Information and record clerks, except customer service representatives (2.8%)
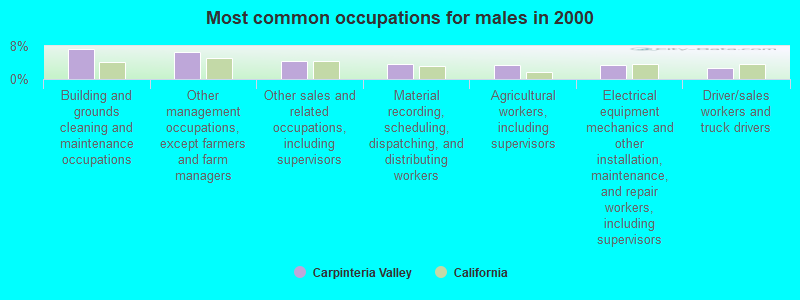
- Building and grounds cleaning and maintenance occupations (7.3%)
- Other management occupations, except farmers and farm managers (6.5%)
- Other sales and related occupations, including supervisors (4.5%)
- Material recording, scheduling, dispatching, and distributing workers (3.7%)
- Agricultural workers, including supervisors (3.4%)
- Electrical equipment mechanics and other installation, maintenance, and repair workers, including supervisors (3.4%)
- Driver/sales workers and truck drivers (2.8%)
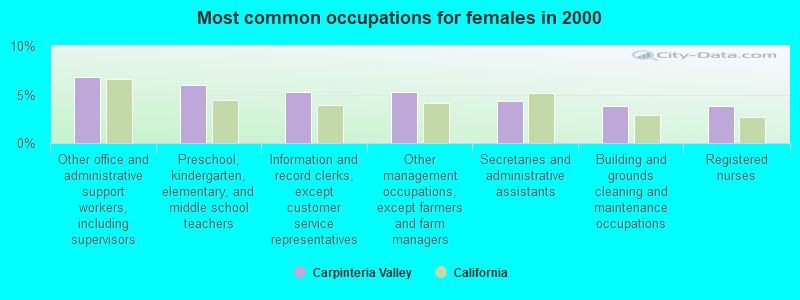
- Other office and administrative support workers, including supervisors (6.8%)
- Preschool, kindergarten, elementary, and middle school teachers (6.0%)
- Information and record clerks, except customer service representatives (5.3%)
- Other management occupations, except farmers and farm managers (5.3%)
- Secretaries and administrative assistants (4.4%)
- Building and grounds cleaning and maintenance occupations (3.8%)
- Registered nurses (3.8%)
Average climate in Carpinteria Valley, California
Based on data reported by over 4,000 weather stations


(lower is better)
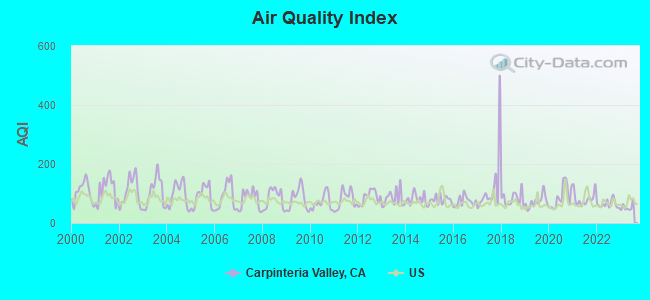
Air Quality Index (AQI) level in 2023 was 53.3. This is better than average.
| City: | 53.3 |
| U.S.: | 72.6 |
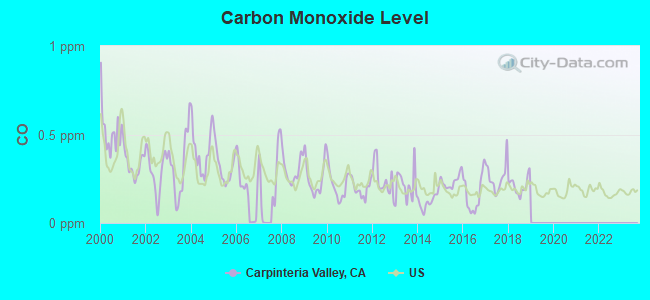
Carbon Monoxide (CO) [ppm] level in 2018 was 0.211. This is about average. Closest monitor was 6.1 miles away from the city center.
| City: | 0.211 |
| U.S.: | 0.251 |
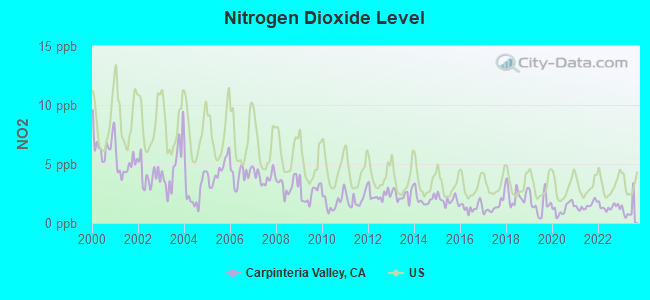
Nitrogen Dioxide (NO2) [ppb] level in 2023 was 1.19. This is significantly better than average. Closest monitor was 4.1 miles away from the city center.
| City: | 1.19 |
| U.S.: | 5.11 |
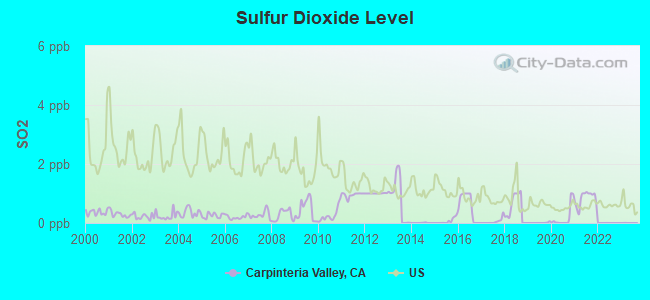
Sulfur Dioxide (SO2) [ppb] level in 2022 was 0.00031. This is significantly better than average. Closest monitor was 9.8 miles away from the city center.
| City: | 0.00031 |
| U.S.: | 1.51465 |
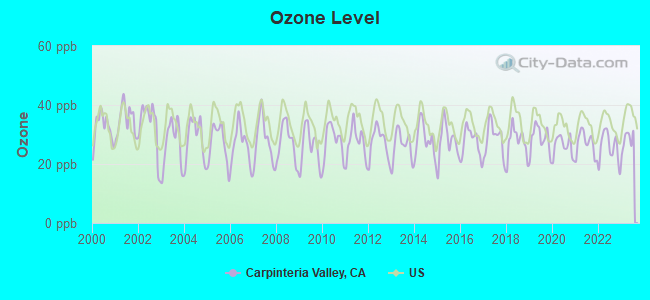
Ozone [ppb] level in 2023 was 28.2. This is about average. Closest monitor was 6.6 miles away from the city center.
| City: | 28.2 |
| U.S.: | 33.3 |
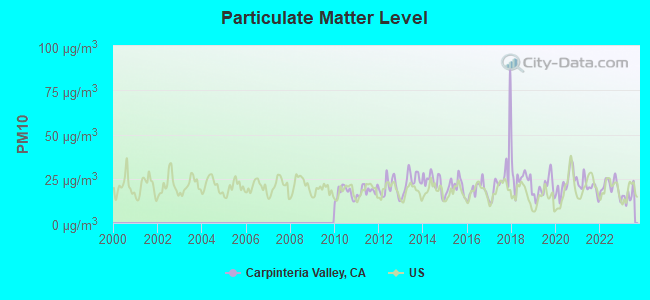
Particulate Matter (PM10) [µg/m3] level in 2023 was 15.7. This is better than average. Closest monitor was 9.3 miles away from the city center.
| City: | 15.7 |
| U.S.: | 19.2 |
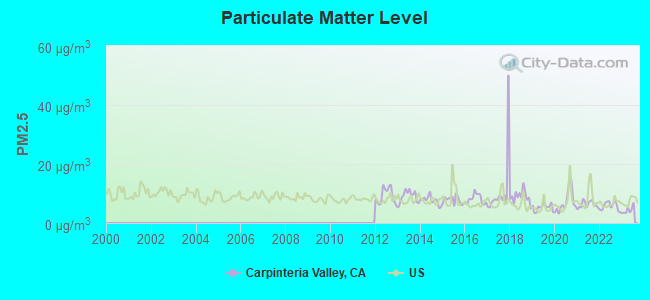
Particulate Matter (PM2.5) [µg/m3] level in 2023 was 4.36. This is significantly better than average. Closest monitor was 9.3 miles away from the city center.
| City: | 4.36 |
| U.S.: | 8.11 |
Earthquake activity:
Carpinteria Valley-area historical earthquake activity is significantly above California state average. It is 6631% greater than the overall U.S. average.On 7/21/1952 at 11:52:14, a magnitude 7.7 (7.7 UK, Class: Major, Intensity: VIII - XII) earthquake occurred 51.1 miles away from the city center, causing $50,000,000 total damage
On 11/4/1927 at 13:51:53, a magnitude 7.5 (7.5 UK) earthquake occurred 92.4 miles away from the city center
On 6/28/1992 at 11:57:34, a magnitude 7.6 (6.2 MB, 7.6 MS, 7.3 MW, Depth: 0.7 mi) earthquake occurred 172.0 miles away from the city center, causing 3 deaths (1 shaking deaths, 2 other deaths) and 400 injuries, causing $100,000,000 total damage and $40,000,000 insured losses
On 10/16/1999 at 09:46:44, a magnitude 7.4 (6.3 MB, 7.4 MS, 7.2 MW, 7.3 ML) earthquake occurred 176.7 miles away from the city center
On 4/18/1906 at 13:12:21, a magnitude 7.9 (7.9 UK) earthquake occurred 315.1 miles away from the city center, causing $524,000,000 total damage
On 1/17/1994 at 12:30:55, a magnitude 6.8 (6.4 MB, 6.8 MS, 6.7 MW, Depth: 11.4 mi, Class: Strong, Intensity: VII - IX) earthquake occurred 57.3 miles away from the city center, causing 60 deaths (60 shaking deaths) and 7000 injuries
Magnitude types: body-wave magnitude (MB), local magnitude (ML), surface-wave magnitude (MS), moment magnitude (MW)
Natural disasters:
The number of natural disasters in Santa Barbara County (31) is a lot greater than the US average (15).Major Disasters (Presidential) Declared: 19
Emergencies Declared: 3
Causes of natural disasters: Floods: 17, Fires: 10, Storms: 8, Winter Storms: 8, Mudslides: 7, Landslides: 4, Drought: 1, Earthquake: 1, Freeze: 1, Hurricane: 1, Tornado: 1, Wind: 1, Other: 1 (Note: some incidents may be assigned to more than one category).
Hospitals and medical centers near Carpinteria Valley:
- CASA DORINDA (Nursing Home, about 7 miles away; SANTA BARBARA, CA)
- VISITING NURSE AND HOSPICE CARE OF SANTA BARBARA (Home Health Center, about 10 miles away; SANTA BARBARA, CA)
- ASSISTED HEALTHCARE SERVICES (Home Health Center, about 10 miles away; SANTA BARBARA, CA)
- SANTA BARBARA ARTIFICIAL KIDNEY CENTER, LLC (Dialysis Facility, about 11 miles away; SANTA BARBARA, CA)
- FOREMOST HOME CARE OF CALIFORNIA, INC (Home Health Center, about 11 miles away; SANTA BARBARA, CA)
- SANTA BARBARA CONVALESCENT HOSPITAL (Nursing Home, about 11 miles away; SANTA BARBARA, CA)
- SANTA BARBARA COTTAGE CARE CENTER (Nursing Home, about 12 miles away; SANTA BARBARA, CA)
Amtrak stations near Carpinteria Valley:
- 1 miles: CARPINTERIA (5TH ST. & LINDEN AVE.) . Services: fully wheelchair accessible, public payphones, full-service food facilities, free short-term parking, free long-term parking, call for taxi service.
- 10 miles: SANTA BARBARA (209 STATE ST.) . Services: ticket office, fully wheelchair accessible, enclosed waiting area, public restrooms, public payphones, full-service food facilities, free short-term parking, call for car rental service, call for taxi service, public transit connection.
- 17 miles: VENTURA (HARBOR BLVD. & FIGUEROA ST.) . Services: public payphones, call for taxi service.
Colleges/universities with over 2000 students nearest to Carpinteria Valley:
- Santa Barbara City College (about 10 miles; Santa Barbara, CA; Full-time enrollment: 12,568)
- University of California-Santa Barbara (about 19 miles; Santa Barbara, CA; FT enrollment: 22,806)
- Ventura College (about 20 miles; Ventura, CA; FT enrollment: 8,460)
- Oxnard College (about 28 miles; Oxnard, CA; FT enrollment: 3,879)
- California State University-Channel Islands (about 33 miles; Camarillo, CA; FT enrollment: 4,163)
- California Lutheran University (about 40 miles; Thousand Oaks, CA; FT enrollment: 4,103)
- Moorpark College (about 41 miles; Moorpark, CA; FT enrollment: 9,338)
Points of interest:
Notable locations in Carpinteria Valley: Santa Barbara Polo Grounds (A), Wave (B), Alder Creek Campground (C), Alder Rustic Campsite (D), Rincon Station (E), Veterans Memorial Hall (F), Seaside Theatre (G), Carpinteria Valley Museum of History (H), Carpinteria Union School District Office (I), Carpinteria Girls Club (J), Carpinteria Civic Center (K), Carpinteria City Hall (L), Carpinteria Chamber of Commerce (M), Carpinteria Branch Santa Barbara Public Library (N), American Medical Response Station 1 (O), Carpinteria - Summerland Fire Protection District Station 2 (P), Carpinteria - Summerland Fire Protection District Station 1 (Q). Display/hide their locations on the map
Shopping Center: Casitas Plaza Shopping Center (1). Display/hide its location on the map
Churches in Carpinteria Valley include: Summerland Presbyterian Church (A), Carpinteria Community Church (B), Carpinteria Valley Baptist Church (C), Church of Christ (D), Church of the Nazarene (E), Faith Lutheran Church (F), First Baptist Church of Carpinteria (G), First Church of Christ Scientist (H), Saint Joseph Catholic Church (I). Display/hide their locations on the map
Cemetery: Carpinteria Cemetery (1). Display/hide its location on the map
Reservoirs and swamps: Carpinteria Reservoir (A), Jameson Lake (B), Buell Reservoir (C), Ortega Reservoir (D), El Estero (E). Display/hide their locations on the map
Streams, rivers, and creeks: Gobernador Creek (A), Eldorado Creek (B), Morse Creek (C), Catharina Creek (D), Casitas Creek (E), Sutton Creek (F), Garrapata Creek (G), Franklin Creek (H), Toro Canyon Creek (I). Display/hide their locations on the map
Parks in Carpinteria Valley include: Carpinteria Community Swimming Pool (1), El Carro Park (2), Franklin Creek Park (3), Heath Ranch Park (4), Lions Club Park (5), Memorial Park (6), Monte Vista Park (7), Toro Canyon County Park (8), Fleischmann Field (9). Display/hide their locations on the map
| This place: | 2.7 people |
| California: | 2.9 people |
| This place: | 44.3% |
| Whole state: | 69.4% |
| This place: | 5.0% |
| Whole state: | 5.9% |
Likely homosexual households (counted as self-reported same-sex unmarried-partner households)
- Lesbian couples: 0.4% of all households
- Gay men: 0.4% of all households
| This place: | 9.4% |
| Whole state: | 14.2% |
| This place: | 4.9% |
| Whole state: | 6.3% |
People in group quarters in Carpinteria Valley in 2000:
- 81 people in homes or halfway houses for drug/alcohol abuse
- 23 people in other noninstitutional group quarters
- 10 people in homes for the physically handicapped
- 6 people in schools, hospitals, or wards for the intellectually disabled
- 6 people in homes for the mentally ill
- 3 people in religious group quarters
For population 15 years and over in Carpinteria Valley:
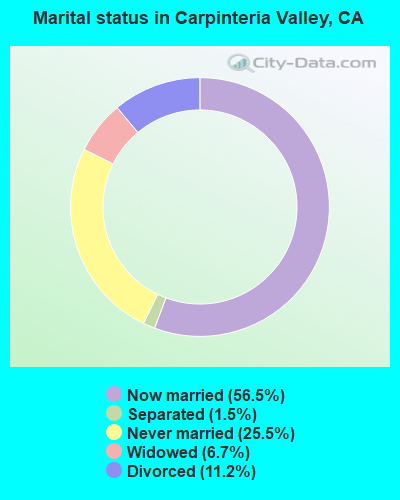
- Never married: 25.5%
- Now married: 56.5%
- Separated: 1.5%
- Widowed: 6.7%
- Divorced: 11.2%
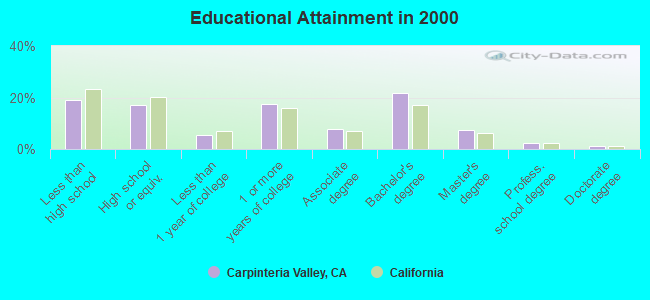
For population 25 years and over in Carpinteria Valley:
- High school or higher: 81.1%
- Bachelor's degree or higher: 33.1%
- Graduate or professional degree: 11.2%
- Unemployed: 2.8%
- Mean travel time to work (commute): 20.3 minutes
| Here: | 14.9 |
| California average: | 16.1 |
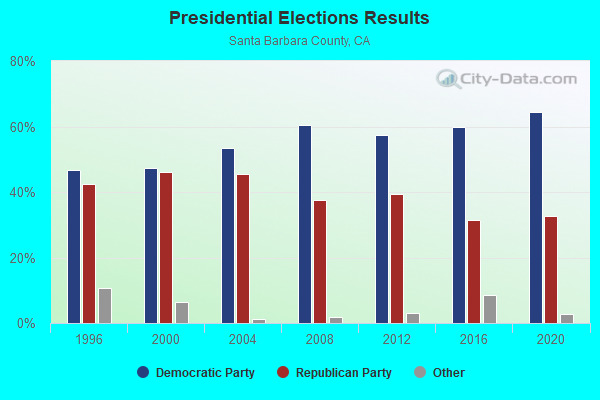
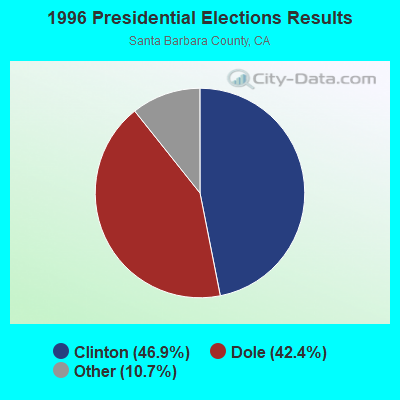
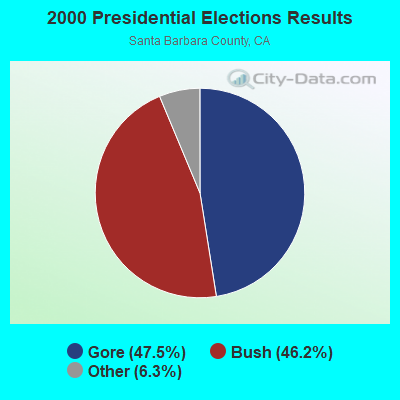
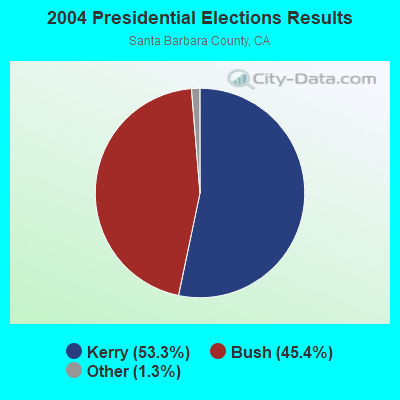
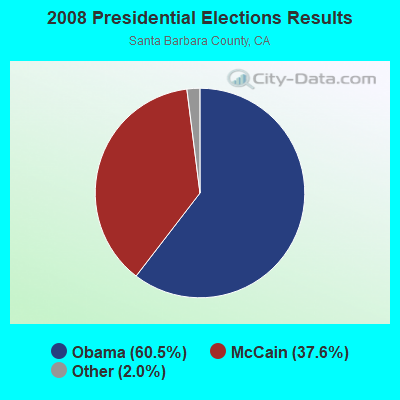
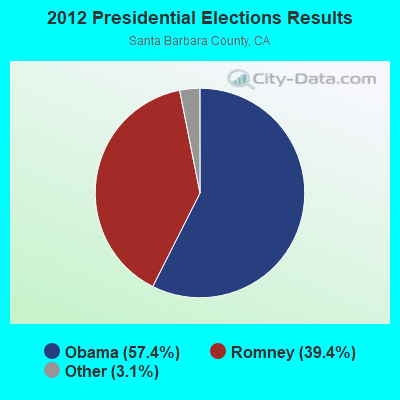
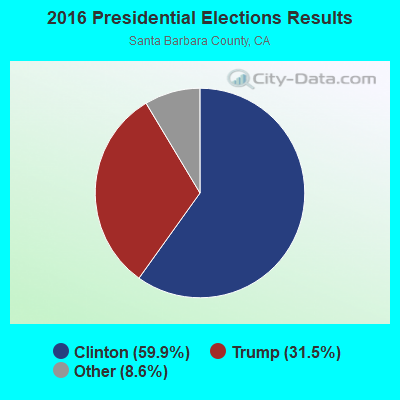
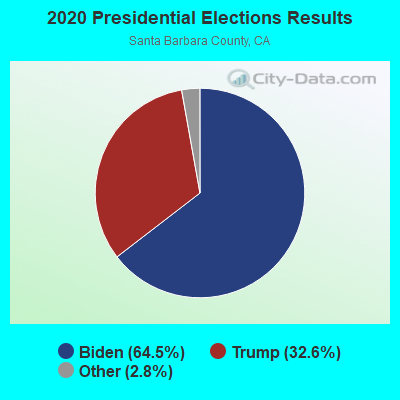
Graphs represent county-level data. Detailed 2008 Election Results
Religion statistics for Carpinteria Valley, CA (based on Santa Barbara County data)
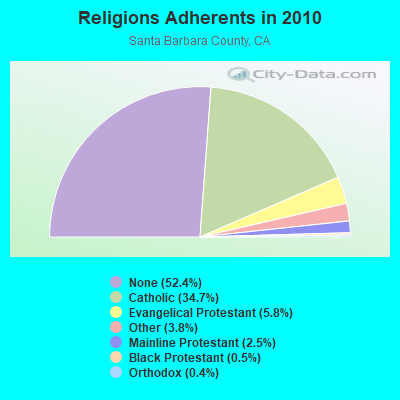
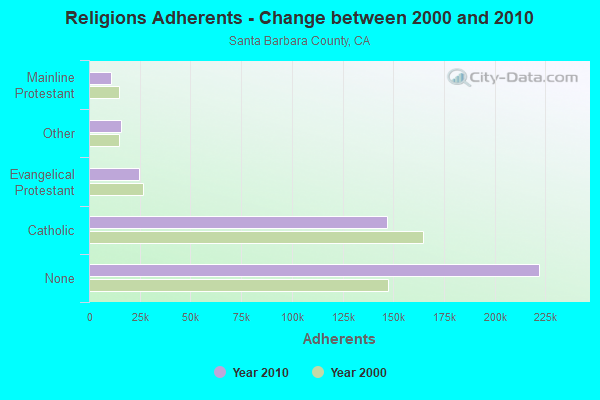
| Religion | Adherents | Congregations |
|---|---|---|
| Catholic | 146,940 | 17 |
| Evangelical Protestant | 24,775 | 161 |
| Other | 15,951 | 58 |
| Mainline Protestant | 10,610 | 43 |
| Black Protestant | 1,979 | 13 |
| Orthodox | 1,536 | 7 |
| None | 222,104 | - |
Food Environment Statistics:
| Here: | 2.61 / 10,000 pop. |
| California: | 2.14 / 10,000 pop. |
| Santa Barbara County: | 0.05 / 10,000 pop. |
| California: | 0.04 / 10,000 pop. |
| Santa Barbara County: | 0.75 / 10,000 pop. |
| California: | 0.62 / 10,000 pop. |
| Santa Barbara County: | 1.84 / 10,000 pop. |
| State: | 1.49 / 10,000 pop. |
| Santa Barbara County: | 9.65 / 10,000 pop. |
| State: | 7.42 / 10,000 pop. |
| Santa Barbara County: | 7.3% |
| California: | 7.3% |
| Santa Barbara County: | 22.2% |
| California: | 21.3% |
| Santa Barbara County: | 18.3% |
| California: | 17.9% |
4.93% of this county's 2021 resident taxpayers lived in other counties in 2020 ($102,533 average adjusted gross income)
| Here: | 4.93% |
| California average: | 5.19% |
0.04% of residents moved from foreign countries ($459 average AGI)
Santa Barbara County: 0.04% California average: 0.03%
Top counties from which taxpayers relocated into this county between 2020 and 2021:
| from Los Angeles County, CA | |
| from San Luis Obispo County, CA | |
| from Ventura County, CA |
6.09% of this county's 2020 resident taxpayers moved to other counties in 2021 ($82,188 average adjusted gross income)
| Here: | 6.09% |
| California average: | 6.14% |
0.03% of residents moved to foreign countries ($259 average AGI)
Santa Barbara County: 0.03% California average: 0.02%
Top counties to which taxpayers relocated from this county between 2020 and 2021:
| to Los Angeles County, CA | |
| to San Luis Obispo County, CA | |
| to Ventura County, CA |
Strongest AM radio stations in Carpinteria Valley:
- KTMS (990 AM; 5 kW; SANTA BARBARA, CA; Owner: CITICASTERS LICENSES, L.P.)
- KGDP (660 AM; 50 kW; ORCUTT, CA; Owner: RADIO REPRESENTATIVES, INC.)
- KACD (850 AM; 25 kW; THOUSAND OAKS, CA; Owner: CITICASTERS LICENSES, L.P.)
- KSPN (710 AM; 50 kW; LOS ANGELES, CA; Owner: KABC-AM RADIO, INC.)
- KLAC (570 AM; 50 kW; LOS ANGELES, CA; Owner: AMFM RADIO LICENSES, L.L.C.)
- KIRN (670 AM; 35 kW; SIMI VALLEY, CA; Owner: LOTUS OXNARD CORP.)
- KOXR (910 AM; 5 kW; OXNARD, CA; Owner: LAZER BROADCASTING CORPORATION)
- KBKO (1490 AM; 1 kW; SANTA BARBARA, CA; Owner: CITICASTERS LICENSES, L.P.)
- KVTA (1520 AM; 10 kW; PORT HUENEME, CA; Owner: GOLD COAST BROADCASTING LLC)
- KFI (640 AM; 50 kW; LOS ANGELES, CA; Owner: CAPSTAR TX LIMITED PARTNERSHIP)
- KFWB (980 AM; 50 kW; LOS ANGELES, CA; Owner: INFINITY BROADCASTING OPERATIONS, INC.)
- KNX (1070 AM; 50 kW; LOS ANGELES, CA; Owner: INFINITY BROADCASTING OPERATIONS, INC.)
- KEYT (1250 AM; 2 kW; SANTA BARBARA, CA; Owner: SMITH BROADCASTING OF SANTA BARBARA LIMITED PARTNERSHIP)
Strongest FM radio stations in Carpinteria Valley:
- K254AH (98.7 FM; ISLA VISTA, CA; Owner: PACIFICA FOUNDATION, INC.)
- K210CH (89.9 FM; OAK VIEW, CA; Owner: LIFE ON THE WAY COMMUNICATIONS, INC.)
- KTYD (99.9 FM; SANTA BARBARA, CA; Owner: CITICASTERS LICENSES, L.P.)
- KCAQ (104.7 FM; OXNARD, CA; Owner: GOLD COAST BROADCASTING LLC)
- KOCP (95.9 FM; CAMARILLO, CA; Owner: GOLD COAST BROADCASTING LLC)
- KFYV (105.5 FM; OJAI, CA; Owner: GOLD COAST BROADCASTING LLC)
- K271AC (102.1 FM; OJAI, CA; Owner: SANTA MONICA COMMUNITY COLLEGE DIST.)
- KSBX (89.5 FM; SANTA BARBARA, CA; Owner: KCBX, INC.)
- KJEE (92.9 FM; MONTECITO, CA; Owner: MONTECITO, FM, INC)
- K218CP (91.5 FM; SANTA BARBARA, CA; Owner: CALVARY CHAPEL OF TWIN FALLS, INC.)
- KHAY (100.7 FM; VENTURA, CA; Owner: CUMULUS LICENSING CORP.)
- KDB (93.7 FM; SANTA BARBARA, CA; Owner: PACIFIC BROADCASTING COMPANY)
- KFAC (88.7 FM; SANTA BARBARA, CA; Owner: UNIVERSITY OF SOUTHERN CALIFORNIA)
- KKSB (106.3 FM; GOLETA, CA; Owner: CUMULUS LICENSING CORP.)
- KSBL (101.7 FM; CARPINTERIA, CA; Owner: CITICASTERS LICENSES, L.P.)
- KRAZ (105.9 FM; SANTA YNEZ, CA; Owner: KNIGHT BROADCASTING, INC.)
- KRUZ (103.3 FM; SANTA BARBARA, CA; Owner: CUMULUS LICENSING CORP.)
- KSPE-FM (94.5 FM; ELLWOOD, CA; Owner: CITICASTERS LICENSES, L.P.)
- KMGQ (97.5 FM; SANTA BARBARA, CA; Owner: CUMULUS LICENSING CORP.)
- KCSB-FM (91.9 FM; SANTA BARBARA, CA; Owner: UNIVERSITY OF CALIFORNIA)
TV broadcast stations around Carpinteria Valley:
- KJLA (Channel 57; VENTURA, CA; Owner: KJLA, LLC)
- KTRO-LP (Channel 50; LANCASTER, CA; Owner: ROBERT D. ADELMAN)
- KVMM-CA (Channel 41; SANTA BARBARA, CA; Owner: CABALLERO TELEVISION TEXAS, L.L.C.)
- KSBT-LP (Channel 32; SANTA BARBARA, CA; Owner: ARNOLD N. APPLEBAUM)
- K49EK (Channel 49; SANTA BARBARA, CA; Owner: COASTLINE COMMUNICATIONS, INC.)
- K46GC (Channel 46; SANTA BARBARA, CA; Owner: PENNY DRUCKER)
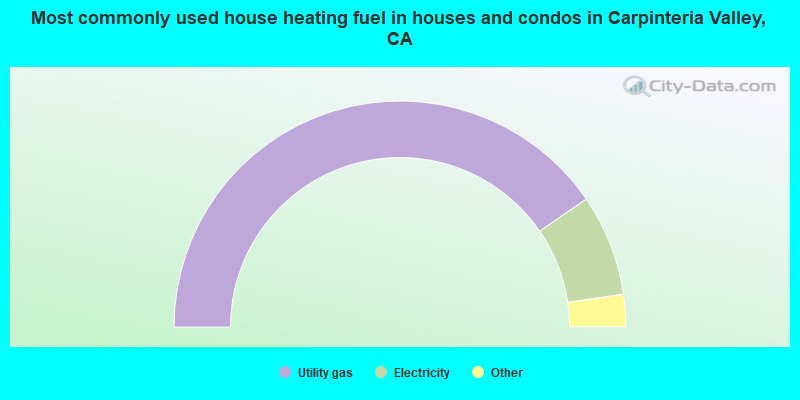
- 80.8%Utility gas
- 14.5%Electricity
- 2.9%Bottled, tank, or LP gas
- 1.4%Wood
- 0.2%Fuel oil, kerosene, etc.
- 0.2%No fuel used
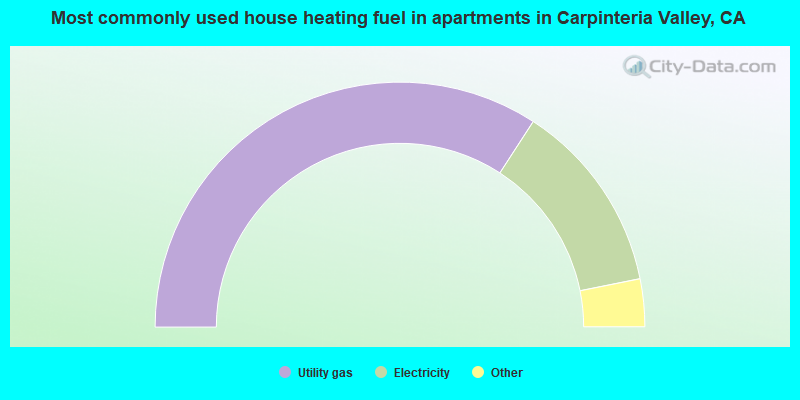
- 68.4%Utility gas
- 25.4%Electricity
- 3.1%Bottled, tank, or LP gas
- 2.8%No fuel used
- 0.4%Solar energy
Carpinteria Valley compared to California state average:
- Unemployed percentage significantly below state average.
- Black race population percentage significantly below state average.
- Median age above state average.
- Foreign-born population percentage significantly below state average.
- Renting percentage significantly below state average.
- Length of stay since moving in significantly above state average.
- Number of rooms per house significantly below state average.
- House age significantly below state average.
- Institutionalized population percentage significantly above state average.
Carpinteria Valley on our top lists:
- #2 on the list of "Top 101 cities with largest percentage of males in industries: miscellaneous nondurable goods merchant wholesalers (population 5,000+)"
- #14 on the list of "Top 101 cities with largest percentage of females in industries: miscellaneous nondurable goods merchant wholesalers (population 5,000+)"
- #18 on the list of "Top 101 cities with largest percentage of males in industries: retail florists (population 5,000+)"
- #22 on the list of "Top 101 cities with largest percentage of females in industries: farm supplies merchant wholesalers (population 5,000+)"
- #32 on the list of "Top 101 cities with largest percentage of females in industries: miscellaneous manufacturing (population 5,000+)"
- #33 on the list of "Top 101 cities with largest percentage of males in occupations: art and design workers (population 5,000+)"
- #42 on the list of "Top 101 cities with largest percentage of males in occupations: entertainers and performers, sports, and related workers (population 5,000+)"
- #57 on the list of "Top 101 cities with largest percentage of males in industries: personal and laundry services (population 5,000+)"
- #64 on the list of "Top 101 cities with largest percentage of males in occupations: painters and paperhangers (population 5,000+)"
- #68 on the list of "Top 101 cities with largest percentage of males in occupations: food and beverage serving workers except waiters/waitresses (population 5,000+)"
- #77 on the list of "Top 101 cities with largest percentage of females in occupations: accountants and auditors (population 5,000+)"
- #92 on the list of "Top 101 cities with largest percentage of males in occupations: agricultural workers including supervisors (population 5,000+)"
- #94 on the list of "Top 101 cities with largest percentage of females in industries: data processing, libraries, and other information services (population 5,000+)"
- #17 on the list of "Top 101 counties with the lowest Sulfur Oxides Annual air pollution readings in 2012 (µg/m3)"
- #32 on the list of "Top 101 counties with the highest Nitrogen Dioxide air pollution readings in 2012 (ppm)"
- #38 on the list of "Top 101 counties with the lowest number of infant deaths per 1000 residents 2007-2013 (pop. 50,000+)"
- #78 on the list of "Top 101 counties with the highest carbon monoxide air pollution readings in 2012 (ppm)"
- #81 on the list of "Top 101 counties with the largest decrease in the number of infant deaths per 1000 residents 2000-2006 to 2007-2013 (pop. 50,000+)"