Crowley, Louisiana
Submit your own pictures of this city and show them to the world
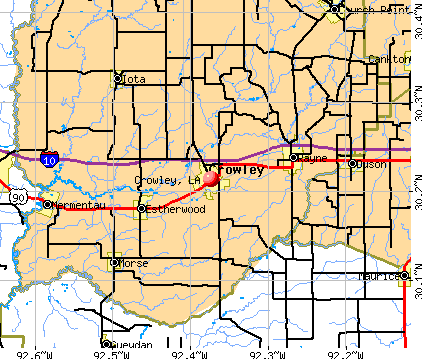
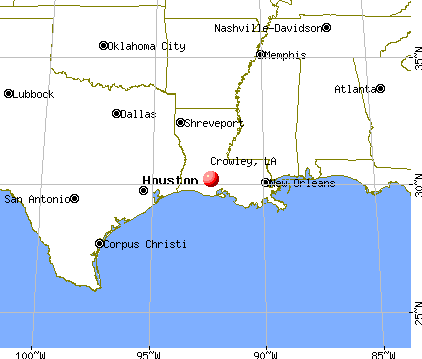
- OSM Map
- General Map
- Google Map
- MSN Map
Population change since 2000: -20.0%
 |
| Males: 5,785 | |
| Females: 5,588 |
| Median resident age: | 40.9 years |
| Louisiana median age: | 38.2 years |
Zip codes: 70526.
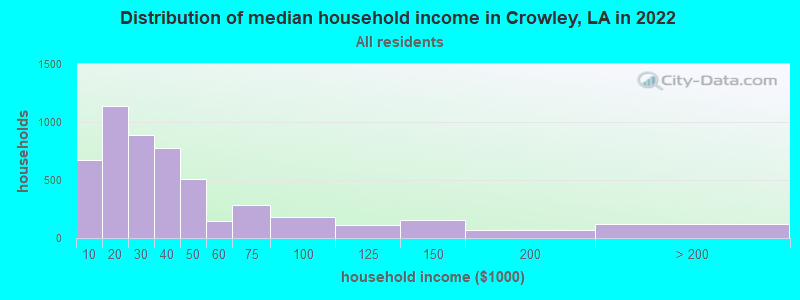
| Crowley: | $27,613 |
| LA: | $55,416 |
Estimated per capita income in 2022: $21,791 (it was $13,734 in 2000)
Crowley city income, earnings, and wages data
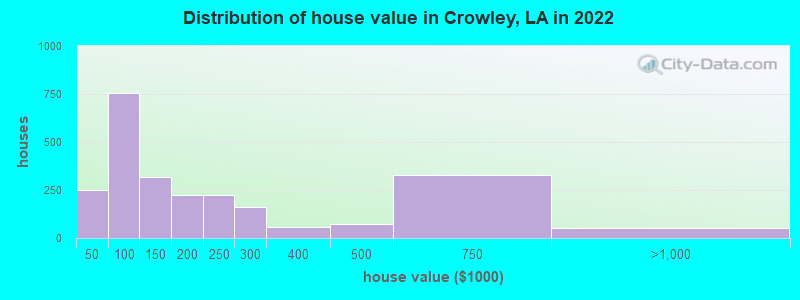
Estimated median house or condo value in 2022: $138,306 (it was $58,000 in 2000)
| Crowley: | $138,306 |
| LA: | $209,200 |
Mean prices in 2022: all housing units: $196,635; detached houses: $203,331; mobile homes: $45,030
Median gross rent in 2022: $604.
(37.4% for White Non-Hispanic residents, 42.7% for Black residents, 36.8% for Hispanic or Latino residents, 79.1% for two or more races residents)
Detailed information about poverty and poor residents in Crowley, LA
Compare current foreclosures in Crowley, LA:
| Photo | Address | Area | Beds / Baths | Price | Details |
|---|---|---|---|---|---|

|
#1
South Avenue E
Crowley, LA 70526
|
- sq. feet
|
2 baths 5 beds |
$46,900
|
show details |

|
#2
N Cherokee Dr
Crowley, LA 70526
|
2,500 sq. feet
|
3 baths 3 beds |
show details | |

|
#3
S Avenue F
Crowley, LA 70526
|
2,124 sq. feet
|
2 baths 3 beds |
show details | |

|
#4
Hutchinson Aven
Crowley, LA 70526
|
2,764 sq. feet
|
2 baths 4 beds |
show details | |

|
#5
Spann Ave
Crowley, LA 70526
|
- sq. feet
|
- baths - beds |
$5,620
|
show details |

|
#6
S Ave O
Crowley, LA 70526
|
- sq. feet
|
- baths - beds |
$29,900
|
show details |

|
#7
Grace Pete St
Crowley, LA 70526
|
- sq. feet
|
- baths - beds |
show details | |

|
#8
Barbara Dr
Crowley, LA 70526
|
- sq. feet
|
- baths - beds |
show details | |

|
#9
Main Field
Crowley, LA 70526
|
- sq. feet
|
- baths - beds |
show details | |

|
#10
W 14th St
Crowley, LA 70526
|
- sq. feet
|
- baths - beds |
show details |
| Photo | Address | Area | Beds / Baths | Price | Details |
|---|---|---|---|---|---|

|
#11
Sweeney St
Crowley, LA 70526
|
- sq. feet
|
- baths - beds |
show details | |

|
#12
Tunny Vincent Ln # 4
Crowley, LA 70526
|
- sq. feet
|
- baths - beds |
show details | |

|
#13
E Elm St
Crowley, LA 70526
|
- sq. feet
|
- baths - beds |
show details | |

|
#14
W Andrus Dr
Crowley, LA 70526
|
- sq. feet
|
- baths - beds |
show details | |

|
#15
Jasmine Rd
Crowley, LA 70526
|
- sq. feet
|
- baths - beds |
show details | |

|
#16
Leslie Amos St
Crowley, LA 70526
|
- sq. feet
|
- baths - beds |
show details | |

|
#17
Hockaday St
Crowley, LA 70526
|
- sq. feet
|
- baths - beds |
show details | |

|
#18
W Northern Ave
Crowley, LA 70526
|
- sq. feet
|
- baths - beds |
show details | |

|
#19
Bossier Rd
Crowley, LA 70526
|
- sq. feet
|
- baths - beds |
show details | |

|
#20
Lisa Dr
Crowley, LA 70526
|
- sq. feet
|
- baths - beds |
show details |
| Photo | Address | Area | Beds / Baths | Price | Details |
|---|---|---|---|---|---|

|
#21
Alyson Dr
Crowley, LA 70526
|
- sq. feet
|
- baths - beds |
show details | |

|
#22
Katherine Dr
Crowley, LA 70526
|
- sq. feet
|
- baths - beds |
show details | |

|
#23
W 15th St
Crowley, LA 70526
|
- sq. feet
|
- baths - beds |
show details | |

|
#24
Athens Ln
Crowley, LA 70526
|
- sq. feet
|
- baths - beds |
show details | |

|
#25
E 7th St
Crowley, LA 70526
|
- sq. feet
|
- baths - beds |
show details | |

|
#26
N Avenue G
Crowley, LA 70526
|
- sq. feet
|
- baths - beds |
show details | |

|
#27
Stage Coach Rd
Crowley, LA 70526
|
- sq. feet
|
- baths - beds |
show details | |

|
#28
W Park St
Crowley, LA 70526
|
- sq. feet
|
- baths - beds |
show details | |

|
#29
N Avenue A
Crowley, LA 70526
|
- sq. feet
|
- baths - beds |
show details | |

|
#30
W 3rd St
Crowley, LA 70526
|
- sq. feet
|
- baths - beds |
show details |
| Photo | Address | Area | Beds / Baths | Price | Details |
|---|---|---|---|---|---|

|
#31
Faulk Rd
Crowley, LA 70526
|
- sq. feet
|
- baths - beds |
show details | |

|
#32
James St
Crowley, LA 70526
|
- sq. feet
|
- baths - beds |
show details | |

|
#33
E 17th St
Crowley, LA 70526
|
- sq. feet
|
- baths - beds |
show details | |

|
#34
Mccain Rd
Crowley, LA 70526
|
- sq. feet
|
- baths - beds |
show details | |

|
#35
Finola Dr
Crowley, LA 70526
|
- sq. feet
|
- baths - beds |
show details | |

|
#36
S Avenue O
Crowley, LA 70526
|
- sq. feet
|
- baths - beds |
show details | |

|
#37
E 8th St
Crowley, LA 70526
|
- sq. feet
|
- baths - beds |
show details | |

|
#38
Upton Ln
Crowley, LA 70526
|
- sq. feet
|
- baths - beds |
show details | |

|
Check over 1 million property listings on Foreclosure.com!
|
browse all offers | |||


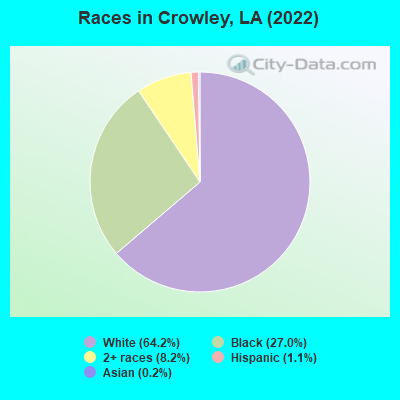
- 7,44964.2%White alone
- 3,13227.0%Black alone
- 9508.2%Two or more races
- 1291.1%Hispanic
- 260.2%Asian alone
Races in Crowley detailed stats: ancestries, foreign born residents, place of birth
According to our research of Louisiana and other state lists, there were 55 registered sex offenders living in Crowley, Louisiana as of May 04, 2024.
The ratio of all residents to sex offenders in Crowley is 241 to 1.
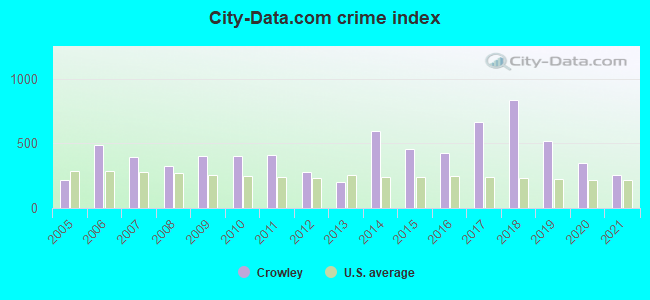
Type |
2009 |
2010 |
2011 |
2012 |
2013 |
2014 |
2015 |
2016 |
2017 |
2018 |
2019 |
2020 |
2021 |
|---|---|---|---|---|---|---|---|---|---|---|---|---|---|
| Murders (per 100,000) | 2 (14.4) | 1 (7.5) | 3 (22.4) | 4 (29.9) | 0 (0.0) | 15 (113.6) | 5 (38.0) | 3 (22.9) | 3 (23.0) | 5 (39.1) | 1 (7.9) | 3 (24.0) | 3 (24.1) |
| Rapes (per 100,000) | 5 (36.1) | 4 (30.2) | 1 (7.5) | 4 (29.9) | 0 (0.0) | 0 (0.0) | 0 (0.0) | 1 (7.6) | 4 (30.7) | 9 (70.4) | 8 (63.4) | 3 (24.0) | 0 (0.0) |
| Robberies (per 100,000) | 24 (173.1) | 15 (113.1) | 11 (82.2) | 16 (119.5) | 8 (60.8) | 15 (113.6) | 24 (182.2) | 19 (144.8) | 12 (92.1) | 15 (117.4) | 14 (110.9) | 6 (47.9) | 6 (48.2) |
| Assaults (per 100,000) | 57 (411.1) | 92 (693.6) | 91 (679.8) | 33 (246.5) | 47 (357.0) | 75 (567.9) | 104 (789.7) | 84 (640.3) | 194 (1,489) | 199 (1,557) | 135 (1,070) | 104 (831.0) | 91 (731.0) |
| Burglaries (per 100,000) | 173 (1,248) | 129 (972.5) | 170 (1,270) | 92 (687.2) | 86 (653.2) | 154 (1,166) | 116 (880.9) | 178 (1,357) | 227 (1,743) | 234 (1,831) | 132 (1,046) | 90 (719.1) | 15 (120.5) |
| Thefts (per 100,000) | 395 (2,849) | 382 (2,880) | 330 (2,465) | 156 (1,165) | 222 (1,686) | 286 (2,166) | 178 (1,352) | 162 (1,235) | 421 (3,232) | 640 (5,008) | 372 (2,947) | 142 (1,135) | 79 (634.6) |
| Auto thefts (per 100,000) | 15 (108.2) | 15 (113.1) | 20 (149.4) | 31 (231.6) | 2 (15.2) | 87 (658.8) | 86 (653.0) | 91 (693.7) | 28 (215.0) | 42 (328.7) | 24 (190.2) | 11 (87.9) | 16 (128.5) |
| Arson (per 100,000) | 0 (0.0) | 0 (0.0) | 0 (0.0) | 0 (0.0) | 0 (0.0) | 0 (0.0) | 0 (0.0) | 0 (0.0) | 0 (0.0) | 1 (7.8) | 0 (0.0) | 0 (0.0) | 0 (0.0) |
| City-Data.com crime index | 401.8 | 404.1 | 410.9 | 282.0 | 204.0 | 595.8 | 456.5 | 423.2 | 664.6 | 836.1 | 520.1 | 350.5 | 253.0 |
The City-Data.com crime index weighs serious crimes and violent crimes more heavily. Higher means more crime, U.S. average is 246.1. It adjusts for the number of visitors and daily workers commuting into cities.
Crime rate in Crowley detailed stats: murders, rapes, robberies, assaults, burglaries, thefts, arson
Full-time law enforcement employees in 2021, including police officers: 32 (32 officers - 26 male; 6 female).
| Officers per 1,000 residents here: | 2.57 |
| Louisiana average: | 3.44 |
 Recent articles from our blog. Our writers, many of them Ph.D. graduates or candidates, create easy-to-read articles on a wide variety of topics.

 | New Iberia (19 replies) |
| Rock Music Scene (12 replies) |
| Rampant credit card skimming in Baton Rouge gas stations. (11 replies) |
| Opinions on Alexandria and Lafayette. (121 replies) |
| Jim Crowley back in the mayor race? (1 reply) |
| Do you know anyone who speaks fluent Cajun and/or Louisianan-French? Or is it pretty much a dead language now? (68 replies) |
Latest news from Crowley, LA collected exclusively by city-data.com from local newspapers, TV, and radio stations
Ancestries: American (12.6%), French (12.5%), Cajun (10.7%), French Canadian (5.6%), Italian (4.5%), Irish (3.2%).
Current Local Time: CST time zone
Incorporated in 1887
Elevation: 21 feet
Land area: 4.91 square miles.
Population density: 2,315 people per square mile (low).
61 residents are foreign born
| This city: | 0.5% |
| Louisiana: | 4.2% |
Median real estate property taxes paid for housing units with mortgages in 2022: $532 (0.4%)
Median real estate property taxes paid for housing units with no mortgage in 2022: $351 (0.3%)
Nearest city with pop. 50,000+: Lafayette, LA  (20.6 miles , pop. 110,257).
Nearest city with pop. 200,000+: Baton Rouge, LA (75.6 miles , pop. 227,818).
Nearest city with pop. 1,000,000+: Houston, TX (183.0 miles , pop. 1,953,631).
Nearest cities:
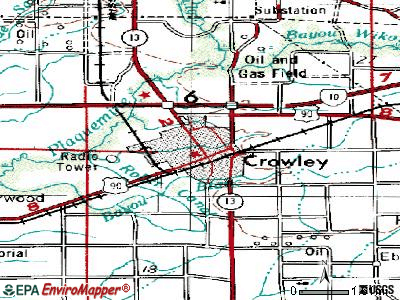
), ), ), ), ), ), Latitude: 30.21 N, Longitude: 92.37 W
Daytime population change due to commuting: +2,189 (+18.9%)
Workers who live and work in this city: 1,565 (46.7%)
Area code: 337
Crowley, Louisiana accommodation & food services, waste management - Economy and Business Data
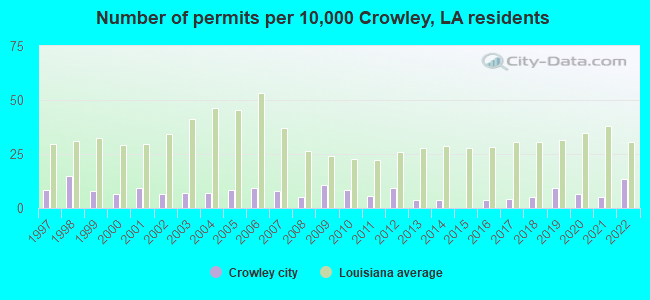
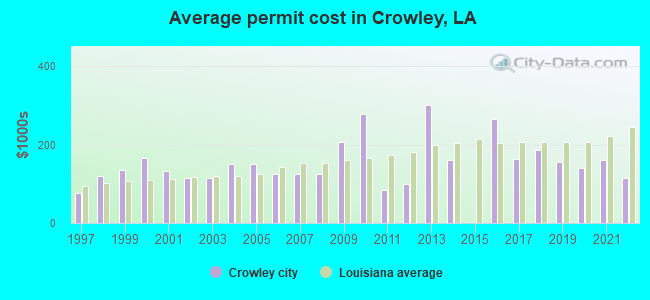
Single-family new house construction building permits:
- 2022: 19 buildings, average cost: $114,700
- 2021: 7 buildings, average cost: $160,000
- 2020: 9 buildings, average cost: $140,000
- 2019: 13 buildings, average cost: $155,000
- 2018: 7 buildings, average cost: $185,700
- 2017: 6 buildings, average cost: $162,500
- 2016: 5 buildings, average cost: $266,400
- 2014: 5 buildings, average cost: $160,000
- 2013: 5 buildings, average cost: $301,200
- 2012: 13 buildings, average cost: $98,800
- 2011: 8 buildings, average cost: $83,300
- 2010: 12 buildings, average cost: $277,400
- 2009: 15 buildings, average cost: $207,200
- 2008: 7 buildings, average cost: $124,400
- 2007: 11 buildings, average cost: $124,400
- 2006: 13 buildings, average cost: $124,400
- 2005: 12 buildings, average cost: $150,900
- 2004: 10 buildings, average cost: $150,900
- 2003: 10 buildings, average cost: $116,200
- 2002: 9 buildings, average cost: $116,200
- 2001: 13 buildings, average cost: $133,300
- 2000: 9 buildings, average cost: $167,300
- 1999: 11 buildings, average cost: $136,300
- 1998: 21 buildings, average cost: $118,500
- 1997: 12 buildings, average cost: $75,900
| Here: | 3.9% |
| Louisiana: | 3.8% |
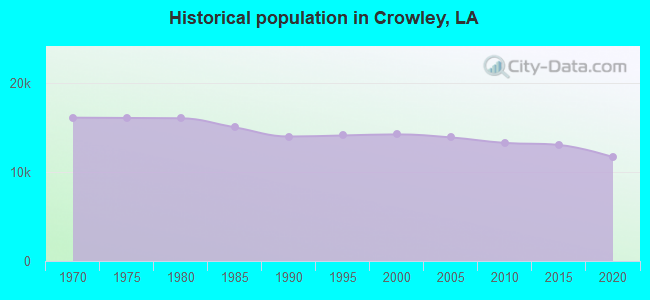
Population change in the 1990s: +31 (+0.2%).
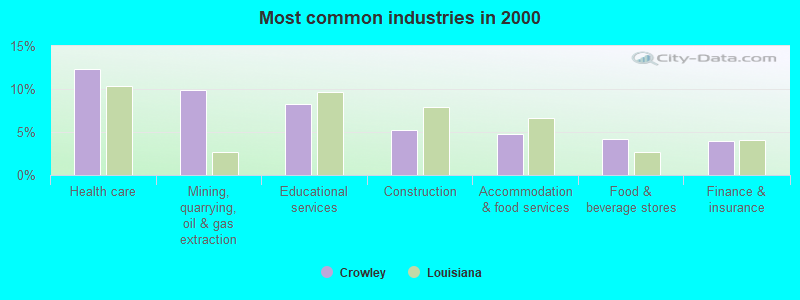
- Health care (12.3%)
- Mining, quarrying, oil & gas extraction (9.9%)
- Educational services (8.3%)
- Construction (5.2%)
- Accommodation & food services (4.8%)
- Food & beverage stores (4.1%)
- Finance & insurance (4.0%)
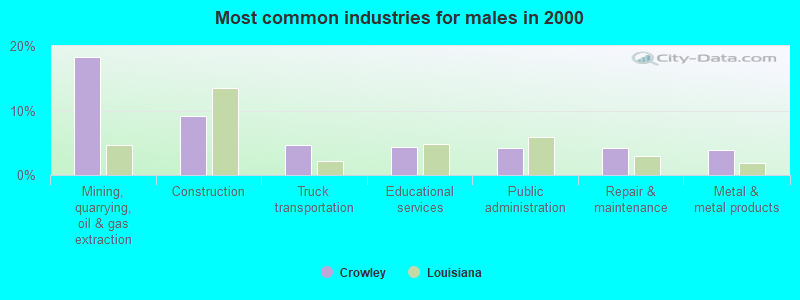
- Mining, quarrying, oil & gas extraction (18.3%)
- Construction (9.1%)
- Truck transportation (4.7%)
- Educational services (4.3%)
- Public administration (4.3%)
- Repair & maintenance (4.3%)
- Metal & metal products (3.8%)
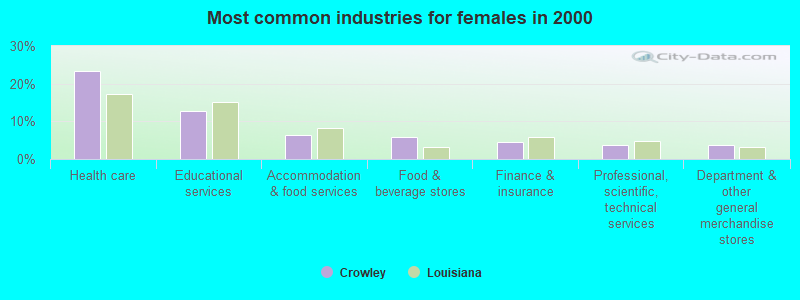
- Health care (23.4%)
- Educational services (12.7%)
- Accommodation & food services (6.3%)
- Food & beverage stores (5.9%)
- Finance & insurance (4.5%)
- Professional, scientific, technical services (3.8%)
- Department & other general merchandise stores (3.7%)
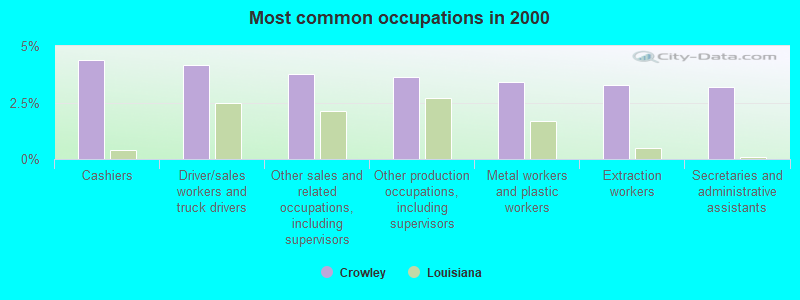
- Cashiers (4.4%)
- Driver/sales workers and truck drivers (4.2%)
- Other sales and related occupations, including supervisors (3.8%)
- Other production occupations, including supervisors (3.6%)
- Metal workers and plastic workers (3.4%)
- Extraction workers (3.3%)
- Secretaries and administrative assistants (3.2%)
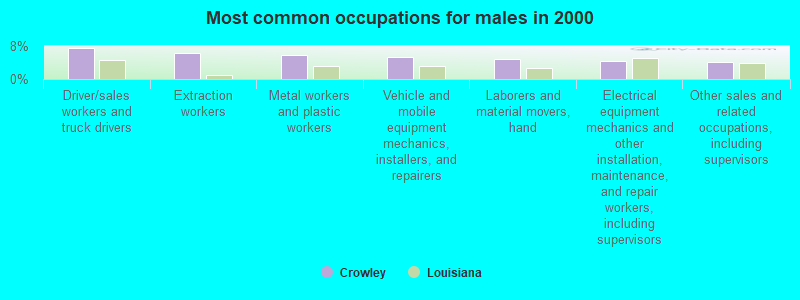
- Driver/sales workers and truck drivers (7.5%)
- Extraction workers (6.3%)
- Metal workers and plastic workers (5.7%)
- Vehicle and mobile equipment mechanics, installers, and repairers (5.4%)
- Laborers and material movers, hand (4.7%)
- Electrical equipment mechanics and other installation, maintenance, and repair workers, including supervisors (4.5%)
- Other sales and related occupations, including supervisors (4.2%)
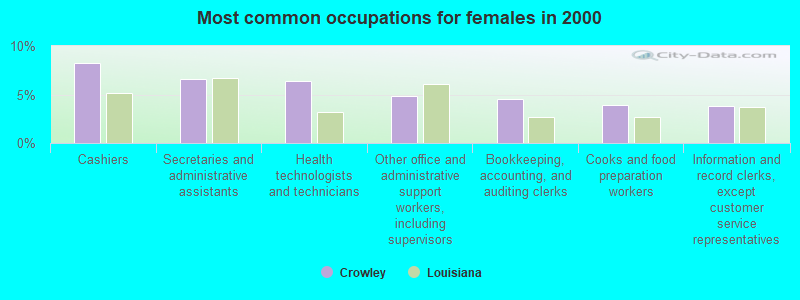
- Cashiers (8.3%)
- Secretaries and administrative assistants (6.6%)
- Health technologists and technicians (6.4%)
- Other office and administrative support workers, including supervisors (4.8%)
- Bookkeeping, accounting, and auditing clerks (4.6%)
- Cooks and food preparation workers (3.9%)
- Information and record clerks, except customer service representatives (3.8%)
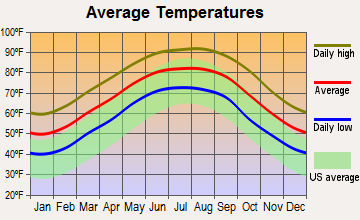
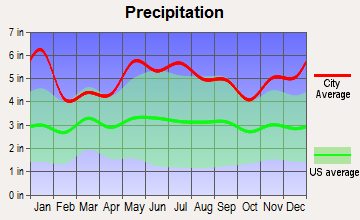
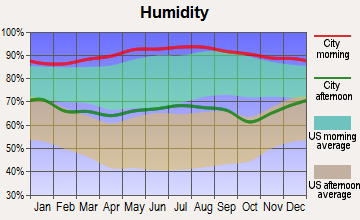
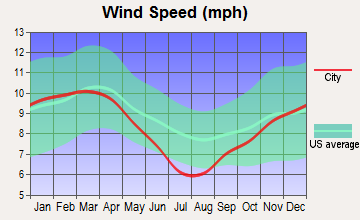
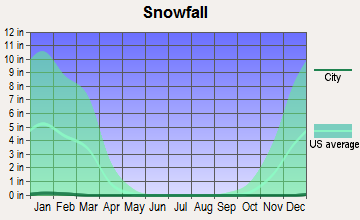
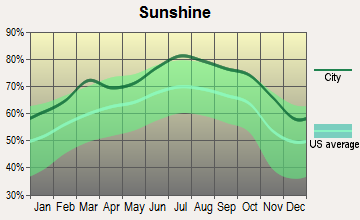
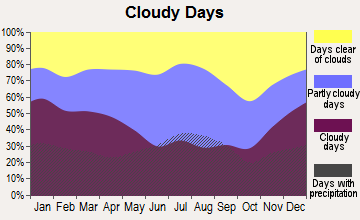
Average climate in Crowley, Louisiana
Based on data reported by over 4,000 weather stations
|
|


Tornado activity:
Crowley-area historical tornado activity is near Louisiana state average. It is 56% greater than the overall U.S. average.
On 9/10/1961, a category F3 (max. wind speeds 158-206 mph) tornado 10.2 miles away from the Crowley city center killed one person and injured 55 people and caused between $500,000 and $5,000,000 in damages.
On 10/29/1974, a category F3 tornado 10.8 miles away from the city center killed 2 people and injured 52 people and caused between $5,000,000 and $50,000,000 in damages.
Earthquake activity:
Crowley-area historical earthquake activity is significantly above Louisiana state average. It is 43% smaller than the overall U.S. average.On 5/17/2012 at 08:12:00, a magnitude 4.8 (4.8 MW, Depth: 3.1 mi, Class: Light, Intensity: IV - V) earthquake occurred 167.3 miles away from Crowley center
On 9/10/2006 at 14:56:08, a magnitude 5.9 (5.9 MB, 5.5 MS, 5.8 MW, Class: Moderate, Intensity: VI - VII) earthquake occurred 444.5 miles away from the city center
On 9/2/2013 at 23:51:15, a magnitude 4.3 (4.3 MW, Depth: 2.9 mi) earthquake occurred 169.0 miles away from Crowley center
On 9/2/2013 at 21:52:38, a magnitude 4.2 (4.2 MW, Depth: 3.0 mi) earthquake occurred 175.9 miles away from Crowley center
On 1/25/2013 at 07:01:19, a magnitude 4.1 (4.1 MB, Depth: 3.1 mi) earthquake occurred 160.5 miles away from the city center
On 10/24/1997 at 08:35:17, a magnitude 4.9 (4.8 MB, 4.2 MS, 4.9 LG, Depth: 6.2 mi) earthquake occurred 309.9 miles away from Crowley center
Magnitude types: regional Lg-wave magnitude (LG), body-wave magnitude (MB), surface-wave magnitude (MS), moment magnitude (MW)
Natural disasters:
The number of natural disasters in Acadia Parish (23) is greater than the US average (15).Major Disasters (Presidential) Declared: 16
Emergencies Declared: 4
Causes of natural disasters: Hurricanes: 14, Storms: 6, Floods: 5, Tropical Storms: 2, Other: 2 (Note: some incidents may be assigned to more than one category).
Hospitals in Crowley:
- AMERICAN LEGION HOSPITAL (Voluntary non-profit - Private, provides emergency services, 1305 CROWLEY RAYNE HIGHWAY)
- COMPASS BEHAVIORAL CENTER OF CROWLEY (1526 NORTH AVENUE I)
- CROWLEY REHAB HOSPITAL, LLC (713 NORTH AVENUE L)
Nursing Homes in Crowley:
- CHRISTIAN VILLA (1120 WEST HUTCHINSON AVE)
- HERITAGE HEALTHCARE CENTER (1526 N AVE I)
- LA BONNE MAISON NURSING AND REHA (1526 NORTH AVENUE I)
- SOUTHWIND NURSING AND REHABILITATION CENTER (804 CROWLEY-RAYNE HWY)
- SUMMERWOOD NURSING AND REHABILITATION CENTER (1120 W HUTCHINSON AVENUE)
Dialysis Facilities in Crowley:
Home Health Centers in Crowley:
Airports and heliports located in Crowley:
- Le Gros Memorial Airport (3R2) (Runways: 2, Itinerant Ops: 2,000, Local Ops: 7,000)
- John Airport (20LS) (Runways: 1)
- Lawson Field Airport (99LA) (Runways: 1)
- Walsh Airport (LA90) (Runways: 1)
- Acadia General Hospital Heliport (LS42)
Colleges/universities with over 2000 students nearest to Crowley:
- South Louisiana Community College (about 20 miles; Lafayette, LA; Full-time enrollment: 2,519)
- Acadiana Technical College-Lafayette Campus (about 20 miles; Lafayette, LA; FT enrollment: 2,378)
- University of Louisiana at Lafayette (about 22 miles; Lafayette, LA; FT enrollment: 14,493)
- SOWELA Technical Community College (about 48 miles; Lake Charles, LA; FT enrollment: 2,160)
- McNeese State University (about 51 miles; Lake Charles, LA; FT enrollment: 7,444)
- Southern University and A & M College (about 74 miles; Baton Rouge, LA; FT enrollment: 5,837)
- Louisiana State University and Agricultural & Mechanical College (about 75 miles; Baton Rouge, LA; FT enrollment: 27,321)
Private high schools in Crowley:
- NOTRE DAME HIGH SCHOOL (Students: 423, Location: 910 N EASTERN AVE, Grades: 9-12)
- NORTHSIDE CHRISTIAN SCHOOL (Students: 299, Location: 809 E NORTHERN AVE, Grades: KG-12)
Public elementary/middle schools in Crowley:
- CROWLEY MIDDLE SCHOOL (Location: 401 WEST NORTHERN AVENUE, Grades: 6-8)
- NORTH CROWLEY ELEMENTARY SCHOOL (Location: 820 WEST FIFTEENTH STREET, Grades: KG-5)
- ROSS ELEMENTARY SCHOOL (Location: 1809 WEST HUTCHINSON AVENUE, Grades: KG-5)
- SOUTH CROWLEY ELEMENTARY SCHOOL (Location: 1102 SOUTH PARKERSON AVENUE, Grades: KG-5)
Private elementary/middle schools in Crowley:
Points of interest:
Notable locations in Crowley: Bayou Bend Golf Course (A), Acadia Rice Arena (B), Crowley Industrial Park (C), Acadia Parish Sheriff's Department - Finance (D), Acadia Parish Office (E), Crowley Police Department - Chief (F), Acadia Parish Police Jury (G), Acadia Parish Sheriff's Department - Tax Collector (H), Crowley Rehabilitation Hospital (I), Compass Behavioral Center of Crowley (J), Acadia Parish Sheriff's Department - Investigations (K), Acadia Parish Courthouse (L), Acadia Parish Library (M), Crowley Fire Department Central Fire Station (N), Crowley City Hall (O), Crowley Town Club (P), Acadia Parish Sheriff's Department (Q), Crowley Fire Department Sub Station 2 (R), Rice Museum (S), Crowley Fire Department Sub Station 1 (T). Display/hide their locations on the map
Churches in Crowley include: Agape Pentecostal Church (A), Acadiana Cathedral (B), Bethel Christian Methodist Episcopal Church (C), Bible Missionary Church (D), Church of Christ in Crowley (E), First Assembly of God Church (F), First Baptist Church (G), First Christian Church (H), First Church of God in Christ (I). Display/hide their locations on the map
Cemeteries: Woodlawn Cemetery (1), Independent Order of Odd Fellows Cemetery (2). Display/hide their locations on the map
Parks in Crowley include: Martin Luther King Park (1), Levy Park (2), Hoffpauir Park (3), Edwards Park (4), Duson Park (5), Crowley Historic District (6), Bicentennial Park (7), Duson Park (8). Display/hide their locations on the map
Tourist attractions: International Rice Festival (110 East 4th Street), Acadia Parish Tourist Commission (401 Tower Road), Blue Rose Museum (Tours & Charters; 6428 Airport Road), Crystal Rice Plantations Inc (Tours & Charters; 6428 Airport Road).
Hotels: Crowley Inn (2111 North Cherokee Drive), La Quinta Inn Crowley (9565 Egan Highway), Days Inn Crowley LA (9571 Egan Highway).
Courts: Acadia Parish - Clerk Of Court (Court House), Crowley City - Courts- City Court (426 North Avenue F), Crowley Teen Court (601 North Parkerson Avenue).
Birthplace of: Victoria Reggie Kennedy - Politician, John Breaux - Politician, A. Hays Town - Centenarian, Allen C. Gremillion - Politician, Chris John - Politician, Jack Brooks (politician) - Politician, Kidd Jordan - Jazz alto saxophonist, Robert Tate - 2005 NFL player (Arizona Cardinals, born: Oct 19, 1973), Camey Doucet - A cajun musician and DJ, Eric Hetzel - Baseball player.
| This city: | 2.5 people |
| Louisiana: | 2.5 people |
| This city: | 64.8% |
| Whole state: | 67.1% |
| This city: | 8.5% |
| Whole state: | 6.8% |
Likely homosexual households (counted as self-reported same-sex unmarried-partner households)
- Lesbian couples: 0.4% of all households
- Gay men: 0.2% of all households
People in group quarters in Crowley in 2010:
- 158 people in nursing facilities/skilled-nursing facilities
- 132 people in correctional residential facilities
- 78 people in other noninstitutional facilities
- 7 people in mental (psychiatric) hospitals and psychiatric units in other hospitals
- 5 people in emergency and transitional shelters (with sleeping facilities) for people experiencing homelessness
People in group quarters in Crowley in 2000:
- 280 people in nursing homes
- 170 people in local jails and other confinement facilities (including police lockups)
- 36 people in wards in general hospitals for patients who have no usual home elsewhere
- 14 people in religious group quarters
- 9 people in other group homes
- 7 people in other noninstitutional group quarters
Banks with branches in Crowley (2011 data):
- Bank of Commerce & Trust Co.: Northpark Branch at 1415 North Parkerson Avenue, branch established on 1974/06/03; Bank Of Commerce & Trust Co. at 326 North Avenue G, branch established on 1926/01/01. Info updated 2006/11/03: Bank assets: $335.6 mil, Deposits: $284.0 mil, local headquarters, positive income, 5 total offices
- First National Bank of Louisiana: Crowley North City Branch at 1941 North Parkerson Avenue, branch established on 1996/12/18; First National Bank Of Louisiana at 128 North Parkerson Avenue, branch established on 1924/01/01. Info updated 2006/11/03: Bank assets: $271.0 mil, Deposits: $245.7 mil, local headquarters, positive income, Commercial Lending Specialization, 5 total offices, Holding Company: Financial Corporation Of Louisiana
- Home Bank: Crowley Branch at 204 N Parkerson Ave, branch established on 1893/01/01. Info updated 2011/07/21: Bank assets: $953.5 mil, Deposits: $732.8 mil, headquarters in Lafayette, LA, positive income, Commercial Lending Specialization, 23 total offices
- Iberiabank: Crowley Branch at 576 North Parkerson, branch established on 1957/10/31. Info updated 2011/06/08: Bank assets: $11,676.7 mil, Deposits: $9,387.9 mil, headquarters in Lafayette, LA, positive income, Commercial Lending Specialization, 187 total offices, Holding Company: Iberiabank Corporation
- The Evangeline Bank and Trust Company: Crowley Branch at 5th Street And Avenue G, branch established on 1960/09/24. Info updated 2007/11/06: Bank assets: $579.6 mil, Deposits: $479.3 mil, headquarters in Ville Platte, LA, positive income, 9 total offices, Holding Company: Evangeline Bancshares, Inc.
- St. Martin Bank and Trust Company: Crowley Branch at 357 Odd Fellows Road, branch established on 2005/11/07. Info updated 2007/12/05: Bank assets: $351.5 mil, Deposits: $285.3 mil, headquarters in St. Martinville, LA, positive income, Commercial Lending Specialization, 11 total offices, Holding Company: Saint Martin Bancshares, Inc.
For population 15 years and over in Crowley:
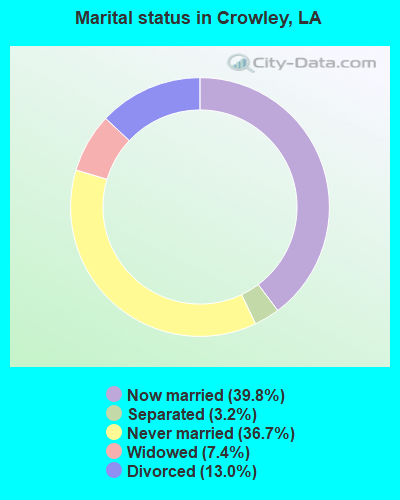
- Never married: 36.7%
- Now married: 39.8%
- Separated: 3.2%
- Widowed: 7.4%
- Divorced: 13.0%
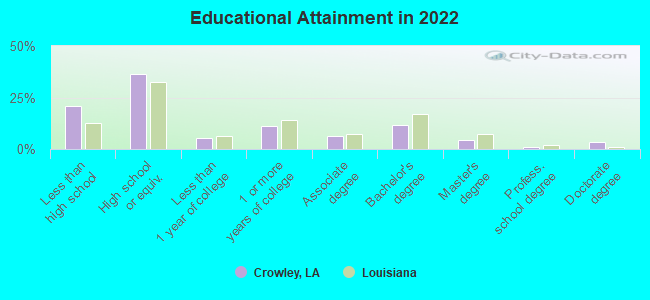
For population 25 years and over in Crowley:
- High school or higher: 77.2%
- Bachelor's degree or higher: 19.0%
- Graduate or professional degree: 8.1%
- Unemployed: 9.3%
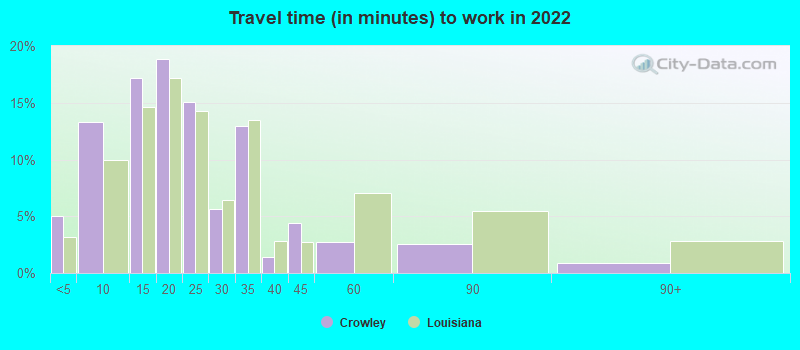
- Mean travel time to work (commute): 22.0 minutes
| Here: | 13.8 |
| Louisiana average: | 11.9 |
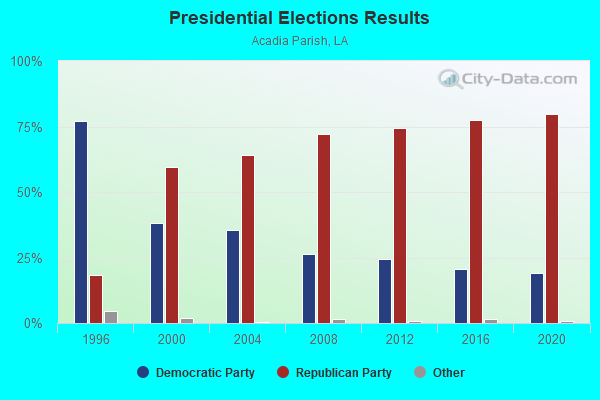
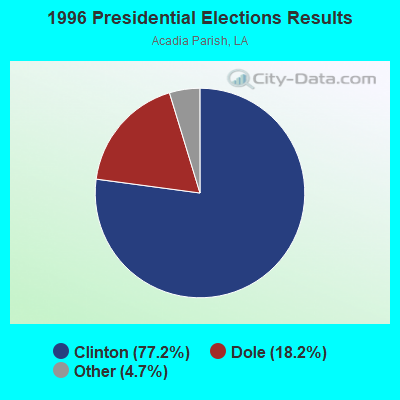
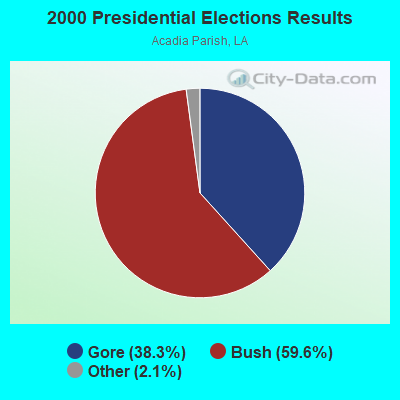
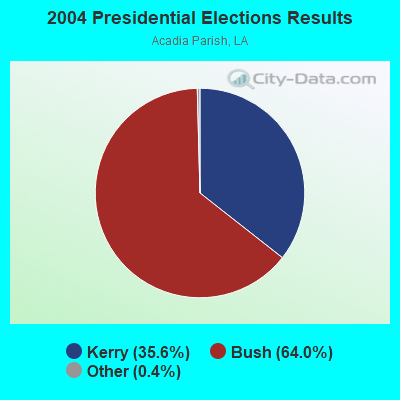
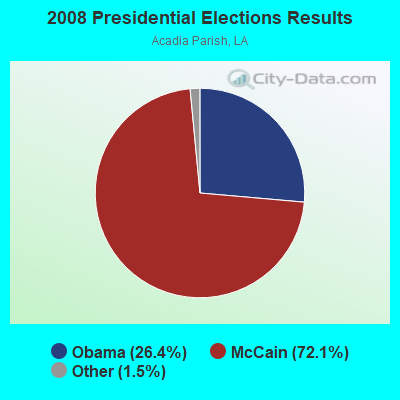
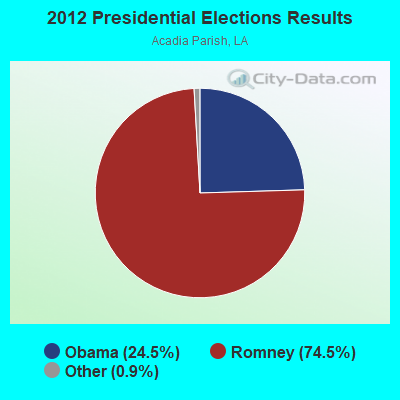
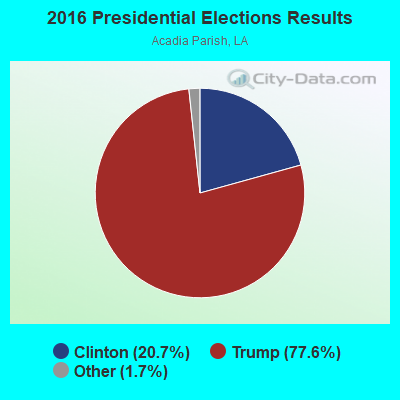
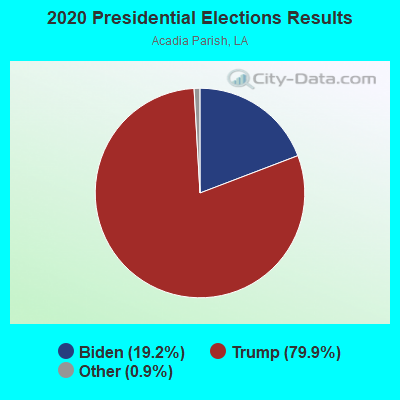
Graphs represent county-level data. Detailed 2008 Election Results
Religion statistics for Crowley, LA (based on Acadia Parish data)
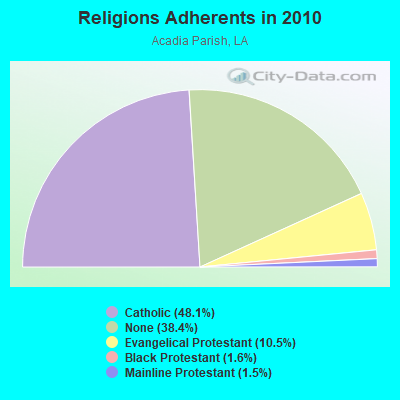
| Religion | Adherents | Congregations |
|---|---|---|
| Catholic | 29,701 | 23 |
| Evangelical Protestant | 6,460 | 41 |
| Black Protestant | 1,002 | 5 |
| Mainline Protestant | 904 | 9 |
| Other | 3 | 1 |
| None | 23,703 | - |
Food Environment Statistics:
| Here: | 3.85 / 10,000 pop. |
| State: | 2.56 / 10,000 pop. |
| Acadia Parish: | 0.17 / 10,000 pop. |
| Louisiana: | 0.18 / 10,000 pop. |
| Acadia Parish: | 1.17 / 10,000 pop. |
| State: | 1.29 / 10,000 pop. |
| Acadia Parish: | 5.02 / 10,000 pop. |
| Louisiana: | 4.49 / 10,000 pop. |
| Here: | 3.18 / 10,000 pop. |
| Louisiana: | 5.92 / 10,000 pop. |
| This county: | 11.2% |
| State: | 10.9% |
| This county: | 30.0% |
| Louisiana: | 29.2% |
| Acadia Parish: | 16.6% |
| Louisiana: | 13.7% |
Health and Nutrition:
| This city: | 47.6% |
| Louisiana: | 49.4% |
| Crowley: | 42.5% |
| State: | 46.5% |
| Here: | 29.2 |
| Louisiana: | 29.1 |
| Crowley: | 21.6% |
| Louisiana: | 20.3% |
| Here: | 12.4% |
| Louisiana: | 11.4% |
| Crowley: | 6.8 |
| Louisiana: | 6.8 |
| Crowley: | 35.1% |
| Louisiana: | 34.5% |
| Here: | 52.2% |
| Louisiana: | 55.8% |
| Crowley: | 78.0% |
| State: | 80.2% |
More about Health and Nutrition of Crowley, LA Residents
| Local government employment and payroll (March 2022) | |||||
| Function | Full-time employees | Monthly full-time payroll | Average yearly full-time wage | Part-time employees | Monthly part-time payroll |
|---|---|---|---|---|---|
| Police Protection - Officers | 36 | $155,115 | $51,705 | 0 | $0 |
| Firefighters | 35 | $141,052 | $48,361 | 0 | $0 |
| Streets and Highways | 19 | $48,843 | $30,848 | 0 | $0 |
| Other Government Administration | 18 | $48,267 | $32,178 | 1 | $370 |
| Sewerage | 11 | $31,901 | $34,801 | 0 | $0 |
| Police - Other | 8 | $21,733 | $32,600 | 0 | $0 |
| Parks and Recreation | 6 | $16,888 | $33,776 | 21 | $29,158 |
| Judicial and Legal | 5 | $8,906 | $21,374 | 0 | $0 |
| Other and Unallocable | 4 | $10,115 | $30,345 | 2 | $1,687 |
| Financial Administration | 3 | $13,855 | $55,420 | 0 | $0 |
| Fire - Other | 1 | $2,097 | $25,164 | 0 | $0 |
| Totals for Government | 146 | $498,772 | $40,995 | 24 | $31,215 |
Crowley government finances - Expenditure in 2018 (per resident):
- Construction - Sewerage: $898,000 ($78.96)
Regular Highways: $647,000 ($56.89)
Housing and Community Development: $158,000 ($13.89)
Judicial and Legal Services: $6,000 ($0.53)
- Current Operations - Police Protection: $3,383,000 ($297.46)
Local Fire Protection: $2,440,000 ($214.54)
Housing and Community Development: $1,530,000 ($134.53)
Regular Highways: $1,420,000 ($124.86)
Sewerage: $1,338,000 ($117.65)
Parks and Recreation: $843,000 ($74.12)
Central Staff Services: $754,000 ($66.30)
Financial Administration: $735,000 ($64.63)
General Public Buildings: $580,000 ($51.00)
Judicial and Legal Services: $557,000 ($48.98)
Protective Inspection and Regulation - Other: $411,000 ($36.14)
General - Other: $99,000 ($8.70)
Miscellaneous Commercial Activities - Other: $36,000 ($3.17)
- General - Interest on Debt: $256,000 ($22.51)
- Intergovernmental to Local - Other - Judicial and Legal Services: $298,000 ($26.20)
Other - Housing and Community Development: $45,000 ($3.96)
- Intergovernmental to State - Judicial and Legal Services: $15,000 ($1.32)
- Other Capital Outlay - General - Other: $102,000 ($8.97)
Sewerage: $39,000 ($3.43)
Judicial and Legal Services: $8,000 ($0.70)
- Total Salaries and Wages: $7,732,000 ($679.86)
Crowley government finances - Revenue in 2018 (per resident):
- Charges - Sewerage: $1,700,000 ($149.48)
Housing and Community Development: $991,000 ($87.14)
Parks and Recreation: $222,000 ($19.52)
Other: $31,000 ($2.73)
Regular Highways: $10,000 ($0.88)
Miscellaneous Commercial Activities: $6,000 ($0.53)
- Federal Intergovernmental - Housing and Community Development: $2,570,000 ($225.97)
- Local Intergovernmental - Other: $88,000 ($7.74)
- Miscellaneous - Fines and Forfeits: $587,000 ($51.61)
General Revenue - Other: $85,000 ($7.47)
Rents: $80,000 ($7.03)
Interest Earnings: $63,000 ($5.54)
Sale of Property: $30,000 ($2.64)
Donations From Private Sources: $7,000 ($0.62)
Royalties: $1,000 ($0.09)
- State Intergovernmental - Other: $447,000 ($39.30)
General Local Government Support: $380,000 ($33.41)
Sewerage: $309,000 ($27.17)
Highways: $24,000 ($2.11)
- Tax - General Sales and Gross Receipts: $7,990,000 ($702.54)
Property: $2,499,000 ($219.73)
Public Utilities Sales: $868,000 ($76.32)
Occupation and Business License - Other: $567,000 ($49.85)
Alcoholic Beverage License: $27,000 ($2.37)
Alcoholic Beverage Sales: $24,000 ($2.11)
Other License: $9,000 ($0.79)
Crowley government finances - Debt in 2018 (per resident):
- Long Term Debt - Beginning Outstanding - Unspecified Public Purpose: $7,267,000 ($638.97)
Outstanding Unspecified Public Purpose: $6,548,000 ($575.75)
Retired Unspecified Public Purpose: $719,000 ($63.22)
Crowley government finances - Cash and Securities in 2018 (per resident):
- Other Funds - Cash and Securities: $14,163,000 ($1245.32)
- Sinking Funds - Cash and Securities: $467,000 ($41.06)
| Businesses in Crowley, LA | ||||
| Name | Count | Name | Count | |
|---|---|---|---|---|
| AT&T | 1 | McDonald's | 1 | |
| AutoZone | 1 | Nike | 2 | |
| Burger King | 1 | Pizza Hut | 1 | |
| Chevrolet | 1 | Popeyes | 1 | |
| Curves | 1 | RadioShack | 1 | |
| Days Inn | 1 | Rite Aid | 1 | |
| FedEx | 1 | SONIC Drive-In | 1 | |
| Ford | 1 | Subway | 2 | |
| GNC | 1 | T-Mobile | 1 | |
| GameStop | 1 | Taco Bell | 1 | |
| H&R Block | 1 | U-Haul | 1 | |
| KFC | 1 | UPS | 1 | |
| La Quinta | 1 | Waffle House | 1 | |
| Lane Furniture | 1 | Walmart | 1 | |
| Lowe's | 1 | Wendy's | 1 | |
| MasterBrand Cabinets | 1 | |||
Strongest AM radio stations in Crowley:
- KSIG (1450 AM; 1 kW; CROWLEY, LA; Owner: ACADIA BROADCAST PARTNERS, INC.)
- KDYS (1520 AM; 10 kW; LAFAYETTE, LA; Owner: CITADEL BROADCASTING COMPANY)
- KVOL (1330 AM; 5 kW; LAFAYETTE, LA; Owner: CITADEL BROADCASTING COMPANY)
- WWL (870 AM; 50 kW; NEW ORLEANS, LA; Owner: ENTERCOM NEW ORLEANS LICENSE, LLC)
- KTRH (740 AM; 50 kW; HOUSTON, TX; Owner: AMFM TEXAS LICENSES LIMITED PARTNERSHIP)
- KJEF (1290 AM; 1 kW; JENNINGS, LA; Owner: APEX BROADCASTING, INC.)
- KROF (960 AM; 1 kW; ABBEVILLE, LA; Owner: ABBEVILLE BROADCASTING SERVICE, INC.)
- WLNO (1060 AM; 50 kW; NEW ORLEANS, LA; Owner: COMMUNICOM CO. OF LOUISIANA, L.P.)
- KJCB (770 AM; 1 kW; LAFAYETTE, LA; Owner: R & M BROADCASTING, INC.)
- KEUN (1490 AM; 1 kW; EUNICE, LA; Owner: TRI-PARISH BROADCASTING CO., INC.)
- KPEL (1420 AM; 1 kW; LAFAYETTE, LA; Owner: REGENT BROADCASTING OF LAFAYETTE, INC.)
- KEEL (710 AM; 50 kW; SHREVEPORT, LA; Owner: CITICASTERS LICENSES, L.P.)
- WSJC (810 AM; 50 kW; MAGEE, MS; Owner: FAMILY TALK RADIO)
Strongest FM radio stations in Crowley:
- KAJN-FM (102.9 FM; CROWLEY, LA; Owner: RICE CAPITAL BROADCASTING CO., INC.)
- KRVS (88.7 FM; LAFAYETTE, LA; Owner: THE UNIVERSITY OF LOUISIANA AT LAFAYETTE)
- KQIS (102.1 FM; BASILE, LA; Owner: THIRD PARTNER BROADCASTING, INC.)
- KSMB (94.5 FM; LAFAYETTE, LA; Owner: CITADEL BROADCASTING COMPANY)
- KBEB-FM (106.7 FM; RAYNE, LA; Owner: BROADCAST PARTNERS, INC.)
- KFXZ (106.3 FM; MAURICE, LA; Owner: CITADEL BROADCASTING COMPANY)
- K201FO (88.1 FM; JENNINGS, LA; Owner: CALVARY CHAPEL OF TWIN FALLS, INC.)
- KBXG (99.5 FM; LAKE CHARLES, LA; Owner: APEX BROADCASTING, INC.)
- KRKA (107.9 FM; ERATH, LA; Owner: REGENT BROADCASTING OF LAFAYETTE, INC.)
- KSJY (90.9 FM; LAFAYETTE, LA; Owner: AMERICAN FAMILY ASSOCIATION, INC.)
- KJJB (105.5 FM; EUNICE, LA; Owner: TRI-PARISH BROADCASTING INCORPORATED)
- KRRQ (95.5 FM; LAFAYETTE, LA; Owner: CITADEL BROADCASTING COMPANY)
- KTDY (99.9 FM; LAFAYETTE, LA; Owner: REGENT BROADCASTING OF LAFAYETTE, INC.)
- KXKC (99.1 FM; NEW IBERIA, LA; Owner: BONIN BROADCASTING CORPORATION)
- KMDL (97.3 FM; KAPLAN, LA; Owner: REGENT BROADCASTING OF LAFAYETTE, INC.)
- KFTE (96.5 FM; BREAUX BRIDGE, LA; Owner: REGENT BROADCASTING OF LAFAYETTE, INC.)
- K220EV (91.9 FM; LAFAYETTE, LA; Owner: BIBLE BROADCASTING NETWORK, INC.)
- KRXE (105.9 FM; OPELOUSAS, LA; Owner: CITADEL BROADCASTING COMPANY)
- KBON (101.1 FM; MAMOU, LA; Owner: ROSE ANN MARX)
- KPEL-FM (105.1 FM; ABBEVILLE, LA; Owner: ABBEVILLE BROADCASTING SERVICE, INC.)
TV broadcast stations around Crowley:
- KLFY-TV (Channel 10; LAFAYETTE, LA; Owner: KLFY, L.P.)
- KLPB-TV (Channel 24; LAFAYETTE, LA; Owner: LOUISIANA EDUCATIONAL TELEVISION AUTHORITY)
- KATC (Channel 3; LAFAYETTE, LA; Owner: KATC COMMUNICATIONS, INC.)
- KADN (Channel 15; LAFAYETTE, LA; Owner: KADN-15, INC.)
- KAGN-LP (Channel 65; CROWLEY, LA; Owner: RICE CAPITAL BROADCASTING COMPANY, INC.)
- K69HD (Channel 69; CHURCH POINT, LA; Owner: GULF MANAGEMENT II, L.L.C.)
- KPLC (Channel 7; LAKE CHARLES, LA; Owner: LIBCO, INC.)
- K45DI (Channel 45; MERMENTAU, LA; Owner: TRINITY BROADCASTING NETWORK)
- K58GA (Channel 46; LAFAYETTE, LA; Owner: WNTZ-48, INC.)
- KAJN-LP (Channel 40; LAFAYETTE, LA; Owner: RICE CAPITAL BROADCASTING COMPANY, INC.)
- KLTL-TV (Channel 18; LAKE CHARLES, LA; Owner: LOUISIANA EDUCATIONAL TELEVISION AUTHORITY)
- KLFT-LP (Channel 21; LAFAYETTE, LA; Owner: K. SANDOVAL BURKE)
- KJEF-CA (Channel 13; JENNINGS, ETC., LA; Owner: APEX BROADCASTING, INC.)
- KDCG-LP (Channel 22; OPELOUSAS, LA; Owner: ACADIANA CABLE ADVERTISING, INC.)
- KLAF-LP (Channel 62; OPELOUSAS, LA; Owner: WNTZ-48, INC.)
- National Bridge Inventory (NBI) Statistics
- 51Number of bridges
- 1,066ft / 325mTotal length
- $14,283,000Total costs
- 639,552Total average daily traffic
- 87,560Total average daily truck traffic
- New bridges - historical statistics
- 11940-1949
- 31950-1959
- 161960-1969
- 21970-1979
- 91980-1989
- 41990-1999
- 62000-2009
- 22010-2019
FCC Registered Antenna Towers: 101 (See the full list of FCC Registered Antenna Towers)
FCC Registered Commercial Land Mobile Towers: 2 (See the full list of FCC Registered Commercial Land Mobile Towers in Crowley, LA)
FCC Registered Broadcast Land Mobile Towers: 24 (See the full list of FCC Registered Broadcast Land Mobile Towers)
FCC Registered Microwave Towers: 27 (See the full list of FCC Registered Microwave Towers in this town)
FCC Registered Maritime Coast & Aviation Ground Towers: 1 (See the full list of FCC Registered Maritime Coast & Aviation Ground Towers)
FCC Registered Amateur Radio Licenses: 54 (See the full list of FCC Registered Amateur Radio Licenses in Crowley)
FAA Registered Aircraft: 29 (See the full list of FAA Registered Aircraft in Crowley)
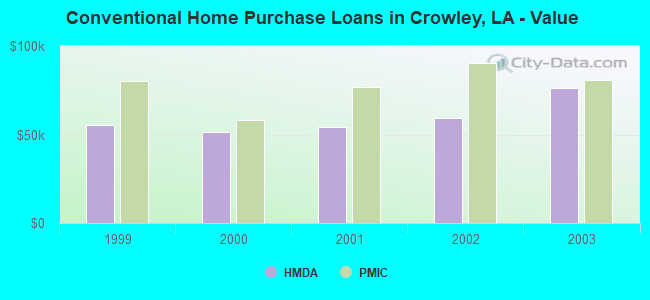
| Home Mortgage Disclosure Act Aggregated Statistics For Year 2003 (Based on 3 partial tracts) | ||||||||||
| A) FHA, FSA/RHS & VA Home Purchase Loans | B) Conventional Home Purchase Loans | C) Refinancings | D) Home Improvement Loans | F) Non-occupant Loans on < 5 Family Dwellings (A B C & D) | ||||||
|---|---|---|---|---|---|---|---|---|---|---|
| Number | Average Value | Number | Average Value | Number | Average Value | Number | Average Value | Number | Average Value | |
| LOANS ORIGINATED | 2 | $77,245 | 21 | $76,286 | 67 | $72,443 | 19 | $14,634 | 16 | $40,057 |
| APPLICATIONS APPROVED, NOT ACCEPTED | 0 | $0 | 1 | $63,990 | 11 | $59,518 | 0 | $0 | 0 | $0 |
| APPLICATIONS DENIED | 0 | $0 | 10 | $40,429 | 20 | $53,823 | 6 | $17,517 | 2 | $43,185 |
| APPLICATIONS WITHDRAWN | 0 | $0 | 3 | $60,710 | 12 | $61,092 | 0 | $0 | 1 | $26,150 |
| FILES CLOSED FOR INCOMPLETENESS | 1 | $38,200 | 1 | $94,730 | 3 | $45,883 | 0 | $0 | 0 | $0 |
Detailed HMDA statistics for the following Tracts: 9608.00 , 9609.00, 9610.00
| Private Mortgage Insurance Companies Aggregated Statistics For Year 2003 (Based on 3 partial tracts) | ||||
| A) Conventional Home Purchase Loans | B) Refinancings | |||
|---|---|---|---|---|
| Number | Average Value | Number | Average Value | |
| LOANS ORIGINATED | 4 | $80,982 | 7 | $84,517 |
| APPLICATIONS APPROVED, NOT ACCEPTED | 1 | $81,030 | 0 | $0 |
| APPLICATIONS DENIED | 0 | $0 | 0 | $0 |
| APPLICATIONS WITHDRAWN | 0 | $0 | 0 | $0 |
| FILES CLOSED FOR INCOMPLETENESS | 0 | $0 | 0 | $0 |
Detailed PMIC statistics for the following Tracts: 9608.00 , 9609.00, 9610.00
2002 - 2018 National Fire Incident Reporting System (NFIRS) incidents
- Fire incident types reported to NFIRS in Crowley, LA
- 57537.1%Structure Fires
- 57136.8%Outside Fires
- 33521.6%Mobile Property/Vehicle Fires
- 704.5%Other
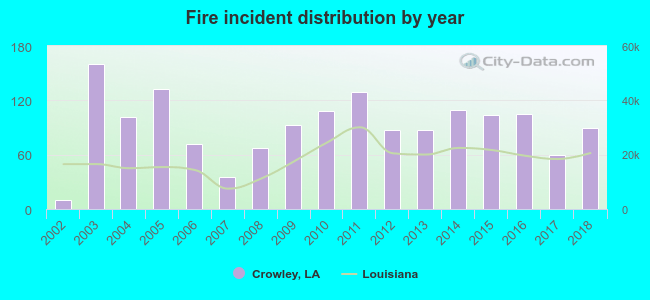 According to the data from the years 2002 - 2018 the average number of fires per year is 91. The highest number of fires - 160 took place in 2003, and the least - 10 in 2002. The data has a rising trend.
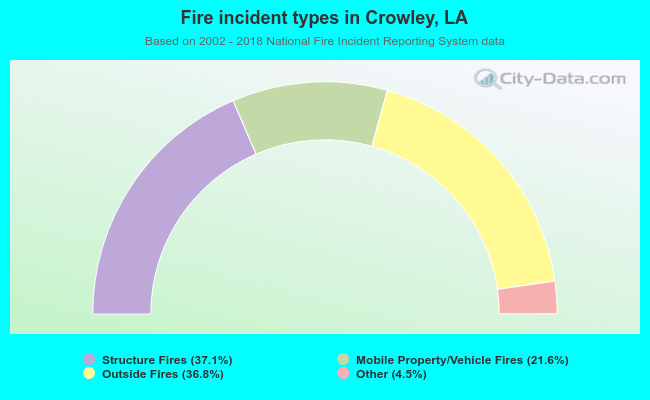 When looking into fire subcategories, the most incidents belonged to: Structure Fires (37.1%), and Outside Fires (36.8%).
Fire-safe hotels and motels in Crowley, Louisiana:
- Days Inn Crowley, 9571 Egan Hwy, Crowley, Louisiana 70526 , Phone: (337) 783-2378, Fax: (337) 783-2378
- La Quinta Inn, Crowley By SGTB Lodgings, L L. C., 9565 Egan Hwy, Crowley, Louisiana 70526 , Phone: (337) 783-6500, Fax: (337) 783-2003
| Most common first names in Crowley, LA among deceased individuals | ||
| Name | Count | Lived (average) |
|---|---|---|
| Joseph | 163 | 73.1 years |
| Mary | 154 | 75.4 years |
| John | 119 | 69.7 years |
| James | 61 | 65.7 years |
| Marie | 55 | 78.4 years |
| Louis | 52 | 73.2 years |
| Henry | 48 | 74.1 years |
| Willie | 47 | 71.5 years |
| Charles | 47 | 68.9 years |
| William | 46 | 74.8 years |
| Most common last names in Crowley, LA among deceased individuals | ||
| Last name | Count | Lived (average) |
|---|---|---|
| Broussard | 152 | 73.5 years |
| Guidry | 130 | 70.5 years |
| Richard | 104 | 75.6 years |
| Hoffpauir | 97 | 73.7 years |
| Trahan | 96 | 73.2 years |
| Breaux | 95 | 74.8 years |
| Cormier | 95 | 72.7 years |
| Thibodeaux | 70 | 74.2 years |
| Hebert | 66 | 70.3 years |
| Abshire | 64 | 74.7 years |
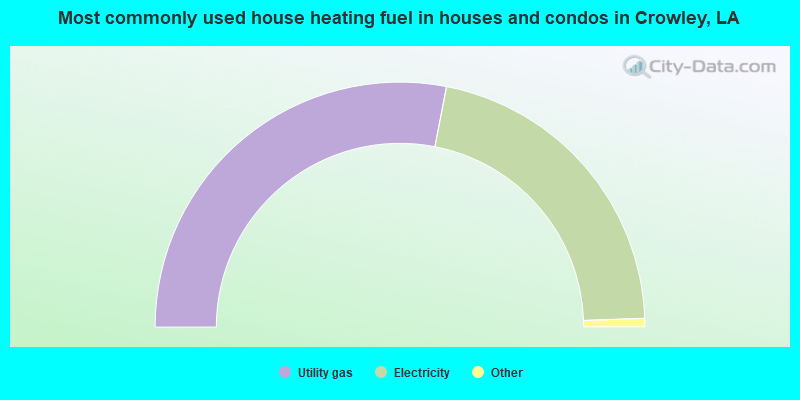
- 56.1%Utility gas
- 42.8%Electricity
- 0.4%Wood
- 0.3%Bottled, tank, or LP gas
- 0.3%No fuel used
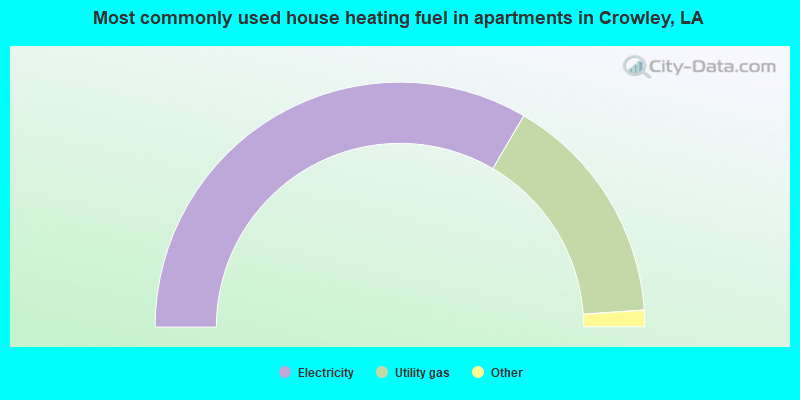
- 66.9%Electricity
- 30.9%Utility gas
- 1.6%No fuel used
- 0.5%Bottled, tank, or LP gas
Crowley compared to Louisiana state average:
- Median household income below state average.
- Median house value below state average.
- Unemployed percentage below state average.
- Hispanic race population percentage significantly below state average.
- Foreign-born population percentage significantly below state average.
- Length of stay since moving in significantly above state average.
- House age above state average.
Crowley on our top lists:
- #84 on the list of "Top 101 cities with the most people born in the same U.S. state as the city (population 5,000+)"
- #84 on the list of "Top 101 cities with the largest percentage of high school students in private schools (500+ students)"
- #94 on the list of "Top 101 cities with largest percentage of males in industries: mining, quarrying, and oil and gas extraction (population 5,000+)"
- #31 (70526) on the list of "Top 101 zip codes with the largest percentage of French first ancestries (pop 5,000+)"
- #48 on the list of "Top 101 counties with the smallest number of people without health insurance coverage in 2000 (pop. 50,000+)"
- #90 on the list of "Top 101 counties with the smallest number of children under 18 without health insurance coverage in 2000 (pop. 50,000+)"

|
|
Total of 12 patent applications in 2008-2024.