Indian Harbour Beach, Florida Submit your own pictures of this city and show them to the world
OSM Map
General Map
Google Map
MSN Map
OSM Map
General Map
Google Map
MSN Map
OSM Map
General Map
Google Map
MSN Map
OSM Map
General Map
Google Map
MSN Map
Please wait while loading the map...
Population in 2022: 8,997 (100% urban, 0% rural). Population change since 2000: +10.4%Males: 4,446 Females: 4,551
March 2022 cost of living index in Indian Harbour Beach: 91.8 (less than average, U.S. average is 100) Percentage of residents living in poverty in 2022: 15.1%for White Non-Hispanic residents , 53.3% for Hispanic or Latino residents , 83.9% for other race residents , 2.6% for two or more races residents )
Profiles of local businesses
Business Search - 14 Million verified businesses
Data:
Median household income ($)
Median household income (% change since 2000)
Household income diversity
Ratio of average income to average house value (%)
Ratio of average income to average rent
Median household income ($) - White
Median household income ($) - Black or African American
Median household income ($) - Asian
Median household income ($) - Hispanic or Latino
Median household income ($) - American Indian and Alaska Native
Median household income ($) - Multirace
Median household income ($) - Other Race
Median household income for houses/condos with a mortgage ($)
Median household income for apartments without a mortgage ($)
Races - White alone (%)
Races - White alone (% change since 2000)
Races - Black alone (%)
Races - Black alone (% change since 2000)
Races - American Indian alone (%)
Races - American Indian alone (% change since 2000)
Races - Asian alone (%)
Races - Asian alone (% change since 2000)
Races - Hispanic (%)
Races - Hispanic (% change since 2000)
Races - Native Hawaiian and Other Pacific Islander alone (%)
Races - Native Hawaiian and Other Pacific Islander alone (% change since 2000)
Races - Two or more races (%)
Races - Two or more races (% change since 2000)
Races - Other race alone (%)
Races - Other race alone (% change since 2000)
Racial diversity
Unemployment (%)
Unemployment (% change since 2000)
Unemployment (%) - White
Unemployment (%) - Black or African American
Unemployment (%) - Asian
Unemployment (%) - Hispanic or Latino
Unemployment (%) - American Indian and Alaska Native
Unemployment (%) - Multirace
Unemployment (%) - Other Race
Population density (people per square mile)
Population - Males (%)
Population - Females (%)
Population - Males (%) - White
Population - Males (%) - Black or African American
Population - Males (%) - Asian
Population - Males (%) - Hispanic or Latino
Population - Males (%) - American Indian and Alaska Native
Population - Males (%) - Multirace
Population - Males (%) - Other Race
Population - Females (%) - White
Population - Females (%) - Black or African American
Population - Females (%) - Asian
Population - Females (%) - Hispanic or Latino
Population - Females (%) - American Indian and Alaska Native
Population - Females (%) - Multirace
Population - Females (%) - Other Race
Coronavirus confirmed cases (May 01, 2024)
Deaths caused by coronavirus (May 01, 2024)
Coronavirus confirmed cases (per 100k population) (May 01, 2024)
Deaths caused by coronavirus (per 100k population) (May 01, 2024)
Daily increase in number of cases (May 01, 2024)
Weekly increase in number of cases (May 01, 2024)
Cases doubled (in days) (May 01, 2024)
Hospitalized patients (Apr 18, 2022)
Negative test results (Apr 18, 2022)
Total test results (Apr 18, 2022)
COVID Vaccine doses distributed (per 100k population) (Sep 19, 2023)
COVID Vaccine doses administered (per 100k population) (Sep 19, 2023)
COVID Vaccine doses distributed (Sep 19, 2023)
COVID Vaccine doses administered (Sep 19, 2023)
Likely homosexual households (%)
Likely homosexual households (% change since 2000)
Likely homosexual households - Lesbian couples (%)
Likely homosexual households - Lesbian couples (% change since 2000)
Likely homosexual households - Gay men (%)
Likely homosexual households - Gay men (% change since 2000)
Cost of living index
Median gross rent ($)
Median contract rent ($)
Median monthly housing costs ($)
Median house or condo value ($)
Median house or condo value ($ change since 2000)
Mean house or condo value by units in structure - 1, detached ($)
Mean house or condo value by units in structure - 1, attached ($)
Mean house or condo value by units in structure - 2 ($)
Mean house or condo value by units in structure by units in structure - 3 or 4 ($)
Mean house or condo value by units in structure - 5 or more ($)
Mean house or condo value by units in structure - Boat, RV, van, etc. ($)
Mean house or condo value by units in structure - Mobile home ($)
Median house or condo value ($) - White
Median house or condo value ($) - Black or African American
Median house or condo value ($) - Asian
Median house or condo value ($) - Hispanic or Latino
Median house or condo value ($) - American Indian and Alaska Native
Median house or condo value ($) - Multirace
Median house or condo value ($) - Other Race
Median resident age
Resident age diversity
Median resident age - Males
Median resident age - Females
Median resident age - White
Median resident age - Black or African American
Median resident age - Asian
Median resident age - Hispanic or Latino
Median resident age - American Indian and Alaska Native
Median resident age - Multirace
Median resident age - Other Race
Median resident age - Males - White
Median resident age - Males - Black or African American
Median resident age - Males - Asian
Median resident age - Males - Hispanic or Latino
Median resident age - Males - American Indian and Alaska Native
Median resident age - Males - Multirace
Median resident age - Males - Other Race
Median resident age - Females - White
Median resident age - Females - Black or African American
Median resident age - Females - Asian
Median resident age - Females - Hispanic or Latino
Median resident age - Females - American Indian and Alaska Native
Median resident age - Females - Multirace
Median resident age - Females - Other Race
Commute - mean travel time to work (minutes)
Travel time to work - Less than 5 minutes (%)
Travel time to work - Less than 5 minutes (% change since 2000)
Travel time to work - 5 to 9 minutes (%)
Travel time to work - 5 to 9 minutes (% change since 2000)
Travel time to work - 10 to 19 minutes (%)
Travel time to work - 10 to 19 minutes (% change since 2000)
Travel time to work - 20 to 29 minutes (%)
Travel time to work - 20 to 29 minutes (% change since 2000)
Travel time to work - 30 to 39 minutes (%)
Travel time to work - 30 to 39 minutes (% change since 2000)
Travel time to work - 40 to 59 minutes (%)
Travel time to work - 40 to 59 minutes (% change since 2000)
Travel time to work - 60 to 89 minutes (%)
Travel time to work - 60 to 89 minutes (% change since 2000)
Travel time to work - 90 or more minutes (%)
Travel time to work - 90 or more minutes (% change since 2000)
Marital status - Never married (%)
Marital status - Now married (%)
Marital status - Separated (%)
Marital status - Widowed (%)
Marital status - Divorced (%)
Median family income ($)
Median family income (% change since 2000)
Median non-family income ($)
Median non-family income (% change since 2000)
Median per capita income ($)
Median per capita income (% change since 2000)
Median family income ($) - White
Median family income ($) - Black or African American
Median family income ($) - Asian
Median family income ($) - Hispanic or Latino
Median family income ($) - American Indian and Alaska Native
Median family income ($) - Multirace
Median family income ($) - Other Race
Median year house/condo built
Median year apartment built
Year house built - Built 2005 or later (%)
Year house built - Built 2000 to 2004 (%)
Year house built - Built 1990 to 1999 (%)
Year house built - Built 1980 to 1989 (%)
Year house built - Built 1970 to 1979 (%)
Year house built - Built 1960 to 1969 (%)
Year house built - Built 1950 to 1959 (%)
Year house built - Built 1940 to 1949 (%)
Year house built - Built 1939 or earlier (%)
Average household size
Household density (households per square mile)
Average household size - White
Average household size - Black or African American
Average household size - Asian
Average household size - Hispanic or Latino
Average household size - American Indian and Alaska Native
Average household size - Multirace
Average household size - Other Race
Occupied housing units (%)
Vacant housing units (%)
Owner occupied housing units (%)
Renter occupied housing units (%)
Vacancy status - For rent (%)
Vacancy status - For sale only (%)
Vacancy status - Rented or sold, not occupied (%)
Vacancy status - For seasonal, recreational, or occasional use (%)
Vacancy status - For migrant workers (%)
Vacancy status - Other vacant (%)
Residents with income below the poverty level (%)
Residents with income below 50% of the poverty level (%)
Children below poverty level (%)
Poor families by family type - Married-couple family (%)
Poor families by family type - Male, no wife present (%)
Poor families by family type - Female, no husband present (%)
Poverty status for native-born residents (%)
Poverty status for foreign-born residents (%)
Poverty among high school graduates not in families (%)
Poverty among people who did not graduate high school not in families (%)
Residents with income below the poverty level (%) - White
Residents with income below the poverty level (%) - Black or African American
Residents with income below the poverty level (%) - Asian
Residents with income below the poverty level (%) - Hispanic or Latino
Residents with income below the poverty level (%) - American Indian and Alaska Native
Residents with income below the poverty level (%) - Multirace
Residents with income below the poverty level (%) - Other Race
Air pollution - Air Quality Index (AQI)
Air pollution - CO
Air pollution - NO2
Air pollution - SO2
Air pollution - Ozone
Air pollution - PM10
Air pollution - PM25
Air pollution - Pb
Crime - Murders per 100,000 population
Crime - Rapes per 100,000 population
Crime - Robberies per 100,000 population
Crime - Assaults per 100,000 population
Crime - Burglaries per 100,000 population
Crime - Thefts per 100,000 population
Crime - Auto thefts per 100,000 population
Crime - Arson per 100,000 population
Crime - City-data.com crime index
Crime - Violent crime index
Crime - Property crime index
Crime - Murders per 100,000 population (5 year average)
Crime - Rapes per 100,000 population (5 year average)
Crime - Robberies per 100,000 population (5 year average)
Crime - Assaults per 100,000 population (5 year average)
Crime - Burglaries per 100,000 population (5 year average)
Crime - Thefts per 100,000 population (5 year average)
Crime - Auto thefts per 100,000 population (5 year average)
Crime - Arson per 100,000 population (5 year average)
Crime - City-data.com crime index (5 year average)
Crime - Violent crime index (5 year average)
Crime - Property crime index (5 year average)
1996 Presidential Elections Results (%) - Democratic Party (Clinton)
1996 Presidential Elections Results (%) - Republican Party (Dole)
1996 Presidential Elections Results (%) - Other
2000 Presidential Elections Results (%) - Democratic Party (Gore)
2000 Presidential Elections Results (%) - Republican Party (Bush)
2000 Presidential Elections Results (%) - Other
2004 Presidential Elections Results (%) - Democratic Party (Kerry)
2004 Presidential Elections Results (%) - Republican Party (Bush)
2004 Presidential Elections Results (%) - Other
2008 Presidential Elections Results (%) - Democratic Party (Obama)
2008 Presidential Elections Results (%) - Republican Party (McCain)
2008 Presidential Elections Results (%) - Other
2012 Presidential Elections Results (%) - Democratic Party (Obama)
2012 Presidential Elections Results (%) - Republican Party (Romney)
2012 Presidential Elections Results (%) - Other
2016 Presidential Elections Results (%) - Democratic Party (Clinton)
2016 Presidential Elections Results (%) - Republican Party (Trump)
2016 Presidential Elections Results (%) - Other
2020 Presidential Elections Results (%) - Democratic Party (Biden)
2020 Presidential Elections Results (%) - Republican Party (Trump)
2020 Presidential Elections Results (%) - Other
Ancestries Reported - Arab (%)
Ancestries Reported - Czech (%)
Ancestries Reported - Danish (%)
Ancestries Reported - Dutch (%)
Ancestries Reported - English (%)
Ancestries Reported - French (%)
Ancestries Reported - French Canadian (%)
Ancestries Reported - German (%)
Ancestries Reported - Greek (%)
Ancestries Reported - Hungarian (%)
Ancestries Reported - Irish (%)
Ancestries Reported - Italian (%)
Ancestries Reported - Lithuanian (%)
Ancestries Reported - Norwegian (%)
Ancestries Reported - Polish (%)
Ancestries Reported - Portuguese (%)
Ancestries Reported - Russian (%)
Ancestries Reported - Scotch-Irish (%)
Ancestries Reported - Scottish (%)
Ancestries Reported - Slovak (%)
Ancestries Reported - Subsaharan African (%)
Ancestries Reported - Swedish (%)
Ancestries Reported - Swiss (%)
Ancestries Reported - Ukrainian (%)
Ancestries Reported - United States (%)
Ancestries Reported - Welsh (%)
Ancestries Reported - West Indian (%)
Ancestries Reported - Other (%)
Educational Attainment - No schooling completed (%)
Educational Attainment - Less than high school (%)
Educational Attainment - High school or equivalent (%)
Educational Attainment - Less than 1 year of college (%)
Educational Attainment - 1 or more years of college (%)
Educational Attainment - Associate degree (%)
Educational Attainment - Bachelor's degree (%)
Educational Attainment - Master's degree (%)
Educational Attainment - Professional school degree (%)
Educational Attainment - Doctorate degree (%)
School Enrollment - Nursery, preschool (%)
School Enrollment - Kindergarten (%)
School Enrollment - Grade 1 to 4 (%)
School Enrollment - Grade 5 to 8 (%)
School Enrollment - Grade 9 to 12 (%)
School Enrollment - College undergrad (%)
School Enrollment - Graduate or professional (%)
School Enrollment - Not enrolled in school (%)
School enrollment - Public schools (%)
School enrollment - Private schools (%)
School enrollment - Not enrolled (%)
Median number of rooms in houses and condos
Median number of rooms in apartments
Housing units lacking complete plumbing facilities (%)
Housing units lacking complete kitchen facilities (%)
Density of houses
Urban houses (%)
Rural houses (%)
Households with people 60 years and over (%)
Households with people 65 years and over (%)
Households with people 75 years and over (%)
Households with one or more nonrelatives (%)
Households with no nonrelatives (%)
Population in households (%)
Family households (%)
Nonfamily households (%)
Population in families (%)
Family households with own children (%)
Median number of bedrooms in owner occupied houses
Mean number of bedrooms in owner occupied houses
Median number of bedrooms in renter occupied houses
Mean number of bedrooms in renter occupied houses
Median number of vehichles in owner occupied houses
Mean number of vehichles in owner occupied houses
Median number of vehichles in renter occupied houses
Mean number of vehichles in renter occupied houses
Mortgage status - with mortgage (%)
Mortgage status - with second mortgage (%)
Mortgage status - with home equity loan (%)
Mortgage status - with both second mortgage and home equity loan (%)
Mortgage status - without a mortgage (%)
Average family size
Average family size - White
Average family size - Black or African American
Average family size - Asian
Average family size - Hispanic or Latino
Average family size - American Indian and Alaska Native
Average family size - Multirace
Average family size - Other Race
Geographical mobility - Same house 1 year ago (%)
Geographical mobility - Moved within same county (%)
Geographical mobility - Moved from different county within same state (%)
Geographical mobility - Moved from different state (%)
Geographical mobility - Moved from abroad (%)
Place of birth - Born in state of residence (%)
Place of birth - Born in other state (%)
Place of birth - Native, outside of US (%)
Place of birth - Foreign born (%)
Housing units in structures - 1, detached (%)
Housing units in structures - 1, attached (%)
Housing units in structures - 2 (%)
Housing units in structures - 3 or 4 (%)
Housing units in structures - 5 to 9 (%)
Housing units in structures - 10 to 19 (%)
Housing units in structures - 20 to 49 (%)
Housing units in structures - 50 or more (%)
Housing units in structures - Mobile home (%)
Housing units in structures - Boat, RV, van, etc. (%)
House/condo owner moved in on average (years ago)
Renter moved in on average (years ago)
Year householder moved into unit - Moved in 1999 to March 2000 (%)
Year householder moved into unit - Moved in 1995 to 1998 (%)
Year householder moved into unit - Moved in 1990 to 1994 (%)
Year householder moved into unit - Moved in 1980 to 1989 (%)
Year householder moved into unit - Moved in 1970 to 1979 (%)
Year householder moved into unit - Moved in 1969 or earlier (%)
Means of transportation to work - Drove car alone (%)
Means of transportation to work - Carpooled (%)
Means of transportation to work - Public transportation (%)
Means of transportation to work - Bus or trolley bus (%)
Means of transportation to work - Streetcar or trolley car (%)
Means of transportation to work - Subway or elevated (%)
Means of transportation to work - Railroad (%)
Means of transportation to work - Ferryboat (%)
Means of transportation to work - Taxicab (%)
Means of transportation to work - Motorcycle (%)
Means of transportation to work - Bicycle (%)
Means of transportation to work - Walked (%)
Means of transportation to work - Other means (%)
Working at home (%)
Industry diversity
Most Common Industries - Agriculture, forestry, fishing and hunting, and mining (%)
Most Common Industries - Agriculture, forestry, fishing and hunting (%)
Most Common Industries - Mining, quarrying, and oil and gas extraction (%)
Most Common Industries - Construction (%)
Most Common Industries - Manufacturing (%)
Most Common Industries - Wholesale trade (%)
Most Common Industries - Retail trade (%)
Most Common Industries - Transportation and warehousing, and utilities (%)
Most Common Industries - Transportation and warehousing (%)
Most Common Industries - Utilities (%)
Most Common Industries - Information (%)
Most Common Industries - Finance and insurance, and real estate and rental and leasing (%)
Most Common Industries - Finance and insurance (%)
Most Common Industries - Real estate and rental and leasing (%)
Most Common Industries - Professional, scientific, and management, and administrative and waste management services (%)
Most Common Industries - Professional, scientific, and technical services (%)
Most Common Industries - Management of companies and enterprises (%)
Most Common Industries - Administrative and support and waste management services (%)
Most Common Industries - Educational services, and health care and social assistance (%)
Most Common Industries - Educational services (%)
Most Common Industries - Health care and social assistance (%)
Most Common Industries - Arts, entertainment, and recreation, and accommodation and food services (%)
Most Common Industries - Arts, entertainment, and recreation (%)
Most Common Industries - Accommodation and food services (%)
Most Common Industries - Other services, except public administration (%)
Most Common Industries - Public administration (%)
Occupation diversity
Most Common Occupations - Management, business, science, and arts occupations (%)
Most Common Occupations - Management, business, and financial occupations (%)
Most Common Occupations - Management occupations (%)
Most Common Occupations - Business and financial operations occupations (%)
Most Common Occupations - Computer, engineering, and science occupations (%)
Most Common Occupations - Computer and mathematical occupations (%)
Most Common Occupations - Architecture and engineering occupations (%)
Most Common Occupations - Life, physical, and social science occupations (%)
Most Common Occupations - Education, legal, community service, arts, and media occupations (%)
Most Common Occupations - Community and social service occupations (%)
Most Common Occupations - Legal occupations (%)
Most Common Occupations - Education, training, and library occupations (%)
Most Common Occupations - Arts, design, entertainment, sports, and media occupations (%)
Most Common Occupations - Healthcare practitioners and technical occupations (%)
Most Common Occupations - Health diagnosing and treating practitioners and other technical occupations (%)
Most Common Occupations - Health technologists and technicians (%)
Most Common Occupations - Service occupations (%)
Most Common Occupations - Healthcare support occupations (%)
Most Common Occupations - Protective service occupations (%)
Most Common Occupations - Fire fighting and prevention, and other protective service workers including supervisors (%)
Most Common Occupations - Law enforcement workers including supervisors (%)
Most Common Occupations - Food preparation and serving related occupations (%)
Most Common Occupations - Building and grounds cleaning and maintenance occupations (%)
Most Common Occupations - Personal care and service occupations (%)
Most Common Occupations - Sales and office occupations (%)
Most Common Occupations - Sales and related occupations (%)
Most Common Occupations - Office and administrative support occupations (%)
Most Common Occupations - Natural resources, construction, and maintenance occupations (%)
Most Common Occupations - Farming, fishing, and forestry occupations (%)
Most Common Occupations - Construction and extraction occupations (%)
Most Common Occupations - Installation, maintenance, and repair occupations (%)
Most Common Occupations - Production, transportation, and material moving occupations (%)
Most Common Occupations - Production occupations (%)
Most Common Occupations - Transportation occupations (%)
Most Common Occupations - Material moving occupations (%)
People in Group quarters - Institutionalized population (%)
People in Group quarters - Correctional institutions (%)
People in Group quarters - Federal prisons and detention centers (%)
People in Group quarters - Halfway houses (%)
People in Group quarters - Local jails and other confinement facilities (including police lockups) (%)
People in Group quarters - Military disciplinary barracks (%)
People in Group quarters - State prisons (%)
People in Group quarters - Other types of correctional institutions (%)
People in Group quarters - Nursing homes (%)
People in Group quarters - Hospitals/wards, hospices, and schools for the handicapped (%)
People in Group quarters - Hospitals/wards and hospices for chronically ill (%)
People in Group quarters - Hospices or homes for chronically ill (%)
People in Group quarters - Military hospitals or wards for chronically ill (%)
People in Group quarters - Other hospitals or wards for chronically ill (%)
People in Group quarters - Hospitals or wards for drug/alcohol abuse (%)
People in Group quarters - Mental (Psychiatric) hospitals or wards (%)
People in Group quarters - Schools, hospitals, or wards for the mentally retarded (%)
People in Group quarters - Schools, hospitals, or wards for the physically handicapped (%)
People in Group quarters - Institutions for the deaf (%)
People in Group quarters - Institutions for the blind (%)
People in Group quarters - Orthopedic wards and institutions for the physically handicapped (%)
People in Group quarters - Wards in general hospitals for patients who have no usual home elsewhere (%)
People in Group quarters - Wards in military hospitals for patients who have no usual home elsewhere (%)
People in Group quarters - Juvenile institutions (%)
People in Group quarters - Long-term care (%)
People in Group quarters - Homes for abused, dependent, and neglected children (%)
People in Group quarters - Residential treatment centers for emotionally disturbed children (%)
People in Group quarters - Training schools for juvenile delinquents (%)
People in Group quarters - Short-term care, detention or diagnostic centers for delinquent children (%)
People in Group quarters - Type of juvenile institution unknown (%)
People in Group quarters - Noninstitutionalized population (%)
People in Group quarters - College dormitories (includes college quarters off campus) (%)
People in Group quarters - Military quarters (%)
People in Group quarters - On base (%)
People in Group quarters - Barracks, unaccompanied personnel housing (UPH), (Enlisted/Officer), ;and similar group living quarters for military personnel (%)
People in Group quarters - Transient quarters for temporary residents (%)
People in Group quarters - Military ships (%)
People in Group quarters - Group homes (%)
People in Group quarters - Homes or halfway houses for drug/alcohol abuse (%)
People in Group quarters - Homes for the mentally ill (%)
People in Group quarters - Homes for the mentally retarded (%)
People in Group quarters - Homes for the physically handicapped (%)
People in Group quarters - Other group homes (%)
People in Group quarters - Religious group quarters (%)
People in Group quarters - Dormitories (%)
People in Group quarters - Agriculture workers' dormitories on farms (%)
People in Group quarters - Job Corps and vocational training facilities (%)
People in Group quarters - Other workers' dormitories (%)
People in Group quarters - Crews of maritime vessels (%)
People in Group quarters - Other nonhousehold living situations (%)
People in Group quarters - Other noninstitutional group quarters (%)
Residents speaking English at home (%)
Residents speaking English at home - Born in the United States (%)
Residents speaking English at home - Native, born elsewhere (%)
Residents speaking English at home - Foreign born (%)
Residents speaking Spanish at home (%)
Residents speaking Spanish at home - Born in the United States (%)
Residents speaking Spanish at home - Native, born elsewhere (%)
Residents speaking Spanish at home - Foreign born (%)
Residents speaking other language at home (%)
Residents speaking other language at home - Born in the United States (%)
Residents speaking other language at home - Native, born elsewhere (%)
Residents speaking other language at home - Foreign born (%)
Class of Workers - Employee of private company (%)
Class of Workers - Self-employed in own incorporated business (%)
Class of Workers - Private not-for-profit wage and salary workers (%)
Class of Workers - Local government workers (%)
Class of Workers - State government workers (%)
Class of Workers - Federal government workers (%)
Class of Workers - Self-employed workers in own not incorporated business and Unpaid family workers (%)
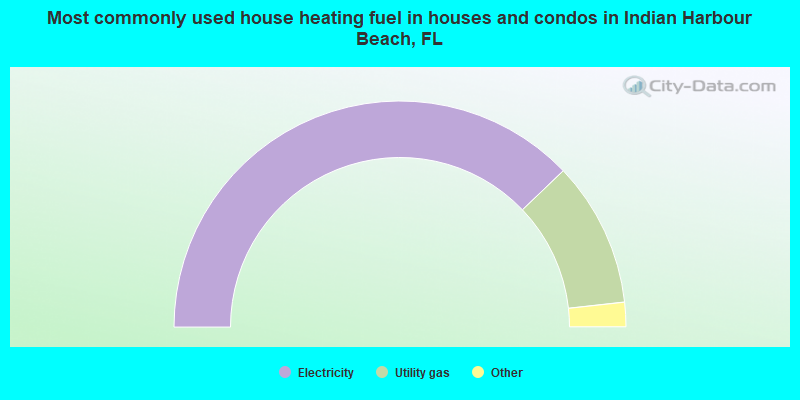
House heating fuel used in houses and condos - Utility gas (%)
House heating fuel used in houses and condos - Bottled, tank, or LP gas (%)
House heating fuel used in houses and condos - Electricity (%)
House heating fuel used in houses and condos - Fuel oil, kerosene, etc. (%)
House heating fuel used in houses and condos - Coal or coke (%)
House heating fuel used in houses and condos - Wood (%)
House heating fuel used in houses and condos - Solar energy (%)
House heating fuel used in houses and condos - Other fuel (%)
House heating fuel used in houses and condos - No fuel used (%)
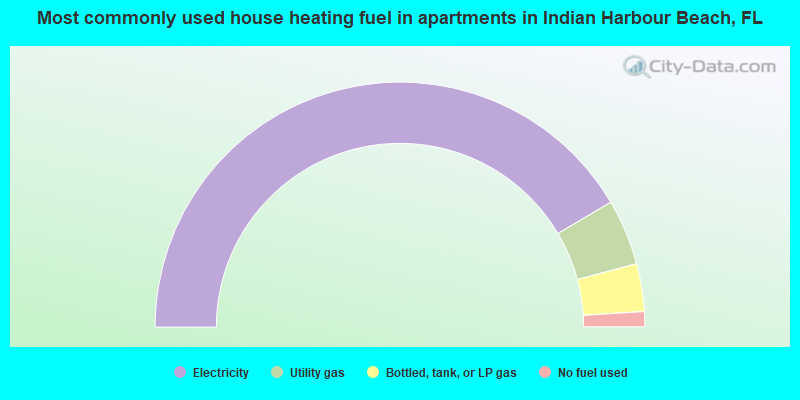
House heating fuel used in apartments - Utility gas (%)
House heating fuel used in apartments - Bottled, tank, or LP gas (%)
House heating fuel used in apartments - Electricity (%)
House heating fuel used in apartments - Fuel oil, kerosene, etc. (%)
House heating fuel used in apartments - Coal or coke (%)
House heating fuel used in apartments - Wood (%)
House heating fuel used in apartments - Solar energy (%)
House heating fuel used in apartments - Other fuel (%)
House heating fuel used in apartments - No fuel used (%)
Armed forces status - In Armed Forces (%)
Armed forces status - Civilian (%)
Armed forces status - Civilian - Veteran (%)
Armed forces status - Civilian - Nonveteran (%)
Fatal accidents locations in years 2005-2021
Fatal accidents locations in 2005
Fatal accidents locations in 2006
Fatal accidents locations in 2007
Fatal accidents locations in 2008
Fatal accidents locations in 2009
Fatal accidents locations in 2010
Fatal accidents locations in 2011
Fatal accidents locations in 2012
Fatal accidents locations in 2013
Fatal accidents locations in 2014
Fatal accidents locations in 2015
Fatal accidents locations in 2016
Fatal accidents locations in 2017
Fatal accidents locations in 2018
Fatal accidents locations in 2019
Fatal accidents locations in 2020
Fatal accidents locations in 2021
Alcohol use - People drinking some alcohol every month (%)
Alcohol use - People not drinking at all (%)
Alcohol use - Average days/month drinking alcohol
Alcohol use - Average drinks/week
Alcohol use - Average days/year people drink much
Audiometry - Average condition of hearing (%)
Audiometry - People that can hear a whisper from across a quiet room (%)
Audiometry - People that can hear normal voice from across a quiet room (%)
Audiometry - Ears ringing, roaring, buzzing (%)
Audiometry - Had a job exposure to loud noise (%)
Audiometry - Had off-work exposure to loud noise (%)
Blood Pressure & Cholesterol - Has high blood pressure (%)
Blood Pressure & Cholesterol - Checking blood pressure at home (%)
Blood Pressure & Cholesterol - Frequently checking blood cholesterol (%)
Blood Pressure & Cholesterol - Has high cholesterol level (%)
Consumer Behavior - Money monthly spent on food at supermarket/grocery store
Consumer Behavior - Money monthly spent on food at other stores
Consumer Behavior - Money monthly spent on eating out
Consumer Behavior - Money monthly spent on carryout/delivered foods
Consumer Behavior - Income spent on food at supermarket/grocery store (%)
Consumer Behavior - Income spent on food at other stores (%)
Consumer Behavior - Income spent on eating out (%)
Consumer Behavior - Income spent on carryout/delivered foods (%)
Current Health Status - General health condition (%)
Current Health Status - Blood donors (%)
Current Health Status - Has blood ever tested for HIV virus (%)
Current Health Status - Left-handed people (%)
Dermatology - People using sunscreen (%)
Diabetes - Diabetics (%)
Diabetes - Had a blood test for high blood sugar (%)
Diabetes - People taking insulin (%)
Diet Behavior & Nutrition - Diet health (%)
Diet Behavior & Nutrition - Milk product consumption (# of products/month)
Diet Behavior & Nutrition - Meals not home prepared (#/week)
Diet Behavior & Nutrition - Meals from fast food or pizza place (#/week)
Diet Behavior & Nutrition - Ready-to-eat foods (#/month)
Diet Behavior & Nutrition - Frozen meals/pizza (#/month)
Drug Use - People that ever used marijuana or hashish (%)
Drug Use - Ever used hard drugs (%)
Drug Use - Ever used any form of cocaine (%)
Drug Use - Ever used heroin (%)
Drug Use - Ever used methamphetamine (%)
Health Insurance - People covered by health insurance (%)
Kidney Conditions-Urology - Avg. # of times urinating at night
Medical Conditions - People with asthma (%)
Medical Conditions - People with anemia (%)
Medical Conditions - People with psoriasis (%)
Medical Conditions - People with overweight (%)
Medical Conditions - Elderly people having difficulties in thinking or remembering (%)
Medical Conditions - People who ever received blood transfusion (%)
Medical Conditions - People having trouble seeing even with glass/contacts (%)
Medical Conditions - People with arthritis (%)
Medical Conditions - People with gout (%)
Medical Conditions - People with congestive heart failure (%)
Medical Conditions - People with coronary heart disease (%)
Medical Conditions - People with angina pectoris (%)
Medical Conditions - People who ever had heart attack (%)
Medical Conditions - People who ever had stroke (%)
Medical Conditions - People with emphysema (%)
Medical Conditions - People with thyroid problem (%)
Medical Conditions - People with chronic bronchitis (%)
Medical Conditions - People with any liver condition (%)
Medical Conditions - People who ever had cancer or malignancy (%)
Mental Health - People who have little interest in doing things (%)
Mental Health - People feeling down, depressed, or hopeless (%)
Mental Health - People who have trouble sleeping or sleeping too much (%)
Mental Health - People feeling tired or having little energy (%)
Mental Health - People with poor appetite or overeating (%)
Mental Health - People feeling bad about themself (%)
Mental Health - People who have trouble concentrating on things (%)
Mental Health - People moving or speaking slowly or too fast (%)
Mental Health - People having thoughts they would be better off dead (%)
Oral Health - Average years since last visit a dentist
Oral Health - People embarrassed because of mouth (%)
Oral Health - People with gum disease (%)
Oral Health - General health of teeth and gums (%)
Oral Health - Average days a week using dental floss/device
Oral Health - Average days a week using mouthwash for dental problem
Oral Health - Average number of teeth
Pesticide Use - Households using pesticides to control insects (%)
Pesticide Use - Households using pesticides to kill weeds (%)
Physical Activity - People doing vigorous-intensity work activities (%)
Physical Activity - People doing moderate-intensity work activities (%)
Physical Activity - People walking or bicycling (%)
Physical Activity - People doing vigorous-intensity recreational activities (%)
Physical Activity - People doing moderate-intensity recreational activities (%)
Physical Activity - Average hours a day doing sedentary activities
Physical Activity - Average hours a day watching TV or videos
Physical Activity - Average hours a day using computer
Physical Functioning - People having limitations keeping them from working (%)
Physical Functioning - People limited in amount of work they can do (%)
Physical Functioning - People that need special equipment to walk (%)
Physical Functioning - People experiencing confusion/memory problems (%)
Physical Functioning - People requiring special healthcare equipment (%)
Prescription Medications - Average number of prescription medicines taking
Preventive Aspirin Use - Adults 40+ taking low-dose aspirin (%)
Reproductive Health - Vaginal deliveries (%)
Reproductive Health - Cesarean deliveries (%)
Reproductive Health - Deliveries resulted in a live birth (%)
Reproductive Health - Pregnancies resulted in a delivery (%)
Reproductive Health - Women breastfeeding newborns (%)
Reproductive Health - Women that had a hysterectomy (%)
Reproductive Health - Women that had both ovaries removed (%)
Reproductive Health - Women that have ever taken birth control pills (%)
Reproductive Health - Women taking birth control pills (%)
Reproductive Health - Women that have ever used Depo-Provera or injectables (%)
Reproductive Health - Women that have ever used female hormones (%)
Sexual Behavior - People 18+ that ever had sex (vaginal, anal, or oral) (%)
Sexual Behavior - Males 18+ that ever had vaginal sex with a woman (%)
Sexual Behavior - Males 18+ that ever performed oral sex on a woman (%)
Sexual Behavior - Males 18+ that ever had anal sex with a woman (%)
Sexual Behavior - Males 18+ that ever had any sex with a man (%)
Sexual Behavior - Females 18+ that ever had vaginal sex with a man (%)
Sexual Behavior - Females 18+ that ever performed oral sex on a man (%)
Sexual Behavior - Females 18+ that ever had anal sex with a man (%)
Sexual Behavior - Females 18+ that ever had any kind of sex with a woman (%)
Sexual Behavior - Average age people first had sex
Sexual Behavior - Average number of female sex partners in lifetime (males 18+)
Sexual Behavior - Average number of female vaginal sex partners in lifetime (males 18+)
Sexual Behavior - Average age people first performed oral sex on a woman (18+)
Sexual Behavior - Average number of woman performed oral sex on in lifetime (18+)
Sexual Behavior - Average number of male sex partners in lifetime (males 18+)
Sexual Behavior - Average number of male anal sex partners in lifetime (males 18+)
Sexual Behavior - Average age people first performed oral sex on a man (18+)
Sexual Behavior - Average number of male oral sex partners in lifetime (18+)
Sexual Behavior - People using protection when performing oral sex (%)
Sexual Behavior - Average number of times people have vaginal or anal sex a year
Sexual Behavior - People having sex without condom (%)
Sexual Behavior - Average number of male sex partners in lifetime (females 18+)
Sexual Behavior - Average number of male vaginal sex partners in lifetime (females 18+)
Sexual Behavior - Average number of female sex partners in lifetime (females 18+)
Sexual Behavior - Circumcised males 18+ (%)
Sleep Disorders - Average hours sleeping at night
Sleep Disorders - People that has trouble sleeping (%)
Smoking-Cigarette Use - People smoking cigarettes (%)
Taste & Smell - People 40+ having problems with smell (%)
Taste & Smell - People 40+ having problems with taste (%)
Taste & Smell - People 40+ that ever had wisdom teeth removed (%)
Taste & Smell - People 40+ that ever had tonsils teeth removed (%)
Taste & Smell - People 40+ that ever had a loss of consciousness because of a head injury (%)
Taste & Smell - People 40+ that ever had a broken nose or other serious injury to face or skull (%)
Taste & Smell - People 40+ that ever had two or more sinus infections (%)
Weight - Average height (inches)
Weight - Average weight (pounds)
Weight - Average BMI
Weight - People that are obese (%)
Weight - People that ever were obese (%)
Weight - People trying to lose weight (%)
Officers per 1,000 residents here:
2.34Florida average:
2.33
Latest news from Indian Harbour Beach, FL collected exclusively by city-data.com from local newspapers, TV, and radio stations
Ancestries: American (21.9%), Irish (16.9%), English (13.2%), German (5.4%), European (4.5%), Italian (3.5%).
Current Local Time:
Land area: 2.14 square miles.
Population density: 4,205 people per square mile (average).
497 residents are foreign born (1.9% Europe , 1.3% Latin America , 1.3% Asia ).
This city:
5.4%Florida:
21.1%
Median real estate property taxes paid for housing units with mortgages in 2022: $3,006 (0.7%)Median real estate property taxes paid for housing units with no mortgage in 2022: $3,109 (0.8%)
Nearest city with pop. 50,000+: Melbourne, FL
Nearest city with pop. 200,000+: Tampa, FL
Nearest city with pop. 1,000,000+: Philadelphia, PA
Nearest cities:
Latitude: 28.15 N, Longitude: 80.60 W
Daytime population change due to commuting: -943 (-10.2%)Workers who live and work in this city: 843 (22.5%)
Area code commonly used in this area: 321
Property values in Indian Harbour Beach, FL
Single-family new house construction building permits:
2020: 3 buildings , average cost: $472,3002019: 1 building , cost: $284,0002018: 8 buildings , average cost: $292,7002017: 17 buildings , average cost: $289,4002016: 1 building , cost: $320,0002015: 1 building , cost: $320,0002014: 3 buildings , average cost: $466,1002013: 1 building , cost: $250,0002012: 5 buildings , average cost: $574,1002011: 3 buildings , average cost: $683,3002010: 2 buildings , average cost: $897,8002008: 2 buildings , average cost: $650,0002007: 12 buildings , average cost: $170,5002006: 6 buildings , average cost: $241,0002005: 51 buildings , average cost: $219,2002004: 3 buildings , average cost: $401,9002003: 8 buildings , average cost: $214,3002002: 14 buildings , average cost: $331,2002001: 21 buildings , average cost: $501,4002000: 33 buildings , average cost: $222,6001999: 47 buildings , average cost: $221,4001998: 16 buildings , average cost: $363,8001997: 42 buildings , average cost: $230,400Unemployment in December 2023:
Population change in the 1990s: +982 (+13.7%).
Most common occupations in Indian Harbour Beach, FL (%)
Both Males Females
Other sales and related occupations, including supervisors (6.5%)
Computer specialists (6.3%)
Other management occupations, except farmers and farm managers (6.1%)
Engineers (4.3%)
Retail sales workers, except cashiers (3.4%)
Sales representatives, services, wholesale and manufacturing (3.4%)
Preschool, kindergarten, elementary, and middle school teachers (3.3%)
Computer specialists (8.2%)
Other management occupations, except farmers and farm managers (7.3%)
Other sales and related occupations, including supervisors (6.4%)
Engineers (5.0%)
Top executives (4.0%)
Sales representatives, services, wholesale and manufacturing (3.9%)
Material recording, scheduling, dispatching, and distributing workers (3.1%)
Other sales and related occupations, including supervisors (6.7%)
Preschool, kindergarten, elementary, and middle school teachers (6.5%)
Secretaries and administrative assistants (6.3%)
Registered nurses (5.7%)
Other management occupations, except farmers and farm managers (4.6%)
Information and record clerks, except customer service representatives (4.0%)
Computer specialists (3.9%)
Tornado activity:
Indian Harbour Beach-area historical tornado activity is slightly below Florida state average. It is 9% smaller than the overall U.S. average.
On 4/4/1966, a category F4 (max. wind speeds 207-260 mph) tornado 19.8 miles away from the Indian Harbour Beach city center killed 11 people and injured 530 people and caused between $5,000,000 and $50,000,000 in damages.
On 6/19/1972, a category F3 (max. wind speeds 158-206 mph) tornado 15.7 miles away from the city center caused between $500,000 and $5,000,000 in damages.
Earthquake activity:
Indian Harbour Beach-area historical earthquake activity is significantly above Florida state average. It is 91% smaller than the overall U.S. average. On 9/10/2006 at 14:56:08, a magnitude 5.9 (5.9 MB, 5.5 MS, 5.8 MW, Class: Moderate, Intensity: VI - VII) earthquake occurred 393.8 miles away from the city center On 6/23/2016 at 17:20:29, a magnitude 3.8 (3.8 ML, Class: Light, Intensity: II - III) earthquake occurred 145.1 miles away from the city center On 9/21/2016 at 16:30:52, a magnitude 3.8 (3.8 ML) earthquake occurred 148.4 miles away from Indian Harbour Beach center On 9/4/2016 at 18:29:29, a magnitude 3.8 (3.8 ML) earthquake occurred 148.7 miles away from Indian Harbour Beach center On 7/16/2016 at 20:00:10, a magnitude 3.7 (3.7 MB) earthquake occurred 131.8 miles away from Indian Harbour Beach center On 6/10/2016 at 17:10:48, a magnitude 3.7 (3.7 MB) earthquake occurred 142.3 miles away from Indian Harbour Beach center Magnitude types: body-wave magnitude (MB), local magnitude (ML), surface-wave magnitude (MS), moment magnitude (MW) Natural disasters: The number of natural disasters in Brevard County (27) is a lot greater than the US average (15).Major Disasters (Presidential) Declared: 14Emergencies Declared: 6Hurricanes: 15, Fires: 6, Tropical Storms: 5, Tornadoes: 2, Flood: 1, Heavy Rain: 1, Other: 1 (Note: some incidents may be assigned to more than one category). Hospitals and medical centers near Indian Harbour Beach: VNA SPACE COAST INC (Home Health Center, about 4 miles away; MELBOURNE, FL)
OMNI HOME CARE (Home Health Center, about 4 miles away; MELBOURNE, FL)
FAMILY HOME HEALTH SERVICES (Home Health Center, about 5 miles away; MELBOURNE, FL)
PALM BAY SURGICAL CENTER (Hospital, about 5 miles away; MELBOURNE, FL)
PRN HOME CARE, INC. (Home Health Center, about 5 miles away; MELBOURNE, FL)
LIFE CARE CENTER OF MELBOURNE (Nursing Home, about 5 miles away; MELBOURNE, FL)
FL CONVALESCENT HOME (Nursing Home, about 5 miles away; MELBOURNE, FL)
Colleges/universities with over 2000 students nearest to Indian Harbour Beach:
Florida Institute of Technology-Online (about 7 miles; Melbourne, FL ; Full-time enrollment: 3,046)
Florida Institute of Technology (about 7 miles; Melbourne, FL ; FT enrollment: 4,452)
Eastern Florida State College (about 19 miles; Cocoa, FL ; FT enrollment: 12,053)
Florida Technical College (about 47 miles; Orlando, FL ; FT enrollment: 4,907)
University of Central Florida (about 49 miles; Orlando, FL ; FT enrollment: 51,457)
Indian River State College (about 53 miles; Fort Pierce, FL ; FT enrollment: 12,211)
Full Sail University (about 53 miles; Winter Park, FL ; FT enrollment: 31,435)
Public elementary/middle school in Indian Harbour Beach: OCEAN BREEZE ELEMENTARY SCHOOL Location: 1101 CHEYENNE DR, Grades: PK-6)
Private elementary/middle schools in Indian Harbour Beach: INDIAN HARBOUR MONTESSORI Students: 150, Location: 1230 BANANA RIVER DR, Grades: PK-6)
ESPECIALLY FOR CHILDREN Students: 148, Location: 1230 BANANA RIVER DR, Grades: PK-6)
User-submitted facts and corrections:
Indian Harbour Beach was suffered damage from Hurricane David (Called the Labor Day Storm) in September 0f 1979. This hurricane was the first hurricane using a man's name.
Brevard County has a predicted average indoor radon screening level less than 2 pCi/L (pico curies per liter) - Low Potential Drinking water stations with addresses in Indian Harbour Beach and their reported violations in the past:
SILVER PICK WATER (Serves CO, Population served: 122, Groundwater):
Past monitoring violations:
One regular monitoring violation
Average household size: This city:
2.1 peopleFlorida:
2.5 people
Percentage of family households: This city:
60.4%Whole state:
65.2%
Percentage of households with unmarried partners: This city:
6.2%Whole state:
7.3%
Likely homosexual households (counted as self-reported same-sex unmarried-partner households)
Lesbian couples: 0.2% of all households Gay men: 0.3% of all households
Banks with branches in Indian Harbour Beach (2011 data):
Wells Fargo Bank, National Association: Indian Harbour Beach Branch at 200 East Eau Gallie Blvd, branch established on 1979/12/19. Info updated 2011/04/05: Bank assets: $1,161,490.0 mil, Deposits: $905,653.0 mil, headquarters in Sioux Falls, SD, positive income , 6395 total offices , Holding Company: Wells Fargo & Company
JPMorgan Chase Bank, National Association: Indian Harbour Beach Branch at 1922 Highway A1a, branch established on 1933/01/01. Info updated 2011/11/10: Bank assets: $1,811,678.0 mil, Deposits: $1,190,738.0 mil, headquarters in Columbus, OH, positive income , International Specialization, 5577 total offices , Holding Company: Jpmorgan Chase & Co.
Regions Bank: Indian Harbour Beache Branch at 191 E. Eau Gallie Blvd, branch established on 2007/12/17. Info updated 2011/02/24: Bank assets: $123,368.2 mil, Deposits: $98,301.3 mil, headquarters in Birmingham, AL, positive income , Commercial Lending Specialization, 1778 total offices , Holding Company: Regions Financial Corporation
Branch Banking and Trust Company: Causeway Branch at 450 E. Eau Gallie Boulevard, branch established on 1934/12/01. Info updated 2010/03/29: Bank assets: $168,867.6 mil, Deposits: $127,549.5 mil, headquarters in Winston Salem, NC, positive income , Commercial Lending Specialization, 1793 total offices , Holding Company: Bb&T Corporation
Bank of America, National Association: Indian Harbour Branch at 202 East Eau Gallie Boulevard, branch established on 1983/04/18. Info updated 2009/11/18: Bank assets: $1,451,969.3 mil, Deposits: $1,077,176.8 mil, headquarters in Charlotte, NC, positive income , 5782 total offices , Holding Company: Bank Of America Corporation
For population 15 years and over in Indian Harbour Beach:
Never married: 26.5%Now married: 56.4%Separated: 0.5%Widowed: 5.1%Divorced: 11.4% For population 25 years and over in Indian Harbour Beach:
High school or higher: 98.0%Bachelor's degree or higher: 50.4%Graduate or professional degree: 23.8%Unemployed: 3.8%Mean travel time to work (commute): 22.9 minutes
Education Gini index (Inequality in education) Here:
10.0Florida average:
12.2
Religion statistics for Indian Harbour Beach, FL (based on Brevard County data)
Religion Adherents Congregations Evangelical Protestant 75,893 265 Catholic 64,831 14 Mainline Protestant 30,877 64 Other 11,113 41 Black Protestant 5,449 25 Orthodox 1,267 5 None 353,946 -
Source: Clifford Grammich, Kirk Hadaway, Richard Houseal, Dale E.Jones, Alexei Krindatch, Richie Stanley and Richard H.Taylor. 2012. 2010 U.S.Religion Census: Religious Congregations & Membership Study. Association of Statisticians of American Religious Bodies. Jones, Dale E., et al. 2002. Congregations and Membership in the United States 2000. Nashville, TN: Glenmary Research Center. Graphs represent county-level data
Food Environment Statistics: Number of grocery stores : 81Brevard County :
1.51 / 10,000 pop.Florida :
2.04 / 10,000 pop.
Number of supercenters and club stores : 9Brevard County :
0.17 / 10,000 pop.Florida :
0.11 / 10,000 pop.
Number of convenience stores (no gas) : 75Brevard County :
1.40 / 10,000 pop.Florida :
1.28 / 10,000 pop.
Number of convenience stores (with gas) : 186Brevard County :
3.48 / 10,000 pop.Florida :
3.04 / 10,000 pop.
Number of full-service restaurants : 407Brevard County :
7.61 / 10,000 pop.Florida :
7.45 / 10,000 pop.
Adult obesity rate : Brevard County :
23.3%Florida :
23.7%
Low-income preschool obesity rate : Health and Nutrition: Healthy diet rate : Indian Harbour Beach:
57.0%Florida:
51.4%
Average overall health of teeth and gums : This city:
55.6%State:
49.4%
Average BMI : Indian Harbour Beach:
28.1Florida:
28.6
People feeling badly about themselves : People not drinking alcohol at all : Indian Harbour Beach:
8.2%Florida:
10.7%
Average hours sleeping at night : Overweight people : Indian Harbour Beach:
35.9%Florida:
34.7%
General health condition : Average condition of hearing : Indian Harbour Beach:
78.1%Florida:
79.2%
More about Health and Nutrition of Indian Harbour Beach, FL Residents
Local government employment and payroll (March 2022)
Function
Full-time employees
Monthly full-time payroll
Average yearly full-time wage
Part-time employees
Monthly part-time payroll
Police Protection - Officers
20 $102,809 $61,685 0 $0 Streets and Highways
13 $54,197 $50,028 0 $0 Police - Other
8 $31,693 $47,540 4 $3,829 Parks and Recreation
5 $23,121 $55,490 13 $8,178 Financial Administration
4 $23,736 $71,208 1 $1,820 Other and Unallocable
3 $19,671 $78,684 0 $0 Other Government Administration
3 $25,307 $101,228 0 $0
Totals for Government
56 $280,535 $60,115 18 $13,827
Indian Harbour Beach government finances - Expenditure in 2017 (per resident):
Construction - General - Other: $1,562,000 ($173.61)
Regular Highways: $717,000 ($79.69)Current Operations - Police Protection: $2,926,000 ($325.22)
Regular Highways: $1,067,000 ($118.60)Parks and Recreation: $709,000 ($78.80)Central Staff Services: $451,000 ($50.13)Financial Administration: $320,000 ($35.57)General - Other: $302,000 ($33.57)Protective Inspection and Regulation - Other: $281,000 ($31.23)Local Fire Protection: $162,000 ($18.01)Judicial and Legal Services: $39,000 ($4.33)Other Capital Outlay - Parks and Recreation: $1,481,000 ($164.61)
Police Protection: $133,000 ($14.78)Local Fire Protection: $112,000 ($12.45)Financial Administration: $35,000 ($3.89)Protective Inspection and Regulation - Other: $2,000 ($0.22)
Indian Harbour Beach government finances - Revenue in 2017 (per resident):
Charges - Parks and Recreation: $177,000 ($19.67)
Natural Resources - Other: $22,000 ($2.45)Other: $18,000 ($2.00)Regular Highways: $18,000 ($2.00)Local Intergovernmental - General Local Government Support: $8,000 ($0.89)
Other: $2,000 ($0.22)Miscellaneous - Special Assessments: $232,000 ($25.79)
General Revenue - Other: $67,000 ($7.45)Interest Earnings: $58,000 ($6.45)Fines and Forfeits: $14,000 ($1.56)Donations From Private Sources: $10,000 ($1.11)State Intergovernmental - General Local Government Support: $699,000 ($77.69)
Sewerage: $25,000 ($2.78)Highways: $3,000 ($0.33)Tax - Property: $3,925,000 ($436.26)
Public Utilities Sales: $850,000 ($94.48)Occupation and Business License - Other: $623,000 ($69.25)Other Selective Sales: $369,000 ($41.01)Other License: $127,000 ($14.12)Insurance Premiums Sales: $70,000 ($7.78)
Indian Harbour Beach government finances - Cash and Securities in 2017 (per resident):
Other Funds - Cash and Securities: $10,034,000 ($1115.26)
7.86% of this county's 2021 resident taxpayers lived in other counties in 2020 ($76,050 average adjusted gross income )
Here:
7.86%Florida average:
8.80%
0.06% of residents moved from foreign countries ($493 average AGI )Brevard County:
0.06%Florida average:
0.05%
Top counties from which taxpayers relocated into this county between 2020 and 2021:
5.62% of this county's 2020 resident taxpayers moved to other counties in 2021 ($62,226 average adjusted gross income )
Here:
5.62%Florida average:
7.45%
0.05% of residents moved to foreign countries ($434 average AGI )Brevard County:
0.05%Florida average:
0.04%
Top counties to which taxpayers relocated from this county between 2020 and 2021:
Businesses in Indian Harbour Beach, FL
Name Count Name Count
DHL 1 Office Depot 1 FedEx 1 Panera Bread 1 H&R Block 1 Publix Super Markets 1 Lowe's 1 Tire Kingdom 1 Nike 1 UPS 1
Strongest AM radio stations in Indian Harbour Beach:
WMEL (920 AM; 5 kW; MELBOURNE, FL; Owner: TWIN TOWERS BROADCASTING INC.)
WINT (1560 AM; daytime; 5 kW; MELBOURNE, FL; Owner: CUMULUS LICENSING CORP.)
WMMB (1240 AM; 1 kW; MELBOURNE, FL; Owner: CAPSTAR TX LIMITED PARTNERSHIP)
WIXC (1060 AM; 50 kW; TITUSVILLE, FL; Owner: GENESIS COMMUNICATIONS I, INC.)
WONQ (1030 AM; 45 kW; OVIEDO, FL; Owner: FLORIDA BROADCASTERS)
WFLF (540 AM; 50 kW; PINE HILLS, FL; Owner: CLEAR CHANNEL BROADCASTING LICENSES, INC.)
WHOO (1080 AM; daytime; 35 kW; KISSIMMEE, FL; Owner: GENESIS COMMUNICATIONS I, INC.)
WDYZ (990 AM; 50 kW; ORLANDO, FL; Owner: ABC, INC.)
WQTM (740 AM; 50 kW; ORLANDO, FL; Owner: CLEAR CHANNEL BROADCASTING LICENSES, INC.)
WTIR (1300 AM; 5 kW; COCOA BEACH, FL; Owner: RAMA COMMUNICATIONS, INC.)
WFTL (850 AM; 50 kW; WEST PALM BEACH, FL; Owner: JAMES CRYSTAL ENTERPRISES II, L.L.C.)
WQYK (1010 AM; 50 kW; SEFFNER, FL; Owner: INFINITY BROADCASTING CORPORATION OF TAMPA)
WJNA (640 AM; 38 kW; ROYAL PALM BEACH, FL; Owner: SOUTH FLORIDA RADIO, INC.)
Strongest FM radio stations in Indian Harbour Beach:
WBVD (95.1 FM; MELBOURNE, FL; Owner: CAPSTAR TX LIMITED PARTNERSHIP)
WAOA-FM (107.1 FM; MELBOURNE, FL; Owner: CUMULUS LICENSING CORP.)
WCIF (106.3 FM; MELBOURNE, FL; Owner: FIRST BAPTIST CHURCH, INC.)
WEJF (90.3 FM; PALM BAY, FL; Owner: FLORIDA PUBLIC RADIO, INC.)
WLRQ-FM (99.3 FM; COCOA, FL; Owner: CAPSTAR TX LIMITED PARTNERSHIP)
W227AF (93.3 FM; MELBOURNE, FL; Owner: CENTRAL EDUCATIONAL BROADCASTING, INC.)
W232AZ (94.3 FM; MELBOURNE, FL; Owner: BLACK MEDIA WORKS, INC.)
WFIT (89.5 FM; MELBOURNE, FL; Owner: THE FLORIDA INSTITUTE OF TECHNOLOGY)
WHTQ (96.5 FM; ORLANDO, FL; Owner: COX RADIO, INC.)
WJRR (101.1 FM; COCOA BEACH, FL; Owner: CLEAR CHANNEL BROADCASTING LICENSES, INC.)
WSHE (100.3 FM; ORLANDO, FL; Owner: CLEAR CHANNEL BROADCASTING LICENSES, INC.)
WTKS-FM (104.1 FM; COCOA BEACH, FL; Owner: CLEAR CHANNEL BROADCASTING LICENSES, INC.)
WWKA (92.3 FM; ORLANDO, FL; Owner: COX RADIO, INC.)
WHKR (102.7 FM; ROCKLEDGE, FL; Owner: CUMULUS LICENSING CORP.)
WOMX-FM (105.1 FM; ORLANDO, FL; Owner: INFINITY RADIO OPERATIONS INC.)
WPOZ (88.3 FM; UNION PARK, FL; Owner: CENTRAL FLORIDA EDUCATIONAL FOUNDATION, INC.)
WSJZ-FM (95.9 FM; SEBASTIAN, FL; Owner: SEBASTIAN BROADCASTING COMPANY)
WWIA (88.5 FM; PALM BAY, FL; Owner: VICTORY CHRISTIAN ACADEMY)
WGNX (99.7 FM; VERO BEACH, FL; Owner: VERO BEACH FM RADIO PARTNERSHIP)
WCEE-LP (93.1 FM; MELBOURNE, FL; Owner: BREVARD YOUTH EDUCATION BROADCASTING CORPORATION)
TV broadcast stations around Indian Harbour Beach:
W46DB (Channel 46; MELBOURNE, FL; Owner: ENTRAVISION HOLDINGS, LLC)
WMVJ-LP (Channel 29; MELBOURNE, FL; Owner: TIGER EYE BROADCASTING CORPORATION)
W26BN (Channel 26; MELBOURNE, FL; Owner: WIRELESS BROADBAND SERVICES/AMERICA)
W59CX (Channel 59; MELBOURNE, FL; Owner: THREE ANGELS BROADCASTING NETWORK, INC.)
WTGL-TV (Channel 52; COCOA, FL; Owner: GOOD LIFE BROADCASTING, INC.)
WBCC (Channel 68; COCOA, FL; Owner: BREVARD COMMUNITY COLLEGE)
WRDQ (Channel 27; ORLANDO, FL; Owner: WFTV-TV HOLDINGS, INC.)
WSCF-LP (Channel 31; MELBOURNE, FL; Owner: JAMES J. CHLADEK)
WOTF (Channel 43; MELBOURNE, FL; Owner: TELEFUTURA ORLANDO, INC.)
WFTV (Channel 9; ORLANDO, FL; Owner: WFTV-TV HOLDINGS, INC.)
WOPX (Channel 56; MELBOURNE, FL; Owner: PAXSON ORLANDO LICENSE, INC.)
W16AJ (Channel 16; MELBOURNE, ETC., FL; Owner: ORLANDO HEARST-ARGYLE TELEVISION, INC.)
W04CN (Channel 4; COCOA, ETC., FL; Owner: EMMIS TELEVISION LICENSE CORPORATION)
WACX (Channel 55; LEESBURG, FL; Owner: ASSOCIATED CHRISTIAN TELEVISION SYSTEM, INC.)
WKCF (Channel 18; CLERMONT, FL; Owner: EMMIS TELEVISION LICENSE CORPORATION)
WLCB-TV (Channel 45; LEESBURG, FL; Owner: GOOD LIFE BROADCASTING, INC.)
WKMG-TV (Channel 6; ORLANDO, FL; Owner: POST-NEWSWEEK STATIONS ORLANDO, INC.)
WRBW (Channel 65; ORLANDO, FL; Owner: FOX TELEVISION STATIONS, INC.)
WZXZ-CA (Channel 11; ORLANDO, ETC., FL; Owner: THE BOX WORLDWIDE LLC)
WOFL (Channel 35; ORLANDO, FL; Owner: FOX TELEVISION STATIONS, INC.)
WMFE-TV (Channel 24; ORLANDO, FL; Owner: COMMUNITY COMMUNICATIONS, INC.)
National Bridge Inventory (NBI) Statistics 2 Number of bridges151ft / 45.6m Total length $254,000 Total costs39,069 Total average daily traffic1,850 Total average daily truck traffic66,298 Total future (year 2042) average daily traffic
FCC Registered Antenna Towers: 7
Joseph Zrallack, Algonquin Sports Complex Crespino Ct (Lat: 28.156750 Lon: -80.592417), Type: 82.3, Structure height: 12009 m, Overall height: 76.2 m, Registrant: County Of Brevard, Lizzet.Ruiz@brevardcounty.Us, , Rockl-edge, Phone: (321) 637-4074 Joseph Zrallack, Algonquin Sports Complex Crespino Ct (Lat: 28.156750 Lon: -80.592417), Type: 82.3, Structure height: 12009 m, Overall height: 76.2 m, Registrant: County Of Brevard, Lizzet.Ruiz@brevardcounty.Us, , Rockl-edge, Phone: (321) 637-4074 Joseph Zrallack, Algonquin Sports Complex Crespino Ct (Lat: 28.156750 Lon: -80.592417), Type: 82.3, Structure height: 12009 m, Overall height: 76.2 m, Licensee ID: G, Registrant: County Of Brevard, Lizzet.Ruiz@brevardcounty.Us, , Rockl-edge, Phone: (321) 637-4074 Lizzet Ruiz, Algonquin Sports Complex Crespino Ct (Lat: 28.156750 Lon: -80.592417), Type: 82.3, Structure height: 12009 m, Overall height: 76.2 m, Registrant: County Of Brevard, Lizzet.Ruiz@brevardcounty.Us, , Rockl-edge, Phone: (321) 637-4074 Joseph Zrallack, Algonquin Sports Complex Crespino Ct (Lat: 28.156750 Lon: -80.592417), Type: 82.3, Structure height: 12009 m, Overall height: 76.2 m, Registrant: County Of Brevard, Lizzet.Ruiz@brevardcounty.Us, , Rockl-edge, Phone: (321) 637-4074 Joseph Zrallack, Algonquin Sports Complex Crespino Ct (Lat: 28.156750 Lon: -80.592417), Type: 82.3, Structure height: 12009 m, Overall height: 76.2 m, Registrant: County Of Brevard, Lizzet.Ruiz@brevardcounty.Us, , Rockl-edge, Phone: (321) 637-4074 Joseph Zrallack, Algonquin Sports Complex Crespino Ct (Lat: 28.156750 Lon: -80.592417), Type: 82.3, Structure height: 12009 m, Overall height: 76.2 m, Registrant: County Of Brevard, Lizzet.Ruiz@brevardcounty.Us, , Rockl-edge, Phone: (321) 637-4074 FCC Registered Broadcast Land Mobile Towers: 3
40 Cheyenne Ct (Lat: 28.143611 Lon: -80.594778), Call Sign: KIC401, Assigned Frequencies: 154.160 MHz, Grant Date: 12/31/1996, Expiration Date: 03/09/2002, Cancellation Date: 05/12/2002, Registrant: City Of Indian Harbour Beach, 40 Cheyenne Ct, Indian Harbour Beach, FL 32937, Phone: (407) 773-3030 40 Cheyenne Court City Hall Bldg (Lat: 28.143611 Lon: -80.594778), Call Sign: KGP780, Assigned Frequencies: 453.200 MHz, Grant Date: 05/21/1996, Expiration Date: 08/05/2001, Cancellation Date: 10/07/2001, Registrant: City Of Indian Harbour Beach, 40 Cheyenne Court, Indian Harbour, FL 32937, Phone: (407) 773-3030 40 Cheyenne (Lat: 28.143611 Lon: -80.594778), Call Sign: KGP781, Assigned Frequencies: 154.950 MHz, 155.370 MHz, 154.950 MHz, 155.370 MHz, Grant Date: 11/04/1997, Expiration Date: 12/16/2002, Cancellation Date: 08/09/2002, Registrant: City Of Indian Harbour Beach, 40 Cheyenne Court, Indian Harbour Beach, FL 32937 FCC Registered Maritime Coast & Aviation Ground Towers: 3
1399 Banana River Dr (Lat: 28.149722 Lon: -80.603111), Type: Building, Overall height: 10 m, Call Sign: WHW203, Licensee ID: L00694522, Assigned Frequencies: 156.425 MHz, 156.450 MHz, 156.800 MHz, Grant Date: 06/21/2003, Expiration Date: 07/02/2013, Cancellation Date: 09/07/2013, Registrant: Telemar, Inc, 1399 Banana River Dr, Indian Harbour Beach, FL 32937 Mathers Bridge (Lat: 28.149167 Lon: -80.605889), Type: Tower, Call Sign: WHW241, Assigned Frequencies: 156.425 MHz, 156.650 MHz, 156.800 MHz, 156.450 MHz, Grant Date: 10/27/2015, Expiration Date: 01/11/2026, Registrant: Brevard County Emergency Management, 1746 Cedar Street, Rockledge, FL 32955, Phone: (321) 637-4081, Fax: (321) 633-1738, Email:
100 Datura Dr (Lat: 28.135278 Lon: -80.600056), Type: Building, Overall height: 4 m, Call Sign: WHX850, Licensee ID: L00006134, Assigned Frequencies: 156.450 MHz, 156.575 MHz, 156.800 MHz, Grant Date: 05/15/2004, Expiration Date: 06/08/2014, Cancellation Date: 08/09/2014, Registrant: Eau Gallie Yacht Club, 100 Datura Dr, Indian Harbour Beach, FL 32937, Phone: (321) 773-2600, Fax: (321) 773-6020 FCC Registered Amateur Radio Licenses: 92 (
See the full list of FCC Registered Amateur Radio Licenses in Indian Harbour Beach )
Home Mortgage Disclosure Act Aggregated Statistics For Year 2009(Based on 2 full tracts) A) FHA, FSA/RHS & VA B) Conventional C) Refinancings D) Home Improvement Loans F) Non-occupant Loans on G) Loans On Manufactured Number Average Value Number Average Value Number Average Value Number Average Value Number Average Value Number Average Value
LOANS ORIGINATED 23 $164,970 54 $251,173 112 $212,967 1 $137,550 27 $184,267 1 $417,000 APPLICATIONS APPROVED, NOT ACCEPTED 1 $140,000 7 $276,909 16 $216,656 0 $0 6 $190,733 0 $0 APPLICATIONS DENIED 8 $118,229 10 $388,282 55 $212,050 6 $427,523 11 $221,056 0 $0 APPLICATIONS WITHDRAWN 3 $158,043 15 $401,751 21 $174,902 1 $1,404,140 5 $143,918 0 $0 FILES CLOSED FOR INCOMPLETENESS 3 $145,850 4 $550,092 5 $143,854 0 $0 0 $0 0 $0
Aggregated Statistics For Year 2008(Based on 2 full tracts) A) FHA, FSA/RHS & VA B) Conventional C) Refinancings D) Home Improvement Loans E) Loans on Dwellings For 5+ Families F) Non-occupant Loans on G) Loans On Manufactured Number Average Value Number Average Value Number Average Value Number Average Value Number Average Value Number Average Value Number Average Value
LOANS ORIGINATED 25 $184,379 64 $184,157 57 $196,411 8 $92,140 1 $3,500,000 36 $169,806 1 $157,000 APPLICATIONS APPROVED, NOT ACCEPTED 0 $0 11 $196,211 18 $184,416 6 $64,737 0 $0 5 $227,720 0 $0 APPLICATIONS DENIED 5 $146,496 16 $380,498 50 $293,573 8 $58,218 0 $0 13 $163,462 0 $0 APPLICATIONS WITHDRAWN 2 $137,915 12 $209,644 25 $227,420 0 $0 0 $0 6 $228,597 0 $0 FILES CLOSED FOR INCOMPLETENESS 0 $0 0 $0 7 $207,279 0 $0 0 $0 1 $219,700 0 $0
Aggregated Statistics For Year 2007(Based on 2 full tracts) A) FHA, FSA/RHS & VA B) Conventional C) Refinancings D) Home Improvement Loans E) Loans on Dwellings For 5+ Families F) Non-occupant Loans on Number Average Value Number Average Value Number Average Value Number Average Value Number Average Value Number Average Value
LOANS ORIGINATED 8 $202,382 115 $302,294 147 $210,602 17 $206,214 0 $0 53 $235,593 APPLICATIONS APPROVED, NOT ACCEPTED 0 $0 18 $232,251 33 $341,187 4 $24,782 0 $0 5 $170,108 APPLICATIONS DENIED 1 $192,000 26 $338,755 88 $312,661 10 $82,074 1 $3,640,000 22 $207,625 APPLICATIONS WITHDRAWN 0 $0 8 $219,222 48 $252,505 4 $47,462 0 $0 11 $249,460 FILES CLOSED FOR INCOMPLETENESS 0 $0 5 $173,274 14 $260,957 0 $0 0 $0 2 $138,025
Aggregated Statistics For Year 2006(Based on 2 full tracts) A) FHA, FSA/RHS & VA B) Conventional C) Refinancings D) Home Improvement Loans E) Loans on Dwellings For 5+ Families F) Non-occupant Loans on G) Loans On Manufactured Number Average Value Number Average Value Number Average Value Number Average Value Number Average Value Number Average Value Number Average Value
LOANS ORIGINATED 3 $252,253 163 $269,536 176 $210,994 24 $143,202 2 $210,230 82 $230,324 0 $0 APPLICATIONS APPROVED, NOT ACCEPTED 0 $0 23 $277,110 49 $191,873 5 $28,970 0 $0 9 $261,828 0 $0 APPLICATIONS DENIED 1 $184,350 20 $244,290 68 $280,527 14 $64,991 0 $0 15 $283,030 2 $48,715 APPLICATIONS WITHDRAWN 0 $0 20 $262,436 62 $259,679 5 $148,904 0 $0 9 $324,248 0 $0 FILES CLOSED FOR INCOMPLETENESS 0 $0 5 $302,724 16 $237,244 0 $0 0 $0 2 $245,065 0 $0
Aggregated Statistics For Year 2005(Based on 2 full tracts) A) FHA, FSA/RHS & VA B) Conventional C) Refinancings D) Home Improvement Loans F) Non-occupant Loans on G) Loans On Manufactured Number Average Value Number Average Value Number Average Value Number Average Value Number Average Value Number Average Value
LOANS ORIGINATED 1 $183,400 268 $267,574 281 $215,876 24 $163,174 146 $218,340 0 $0 APPLICATIONS APPROVED, NOT ACCEPTED 0 $0 24 $318,678 40 $268,017 5 $126,678 20 $222,230 0 $0 APPLICATIONS DENIED 0 $0 41 $248,941 78 $213,381 15 $114,088 24 $234,228 2 $73,550 APPLICATIONS WITHDRAWN 0 $0 43 $202,417 84 $203,115 16 $137,271 21 $230,284 0 $0 FILES CLOSED FOR INCOMPLETENESS 0 $0 9 $186,264 11 $203,242 0 $0 7 $209,326 0 $0
Aggregated Statistics For Year 2004(Based on 2 full tracts) A) FHA, FSA/RHS & VA B) Conventional C) Refinancings D) Home Improvement Loans F) Non-occupant Loans on G) Loans On Manufactured Number Average Value Number Average Value Number Average Value Number Average Value Number Average Value Number Average Value
LOANS ORIGINATED 1 $157,000 310 $250,197 238 $176,629 28 $108,970 159 $215,142 0 $0 APPLICATIONS APPROVED, NOT ACCEPTED 1 $75,460 33 $303,908 41 $143,742 6 $83,693 12 $250,281 0 $0 APPLICATIONS DENIED 0 $0 40 $198,556 69 $146,559 15 $31,539 20 $174,970 2 $64,730 APPLICATIONS WITHDRAWN 1 $159,000 29 $202,271 79 $240,782 5 $44,408 15 $177,331 0 $0 FILES CLOSED FOR INCOMPLETENESS 0 $0 13 $310,262 22 $169,237 5 $40,076 9 $221,667 0 $0
Aggregated Statistics For Year 2003(Based on 2 full tracts) A) FHA, FSA/RHS & VA B) Conventional C) Refinancings D) Home Improvement Loans F) Non-occupant Loans on Number Average Value Number Average Value Number Average Value Number Average Value Number Average Value
LOANS ORIGINATED 16 $142,111 309 $208,753 588 $153,125 11 $37,114 165 $160,383 APPLICATIONS APPROVED, NOT ACCEPTED 1 $147,100 24 $266,955 62 $159,197 5 $32,880 20 $142,567 APPLICATIONS DENIED 0 $0 19 $170,334 98 $116,260 5 $19,520 14 $159,009 APPLICATIONS WITHDRAWN 1 $149,970 28 $209,111 100 $165,590 4 $41,228 14 $156,549 FILES CLOSED FOR INCOMPLETENESS 0 $0 10 $264,880 20 $186,382 2 $15,285 11 $155,529
Aggregated Statistics For Year 2002(Based on 2 full tracts) A) FHA, FSA/RHS & VA B) Conventional C) Refinancings D) Home Improvement Loans F) Non-occupant Loans on Number Average Value Number Average Value Number Average Value Number Average Value Number Average Value
LOANS ORIGINATED 14 $135,609 267 $164,611 344 $159,761 11 $33,362 103 $129,029 APPLICATIONS APPROVED, NOT ACCEPTED 2 $94,565 15 $138,834 36 $107,927 2 $40,595 6 $75,142 APPLICATIONS DENIED 1 $143,280 16 $100,624 68 $155,221 7 $50,929 9 $99,036 APPLICATIONS WITHDRAWN 4 $126,300 18 $255,344 67 $158,108 2 $24,835 11 $107,679 FILES CLOSED FOR INCOMPLETENESS 1 $143,280 5 $291,370 15 $154,205 0 $0 2 $55,400
Aggregated Statistics For Year 2001(Based on 2 full tracts) A) FHA, FSA/RHS & VA B) Conventional C) Refinancings D) Home Improvement Loans E) Loans on Dwellings For 5+ Families F) Non-occupant Loans on Number Average Value Number Average Value Number Average Value Number Average Value Number Average Value Number Average Value
LOANS ORIGINATED 15 $114,881 243 $158,995 234 $136,016 20 $24,598 1 $1,000,000 71 $126,415 APPLICATIONS APPROVED, NOT ACCEPTED 0 $0 20 $257,347 26 $137,309 0 $0 0 $0 4 $114,442 APPLICATIONS DENIED 1 $123,000 16 $122,464 65 $117,921 6 $18,965 0 $0 7 $74,389 APPLICATIONS WITHDRAWN 2 $115,100 23 $163,275 59 $107,808 4 $77,400 0 $0 8 $113,511 FILES CLOSED FOR INCOMPLETENESS 0 $0 3 $371,100 13 $104,196 0 $0 0 $0 0 $0
Aggregated Statistics For Year 2000(Based on 2 full tracts) A) FHA, FSA/RHS & VA B) Conventional C) Refinancings D) Home Improvement Loans F) Non-occupant Loans on Number Average Value Number Average Value Number Average Value Number Average Value Number Average Value
LOANS ORIGINATED 18 $98,392 234 $140,748 45 $84,080 16 $24,639 46 $94,400 APPLICATIONS APPROVED, NOT ACCEPTED 1 $118,440 20 $117,271 14 $242,396 3 $30,883 8 $90,275 APPLICATIONS DENIED 5 $85,204 18 $89,439 21 $66,916 13 $16,330 4 $81,870 APPLICATIONS WITHDRAWN 0 $0 11 $124,127 22 $69,156 5 $24,996 3 $207,057 FILES CLOSED FOR INCOMPLETENESS 0 $0 6 $196,063 12 $89,842 1 $85,000 2 $81,190
Aggregated Statistics For Year 1999(Based on 1 full and 1 partial tracts) A) FHA, FSA/RHS & VA B) Conventional C) Refinancings D) Home Improvement Loans F) Non-occupant Loans on Number Average Value Number Average Value Number Average Value Number Average Value Number Average Value
LOANS ORIGINATED 16 $95,548 187 $141,869 116 $94,876 12 $18,509 34 $100,632 APPLICATIONS APPROVED, NOT ACCEPTED 1 $72,440 11 $106,825 25 $87,805 6 $29,863 1 $118,870 APPLICATIONS DENIED 1 $75,220 16 $152,368 52 $102,910 7 $20,450 7 $75,339 APPLICATIONS WITHDRAWN 4 $122,262 13 $184,842 45 $69,669 3 $43,960 3 $65,547 FILES CLOSED FOR INCOMPLETENESS 0 $0 7 $142,914 8 $102,916 0 $0 2 $52,935
Detailed HMDA statistics for the following Tracts:
0664.00
, 0665.00
Private Mortgage Insurance Companies Aggregated Statistics For Year 2009(Based on 2 full tracts) A) Conventional B) Refinancings C) Non-occupant Loans on Number Average Value Number Average Value Number Average Value
LOANS ORIGINATED 4 $181,488 1 $213,010 1 $306,620 APPLICATIONS APPROVED, NOT ACCEPTED 3 $203,130 0 $0 1 $289,430 APPLICATIONS DENIED 1 $151,000 0 $0 0 $0 APPLICATIONS WITHDRAWN 2 $135,680 0 $0 0 $0 FILES CLOSED FOR INCOMPLETENESS 0 $0 0 $0 0 $0
Aggregated Statistics For Year 2008(Based on 2 full tracts) A) Conventional B) Refinancings C) Non-occupant Loans on Number Average Value Number Average Value Number Average Value
LOANS ORIGINATED 20 $170,018 5 $190,112 5 $166,778 APPLICATIONS APPROVED, NOT ACCEPTED 4 $151,080 1 $106,030 2 $124,175 APPLICATIONS DENIED 1 $140,000 1 $155,000 0 $0 APPLICATIONS WITHDRAWN 2 $170,000 0 $0 0 $0 FILES CLOSED FOR INCOMPLETENESS 0 $0 0 $0 0 $0
Aggregated Statistics For Year 2007(Based on 2 full tracts) A) Conventional B) Refinancings C) Non-occupant Loans on Number Average Value Number Average Value Number Average Value
LOANS ORIGINATED 14 $210,853 6 $265,527 2 $152,355 APPLICATIONS APPROVED, NOT ACCEPTED 1 $227,000 2 $197,235 0 $0 APPLICATIONS DENIED 1 $192,950 0 $0 0 $0 APPLICATIONS WITHDRAWN 0 $0 1 $330,000 0 $0 FILES CLOSED FOR INCOMPLETENESS 0 $0 0 $0 0 $0
Aggregated Statistics For Year 2006(Based on 2 full tracts) A) Conventional B) Refinancings C) Non-occupant Loans on Number Average Value Number Average Value Number Average Value
LOANS ORIGINATED 23 $254,517 5 $254,544 4 $282,218 APPLICATIONS APPROVED, NOT ACCEPTED 6 $240,010 0 $0 1 $392,000 APPLICATIONS DENIED 0 $0 0 $0 0 $0 APPLICATIONS WITHDRAWN 6 $226,855 1 $178,000 0 $0 FILES CLOSED FOR INCOMPLETENESS 0 $0 0 $0 0 $0
Aggregated Statistics For Year 2005(Based on 2 full tracts) A) Conventional B) Refinancings C) Non-occupant Loans on Number Average Value Number Average Value Number Average Value
LOANS ORIGINATED 36 $245,138 4 $219,325 9 $223,638 APPLICATIONS APPROVED, NOT ACCEPTED 3 $196,737 1 $172,890 0 $0 APPLICATIONS DENIED 2 $212,530 0 $0 1 $168,120 APPLICATIONS WITHDRAWN 2 $179,365 1 $170,980 1 $161,000 FILES CLOSED FOR INCOMPLETENESS 0 $0 0 $0 0 $0
Aggregated Statistics For Year 2004(Based on 2 full tracts) A) Conventional B) Refinancings C) Non-occupant Loans on Number Average Value Number Average Value Number Average Value
LOANS ORIGINATED 40 $200,140 9 $191,333 19 $213,852 APPLICATIONS APPROVED, NOT ACCEPTED 5 $244,824 1 $136,000 2 $208,710 APPLICATIONS DENIED 2 $510,500 0 $0 1 $120,000 APPLICATIONS WITHDRAWN 1 $269,000 0 $0 0 $0 FILES CLOSED FOR INCOMPLETENESS 0 $0 0 $0 0 $0
Aggregated Statistics For Year 2003(Based on 2 full tracts) A) Conventional B) Refinancings C) Non-occupant Loans on Number Average Value Number Average Value Number Average Value
LOANS ORIGINATED 59 $165,773 20 $135,846 18 $165,920 APPLICATIONS APPROVED, NOT ACCEPTED 11 $164,316 5 $145,182 4 $101,012 APPLICATIONS DENIED 1 $474,730 1 $117,000 0 $0 APPLICATIONS WITHDRAWN 5 $280,262 0 $0 2 $259,280 FILES CLOSED FOR INCOMPLETENESS 0 $0 0 $0 0 $0
Aggregated Statistics For Year 2002(Based on 2 full tracts) A) Conventional B) Refinancings C) Non-occupant Loans on Number Average Value Number Average Value Number Average Value
LOANS ORIGINATED 51 $127,725 16 $131,454 19 $131,272 APPLICATIONS APPROVED, NOT ACCEPTED 8 $143,381 5 $125,514 2 $127,120 APPLICATIONS DENIED 2 $119,880 2 $123,000 0 $0 APPLICATIONS WITHDRAWN 2 $222,505 3 $105,307 1 $360,000 FILES CLOSED FOR INCOMPLETENESS 0 $0 0 $0 0 $0
Aggregated Statistics For Year 2001(Based on 2 full tracts) A) Conventional B) Refinancings C) Non-occupant Loans on Number Average Value Number Average Value Number Average Value
LOANS ORIGINATED 46 $127,160 18 $128,139 9 $85,119 APPLICATIONS APPROVED, NOT ACCEPTED 13 $174,698 0 $0 1 $73,550 APPLICATIONS DENIED 1 $95,000 0 $0 1 $95,000 APPLICATIONS WITHDRAWN 1 $78,330 3 $125,410 0 $0 FILES CLOSED FOR INCOMPLETENESS 0 $0 0 $0 0 $0
Aggregated Statistics For Year 2000(Based on 2 full tracts) A) Conventional B) Refinancings C) Non-occupant Loans on Number Average Value Number Average Value Number Average Value
LOANS ORIGINATED 64 $113,278 4 $70,760 8 $118,931 APPLICATIONS APPROVED, NOT ACCEPTED 1 $110,800 0 $0 0 $0 APPLICATIONS DENIED 1 $467,000 0 $0 0 $0 APPLICATIONS WITHDRAWN 3 $247,683 0 $0 1 $157,610 FILES CLOSED FOR INCOMPLETENESS 0 $0 0 $0 0 $0
Aggregated Statistics For Year 1999(Based on 1 full and 1 partial tracts) A) Conventional B) Refinancings C) Non-occupant Loans on Number Average Value Number Average Value Number Average Value
LOANS ORIGINATED 48 $102,534 6 $82,445 5 $88,598 APPLICATIONS APPROVED, NOT ACCEPTED 6 $78,843 0 $0 3 $83,583 APPLICATIONS DENIED 0 $0 2 $100,765 0 $0 APPLICATIONS WITHDRAWN 0 $0 0 $0 0 $0 FILES CLOSED FOR INCOMPLETENESS 0 $0 1 $102,160 0 $0
Detailed PMIC statistics for the following Tracts:
0664.00
, 0665.00 Indian Harbour Beach compared to Florida state average:
Unemployed percentage significantly below state average. Black race population percentage significantly below state average. Hispanic race population percentage below state average. Median age significantly above state average. Foreign-born population percentage significantly below state average. Length of stay since moving in significantly above state average. Percentage of population with a bachelor's degree or higher above state average. Indian Harbour Beach on our top lists :
#22 on the list of "Top 101 cities with largest percentage of females in industries: real estate and rental and leasing (population 5,000+)"
#47 on the list of "Top 101 cities with the largest city-data.com crime index increase from 2002 to 2012 (population 5,000+)"
#29 on the list of "Top 101 counties with the lowest number of births per 1000 residents 2007-2013"
#29 on the list of "Top 101 counties with the largest increase in the number of infant deaths per 1000 residents 2000-2006 to 2007-2013 (pop. 50,000+)"
#54 on the list of "Top 101 counties with the lowest Particulate Matter (PM2.5 ) Annual air pollution readings in 2012 (µg/m3 )"
#82 on the list of "Top 101 counties with the highest number of infant deaths per 1000 residents 2007-2013 (pop. 50,000+)"
#94 on the list of "Top 101 counties with the most Evangelical Protestant congregations"
Top Patent Applicants
Eric Holland (28)
Neil Yorio (6)
Gregory Thomas Minteer (6)
Daniel Balda (5)
Kim Watson (4)
Mark A. Webster (4)
Rick Leclair (3)
David C. Schafer (3)
Kenneth E. Brace (3)
Paul G. Greenis (3)
Total of 106 patent applications in 2008-2024.
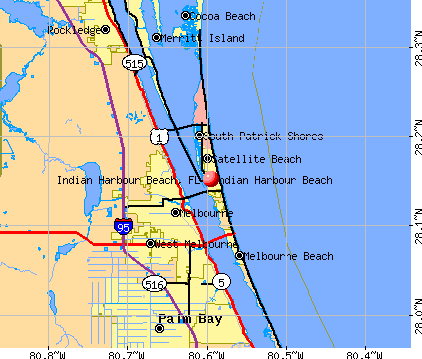


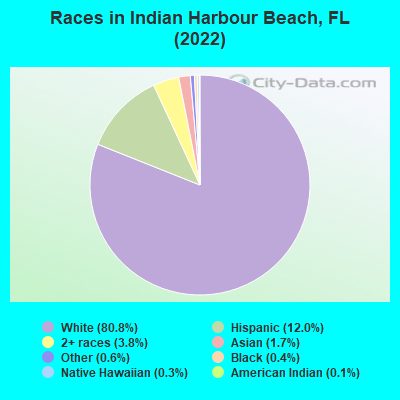
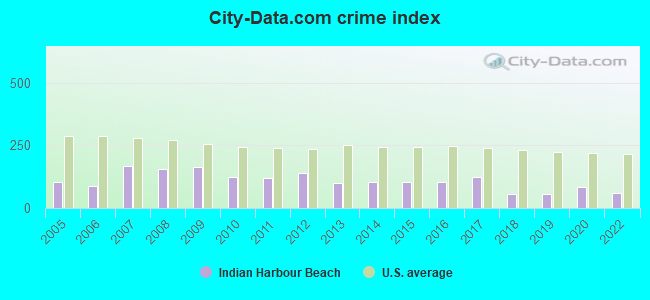
 Recent articles from our blog. Our writers, many of them Ph.D. graduates or candidates, create easy-to-read articles on a wide variety of topics.

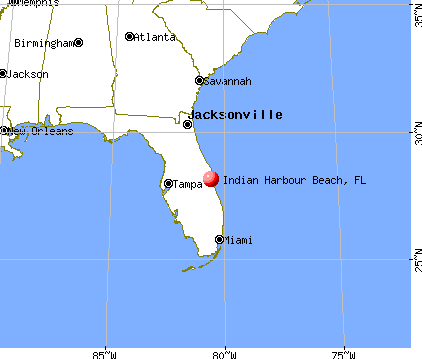
 (3.4 miles
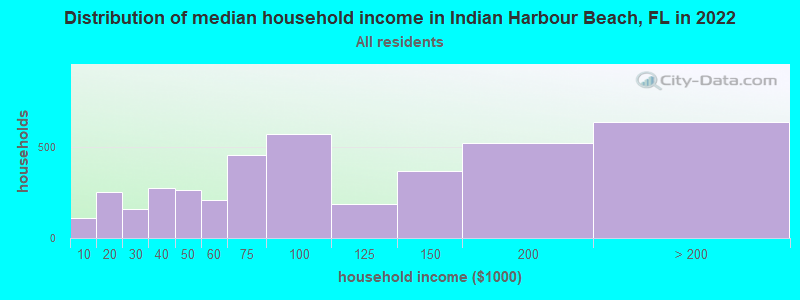
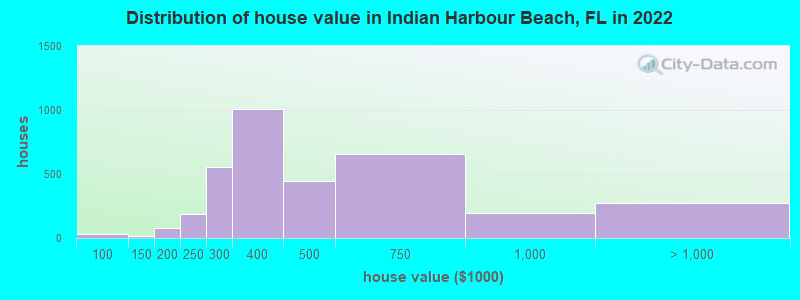
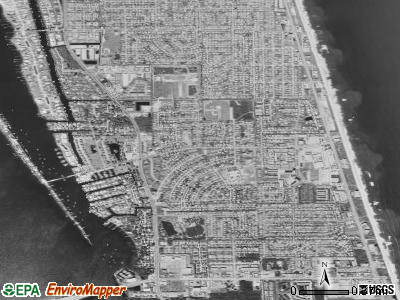
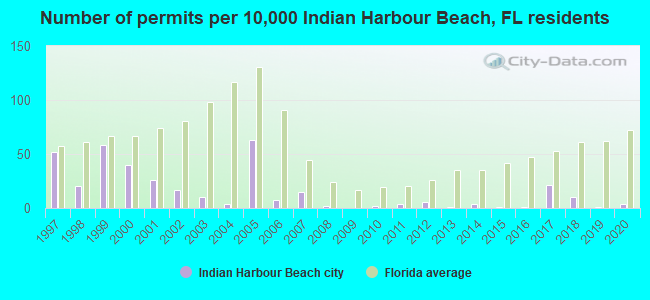
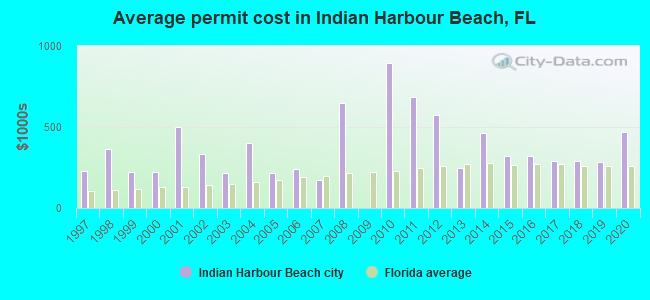
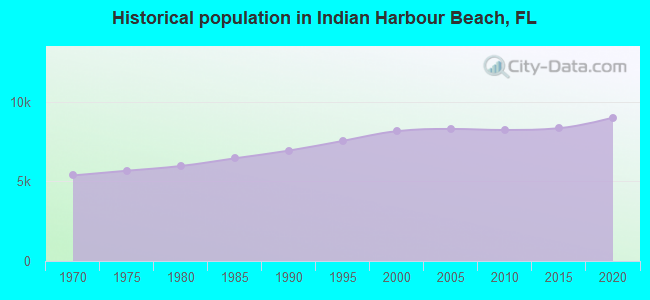
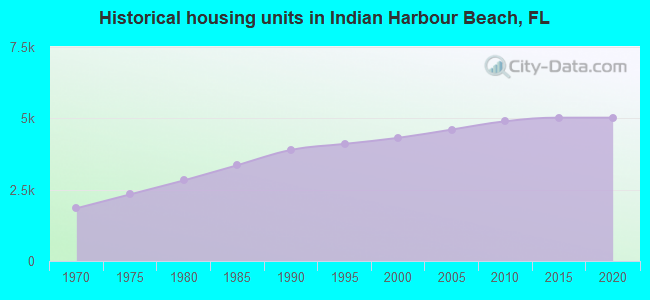
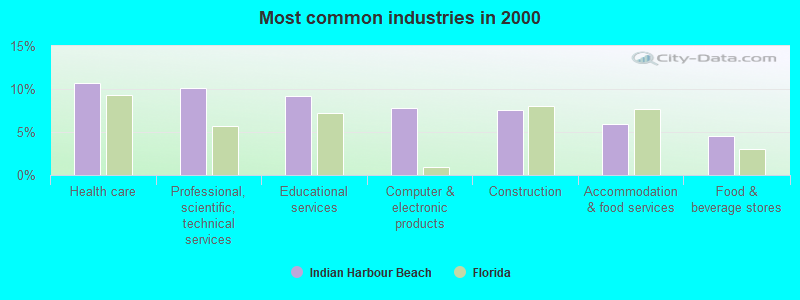
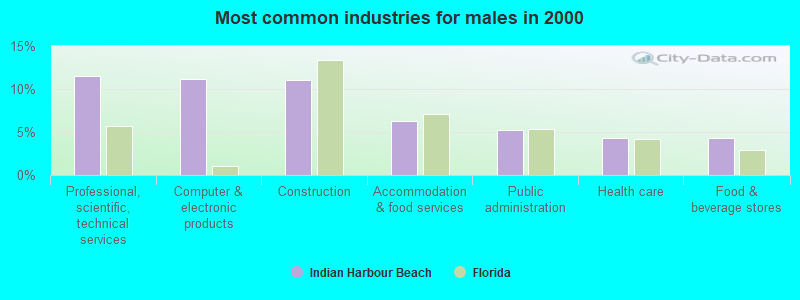
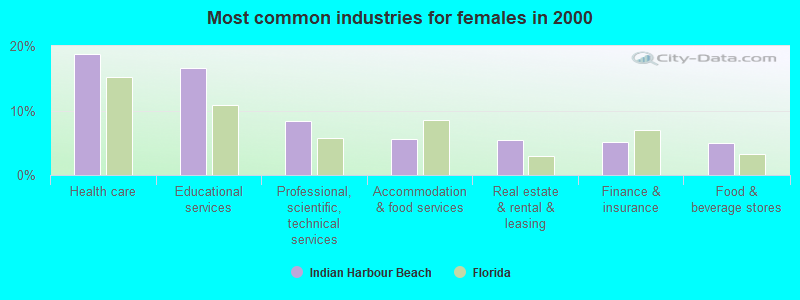
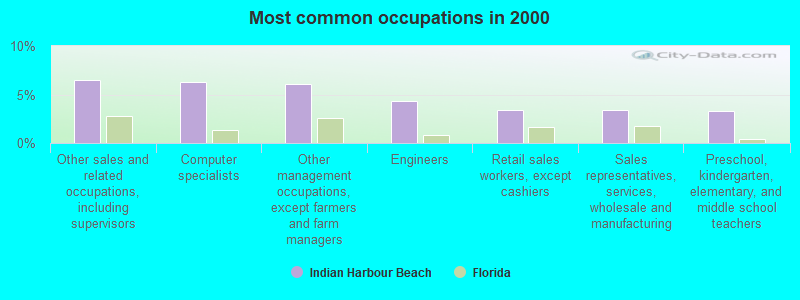
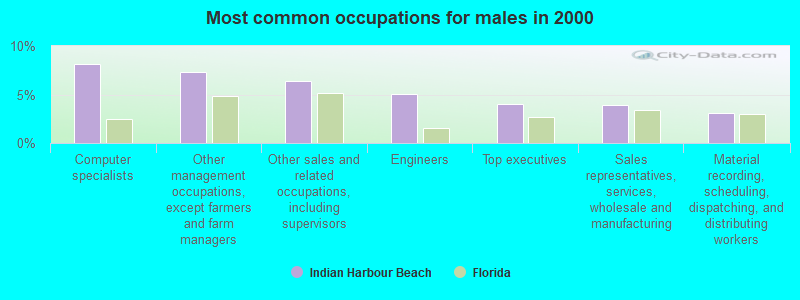
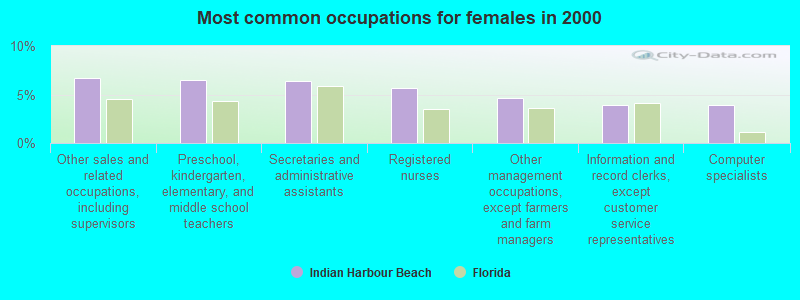
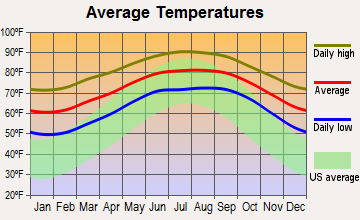
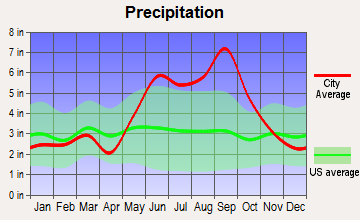
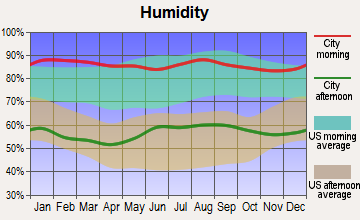
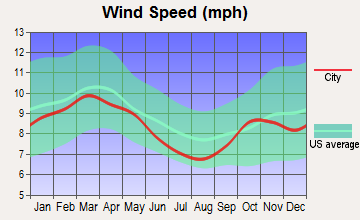
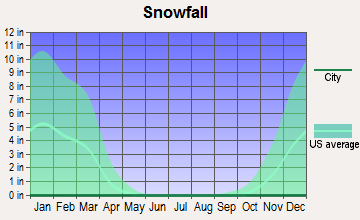
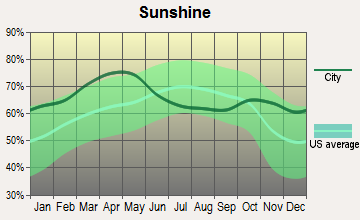
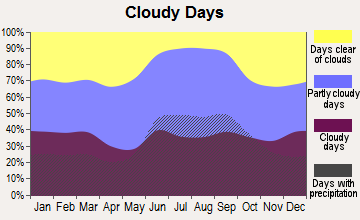
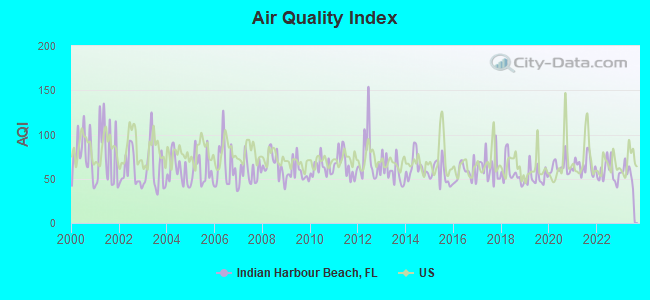
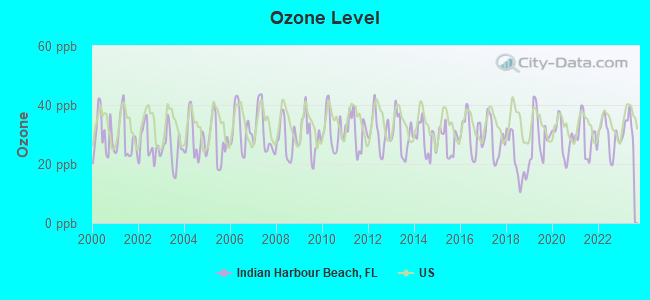
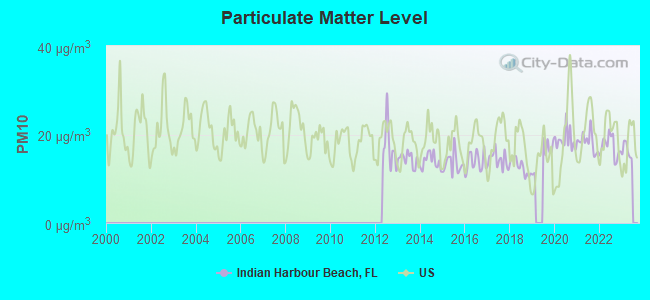
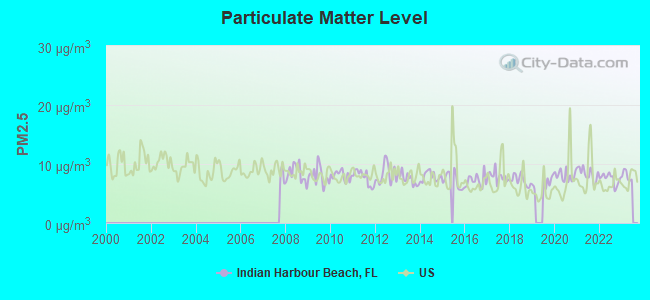
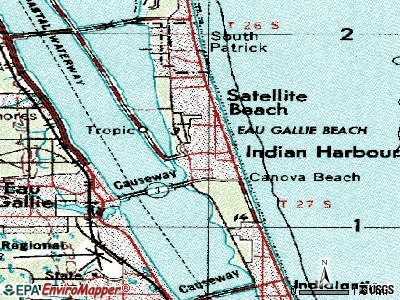
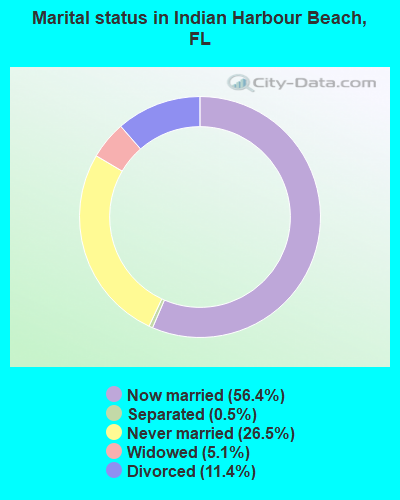
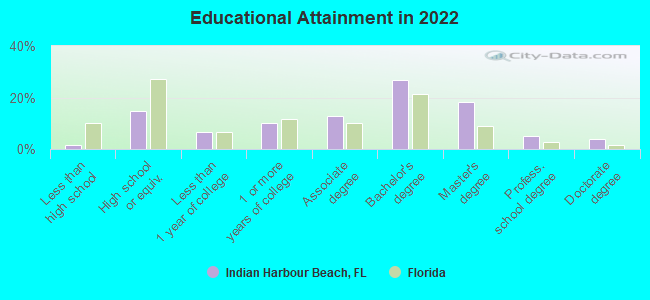
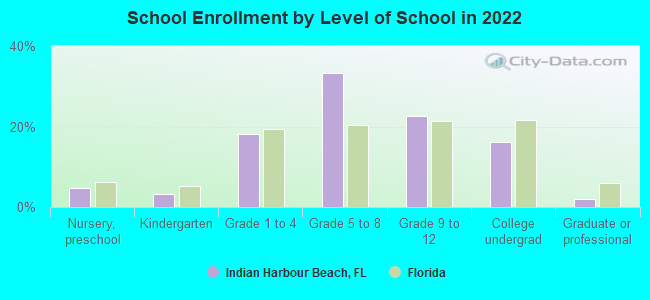
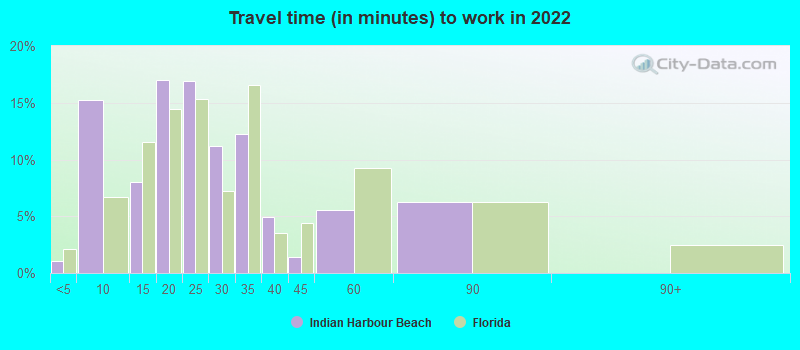
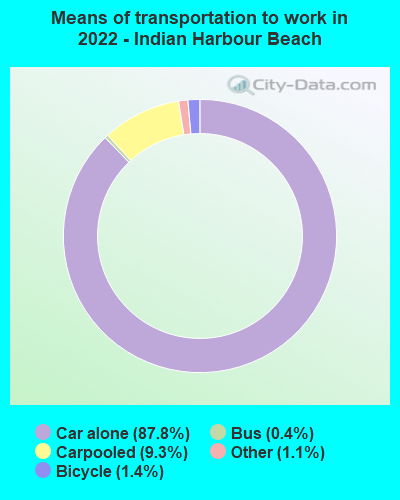
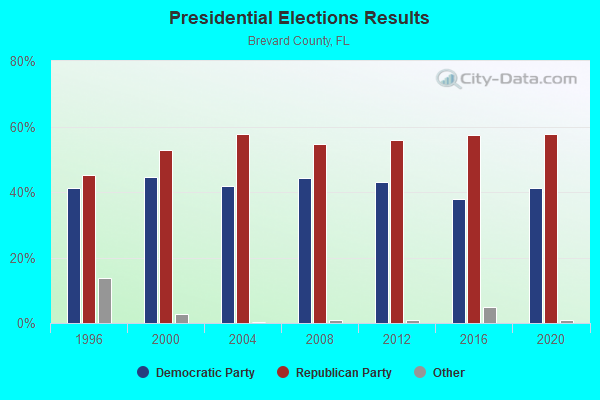
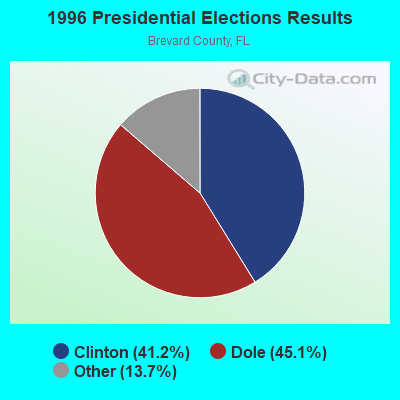
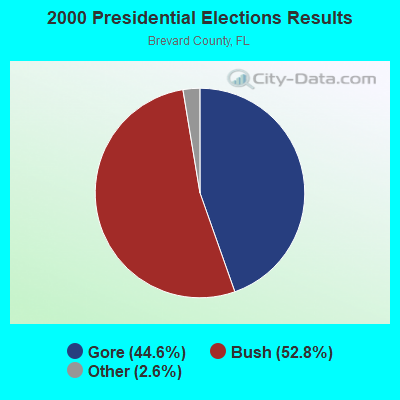
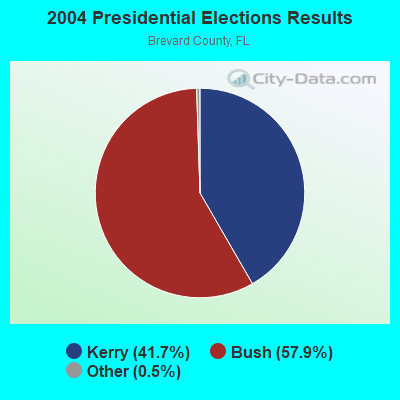
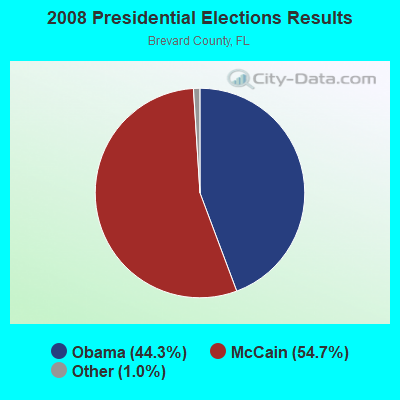
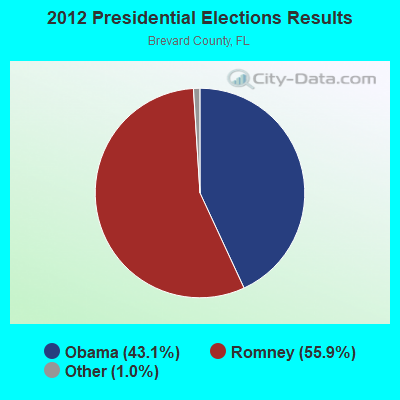
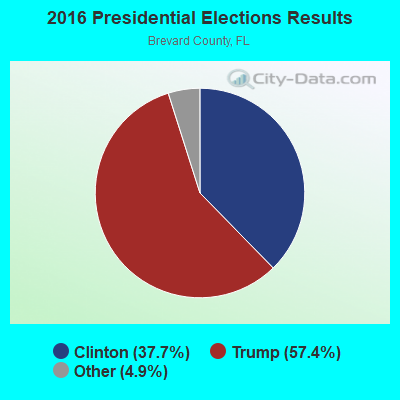
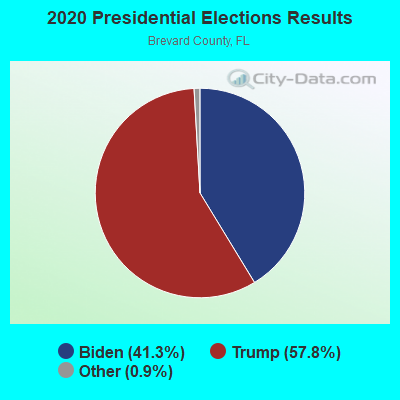
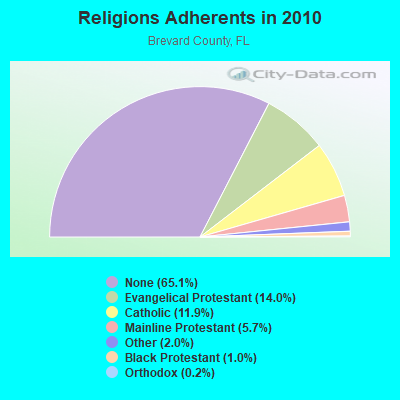
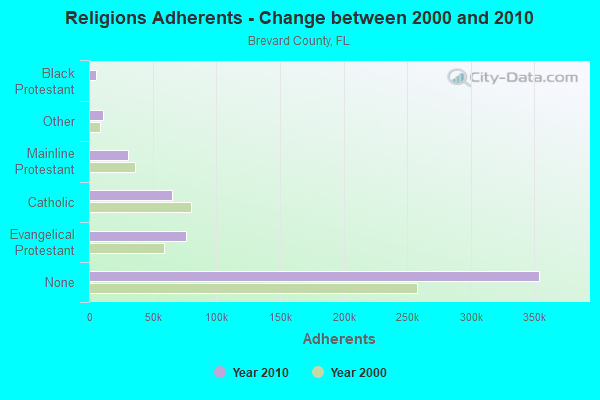
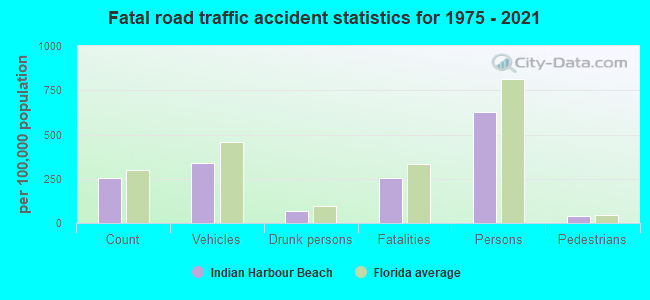
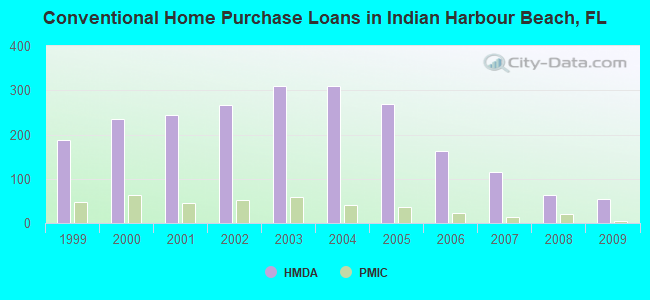
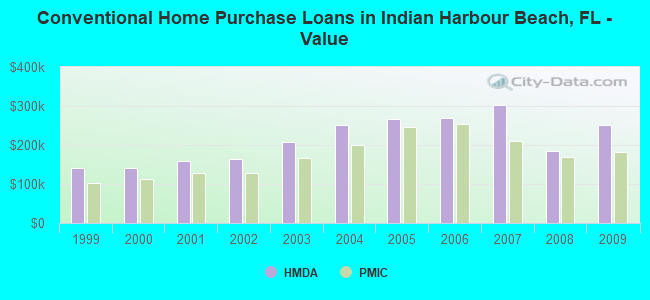
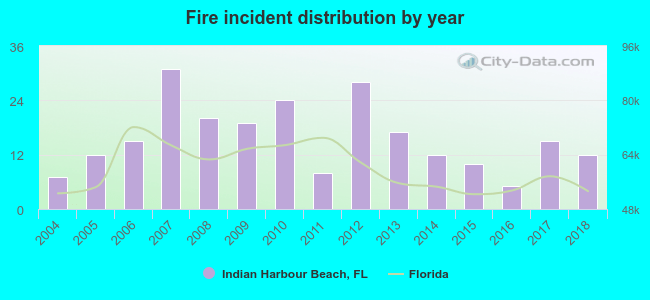 Based on the data from the years 2004 - 2018 the average number of fire incidents per year is 16. The highest number of reported fire incidents - 31 took place in 2007, and the least - 5 in 2016. The data has an increasing trend.
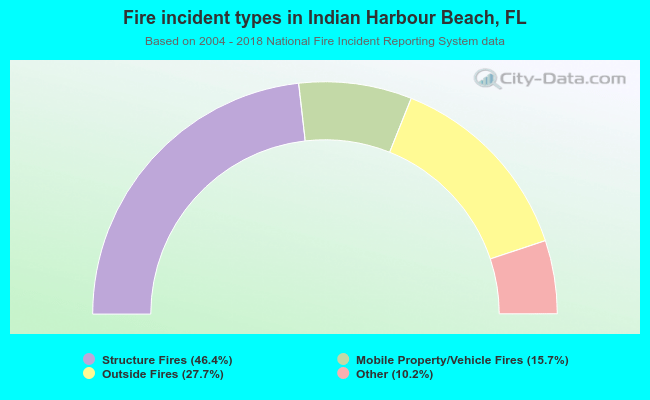 When looking into fire subcategories, the most reports belonged to: Structure Fires (46.4%), and Outside Fires (27.7%).