Jacksonville Beach, Florida Submit your own pictures of this city and show them to the world
OSM Map
General Map
Google Map
MSN Map
OSM Map
General Map
Google Map
MSN Map
OSM Map
General Map
Google Map
MSN Map
OSM Map
General Map
Google Map
MSN Map
Please wait while loading the map...
Population in 2022: 23,521 (100% urban, 0% rural). Population change since 2000: +12.1%Males: 12,223 Females: 11,298
March 2022 cost of living index in Jacksonville Beach: 92.3 (less than average, U.S. average is 100) Percentage of residents living in poverty in 2022: 5.6%for White Non-Hispanic residents , 26.8% for Black residents , 5.3% for Hispanic or Latino residents , 52.6% for Native Hawaiian and other Pacific Islander residents )
Profiles of local businesses
Business Search - 14 Million verified businesses
Data:
Median household income ($)
Median household income (% change since 2000)
Household income diversity
Ratio of average income to average house value (%)
Ratio of average income to average rent
Median household income ($) - White
Median household income ($) - Black or African American
Median household income ($) - Asian
Median household income ($) - Hispanic or Latino
Median household income ($) - American Indian and Alaska Native
Median household income ($) - Multirace
Median household income ($) - Other Race
Median household income for houses/condos with a mortgage ($)
Median household income for apartments without a mortgage ($)
Races - White alone (%)
Races - White alone (% change since 2000)
Races - Black alone (%)
Races - Black alone (% change since 2000)
Races - American Indian alone (%)
Races - American Indian alone (% change since 2000)
Races - Asian alone (%)
Races - Asian alone (% change since 2000)
Races - Hispanic (%)
Races - Hispanic (% change since 2000)
Races - Native Hawaiian and Other Pacific Islander alone (%)
Races - Native Hawaiian and Other Pacific Islander alone (% change since 2000)
Races - Two or more races (%)
Races - Two or more races (% change since 2000)
Races - Other race alone (%)
Races - Other race alone (% change since 2000)
Racial diversity
Unemployment (%)
Unemployment (% change since 2000)
Unemployment (%) - White
Unemployment (%) - Black or African American
Unemployment (%) - Asian
Unemployment (%) - Hispanic or Latino
Unemployment (%) - American Indian and Alaska Native
Unemployment (%) - Multirace
Unemployment (%) - Other Race
Population density (people per square mile)
Population - Males (%)
Population - Females (%)
Population - Males (%) - White
Population - Males (%) - Black or African American
Population - Males (%) - Asian
Population - Males (%) - Hispanic or Latino
Population - Males (%) - American Indian and Alaska Native
Population - Males (%) - Multirace
Population - Males (%) - Other Race
Population - Females (%) - White
Population - Females (%) - Black or African American
Population - Females (%) - Asian
Population - Females (%) - Hispanic or Latino
Population - Females (%) - American Indian and Alaska Native
Population - Females (%) - Multirace
Population - Females (%) - Other Race
Coronavirus confirmed cases (May 01, 2024)
Deaths caused by coronavirus (May 01, 2024)
Coronavirus confirmed cases (per 100k population) (May 01, 2024)
Deaths caused by coronavirus (per 100k population) (May 01, 2024)
Daily increase in number of cases (May 01, 2024)
Weekly increase in number of cases (May 01, 2024)
Cases doubled (in days) (May 01, 2024)
Hospitalized patients (Apr 18, 2022)
Negative test results (Apr 18, 2022)
Total test results (Apr 18, 2022)
COVID Vaccine doses distributed (per 100k population) (Sep 19, 2023)
COVID Vaccine doses administered (per 100k population) (Sep 19, 2023)
COVID Vaccine doses distributed (Sep 19, 2023)
COVID Vaccine doses administered (Sep 19, 2023)
Likely homosexual households (%)
Likely homosexual households (% change since 2000)
Likely homosexual households - Lesbian couples (%)
Likely homosexual households - Lesbian couples (% change since 2000)
Likely homosexual households - Gay men (%)
Likely homosexual households - Gay men (% change since 2000)
Cost of living index
Median gross rent ($)
Median contract rent ($)
Median monthly housing costs ($)
Median house or condo value ($)
Median house or condo value ($ change since 2000)
Mean house or condo value by units in structure - 1, detached ($)
Mean house or condo value by units in structure - 1, attached ($)
Mean house or condo value by units in structure - 2 ($)
Mean house or condo value by units in structure by units in structure - 3 or 4 ($)
Mean house or condo value by units in structure - 5 or more ($)
Mean house or condo value by units in structure - Boat, RV, van, etc. ($)
Mean house or condo value by units in structure - Mobile home ($)
Median house or condo value ($) - White
Median house or condo value ($) - Black or African American
Median house or condo value ($) - Asian
Median house or condo value ($) - Hispanic or Latino
Median house or condo value ($) - American Indian and Alaska Native
Median house or condo value ($) - Multirace
Median house or condo value ($) - Other Race
Median resident age
Resident age diversity
Median resident age - Males
Median resident age - Females
Median resident age - White
Median resident age - Black or African American
Median resident age - Asian
Median resident age - Hispanic or Latino
Median resident age - American Indian and Alaska Native
Median resident age - Multirace
Median resident age - Other Race
Median resident age - Males - White
Median resident age - Males - Black or African American
Median resident age - Males - Asian
Median resident age - Males - Hispanic or Latino
Median resident age - Males - American Indian and Alaska Native
Median resident age - Males - Multirace
Median resident age - Males - Other Race
Median resident age - Females - White
Median resident age - Females - Black or African American
Median resident age - Females - Asian
Median resident age - Females - Hispanic or Latino
Median resident age - Females - American Indian and Alaska Native
Median resident age - Females - Multirace
Median resident age - Females - Other Race
Commute - mean travel time to work (minutes)
Travel time to work - Less than 5 minutes (%)
Travel time to work - Less than 5 minutes (% change since 2000)
Travel time to work - 5 to 9 minutes (%)
Travel time to work - 5 to 9 minutes (% change since 2000)
Travel time to work - 10 to 19 minutes (%)
Travel time to work - 10 to 19 minutes (% change since 2000)
Travel time to work - 20 to 29 minutes (%)
Travel time to work - 20 to 29 minutes (% change since 2000)
Travel time to work - 30 to 39 minutes (%)
Travel time to work - 30 to 39 minutes (% change since 2000)
Travel time to work - 40 to 59 minutes (%)
Travel time to work - 40 to 59 minutes (% change since 2000)
Travel time to work - 60 to 89 minutes (%)
Travel time to work - 60 to 89 minutes (% change since 2000)
Travel time to work - 90 or more minutes (%)
Travel time to work - 90 or more minutes (% change since 2000)
Marital status - Never married (%)
Marital status - Now married (%)
Marital status - Separated (%)
Marital status - Widowed (%)
Marital status - Divorced (%)
Median family income ($)
Median family income (% change since 2000)
Median non-family income ($)
Median non-family income (% change since 2000)
Median per capita income ($)
Median per capita income (% change since 2000)
Median family income ($) - White
Median family income ($) - Black or African American
Median family income ($) - Asian
Median family income ($) - Hispanic or Latino
Median family income ($) - American Indian and Alaska Native
Median family income ($) - Multirace
Median family income ($) - Other Race
Median year house/condo built
Median year apartment built
Year house built - Built 2005 or later (%)
Year house built - Built 2000 to 2004 (%)
Year house built - Built 1990 to 1999 (%)
Year house built - Built 1980 to 1989 (%)
Year house built - Built 1970 to 1979 (%)
Year house built - Built 1960 to 1969 (%)
Year house built - Built 1950 to 1959 (%)
Year house built - Built 1940 to 1949 (%)
Year house built - Built 1939 or earlier (%)
Average household size
Household density (households per square mile)
Average household size - White
Average household size - Black or African American
Average household size - Asian
Average household size - Hispanic or Latino
Average household size - American Indian and Alaska Native
Average household size - Multirace
Average household size - Other Race
Occupied housing units (%)
Vacant housing units (%)
Owner occupied housing units (%)
Renter occupied housing units (%)
Vacancy status - For rent (%)
Vacancy status - For sale only (%)
Vacancy status - Rented or sold, not occupied (%)
Vacancy status - For seasonal, recreational, or occasional use (%)
Vacancy status - For migrant workers (%)
Vacancy status - Other vacant (%)
Residents with income below the poverty level (%)
Residents with income below 50% of the poverty level (%)
Children below poverty level (%)
Poor families by family type - Married-couple family (%)
Poor families by family type - Male, no wife present (%)
Poor families by family type - Female, no husband present (%)
Poverty status for native-born residents (%)
Poverty status for foreign-born residents (%)
Poverty among high school graduates not in families (%)
Poverty among people who did not graduate high school not in families (%)
Residents with income below the poverty level (%) - White
Residents with income below the poverty level (%) - Black or African American
Residents with income below the poverty level (%) - Asian
Residents with income below the poverty level (%) - Hispanic or Latino
Residents with income below the poverty level (%) - American Indian and Alaska Native
Residents with income below the poverty level (%) - Multirace
Residents with income below the poverty level (%) - Other Race
Air pollution - Air Quality Index (AQI)
Air pollution - CO
Air pollution - NO2
Air pollution - SO2
Air pollution - Ozone
Air pollution - PM10
Air pollution - PM25
Air pollution - Pb
Crime - Murders per 100,000 population
Crime - Rapes per 100,000 population
Crime - Robberies per 100,000 population
Crime - Assaults per 100,000 population
Crime - Burglaries per 100,000 population
Crime - Thefts per 100,000 population
Crime - Auto thefts per 100,000 population
Crime - Arson per 100,000 population
Crime - City-data.com crime index
Crime - Violent crime index
Crime - Property crime index
Crime - Murders per 100,000 population (5 year average)
Crime - Rapes per 100,000 population (5 year average)
Crime - Robberies per 100,000 population (5 year average)
Crime - Assaults per 100,000 population (5 year average)
Crime - Burglaries per 100,000 population (5 year average)
Crime - Thefts per 100,000 population (5 year average)
Crime - Auto thefts per 100,000 population (5 year average)
Crime - Arson per 100,000 population (5 year average)
Crime - City-data.com crime index (5 year average)
Crime - Violent crime index (5 year average)
Crime - Property crime index (5 year average)
1996 Presidential Elections Results (%) - Democratic Party (Clinton)
1996 Presidential Elections Results (%) - Republican Party (Dole)
1996 Presidential Elections Results (%) - Other
2000 Presidential Elections Results (%) - Democratic Party (Gore)
2000 Presidential Elections Results (%) - Republican Party (Bush)
2000 Presidential Elections Results (%) - Other
2004 Presidential Elections Results (%) - Democratic Party (Kerry)
2004 Presidential Elections Results (%) - Republican Party (Bush)
2004 Presidential Elections Results (%) - Other
2008 Presidential Elections Results (%) - Democratic Party (Obama)
2008 Presidential Elections Results (%) - Republican Party (McCain)
2008 Presidential Elections Results (%) - Other
2012 Presidential Elections Results (%) - Democratic Party (Obama)
2012 Presidential Elections Results (%) - Republican Party (Romney)
2012 Presidential Elections Results (%) - Other
2016 Presidential Elections Results (%) - Democratic Party (Clinton)
2016 Presidential Elections Results (%) - Republican Party (Trump)
2016 Presidential Elections Results (%) - Other
2020 Presidential Elections Results (%) - Democratic Party (Biden)
2020 Presidential Elections Results (%) - Republican Party (Trump)
2020 Presidential Elections Results (%) - Other
Ancestries Reported - Arab (%)
Ancestries Reported - Czech (%)
Ancestries Reported - Danish (%)
Ancestries Reported - Dutch (%)
Ancestries Reported - English (%)
Ancestries Reported - French (%)
Ancestries Reported - French Canadian (%)
Ancestries Reported - German (%)
Ancestries Reported - Greek (%)
Ancestries Reported - Hungarian (%)
Ancestries Reported - Irish (%)
Ancestries Reported - Italian (%)
Ancestries Reported - Lithuanian (%)
Ancestries Reported - Norwegian (%)
Ancestries Reported - Polish (%)
Ancestries Reported - Portuguese (%)
Ancestries Reported - Russian (%)
Ancestries Reported - Scotch-Irish (%)
Ancestries Reported - Scottish (%)
Ancestries Reported - Slovak (%)
Ancestries Reported - Subsaharan African (%)
Ancestries Reported - Swedish (%)
Ancestries Reported - Swiss (%)
Ancestries Reported - Ukrainian (%)
Ancestries Reported - United States (%)
Ancestries Reported - Welsh (%)
Ancestries Reported - West Indian (%)
Ancestries Reported - Other (%)
Educational Attainment - No schooling completed (%)
Educational Attainment - Less than high school (%)
Educational Attainment - High school or equivalent (%)
Educational Attainment - Less than 1 year of college (%)
Educational Attainment - 1 or more years of college (%)
Educational Attainment - Associate degree (%)
Educational Attainment - Bachelor's degree (%)
Educational Attainment - Master's degree (%)
Educational Attainment - Professional school degree (%)
Educational Attainment - Doctorate degree (%)
School Enrollment - Nursery, preschool (%)
School Enrollment - Kindergarten (%)
School Enrollment - Grade 1 to 4 (%)
School Enrollment - Grade 5 to 8 (%)
School Enrollment - Grade 9 to 12 (%)
School Enrollment - College undergrad (%)
School Enrollment - Graduate or professional (%)
School Enrollment - Not enrolled in school (%)
School enrollment - Public schools (%)
School enrollment - Private schools (%)
School enrollment - Not enrolled (%)
Median number of rooms in houses and condos
Median number of rooms in apartments
Housing units lacking complete plumbing facilities (%)
Housing units lacking complete kitchen facilities (%)
Density of houses
Urban houses (%)
Rural houses (%)
Households with people 60 years and over (%)
Households with people 65 years and over (%)
Households with people 75 years and over (%)
Households with one or more nonrelatives (%)
Households with no nonrelatives (%)
Population in households (%)
Family households (%)
Nonfamily households (%)
Population in families (%)
Family households with own children (%)
Median number of bedrooms in owner occupied houses
Mean number of bedrooms in owner occupied houses
Median number of bedrooms in renter occupied houses
Mean number of bedrooms in renter occupied houses
Median number of vehichles in owner occupied houses
Mean number of vehichles in owner occupied houses
Median number of vehichles in renter occupied houses
Mean number of vehichles in renter occupied houses
Mortgage status - with mortgage (%)
Mortgage status - with second mortgage (%)
Mortgage status - with home equity loan (%)
Mortgage status - with both second mortgage and home equity loan (%)
Mortgage status - without a mortgage (%)
Average family size
Average family size - White
Average family size - Black or African American
Average family size - Asian
Average family size - Hispanic or Latino
Average family size - American Indian and Alaska Native
Average family size - Multirace
Average family size - Other Race
Geographical mobility - Same house 1 year ago (%)
Geographical mobility - Moved within same county (%)
Geographical mobility - Moved from different county within same state (%)
Geographical mobility - Moved from different state (%)
Geographical mobility - Moved from abroad (%)
Place of birth - Born in state of residence (%)
Place of birth - Born in other state (%)
Place of birth - Native, outside of US (%)
Place of birth - Foreign born (%)
Housing units in structures - 1, detached (%)
Housing units in structures - 1, attached (%)
Housing units in structures - 2 (%)
Housing units in structures - 3 or 4 (%)
Housing units in structures - 5 to 9 (%)
Housing units in structures - 10 to 19 (%)
Housing units in structures - 20 to 49 (%)
Housing units in structures - 50 or more (%)
Housing units in structures - Mobile home (%)
Housing units in structures - Boat, RV, van, etc. (%)
House/condo owner moved in on average (years ago)
Renter moved in on average (years ago)
Year householder moved into unit - Moved in 1999 to March 2000 (%)
Year householder moved into unit - Moved in 1995 to 1998 (%)
Year householder moved into unit - Moved in 1990 to 1994 (%)
Year householder moved into unit - Moved in 1980 to 1989 (%)
Year householder moved into unit - Moved in 1970 to 1979 (%)
Year householder moved into unit - Moved in 1969 or earlier (%)
Means of transportation to work - Drove car alone (%)
Means of transportation to work - Carpooled (%)
Means of transportation to work - Public transportation (%)
Means of transportation to work - Bus or trolley bus (%)
Means of transportation to work - Streetcar or trolley car (%)
Means of transportation to work - Subway or elevated (%)
Means of transportation to work - Railroad (%)
Means of transportation to work - Ferryboat (%)
Means of transportation to work - Taxicab (%)
Means of transportation to work - Motorcycle (%)
Means of transportation to work - Bicycle (%)
Means of transportation to work - Walked (%)
Means of transportation to work - Other means (%)
Working at home (%)
Industry diversity
Most Common Industries - Agriculture, forestry, fishing and hunting, and mining (%)
Most Common Industries - Agriculture, forestry, fishing and hunting (%)
Most Common Industries - Mining, quarrying, and oil and gas extraction (%)
Most Common Industries - Construction (%)
Most Common Industries - Manufacturing (%)
Most Common Industries - Wholesale trade (%)
Most Common Industries - Retail trade (%)
Most Common Industries - Transportation and warehousing, and utilities (%)
Most Common Industries - Transportation and warehousing (%)
Most Common Industries - Utilities (%)
Most Common Industries - Information (%)
Most Common Industries - Finance and insurance, and real estate and rental and leasing (%)
Most Common Industries - Finance and insurance (%)
Most Common Industries - Real estate and rental and leasing (%)
Most Common Industries - Professional, scientific, and management, and administrative and waste management services (%)
Most Common Industries - Professional, scientific, and technical services (%)
Most Common Industries - Management of companies and enterprises (%)
Most Common Industries - Administrative and support and waste management services (%)
Most Common Industries - Educational services, and health care and social assistance (%)
Most Common Industries - Educational services (%)
Most Common Industries - Health care and social assistance (%)
Most Common Industries - Arts, entertainment, and recreation, and accommodation and food services (%)
Most Common Industries - Arts, entertainment, and recreation (%)
Most Common Industries - Accommodation and food services (%)
Most Common Industries - Other services, except public administration (%)
Most Common Industries - Public administration (%)
Occupation diversity
Most Common Occupations - Management, business, science, and arts occupations (%)
Most Common Occupations - Management, business, and financial occupations (%)
Most Common Occupations - Management occupations (%)
Most Common Occupations - Business and financial operations occupations (%)
Most Common Occupations - Computer, engineering, and science occupations (%)
Most Common Occupations - Computer and mathematical occupations (%)
Most Common Occupations - Architecture and engineering occupations (%)
Most Common Occupations - Life, physical, and social science occupations (%)
Most Common Occupations - Education, legal, community service, arts, and media occupations (%)
Most Common Occupations - Community and social service occupations (%)
Most Common Occupations - Legal occupations (%)
Most Common Occupations - Education, training, and library occupations (%)
Most Common Occupations - Arts, design, entertainment, sports, and media occupations (%)
Most Common Occupations - Healthcare practitioners and technical occupations (%)
Most Common Occupations - Health diagnosing and treating practitioners and other technical occupations (%)
Most Common Occupations - Health technologists and technicians (%)
Most Common Occupations - Service occupations (%)
Most Common Occupations - Healthcare support occupations (%)
Most Common Occupations - Protective service occupations (%)
Most Common Occupations - Fire fighting and prevention, and other protective service workers including supervisors (%)
Most Common Occupations - Law enforcement workers including supervisors (%)
Most Common Occupations - Food preparation and serving related occupations (%)
Most Common Occupations - Building and grounds cleaning and maintenance occupations (%)
Most Common Occupations - Personal care and service occupations (%)
Most Common Occupations - Sales and office occupations (%)
Most Common Occupations - Sales and related occupations (%)
Most Common Occupations - Office and administrative support occupations (%)
Most Common Occupations - Natural resources, construction, and maintenance occupations (%)
Most Common Occupations - Farming, fishing, and forestry occupations (%)
Most Common Occupations - Construction and extraction occupations (%)
Most Common Occupations - Installation, maintenance, and repair occupations (%)
Most Common Occupations - Production, transportation, and material moving occupations (%)
Most Common Occupations - Production occupations (%)
Most Common Occupations - Transportation occupations (%)
Most Common Occupations - Material moving occupations (%)
People in Group quarters - Institutionalized population (%)
People in Group quarters - Correctional institutions (%)
People in Group quarters - Federal prisons and detention centers (%)
People in Group quarters - Halfway houses (%)
People in Group quarters - Local jails and other confinement facilities (including police lockups) (%)
People in Group quarters - Military disciplinary barracks (%)
People in Group quarters - State prisons (%)
People in Group quarters - Other types of correctional institutions (%)
People in Group quarters - Nursing homes (%)
People in Group quarters - Hospitals/wards, hospices, and schools for the handicapped (%)
People in Group quarters - Hospitals/wards and hospices for chronically ill (%)
People in Group quarters - Hospices or homes for chronically ill (%)
People in Group quarters - Military hospitals or wards for chronically ill (%)
People in Group quarters - Other hospitals or wards for chronically ill (%)
People in Group quarters - Hospitals or wards for drug/alcohol abuse (%)
People in Group quarters - Mental (Psychiatric) hospitals or wards (%)
People in Group quarters - Schools, hospitals, or wards for the mentally retarded (%)
People in Group quarters - Schools, hospitals, or wards for the physically handicapped (%)
People in Group quarters - Institutions for the deaf (%)
People in Group quarters - Institutions for the blind (%)
People in Group quarters - Orthopedic wards and institutions for the physically handicapped (%)
People in Group quarters - Wards in general hospitals for patients who have no usual home elsewhere (%)
People in Group quarters - Wards in military hospitals for patients who have no usual home elsewhere (%)
People in Group quarters - Juvenile institutions (%)
People in Group quarters - Long-term care (%)
People in Group quarters - Homes for abused, dependent, and neglected children (%)
People in Group quarters - Residential treatment centers for emotionally disturbed children (%)
People in Group quarters - Training schools for juvenile delinquents (%)
People in Group quarters - Short-term care, detention or diagnostic centers for delinquent children (%)
People in Group quarters - Type of juvenile institution unknown (%)
People in Group quarters - Noninstitutionalized population (%)
People in Group quarters - College dormitories (includes college quarters off campus) (%)
People in Group quarters - Military quarters (%)
People in Group quarters - On base (%)
People in Group quarters - Barracks, unaccompanied personnel housing (UPH), (Enlisted/Officer), ;and similar group living quarters for military personnel (%)
People in Group quarters - Transient quarters for temporary residents (%)
People in Group quarters - Military ships (%)
People in Group quarters - Group homes (%)
People in Group quarters - Homes or halfway houses for drug/alcohol abuse (%)
People in Group quarters - Homes for the mentally ill (%)
People in Group quarters - Homes for the mentally retarded (%)
People in Group quarters - Homes for the physically handicapped (%)
People in Group quarters - Other group homes (%)
People in Group quarters - Religious group quarters (%)
People in Group quarters - Dormitories (%)
People in Group quarters - Agriculture workers' dormitories on farms (%)
People in Group quarters - Job Corps and vocational training facilities (%)
People in Group quarters - Other workers' dormitories (%)
People in Group quarters - Crews of maritime vessels (%)
People in Group quarters - Other nonhousehold living situations (%)
People in Group quarters - Other noninstitutional group quarters (%)
Residents speaking English at home (%)
Residents speaking English at home - Born in the United States (%)
Residents speaking English at home - Native, born elsewhere (%)
Residents speaking English at home - Foreign born (%)
Residents speaking Spanish at home (%)
Residents speaking Spanish at home - Born in the United States (%)
Residents speaking Spanish at home - Native, born elsewhere (%)
Residents speaking Spanish at home - Foreign born (%)
Residents speaking other language at home (%)
Residents speaking other language at home - Born in the United States (%)
Residents speaking other language at home - Native, born elsewhere (%)
Residents speaking other language at home - Foreign born (%)
Class of Workers - Employee of private company (%)
Class of Workers - Self-employed in own incorporated business (%)
Class of Workers - Private not-for-profit wage and salary workers (%)
Class of Workers - Local government workers (%)
Class of Workers - State government workers (%)
Class of Workers - Federal government workers (%)
Class of Workers - Self-employed workers in own not incorporated business and Unpaid family workers (%)
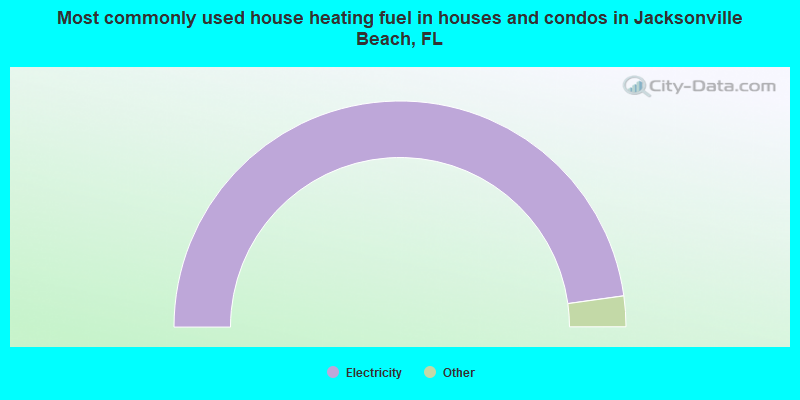
House heating fuel used in houses and condos - Utility gas (%)
House heating fuel used in houses and condos - Bottled, tank, or LP gas (%)
House heating fuel used in houses and condos - Electricity (%)
House heating fuel used in houses and condos - Fuel oil, kerosene, etc. (%)
House heating fuel used in houses and condos - Coal or coke (%)
House heating fuel used in houses and condos - Wood (%)
House heating fuel used in houses and condos - Solar energy (%)
House heating fuel used in houses and condos - Other fuel (%)
House heating fuel used in houses and condos - No fuel used (%)
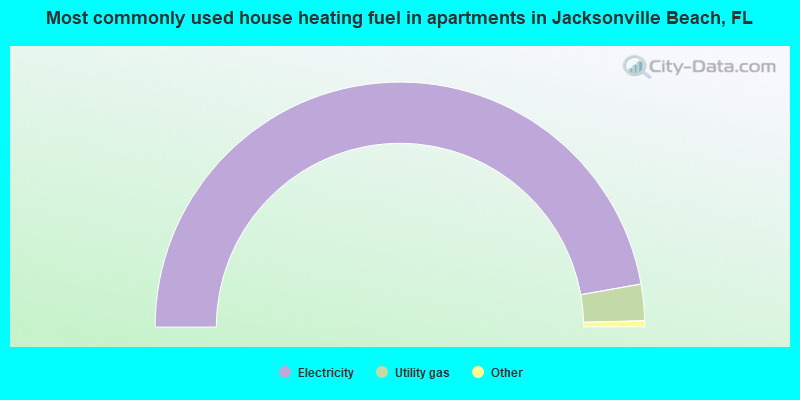
House heating fuel used in apartments - Utility gas (%)
House heating fuel used in apartments - Bottled, tank, or LP gas (%)
House heating fuel used in apartments - Electricity (%)
House heating fuel used in apartments - Fuel oil, kerosene, etc. (%)
House heating fuel used in apartments - Coal or coke (%)
House heating fuel used in apartments - Wood (%)
House heating fuel used in apartments - Solar energy (%)
House heating fuel used in apartments - Other fuel (%)
House heating fuel used in apartments - No fuel used (%)
Armed forces status - In Armed Forces (%)
Armed forces status - Civilian (%)
Armed forces status - Civilian - Veteran (%)
Armed forces status - Civilian - Nonveteran (%)
Fatal accidents locations in years 2005-2021
Fatal accidents locations in 2005
Fatal accidents locations in 2006
Fatal accidents locations in 2007
Fatal accidents locations in 2008
Fatal accidents locations in 2009
Fatal accidents locations in 2010
Fatal accidents locations in 2011
Fatal accidents locations in 2012
Fatal accidents locations in 2013
Fatal accidents locations in 2014
Fatal accidents locations in 2015
Fatal accidents locations in 2016
Fatal accidents locations in 2017
Fatal accidents locations in 2018
Fatal accidents locations in 2019
Fatal accidents locations in 2020
Fatal accidents locations in 2021
Alcohol use - People drinking some alcohol every month (%)
Alcohol use - People not drinking at all (%)
Alcohol use - Average days/month drinking alcohol
Alcohol use - Average drinks/week
Alcohol use - Average days/year people drink much
Audiometry - Average condition of hearing (%)
Audiometry - People that can hear a whisper from across a quiet room (%)
Audiometry - People that can hear normal voice from across a quiet room (%)
Audiometry - Ears ringing, roaring, buzzing (%)
Audiometry - Had a job exposure to loud noise (%)
Audiometry - Had off-work exposure to loud noise (%)
Blood Pressure & Cholesterol - Has high blood pressure (%)
Blood Pressure & Cholesterol - Checking blood pressure at home (%)
Blood Pressure & Cholesterol - Frequently checking blood cholesterol (%)
Blood Pressure & Cholesterol - Has high cholesterol level (%)
Consumer Behavior - Money monthly spent on food at supermarket/grocery store
Consumer Behavior - Money monthly spent on food at other stores
Consumer Behavior - Money monthly spent on eating out
Consumer Behavior - Money monthly spent on carryout/delivered foods
Consumer Behavior - Income spent on food at supermarket/grocery store (%)
Consumer Behavior - Income spent on food at other stores (%)
Consumer Behavior - Income spent on eating out (%)
Consumer Behavior - Income spent on carryout/delivered foods (%)
Current Health Status - General health condition (%)
Current Health Status - Blood donors (%)
Current Health Status - Has blood ever tested for HIV virus (%)
Current Health Status - Left-handed people (%)
Dermatology - People using sunscreen (%)
Diabetes - Diabetics (%)
Diabetes - Had a blood test for high blood sugar (%)
Diabetes - People taking insulin (%)
Diet Behavior & Nutrition - Diet health (%)
Diet Behavior & Nutrition - Milk product consumption (# of products/month)
Diet Behavior & Nutrition - Meals not home prepared (#/week)
Diet Behavior & Nutrition - Meals from fast food or pizza place (#/week)
Diet Behavior & Nutrition - Ready-to-eat foods (#/month)
Diet Behavior & Nutrition - Frozen meals/pizza (#/month)
Drug Use - People that ever used marijuana or hashish (%)
Drug Use - Ever used hard drugs (%)
Drug Use - Ever used any form of cocaine (%)
Drug Use - Ever used heroin (%)
Drug Use - Ever used methamphetamine (%)
Health Insurance - People covered by health insurance (%)
Kidney Conditions-Urology - Avg. # of times urinating at night
Medical Conditions - People with asthma (%)
Medical Conditions - People with anemia (%)
Medical Conditions - People with psoriasis (%)
Medical Conditions - People with overweight (%)
Medical Conditions - Elderly people having difficulties in thinking or remembering (%)
Medical Conditions - People who ever received blood transfusion (%)
Medical Conditions - People having trouble seeing even with glass/contacts (%)
Medical Conditions - People with arthritis (%)
Medical Conditions - People with gout (%)
Medical Conditions - People with congestive heart failure (%)
Medical Conditions - People with coronary heart disease (%)
Medical Conditions - People with angina pectoris (%)
Medical Conditions - People who ever had heart attack (%)
Medical Conditions - People who ever had stroke (%)
Medical Conditions - People with emphysema (%)
Medical Conditions - People with thyroid problem (%)
Medical Conditions - People with chronic bronchitis (%)
Medical Conditions - People with any liver condition (%)
Medical Conditions - People who ever had cancer or malignancy (%)
Mental Health - People who have little interest in doing things (%)
Mental Health - People feeling down, depressed, or hopeless (%)
Mental Health - People who have trouble sleeping or sleeping too much (%)
Mental Health - People feeling tired or having little energy (%)
Mental Health - People with poor appetite or overeating (%)
Mental Health - People feeling bad about themself (%)
Mental Health - People who have trouble concentrating on things (%)
Mental Health - People moving or speaking slowly or too fast (%)
Mental Health - People having thoughts they would be better off dead (%)
Oral Health - Average years since last visit a dentist
Oral Health - People embarrassed because of mouth (%)
Oral Health - People with gum disease (%)
Oral Health - General health of teeth and gums (%)
Oral Health - Average days a week using dental floss/device
Oral Health - Average days a week using mouthwash for dental problem
Oral Health - Average number of teeth
Pesticide Use - Households using pesticides to control insects (%)
Pesticide Use - Households using pesticides to kill weeds (%)
Physical Activity - People doing vigorous-intensity work activities (%)
Physical Activity - People doing moderate-intensity work activities (%)
Physical Activity - People walking or bicycling (%)
Physical Activity - People doing vigorous-intensity recreational activities (%)
Physical Activity - People doing moderate-intensity recreational activities (%)
Physical Activity - Average hours a day doing sedentary activities
Physical Activity - Average hours a day watching TV or videos
Physical Activity - Average hours a day using computer
Physical Functioning - People having limitations keeping them from working (%)
Physical Functioning - People limited in amount of work they can do (%)
Physical Functioning - People that need special equipment to walk (%)
Physical Functioning - People experiencing confusion/memory problems (%)
Physical Functioning - People requiring special healthcare equipment (%)
Prescription Medications - Average number of prescription medicines taking
Preventive Aspirin Use - Adults 40+ taking low-dose aspirin (%)
Reproductive Health - Vaginal deliveries (%)
Reproductive Health - Cesarean deliveries (%)
Reproductive Health - Deliveries resulted in a live birth (%)
Reproductive Health - Pregnancies resulted in a delivery (%)
Reproductive Health - Women breastfeeding newborns (%)
Reproductive Health - Women that had a hysterectomy (%)
Reproductive Health - Women that had both ovaries removed (%)
Reproductive Health - Women that have ever taken birth control pills (%)
Reproductive Health - Women taking birth control pills (%)
Reproductive Health - Women that have ever used Depo-Provera or injectables (%)
Reproductive Health - Women that have ever used female hormones (%)
Sexual Behavior - People 18+ that ever had sex (vaginal, anal, or oral) (%)
Sexual Behavior - Males 18+ that ever had vaginal sex with a woman (%)
Sexual Behavior - Males 18+ that ever performed oral sex on a woman (%)
Sexual Behavior - Males 18+ that ever had anal sex with a woman (%)
Sexual Behavior - Males 18+ that ever had any sex with a man (%)
Sexual Behavior - Females 18+ that ever had vaginal sex with a man (%)
Sexual Behavior - Females 18+ that ever performed oral sex on a man (%)
Sexual Behavior - Females 18+ that ever had anal sex with a man (%)
Sexual Behavior - Females 18+ that ever had any kind of sex with a woman (%)
Sexual Behavior - Average age people first had sex
Sexual Behavior - Average number of female sex partners in lifetime (males 18+)
Sexual Behavior - Average number of female vaginal sex partners in lifetime (males 18+)
Sexual Behavior - Average age people first performed oral sex on a woman (18+)
Sexual Behavior - Average number of woman performed oral sex on in lifetime (18+)
Sexual Behavior - Average number of male sex partners in lifetime (males 18+)
Sexual Behavior - Average number of male anal sex partners in lifetime (males 18+)
Sexual Behavior - Average age people first performed oral sex on a man (18+)
Sexual Behavior - Average number of male oral sex partners in lifetime (18+)
Sexual Behavior - People using protection when performing oral sex (%)
Sexual Behavior - Average number of times people have vaginal or anal sex a year
Sexual Behavior - People having sex without condom (%)
Sexual Behavior - Average number of male sex partners in lifetime (females 18+)
Sexual Behavior - Average number of male vaginal sex partners in lifetime (females 18+)
Sexual Behavior - Average number of female sex partners in lifetime (females 18+)
Sexual Behavior - Circumcised males 18+ (%)
Sleep Disorders - Average hours sleeping at night
Sleep Disorders - People that has trouble sleeping (%)
Smoking-Cigarette Use - People smoking cigarettes (%)
Taste & Smell - People 40+ having problems with smell (%)
Taste & Smell - People 40+ having problems with taste (%)
Taste & Smell - People 40+ that ever had wisdom teeth removed (%)
Taste & Smell - People 40+ that ever had tonsils teeth removed (%)
Taste & Smell - People 40+ that ever had a loss of consciousness because of a head injury (%)
Taste & Smell - People 40+ that ever had a broken nose or other serious injury to face or skull (%)
Taste & Smell - People 40+ that ever had two or more sinus infections (%)
Weight - Average height (inches)
Weight - Average weight (pounds)
Weight - Average BMI
Weight - People that are obese (%)
Weight - People that ever were obese (%)
Weight - People trying to lose weight (%)
Officers per 1,000 residents here:
2.73Florida average:
2.33
Latest news from Jacksonville Beach, FL collected exclusively by city-data.com from local newspapers, TV, and radio stations
Jacksonville Beach, FL City Guides: Ancestries: American (21.5%), English (12.9%), Irish (11.4%), European (10.5%), German (8.4%), Italian (2.8%).
Current Local Time:
Land area: 7.68 square miles.
Population density: 3,062 people per square mile (average).
1,408 residents are foreign born (2.0% Latin America , 1.6% Asia , 1.5% Europe ).
This city:
5.8%Florida:
21.1%
Median real estate property taxes paid for housing units with mortgages in 2022: $4,104 (0.7%)Median real estate property taxes paid for housing units with no mortgage in 2022: $3,811 (0.6%)
Nearest city with pop. 50,000+: Jacksonville, FL
Nearest city with pop. 1,000,000+: Philadelphia, PA
Nearest cities:
Latitude: 30.28 N, Longitude: 81.40 W
Daytime population change due to commuting: +3,079 (+12.8%)Workers who live and work in this city: 5,682 (39.8%)
Property values in Jacksonville Beach, FL
Jacksonville Beach tourist attractions:
Single-family new house construction building permits:
2022: 74 buildings , average cost: $463,1002021: 100 buildings , average cost: $461,6002020: 58 buildings , average cost: $340,2002019: 86 buildings , average cost: $323,7002018: 97 buildings , average cost: $317,3002017: 98 buildings , average cost: $422,7002016: 124 buildings , average cost: $326,7002015: 133 buildings , average cost: $347,6002014: 101 buildings , average cost: $314,6002013: 122 buildings , average cost: $305,3002012: 75 buildings , average cost: $261,2002011: 37 buildings , average cost: $228,3002010: 20 buildings , average cost: $236,2002009: 8 buildings , average cost: $263,8002008: 18 buildings , average cost: $194,1002007: 26 buildings , average cost: $399,2002006: 74 buildings , average cost: $262,7002005: 68 buildings , average cost: $250,6002004: 55 buildings , average cost: $174,8002003: 71 buildings , average cost: $169,7002002: 57 buildings , average cost: $142,8002001: 57 buildings , average cost: $172,2002000: 79 buildings , average cost: $157,3001999: 139 buildings , average cost: $145,5001998: 180 buildings , average cost: $133,4001997: 106 buildings , average cost: $127,500Unemployment in December 2023:
Population change in the 1990s: +2,772 (+15.2%).
Most common occupations in Jacksonville Beach, FL (%)
Both Males Females
Other sales and related occupations, including supervisors (4.9%)
Other management occupations, except farmers and farm managers (4.8%)
Sales representatives, services, wholesale and manufacturing (4.3%)
Preschool, kindergarten, elementary, and middle school teachers (3.9%)
Other office and administrative support workers, including supervisors (3.9%)
Building and grounds cleaning and maintenance occupations (3.9%)
Computer specialists (3.6%)
Other management occupations, except farmers and farm managers (5.5%)
Building and grounds cleaning and maintenance occupations (4.6%)
Electrical equipment mechanics and other installation, maintenance, and repair workers, including supervisors (4.6%)
Other sales and related occupations, including supervisors (4.4%)
Computer specialists (4.2%)
Sales representatives, services, wholesale and manufacturing (4.1%)
Top executives (3.0%)
Other office and administrative support workers, including supervisors (6.7%)
Preschool, kindergarten, elementary, and middle school teachers (6.3%)
Registered nurses (5.6%)
Other sales and related occupations, including supervisors (5.5%)
Secretaries and administrative assistants (5.0%)
Sales representatives, services, wholesale and manufacturing (4.6%)
Cashiers (4.1%)
Tornado activity:
Jacksonville Beach-area historical tornado activity is below Florida state average. It is 35% smaller than the overall U.S. average.
On 2/7/1971, a category F3 (max. wind speeds 158-206 mph) tornado 25.5 miles away from the Jacksonville Beach city center caused between $50,000 and $500,000 in damages.
On 4/15/1958, a category F3 tornado 29.2 miles away from the city center injured 9 people and caused between $50,000 and $500,000 in damages.
Earthquake activity:
Jacksonville Beach-area historical earthquake activity is significantly above Florida state average. It is 83% smaller than the overall U.S. average. On 11/22/1974 at 05:25:55, a magnitude 4.7 (4.7 MB, Class: Light, Intensity: IV - V) earthquake occurred 195.4 miles away from Jacksonville Beach center On 9/10/2006 at 14:56:08, a magnitude 5.9 (5.9 MB, 5.5 MS, 5.8 MW, Class: Moderate, Intensity: VI - VII) earthquake occurred 423.6 miles away from the city center On 8/2/1974 at 08:52:09, a magnitude 4.9 (4.3 MB, 4.9 LG) earthquake occurred 256.3 miles away from the city center On 8/21/1992 at 16:31:55, a magnitude 4.4 (4.1 MB, 4.1 LG, 4.4 LG, Depth: 6.2 mi) earthquake occurred 205.6 miles away from the city center On 9/4/2016 at 18:29:29, a magnitude 3.8 (3.8 ML, Class: Light, Intensity: II - III) earthquake occurred 111.6 miles away from the city center On 9/21/2016 at 16:30:52, a magnitude 3.8 (3.8 ML) earthquake occurred 114.0 miles away from Jacksonville Beach center Magnitude types: regional Lg-wave magnitude (LG), body-wave magnitude (MB), local magnitude (ML), surface-wave magnitude (MS), moment magnitude (MW) Natural disasters: The number of natural disasters in Duval County (24) is greater than the US average (15).Major Disasters (Presidential) Declared: 14Emergencies Declared: 5Hurricanes: 12, Fires: 4, Tropical Storms: 4, Floods: 3, Tornadoes: 3, Storms: 2, Freeze: 1, Wind: 1, Other: 1 (Note: some incidents may be assigned to more than one category). Hospitals and medical centers in Jacksonville Beach: BAPTIST MEDICAL CENTER BEACHES (Voluntary non-profit - Private, provides emergency services, 1350 13TH AVE S) AVANTE VILLA AT JACKSONVILLE BEACH INC (1504 SEABREEZE AVE)
JACKSONVILLE BEACH DIALYSIS (1711 5TH STREET SOUTH)
Heliports located in Jacksonville Beach: Colleges/universities with over 2000 students nearest to Jacksonville Beach:
University of North Florida (about 7 miles; Jacksonville, FL ; Full-time enrollment: 13,870)
Jacksonville University (about 14 miles; Jacksonville, FL ; FT enrollment: 3,335)
Florida State College at Jacksonville (about 17 miles; Jacksonville, FL ; FT enrollment: 21,810)
Flagler College-St Augustine (about 28 miles; Saint Augustine, FL ; FT enrollment: 2,644)
Saint Johns River State College (about 48 miles; Palatka, FL ; FT enrollment: 4,698)
College of Coastal Georgia (about 60 miles; Brunswick, GA ; FT enrollment: 2,447)
Wyotech-Daytona (about 67 miles; Ormond Beach, FL ; FT enrollment: 2,295)
Public high school in Jacksonville Beach: FLORIDA VIRTUAL ACADEMY AT PALM BEACH COUNTY Location: 2370-2 THIRD STREET S, Grades: KG-9, Charter school )
Private high school in Jacksonville Beach:
Public elementary/middle schools in Jacksonville Beach:
Private elementary/middle schools in Jacksonville Beach: ST PAUL CATHOLIC SCHOOL - JACKSONVILLE BEACH Students: 614, Location: 428 2ND AVE N, Grades: PK-8)
BEACHES EPISCOPAL SCHOOL Students: 235, Location: 1150 5TH ST N, Grades: PK-6)
MONTESSORI TIDES SCHOOL Students: 71, Location: 1550 PENMAN RD, Grades: PK-6)
See full list of schools located in Jacksonville Beach
Notable locations in Jacksonville Beach: (A) , Jacksonville Beach Golf Club (B) , Jacksonville Beach Sewage Treatment Plant (C) , City of Jacksonville Wastewater Treatment Plant (D) , Costa Verde Plaza (E) , Holiday Plaza (F) , Jacksonville Beach Plaza (G) , Pablo Plaza (H) , Times Square Plaza (I) , Beaches Area Historical Society and Archives (J) , Beaches Arts Center (K) , Carver Recreation Center (L) , Jacksonville Beach Fire Department (M) , Jacksonville Fire and Rescue Department Rescue 71 (N) , Jacksonville Beach Patrol (O) , Saint Pauls Catholic Church Nursery (P) . Display/hide their locations on the map
Shopping Centers: (1) , Sleiman South Shopping Center (2) , Pablo Plaza Shopping Center (3) . Display/hide their locations on the map
Churches in Jacksonville Beach include: (A) , Ocean Park Church (B) , First Assembly of God Church (C) , Kingdom Hall of Jehovahs Witnesses (D) , Christian Missions International (E) , The Psalms Church (F) , Calvary Chapel of Jacksonville (G) , Lighthouse Christian Center (H) , Jacksonville Beach Church of God (I) . Display/hide their locations on the map
Cemetery: (1) . Display/hide its location on the map
Lakes: (A) , Lake Duval (B) . Display/hide their locations on the map
Creeks: (A) , Cradle Creek (B) . Display/hide their locations on the map
Parks in Jacksonville Beach include: (1) , Gonzales Park (2) . Display/hide their locations on the map
Tourist attractions:
Hotel:
Birthplace of: Bryan Barker - 2005 NFL player (St. Louis Rams, born : Jun 28, 1964), Noah Jackson - Football player.
Duval County has a predicted average indoor radon screening level less than 2 pCi/L (pico curies per liter) - Low Potential Average household size: This city:
2.1 peopleFlorida:
2.5 people
Percentage of family households: This city:
49.7%Whole state:
65.2%
Percentage of households with unmarried partners: This city:
7.5%Whole state:
7.3%
Likely homosexual households (counted as self-reported same-sex unmarried-partner households)
Lesbian couples: 0.4% of all households Gay men: 0.4% of all households
People in group quarters in Jacksonville Beach in 2010:
111 people in nursing facilities/skilled-nursing facilities
69 people in other noninstitutional facilities
26 people in group homes intended for adults
People in group quarters in Jacksonville Beach in 2000:
188 people in nursing homes
60 people in other noninstitutional group quarters
2 people in religious group quarters
Banks with branches in Jacksonville Beach (2011 data):
Wells Fargo Bank, National Association: South Jacksonville Beach Branch at 3740 South 3rd Street (A1a), branch established on 1993/10/22; Jacksonville Beaches Branch at 233 North Third Street, branch established on 1938/09/10. Info updated 2011/04/05: Bank assets: $1,161,490.0 mil, Deposits: $905,653.0 mil, headquarters in Sioux Falls, SD, positive income , 6395 total offices , Holding Company: Wells Fargo & Company
The Jacksonville Bank: Oceanside Bank Branch at 1315 South Third Street, branch established on 1997/07/21. Info updated 2010/11/30: Bank assets: $580.7 mil, Deposits: $474.7 mil, headquarters in Jacksonville, FL, positive income , Commercial Lending Specialization, 9 total offices , Holding Company: Capgen Capital Group Iv Lp
Iberiabank: South Third Street Branch at 3288 South Third Street, branch established on 1996/02/01. Info updated 2011/06/08: Bank assets: $11,676.7 mil, Deposits: $9,387.9 mil, headquarters in Lafayette, LA, positive income , Commercial Lending Specialization, 187 total offices , Holding Company: Iberiabank Corporation
Bank of America, National Association: Marsh Landing Branch at 860 Marsh Landing Parkway, branch established on 1986/04/01. Info updated 2009/11/18: Bank assets: $1,451,969.3 mil, Deposits: $1,077,176.8 mil, headquarters in Charlotte, NC, positive income , 5782 total offices , Holding Company: Bank Of America Corporation
SunTrust Bank: South Beach Branch at 3720 South Third Street, branch established on 1990/08/27. Info updated 2010/05/27: Bank assets: $171,291.7 mil, Deposits: $129,833.2 mil, headquarters in Atlanta, GA, positive income , Commercial Lending Specialization, 1716 total offices , Holding Company: Suntrust Banks, Inc.
Atlantic Coast Bank: Jax Beach Branch at 1700 South Third Street, branch established on 1997/01/27. Info updated 2011/09/01: Bank assets: $789.8 mil, Deposits: $510.1 mil, headquarters in Jacksonville, FL, negative income in the last year , Mortgage Lending Specialization, 12 total offices
For population 15 years and over in Jacksonville Beach:
Never married: 32.2%Now married: 50.5%Separated: 1.0%Widowed: 4.7%Divorced: 11.7% For population 25 years and over in Jacksonville Beach:
High school or higher: 96.4%Bachelor's degree or higher: 57.9%Graduate or professional degree: 24.6%Unemployed: 3.7%Mean travel time to work (commute): 16.9 minutes
Education Gini index (Inequality in education) Here:
10.0Florida average:
12.2
Religion statistics for Jacksonville Beach, FL (based on Duval County data)
Religion Adherents Congregations Evangelical Protestant 266,356 587 Catholic 78,167 25 Black Protestant 53,508 86 Mainline Protestant 52,038 111 Other 26,972 64 Orthodox 3,414 12 None 383,808 -
Source: Clifford Grammich, Kirk Hadaway, Richard Houseal, Dale E.Jones, Alexei Krindatch, Richie Stanley and Richard H.Taylor. 2012. 2010 U.S.Religion Census: Religious Congregations & Membership Study. Association of Statisticians of American Religious Bodies. Jones, Dale E., et al. 2002. Congregations and Membership in the United States 2000. Nashville, TN: Glenmary Research Center. Graphs represent county-level data
Food Environment Statistics: Number of grocery stores : 225Duval County :
2.66 / 10,000 pop.Florida :
2.04 / 10,000 pop.
Number of supercenters and club stores : 10Duval County :
0.12 / 10,000 pop.Florida :
0.11 / 10,000 pop.
Number of convenience stores (no gas) : 130Here :
1.53 / 10,000 pop.Florida :
1.28 / 10,000 pop.
Number of convenience stores (with gas) : 281This county :
3.32 / 10,000 pop.Florida :
3.04 / 10,000 pop.
Number of full-service restaurants : 614This county :
7.25 / 10,000 pop.State :
7.45 / 10,000 pop.
Adult diabetes rate : This county :
10.4%State :
9.2%
Adult obesity rate : Duval County :
27.5%Florida :
23.7%
Low-income preschool obesity rate : Duval County :
10.9%Florida :
14.0%
Health and Nutrition: Healthy diet rate : Jacksonville Beach:
54.4%Florida:
51.4%
Average overall health of teeth and gums : This city:
54.1%Florida:
49.4%
Average BMI : Jacksonville Beach:
27.9Florida:
28.6
People feeling badly about themselves : This city:
18.8%Florida:
19.5%
People not drinking alcohol at all : Jacksonville Beach:
8.1%Florida:
10.7%
Average hours sleeping at night : Overweight people : This city:
32.4%Florida:
34.7%
General health condition : Jacksonville Beach:
61.9%State:
57.0%
Average condition of hearing : This city:
81.3%Florida:
79.2%
More about Health and Nutrition of Jacksonville Beach, FL Residents
Local government employment and payroll (March 2022)
Function
Full-time employees
Monthly full-time payroll
Average yearly full-time wage
Part-time employees
Monthly part-time payroll
Electric Power
78 $427,869 $65,826 1 $4,265 Police Protection - Officers
65 $444,518 $82,065 2 $4,256 Financial Administration
41 $229,314 $67,116 6 $20,542 Firefighters
33 $221,285 $80,467 0 $0 Sewerage
27 $135,822 $60,365 2 $2,155 Streets and Highways
25 $63,159 $30,316 0 $0 Police - Other
24 $144,872 $72,436 15 $13,126 Parks and Recreation
19 $143,125 $90,395 45 $57,463 Other Government Administration
12 $88,445 $88,445 11 $14,507 Water Supply
10 $58,517 $70,220 2 $4,194 Other and Unallocable
6 $32,546 $65,092 0 $0 Housing and Community Development (Local)
1 $9,417 $113,004 0 $0 Fire - Other
1 $5,356 $64,272 0 $0
Totals for Government
342 $2,004,244 $70,324 84 $120,507
Jacksonville Beach government finances - Expenditure in 2021 (per resident):
Construction - General - Other: $1,110,000 ($47.19)
Regular Highways: $151,000 ($6.42)Current Operations - Electric Utilities: $66,646,000 ($2833.47)
General - Other: $11,928,000 ($507.12)Police Protection: $10,200,000 ($433.66)Financial Administration: $8,716,000 ($370.56)Sewerage: $6,571,000 ($279.37)Parks and Recreation: $4,992,000 ($212.24)Local Fire Protection: $4,272,000 ($181.62)Solid Waste Management: $3,615,000 ($153.69)Regular Highways: $1,667,000 ($70.87)Water Utilities: $1,400,000 ($59.52)Central Staff Services: $1,207,000 ($51.32)Gas Utilities: $1,139,000 ($48.42)Protective Inspection and Regulation - Other: $667,000 ($28.36)Judicial and Legal Services: $404,000 ($17.18)Public Welfare - Other: $106,000 ($4.51)Natural Resources - Other: $77,000 ($3.27)Health - Other: $14,000 ($0.60)Electric Utilities - Interest on Debt: $82,000 ($3.49)
Other Capital Outlay - Central Staff Services: $5,953,000 ($253.09)
Electric Utilities: $4,022,000 ($171.00)Sewerage: $3,121,000 ($132.69)Water Utilities: $735,000 ($31.25)Parks and Recreation: $451,000 ($19.17)Police Protection: $257,000 ($10.93)Gas Utilities: $154,000 ($6.55)Natural Resources - Other: $122,000 ($5.19)Solid Waste Management: $37,000 ($1.57)Protective Inspection and Regulation - Other: $26,000 ($1.11)Health - Other: $19,000 ($0.81)Local Fire Protection: $8,000 ($0.34)Judicial and Legal Services: $1,000 ($0.04)Water Utilities - Interest on Debt: $55,000 ($2.34)
Jacksonville Beach government finances - Revenue in 2021 (per resident):
Charges - Sewerage: $8,121,000 ($345.27)
Solid Waste Management: $3,490,000 ($148.38)Parks and Recreation: $2,668,000 ($113.43)Other: $218,000 ($9.27)Parking Facilities: $179,000 ($7.61)Miscellaneous Commercial Activities: $12,000 ($0.51)Federal Intergovernmental - Other: $204,000 ($8.67)
Housing and Community Development: $142,000 ($6.04)Local Intergovernmental - Other: $1,625,000 ($69.09)
General Local Government Support: $1,015,000 ($43.15)Miscellaneous - Interest Earnings: $5,660,000 ($240.64)
General Revenue - Other: $829,000 ($35.25)Rents: $789,000 ($33.54)Fines and Forfeits: $301,000 ($12.80)Sale of Property: $30,000 ($1.28)Donations From Private Sources: $19,000 ($0.81)Revenue - Electric Utilities: $79,824,000 ($3393.73)
Water Utilities: $8,121,000 ($345.27)Gas Utilities: $1,675,000 ($71.21)State Intergovernmental - General Local Government Support: $3,371,000 ($143.32)
Other: $6,000 ($0.26)Tax - Property: $20,971,000 ($891.59)
Other License: $1,557,000 ($66.20)General Sales and Gross Receipts: $1,402,000 ($59.61)Public Utilities Sales: $1,159,000 ($49.28)Insurance Premiums Sales: $837,000 ($35.59)Motor Fuels Sales: $784,000 ($33.33)Other Selective Sales: $328,000 ($13.94)Occupation and Business License - Other: $270,000 ($11.48)Documentary and Stock Transfer: $44,000 ($1.87)
Jacksonville Beach government finances - Debt in 2021 (per resident):
Long Term Debt - Beginning Outstanding - Unspecified Public Purpose: $2,162,000 ($91.92)
Retired Unspecified Public Purpose: $138,000 ($5.87)
Jacksonville Beach government finances - Cash and Securities in 2021 (per resident):
Other Funds - Cash and Securities: $196,102,000 ($8337.32)
8.15% of this county's 2021 resident taxpayers lived in other counties in 2020 ($65,269 average adjusted gross income )
Here:
8.15%Florida average:
8.80%
0.10% of residents moved from foreign countries ($679 average AGI )Duval County:
0.10%Florida average:
0.05%
Top counties from which taxpayers relocated into this county between 2020 and 2021:
7.44% of this county's 2020 resident taxpayers moved to other counties in 2021 ($65,097 average adjusted gross income )
Here:
7.44%Florida average:
7.45%
0.08% of residents moved to foreign countries ($572 average AGI )Duval County:
0.08%Florida average:
0.04%
Top counties to which taxpayers relocated from this county between 2020 and 2021:
Businesses in Jacksonville Beach, FL
Name Count Name Count
AT&T 1 McDonald's 2 Ace Hardware 1 New Balance 1 Advance Auto Parts 1 Nike 1 Bed Bath & Beyond 1 Office Depot 1 Best Western 1 Outback 1 Blockbuster 1 Outback Steakhouse 1 CVS 1 Panera Bread 1 Chick-Fil-A 1 Pier 1 Imports 1 Comfort Inn 1 Publix Super Markets 2 Dairy Queen 1 Quality 1 Domino's Pizza 1 SONIC Drive-In 1 Dunkin Donuts 1 Sprint Nextel 2 FedEx 3 Staples 1 GNC 1 Starbucks 2 GameStop 1 Subway 2 Goodwill 1 T-Mobile 1 H&R Block 1 Taco Bell 1 Hilton 1 Target 1 Holiday Inn 1 The Room Place 1 Home Depot 1 Tire Kingdom 1 JoS. A. Bank 1 UPS 6 KFC 1 Vans 3 LensCrafters 1 Waffle House 1 Marriott 2 Walgreens 1 Marshalls 1
Strongest AM radio stations in Jacksonville Beach:
WQOP (1600 AM; 5 kW; ATLANTIC BEACH, FL; Owner: QUEEN OF PEACE RADIO, INC.)
WIOJ (1010 AM; 10 kW; JACKSONVILLE BEACH, FL)
WOBS (1530 AM; daytime; 50 kW; JACKSONVILLE, FL; Owner: WORD BROADCASTING NETWORK, INC.)
WOKV (690 AM; 50 kW; JACKSONVILLE, FL; Owner: COX RADIO, INC.)
WGSR (1570 AM; 50 kW; FERNANDINA BEACH, FL; Owner: RJM COMMUNICATIONS, INC)
WCGL (1360 AM; 5 kW; JACKSONVILLE, FL; Owner: JBD COMMUNICATIONS, INC.)
WBWL (600 AM; 5 kW; JACKSONVILLE, FL)
WFXJ (930 AM; 5 kW; JACKSONVILLE, FL; Owner: CLEAR CHANNEL BROADCASTING LICENSES, INC.)
WSVE (1280 AM; 5 kW; JACKSONVILLE, FL; Owner: WILLIS & SONS, INC.)
WAYR (550 AM; 5 kW; ORANGE PARK, FL; Owner: GOOD TIDINGS TRUST, INC.)
WROS (1050 AM; 5 kW; JACKSONVILLE, FL; Owner: THE ROSE OF JACKSONVILLE)
WEWC (1160 AM; 5 kW; CALLAHAN, FL; Owner: CIRCLE BROADCASTING OF AMERICA, INC.)
WJGR (1320 AM; 5 kW; JACKSONVILLE, FL; Owner: CARON BROADCASTING, INC.)
Strongest FM radio stations in Jacksonville Beach:
WFYV-FM (104.5 FM; ATLANTIC BEACH, FL; Owner: COX RADIO, INC.)
WMXQ (102.9 FM; JACKSONVILLE, FL; Owner: COX RADIO, INC.)
WQIK-FM (99.1 FM; JACKSONVILLE, FL; Owner: CITICASTERS LICENSES, L.P.)
WROO (107.3 FM; JACKSONVILLE, FL; Owner: CLEAR CHANNEL BROADCASTING LICENSES, INC.)
WFKS (97.9 FM; NEPTUNE BEACH, FL; Owner: CLEAR CHANNEL BROADCASTING LICENSES, INC.)
WEJZ (96.1 FM; JACKSONVILLE, FL; Owner: RENDA BROADCASTING CORP. OF NEVADA)
WJCT-FM (89.9 FM; JACKSONVILLE, FL; Owner: WJCT, INC.)
W279AG (103.7 FM; ATLANTIC BEACH, FL; Owner: NEW COVENANT EDUCATIONAL MINISTRIES)
WKQL (96.9 FM; JACKSONVILLE, FL; Owner: COX RADIO, INC.)
WNCM-FM (88.1 FM; JACKSONVILLE, FL; Owner: NEW COVENANT EDUCATIONAL MINISTRIES)
WKTZ-FM (90.9 FM; JACKSONVILLE, FL; Owner: JONES COLLEGE)
WAPE-FM (95.1 FM; JACKSONVILLE, FL; Owner: COX RADIO, INC.)
WBGB (106.5 FM; PONTE VEDRA BEACH, FL; Owner: CARON BROADCASTING, INC.)
W232AY (94.3 FM; JACKSONVILLE, FL; Owner: NEW COVENANT EDUCATIONAL MINISTRIES, INC.)
WJFR (88.7 FM; JACKSONVILLE, FL; Owner: FAMILY STATIONS, INC.)
WSOL-FM (101.5 FM; BRUNSWICK, GA; Owner: CITICASTERS LICENSES, L.P.)
WWRR (100.7 FM; BRUNSWICK, GA; Owner: RENDA BROADCASTING CORP. OF NEVADA)
WJBT (92.7 FM; GREEN COVE SPRINGS, FL; Owner: CITICASTERS LICENSES, L.P.)
WJSJ (105.3 FM; FERNANDINA BEACH, FL; Owner: TAMA BROADCASTING, INC.)
WPLA (93.3 FM; CALLAHAN, FL; Owner: CLEAR CHANNEL BROADCASTING LICENSES, INC.)
TV broadcast stations around Jacksonville Beach:
WJWB (Channel 17; JACKSONVILLE, FL; Owner: MEDIA GENERAL COMMUNICATIONS, INC.)
WJCT (Channel 7; JACKSONVILLE, FL; Owner: WJCT, INC.)
WTLV (Channel 12; JACKSONVILLE, FL; Owner: MULTIMEDIA HOLDINGS CORPORATION)
WJXX (Channel 25; ORANGE PARK, FL; Owner: GANNETT RIVER STATES PUBLISHING CORPORATION)
WJEB-TV (Channel 59; JACKSONVILLE, FL; Owner: JACKSONVILLE EDUCATORS BROADCASTING, INC.)
WJXT (Channel 4; JACKSONVILLE, FL; Owner: POST-NEWSWEEK STATIONS, FLORIDA, INC.)
W09CF (Channel 9; JACKSONVILLE, FL; Owner: BENJAMIN PEREZ)
WAWS (Channel 30; JACKSONVILLE, FL; Owner: CLEAR CHANNEL BROADCASTING LICENSES, INC.)
WTEV-TV (Channel 47; JACKSONVILLE, FL; Owner: CLEAR CHANNEL BROADCASTING LICENSES, INC.)
WBXJ-CA (Channel 10; JACKSONVILLE, ETC., FL; Owner: THE BOX WORLDWIDE LLC)
W45BZ (Channel 45; JACKSONVILLE, FL; Owner: DEEPAK VISWANATH)
WPXJ-LP (Channel 41; JACKSONVILLE, FL; Owner: PAXSON COMMUNICATIONS LICENSE COMPANY, LLC)
W50CO (Channel 50; JACKSONVILLE, FL; Owner: THREE ANGELS BROADCASTING NETWORK)
W54CS (Channel 54; JACKSONVILLE, FL; Owner: VENTANA TELEVISION, INC.)
WWRJ-LP (Channel 27; JACKSONVILLE, FL; Owner: U.S. INTERACTIVE, L.L.C.)
WUBF-LP (Channel 69; JACKSONVILLE, FL; Owner: UMMAT BROADCASTING CORPORATION INC.)
Home Mortgage Disclosure Act Aggregated Statistics For Year 2009(Based on 3 full and 1 partial tracts) A) FHA, FSA/RHS & VA B) Conventional C) Refinancings D) Home Improvement Loans E) Loans on Dwellings For 5+ Families F) Non-occupant Loans on G) Loans On Manufactured Number Average Value Number Average Value Number Average Value Number Average Value Number Average Value Number Average Value Number Average Value
LOANS ORIGINATED 88 $222,941 133 $259,548 384 $232,860 20 $96,637 0 $0 74 $292,069 2 $26,270 APPLICATIONS APPROVED, NOT ACCEPTED 7 $184,733 13 $254,371 36 $240,044 3 $47,047 0 $0 11 $237,864 0 $0 APPLICATIONS DENIED 15 $187,638 34 $247,015 184 $253,837 11 $81,735 1 $318,000 42 $247,703 0 $0 APPLICATIONS WITHDRAWN 16 $228,184 41 $214,178 121 $257,155 4 $305,835 0 $0 27 $244,999 1 $8,550 FILES CLOSED FOR INCOMPLETENESS 6 $252,107 5 $321,210 28 $220,470 1 $303,870 0 $0 6 $171,730 0 $0
Aggregated Statistics For Year 2008(Based on 3 full and 1 partial tracts) A) FHA, FSA/RHS & VA B) Conventional C) Refinancings D) Home Improvement Loans E) Loans on Dwellings For 5+ Families F) Non-occupant Loans on G) Loans On Manufactured Number Average Value Number Average Value Number Average Value Number Average Value Number Average Value Number Average Value Number Average Value
LOANS ORIGINATED 27 $246,324 209 $304,408 302 $228,299 31 $112,270 4 $530,500 110 $282,346 0 $0 APPLICATIONS APPROVED, NOT ACCEPTED 3 $285,197 32 $390,432 68 $262,919 3 $195,333 0 $0 24 $292,995 0 $0 APPLICATIONS DENIED 8 $202,838 50 $424,861 174 $272,779 19 $135,041 0 $0 42 $304,725 3 $32,390 APPLICATIONS WITHDRAWN 3 $202,203 37 $440,138 113 $266,735 8 $213,348 0 $0 29 $283,307 0 $0 FILES CLOSED FOR INCOMPLETENESS 2 $219,500 16 $216,684 25 $258,028 1 $540,000 0 $0 7 $246,294 0 $0
Aggregated Statistics For Year 2007(Based on 3 full and 1 partial tracts) A) FHA, FSA/RHS & VA B) Conventional C) Refinancings D) Home Improvement Loans E) Loans on Dwellings For 5+ Families F) Non-occupant Loans on G) Loans On Manufactured Number Average Value Number Average Value Number Average Value Number Average Value Number Average Value Number Average Value Number Average Value
LOANS ORIGINATED 5 $216,526 421 $333,274 528 $265,717 53 $113,343 0 $0 239 $364,484 1 $29,440 APPLICATIONS APPROVED, NOT ACCEPTED 0 $0 90 $391,593 114 $244,481 17 $62,702 0 $0 52 $316,474 1 $95,910 APPLICATIONS DENIED 2 $203,035 123 $426,392 300 $303,656 39 $92,255 0 $0 86 $418,906 7 $43,410 APPLICATIONS WITHDRAWN 0 $0 62 $376,692 180 $251,021 14 $117,592 4 $229,630 43 $346,918 0 $0 FILES CLOSED FOR INCOMPLETENESS 1 $177,000 48 $346,958 57 $270,364 6 $145,177 0 $0 30 $337,925 0 $0
Aggregated Statistics For Year 2006(Based on 3 full and 1 partial tracts) A) FHA, FSA/RHS & VA B) Conventional C) Refinancings D) Home Improvement Loans E) Loans on Dwellings For 5+ Families F) Non-occupant Loans on G) Loans On Manufactured Number Average Value Number Average Value Number Average Value Number Average Value Number Average Value Number Average Value Number Average Value
LOANS ORIGINATED 3 $223,613 649 $315,289 617 $231,301 74 $114,265 1 $18,992,000 290 $325,475 4 $36,018 APPLICATIONS APPROVED, NOT ACCEPTED 1 $337,110 108 $344,583 111 $242,725 12 $63,339 0 $0 45 $356,820 4 $137,502 APPLICATIONS DENIED 3 $264,333 164 $306,551 226 $258,546 41 $132,922 1 $235,000 78 $293,717 9 $63,830 APPLICATIONS WITHDRAWN 0 $0 71 $282,693 187 $228,487 22 $145,466 1 $5,000,000 28 $290,151 0 $0 FILES CLOSED FOR INCOMPLETENESS 1 $269,000 34 $333,971 66 $254,837 2 $122,000 0 $0 23 $351,970 0 $0
Aggregated Statistics For Year 2005(Based on 3 full and 1 partial tracts) A) FHA, FSA/RHS & VA B) Conventional C) Refinancings D) Home Improvement Loans E) Loans on Dwellings For 5+ Families F) Non-occupant Loans on G) Loans On Manufactured Number Average Value Number Average Value Number Average Value Number Average Value Number Average Value Number Average Value Number Average Value
LOANS ORIGINATED 4 $173,540 804 $270,272 739 $205,830 76 $135,837 3 $876,000 359 $272,731 2 $41,000 APPLICATIONS APPROVED, NOT ACCEPTED 0 $0 96 $267,600 119 $217,336 15 $68,165 0 $0 40 $372,286 12 $37,918 APPLICATIONS DENIED 0 $0 134 $251,574 250 $233,461 38 $73,427 1 $145,000 80 $236,265 20 $46,920 APPLICATIONS WITHDRAWN 0 $0 99 $259,251 201 $217,851 27 $96,869 2 $201,115 46 $256,352 4 $18,042 FILES CLOSED FOR INCOMPLETENESS 0 $0 26 $265,555 89 $228,915 3 $62,663 1 $214,000 10 $302,160 0 $0
Aggregated Statistics For Year 2004(Based on 3 full and 1 partial tracts) A) FHA, FSA/RHS & VA B) Conventional C) Refinancings D) Home Improvement Loans E) Loans on Dwellings For 5+ Families F) Non-occupant Loans on G) Loans On Manufactured Number Average Value Number Average Value Number Average Value Number Average Value Number Average Value Number Average Value Number Average Value
LOANS ORIGINATED 7 $185,571 871 $205,631 708 $172,361 77 $83,526 7 $1,297,857 333 $197,117 4 $57,372 APPLICATIONS APPROVED, NOT ACCEPTED 1 $174,730 99 $203,312 114 $178,520 14 $69,246 0 $0 51 $214,265 7 $59,507 APPLICATIONS DENIED 5 $153,656 142 $193,938 228 $186,594 32 $107,517 0 $0 63 $215,869 7 $43,129 APPLICATIONS WITHDRAWN 1 $232,000 96 $238,665 212 $164,917 17 $90,171 0 $0 45 $217,050 1 $80,000 FILES CLOSED FOR INCOMPLETENESS 0 $0 21 $316,602 38 $158,884 4 $96,230 0 $0 8 $202,474 0 $0
Aggregated Statistics For Year 2003(Based on 3 full and 1 partial tracts) A) FHA, FSA/RHS & VA B) Conventional C) Refinancings D) Home Improvement Loans E) Loans on Dwellings For 5+ Families F) Non-occupant Loans on Number Average Value Number Average Value Number Average Value Number Average Value Number Average Value Number Average Value
LOANS ORIGINATED 6 $196,052 679 $190,401 1,564 $144,047 32 $64,413 1 $400,000 348 $179,408 APPLICATIONS APPROVED, NOT ACCEPTED 0 $0 54 $207,192 171 $155,909 13 $41,126 1 $250,000 25 $169,706 APPLICATIONS DENIED 3 $131,713 79 $191,976 272 $148,561 28 $50,298 2 $670,000 48 $156,313 APPLICATIONS WITHDRAWN 1 $191,000 55 $199,306 266 $149,328 11 $76,536 1 $428,000 32 $178,982 FILES CLOSED FOR INCOMPLETENESS 0 $0 13 $157,105 71 $193,223 2 $56,480 0 $0 9 $121,486
Aggregated Statistics For Year 2002(Based on 3 full and 1 partial tracts) A) FHA, FSA/RHS & VA B) Conventional C) Refinancings D) Home Improvement Loans E) Loans on Dwellings For 5+ Families F) Non-occupant Loans on Number Average Value Number Average Value Number Average Value Number Average Value Number Average Value Number Average Value
LOANS ORIGINATED 21 $146,080 607 $180,005 1,034 $138,063 58 $42,937 3 $650,000 275 $174,604 APPLICATIONS APPROVED, NOT ACCEPTED 4 $127,620 67 $179,473 112 $140,883 24 $40,404 0 $0 28 $164,918 APPLICATIONS DENIED 1 $189,920 52 $186,887 195 $136,510 41 $30,406 1 $480,000 20 $163,496 APPLICATIONS WITHDRAWN 1 $139,000 51 $172,035 200 $138,526 9 $48,389 0 $0 25 $161,875 FILES CLOSED FOR INCOMPLETENESS 0 $0 23 $204,919 64 $130,257 5 $27,000 0 $0 5 $151,676
Aggregated Statistics For Year 2001(Based on 3 full and 1 partial tracts) A) FHA, FSA/RHS & VA B) Conventional C) Refinancings D) Home Improvement Loans E) Loans on Dwellings For 5+ Families F) Non-occupant Loans on Number Average Value Number Average Value Number Average Value Number Average Value Number Average Value Number Average Value
LOANS ORIGINATED 33 $134,461 497 $168,250 822 $125,578 60 $34,756 3 $428,000 167 $155,620 APPLICATIONS APPROVED, NOT ACCEPTED 2 $30,990 43 $143,161 84 $114,654 20 $28,846 0 $0 11 $208,667 APPLICATIONS DENIED 5 $115,842 82 $93,895 219 $111,878 30 $34,875 0 $0 20 $105,129 APPLICATIONS WITHDRAWN 8 $113,425 75 $159,966 185 $121,465 8 $30,758 0 $0 18 $141,126 FILES CLOSED FOR INCOMPLETENESS 1 $106,000 22 $152,410 41 $131,542 3 $47,700 0 $0 4 $143,522
Aggregated Statistics For Year 2000(Based on 3 full and 1 partial tracts) A) FHA, FSA/RHS & VA B) Conventional C) Refinancings D) Home Improvement Loans E) Loans on Dwellings For 5+ Families F) Non-occupant Loans on Number Average Value Number Average Value Number Average Value Number Average Value Number Average Value Number Average Value
LOANS ORIGINATED 41 $115,674 421 $150,998 236 $99,345 184 $26,662 2 $5,611,660 89 $139,896 APPLICATIONS APPROVED, NOT ACCEPTED 2 $109,500 51 $136,132 57 $101,375 31 $34,040 0 $0 10 $109,489 APPLICATIONS DENIED 5 $65,888 133 $76,977 150 $86,465 41 $24,792 0 $0 23 $73,797 APPLICATIONS WITHDRAWN 11 $96,911 69 $124,637 98 $76,346 18 $45,280 0 $0 9 $90,234 FILES CLOSED FOR INCOMPLETENESS 2 $104,500 18 $161,569 31 $83,326 2 $20,000 0 $0 6 $98,433
Aggregated Statistics For Year 1999(Based on 2 full and 2 partial tracts) A) FHA, FSA/RHS & VA B) Conventional C) Refinancings D) Home Improvement Loans E) Loans on Dwellings For 5+ Families F) Non-occupant Loans on Number Average Value Number Average Value Number Average Value Number Average Value Number Average Value Number Average Value
LOANS ORIGINATED 60 $112,910 453 $127,282 395 $101,249 80 $24,514 1 $238,030 103 $113,485 APPLICATIONS APPROVED, NOT ACCEPTED 4 $105,450 53 $125,695 107 $86,589 24 $19,499 0 $0 14 $93,052 APPLICATIONS DENIED 3 $92,993 130 $82,745 194 $79,219 49 $23,273 0 $0 18 $93,514 APPLICATIONS WITHDRAWN 8 $124,696 67 $136,457 132 $81,655 21 $48,521 0 $0 7 $120,410 FILES CLOSED FOR INCOMPLETENESS 2 $85,100 15 $144,179 31 $93,738 1 $29,680 0 $0 5 $53,510
Detailed HMDA statistics for the following Tracts:
0141.01
, 0141.02 , 0142.01 , 0142.02
Private Mortgage Insurance Companies Aggregated Statistics For Year 2009(Based on 3 full and 1 partial tracts) A) Conventional B) Refinancings C) Non-occupant Loans on Number Average Value Number Average Value Number Average Value
LOANS ORIGINATED 20 $243,696 4 $223,000 2 $213,820 APPLICATIONS APPROVED, NOT ACCEPTED 3 $259,220 3 $258,627 0 $0 APPLICATIONS DENIED 7 $215,286 4 $248,558 1 $136,740 APPLICATIONS WITHDRAWN 0 $0 0 $0 0 $0 FILES CLOSED FOR INCOMPLETENESS 0 $0 1 $196,000 0 $0
Aggregated Statistics For Year 2008(Based on 3 full and 1 partial tracts) A) Conventional B) Refinancings C) Non-occupant Loans on Number Average Value Number Average Value Number Average Value
LOANS ORIGINATED 35 $259,114 16 $258,512 8 $210,799 APPLICATIONS APPROVED, NOT ACCEPTED 18 $272,713 13 $240,268 10 $261,298 APPLICATIONS DENIED 2 $306,920 3 $250,790 3 $275,613 APPLICATIONS WITHDRAWN 0 $0 2 $321,440 0 $0 FILES CLOSED FOR INCOMPLETENESS 0 $0 0 $0 0 $0
Aggregated Statistics For Year 2007(Based on 3 full and 1 partial tracts) A) Conventional B) Refinancings C) Non-occupant Loans on Number Average Value Number Average Value Number Average Value
LOANS ORIGINATED 64 $265,940 31 $317,937 15 $310,093 APPLICATIONS APPROVED, NOT ACCEPTED 18 $322,623 8 $289,399 5 $284,852 APPLICATIONS DENIED 0 $0 4 $404,028 2 $407,000 APPLICATIONS WITHDRAWN 1 $733,000 1 $174,730 2 $453,865 FILES CLOSED FOR INCOMPLETENESS 0 $0 0 $0 0 $0
Aggregated Statistics For Year 2006(Based on 3 full and 1 partial tracts) A) Conventional B) Refinancings C) Non-occupant Loans on Number Average Value Number Average Value Number Average Value
LOANS ORIGINATED 53 $259,923 16 $302,783 19 $285,092 APPLICATIONS APPROVED, NOT ACCEPTED 11 $231,261 3 $395,817 6 $234,097 APPLICATIONS DENIED 2 $256,390 1 $297,220 1 $297,220 APPLICATIONS WITHDRAWN 3 $251,923 2 $289,630 0 $0 FILES CLOSED FOR INCOMPLETENESS 1 $179,470 0 $0 1 $179,470
Aggregated Statistics For Year 2005(Based on 3 full and 1 partial tracts) A) Conventional B) Refinancings C) Non-occupant Loans on Number Average Value Number Average Value Number Average Value
LOANS ORIGINATED 81 $224,307 18 $242,906 23 $209,104 APPLICATIONS APPROVED, NOT ACCEPTED 12 $223,588 4 $212,455 2 $167,130 APPLICATIONS DENIED 3 $596,187 0 $0 0 $0 APPLICATIONS WITHDRAWN 4 $208,068 1 $234,000 1 $148,000 FILES CLOSED FOR INCOMPLETENESS 1 $580,000 0 $0 1 $580,000
Aggregated Statistics For Year 2004(Based on 3 full and 1 partial tracts) A) Conventional B) Refinancings C) Non-occupant Loans on Number Average Value Number Average Value Number Average Value
LOANS ORIGINATED 150 $183,659 29 $218,380 46 $176,812 APPLICATIONS APPROVED, NOT ACCEPTED 21 $189,581 13 $224,447 6 $179,460 APPLICATIONS DENIED 0 $0 0 $0 0 $0 APPLICATIONS WITHDRAWN 7 $212,523 2 $197,390 3 $182,333 FILES CLOSED FOR INCOMPLETENESS 3 $198,000 1 $171,000 0 $0
Aggregated Statistics For Year 2003(Based on 3 full and 1 partial tracts) A) Conventional B) Refinancings C) Non-occupant Loans on Number Average Value Number Average Value Number Average Value
LOANS ORIGINATED 150 $180,553 63 $178,951 30 $162,765 APPLICATIONS APPROVED, NOT ACCEPTED 23 $189,867 19 $208,409 5 $170,532 APPLICATIONS DENIED 1 $313,000 1 $189,920 0 $0 APPLICATIONS WITHDRAWN 16 $194,250 9 $179,002 3 $161,730 FILES CLOSED FOR INCOMPLETENESS 0 $0 0 $0 0 $0
Aggregated Statistics For Year 2002(Based on 3 full and 1 partial tracts) A) Conventional B) Refinancings C) Non-occupant Loans on Number Average Value Number Average Value Number Average Value
LOANS ORIGINATED 161 $169,112 44 $177,788 34 $144,077 APPLICATIONS APPROVED, NOT ACCEPTED 18 $151,322 9 $152,773 7 $127,981 APPLICATIONS DENIED 6 $186,787 3 $145,000 1 $125,000 APPLICATIONS WITHDRAWN 4 $143,220 3 $139,000 0 $0 FILES CLOSED FOR INCOMPLETENESS 2 $201,900 1 $160,480 0 $0
Aggregated Statistics For Year 2001(Based on 3 full and 1 partial tracts) A) Conventional B) Refinancings C) Non-occupant Loans on Number Average Value Number Average Value Number Average Value
LOANS ORIGINATED 156 $157,323 64 $154,725 23 $123,799 APPLICATIONS APPROVED, NOT ACCEPTED 19 $156,919 5 $137,076 2 $80,240 APPLICATIONS DENIED 5 $177,022 4 $138,128 0 $0 APPLICATIONS WITHDRAWN 8 $142,359 3 $193,157 1 $268,000 FILES CLOSED FOR INCOMPLETENESS 1 $160,000 0 $0 0 $0
Aggregated Statistics For Year 2000(Based on 3 full and 1 partial tracts) A) Conventional B) Refinancings C) Non-occupant Loans on Number Average Value Number Average Value Number Average Value
LOANS ORIGINATED 120 $151,210 18 $129,132 13 $116,578 APPLICATIONS APPROVED, NOT ACCEPTED 14 $119,976 4 $150,090 1 $158,580 APPLICATIONS DENIED 13 $125,605 0 $0 0 $0 APPLICATIONS WITHDRAWN 4 $130,028 0 $0 0 $0 FILES CLOSED FOR INCOMPLETENESS 0 $0 0 $0 0 $0
Aggregated Statistics For Year 1999(Based on 2 full and 2 partial tracts) A) Conventional B) Refinancings C) Non-occupant Loans on Number Average Value Number Average Value Number Average Value
LOANS ORIGINATED 148 $138,056 28 $113,229 13 $125,621 APPLICATIONS APPROVED, NOT ACCEPTED 13 $129,936 9 $100,407 2 $99,490 APPLICATIONS DENIED 3 $88,383 1 $103,320 0 $0 APPLICATIONS WITHDRAWN 5 $171,120 1 $99,180 0 $0 FILES CLOSED FOR INCOMPLETENESS 3 $153,793 1 $122,020 0 $0
Detailed PMIC statistics for the following Tracts:
0141.01
, 0141.02 , 0142.01 , 0142.02 Fire-safe hotels and motels in Jacksonville Beach, Florida:
Ocean Air Motel, 208 BCH Blvd, Jacksonville Beach, Florida 32250
Sea Ranch Motel, 27 S 1ST St, Jacksonville Beach, Florida 32250
Sea Breeze Motel, 117 N 1ST Ave, Jacksonville Beach, Florida 32250
Atlantic Shores Motel, 923 S 1ST St, Jacksonville Beach, Florida 32250
Courtyard By Marriott, 1617 N First St, Jacksonville Beach, Florida 32250 Phone: (904) 249-9071, Fax: (904) 241-4321
In Place Motel, 922 S 1ST St, Jacksonville Beach, Florida 32250
Surf Side Inn, 1236 N 1st St, Jacksonville Beach, Florida 32250 Phone: (904) 246-1583
Brampton Inn, 1201 N 1ST St, Jacksonville Beach, Florida 32250 Phone: (904) 241-5333, Fax: (904) 241-1862
6 other hotels and motels
All 14 fire-safe hotels and motels in Jacksonville Beach, Florida
Most common first names in Jacksonville Beach, FL among deceased individuals Name Count Lived (average)
John 182 74.2 years William 147 72.6 years James 141 70.4 years Mary 139 78.8 years Robert 106 71.3 years Helen 72 80.2 years George 72 72.1 years Charles 68 71.8 years Margaret 67 79.8 years Dorothy 61 75.5 years
Most common last names in Jacksonville Beach, FL among deceased individuals Last name Count Lived (average)
Smith 66 77.3 years Jones 48 77.0 years Williams 44 73.6 years Johnson 38 73.3 years Brown 33 73.1 years Miller 31 75.8 years Davis 27 74.1 years Moore 23 78.0 years Thomas 22 73.2 years Wilson 22 73.9 years
Jacksonville Beach compared to Florida state average:
Median household income above state average. Median house value above state average. Unemployed percentage significantly below state average. Black race population percentage significantly below state average. Hispanic race population percentage significantly below state average. Foreign-born population percentage significantly below state average. Length of stay since moving in significantly above state average. Percentage of population with a bachelor's degree or higher significantly above state average. Jacksonville Beach on our top lists :
#36 on the list of "Top 101 cities with the most local government spending on current operations of parks and recreation per resident (population 10,000+)"
#11 on the list of "Top 101 counties with the most Black Protestant adherents"
#13 on the list of "Top 101 counties with the most Evangelical Protestant adherents"
#18 on the list of "Top 101 counties with the highest carbon monoxide air pollution readings in 2012 (ppm)"
#18 on the list of "Top 101 counties with the most Evangelical Protestant congregations"
#20 on the list of "Top 101 counties with the highest ground withdrawal of fresh water for public supply"
Top Patent Applicants
Robert B. Steffen (8)
Russell F. Ross (6)
Brent Matthew Healy (6)
Karen R. Jansen-West (4)
Gregory J. Hofmann (4)
Daniel Ladon Dunn (3)
Harvel K. Crumley (3)
Ernest Chip Venet, Iii (3)
John D. Mix (3)
Kalpathi L. Venkatachalam (3)
Total of 89 patent applications in 2008-2024.

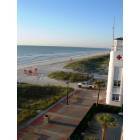
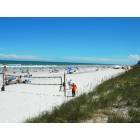

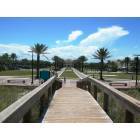

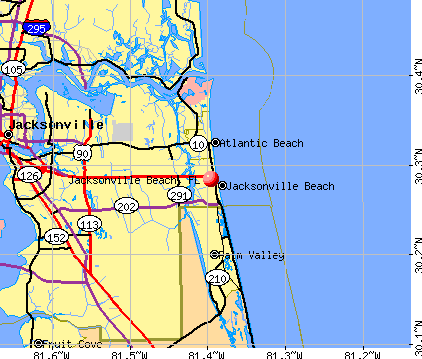


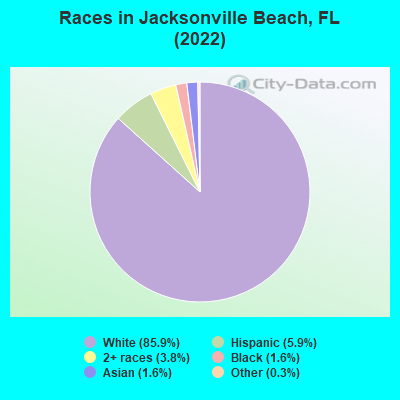
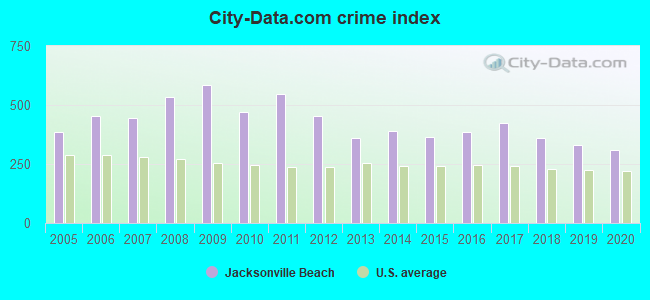
 Recent articles from our blog. Our writers, many of them Ph.D. graduates or candidates, create easy-to-read articles on a wide variety of topics.

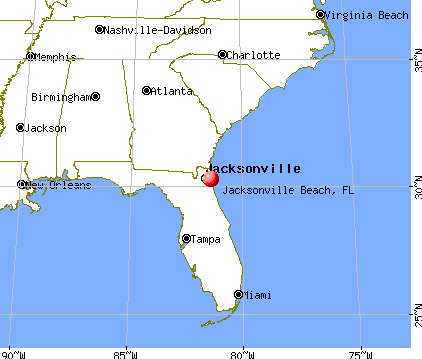
 (15.9 miles
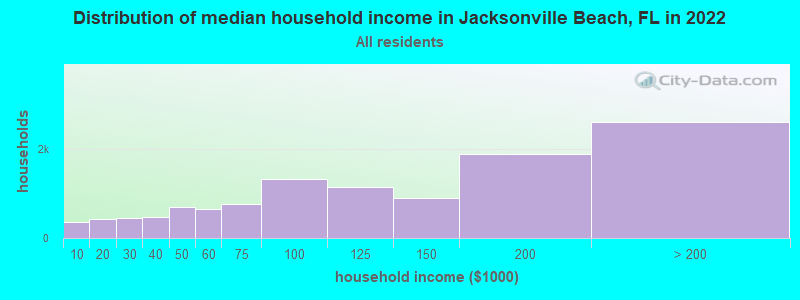
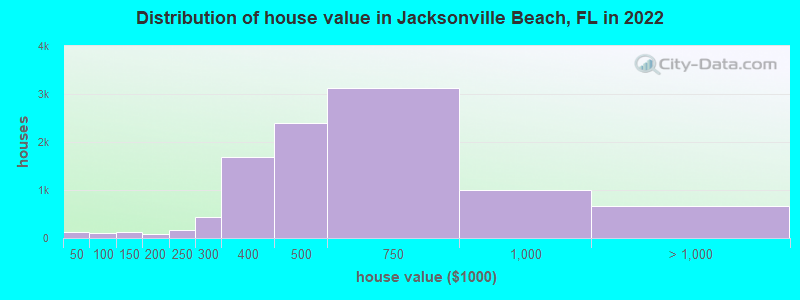
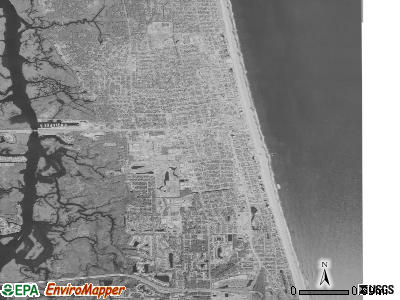
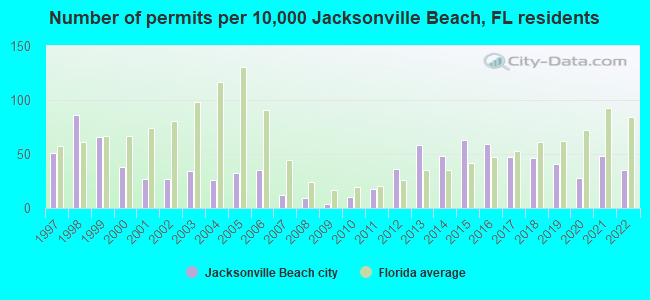
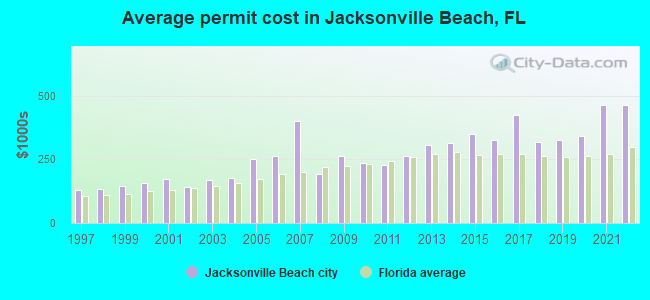
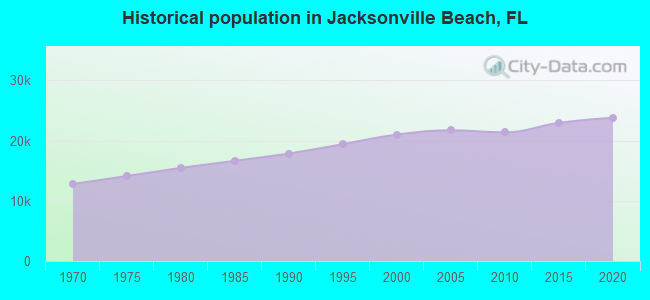
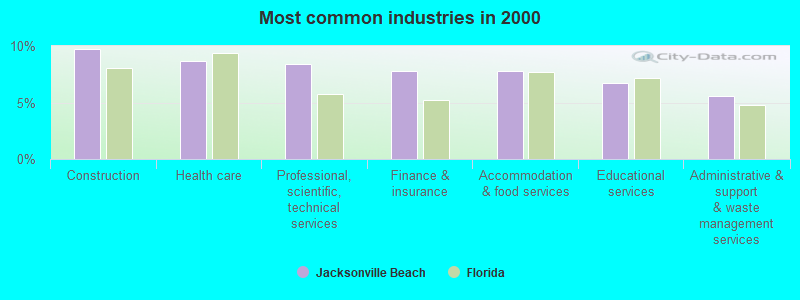
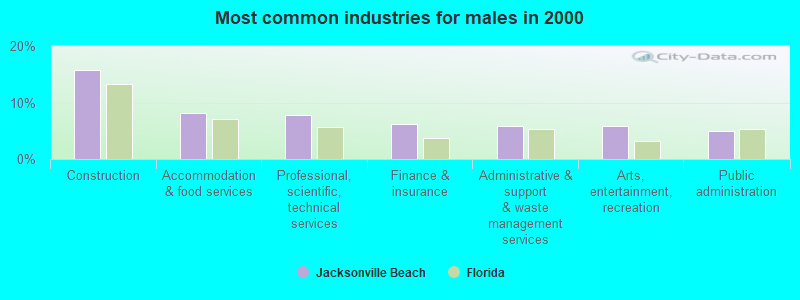
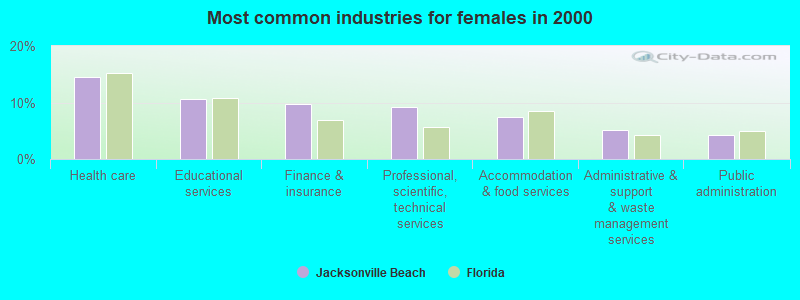
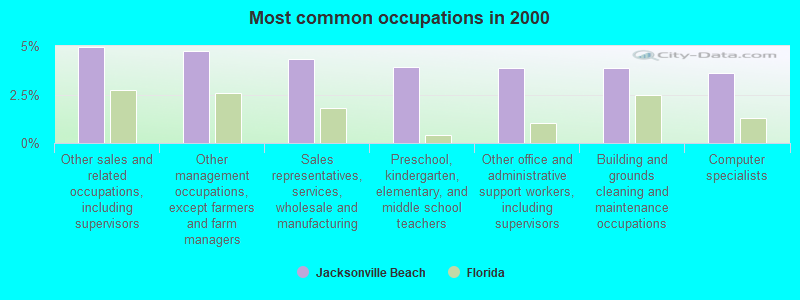
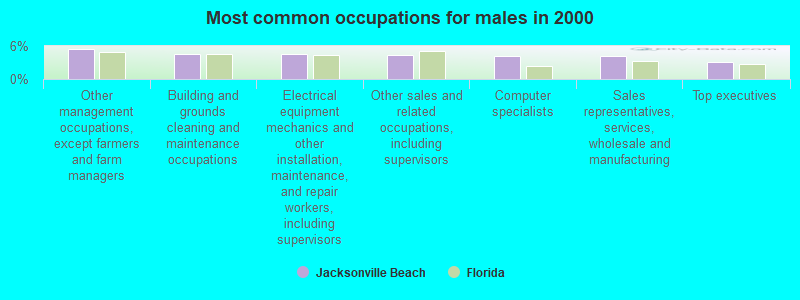
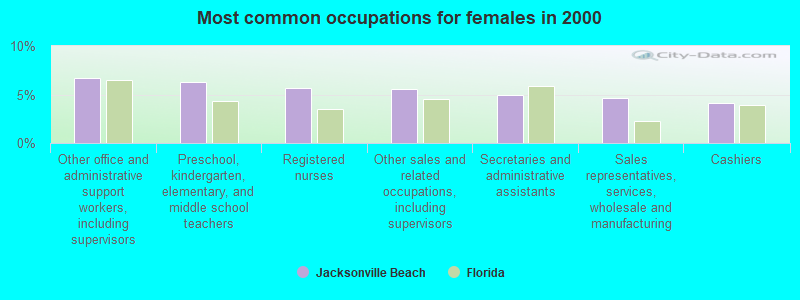
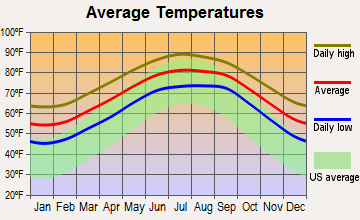
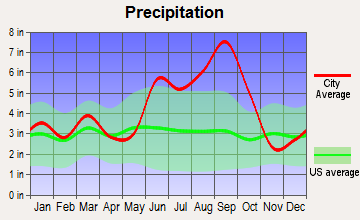
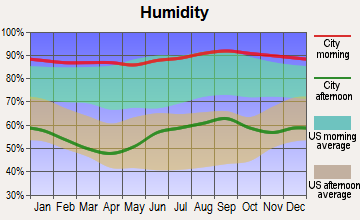
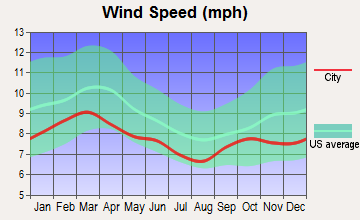
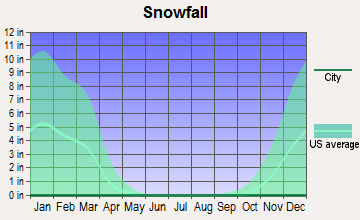
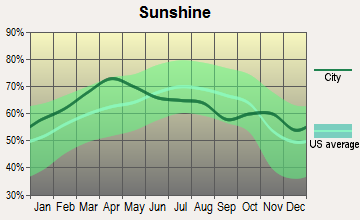
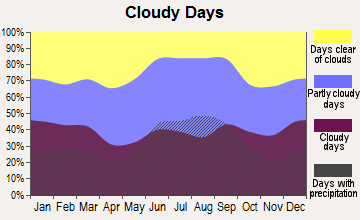


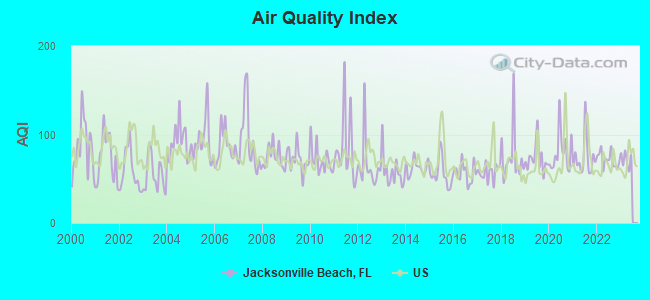
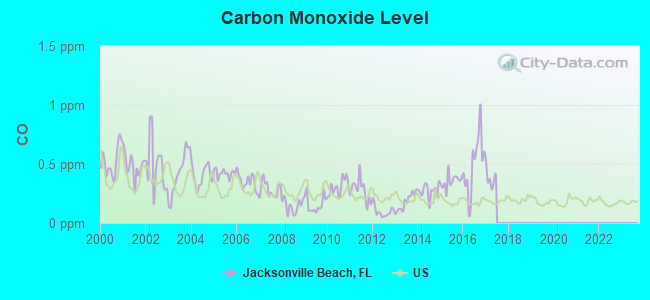
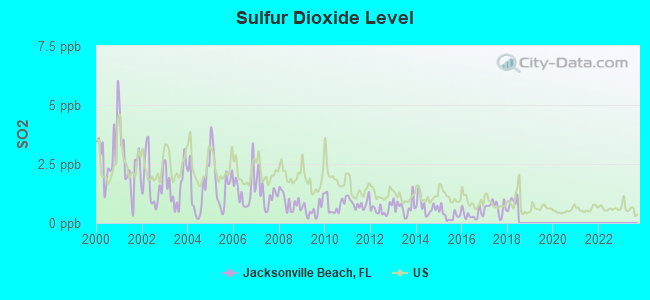
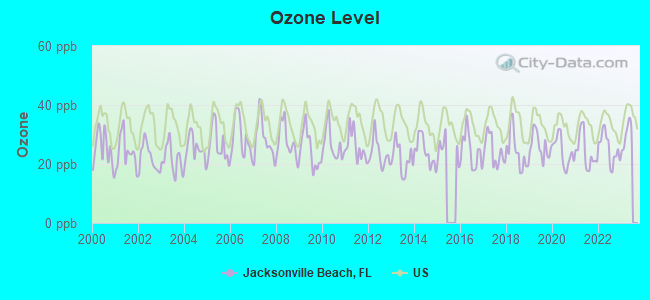
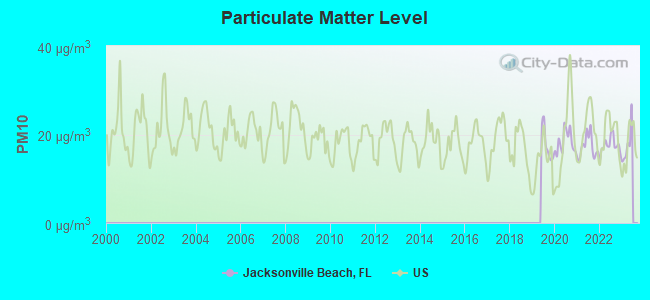
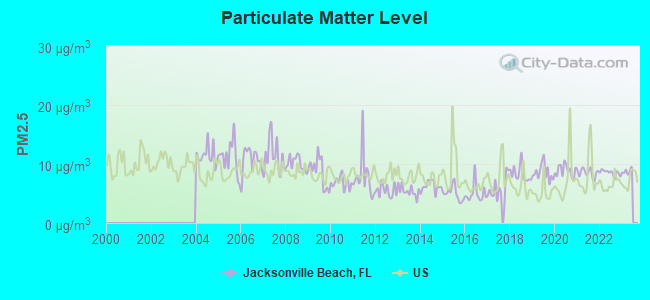
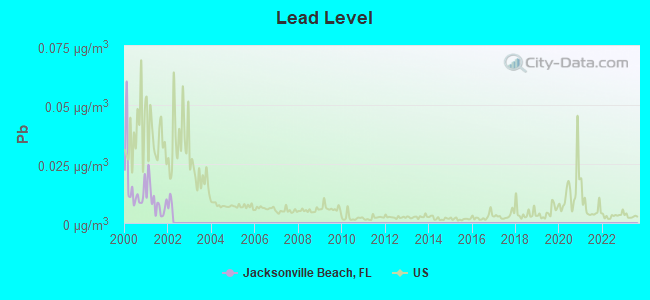
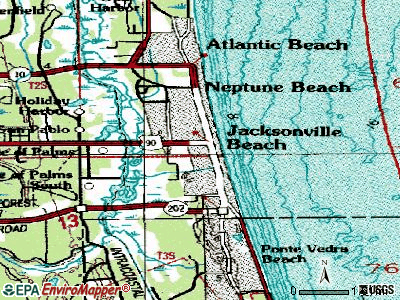
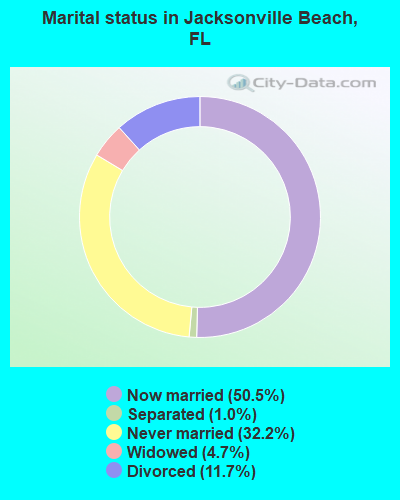
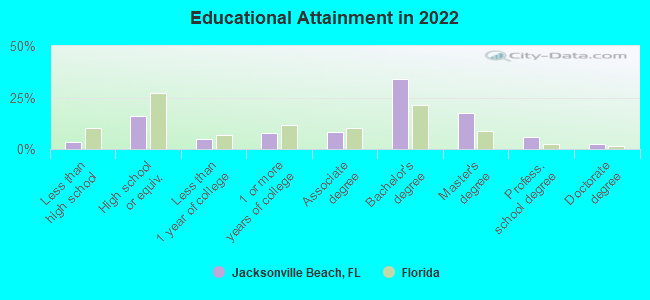
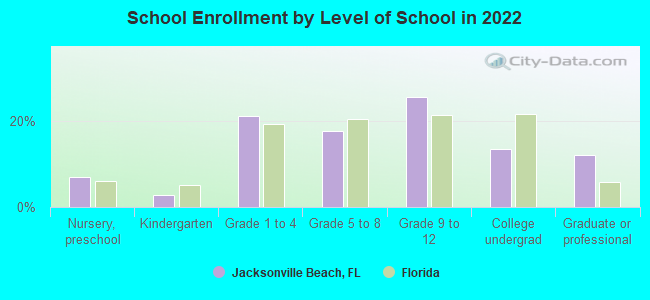
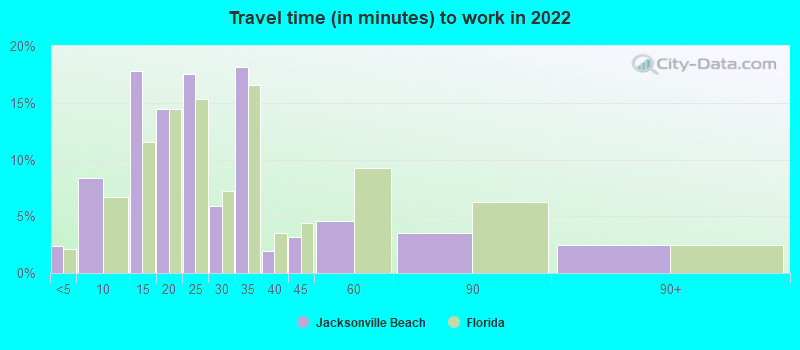
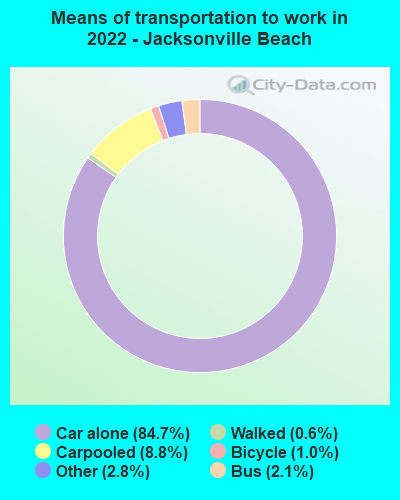
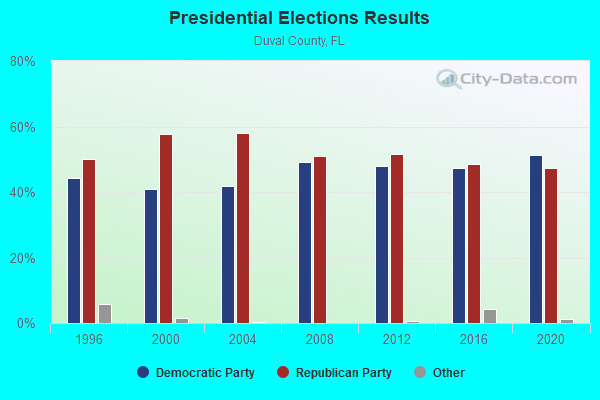
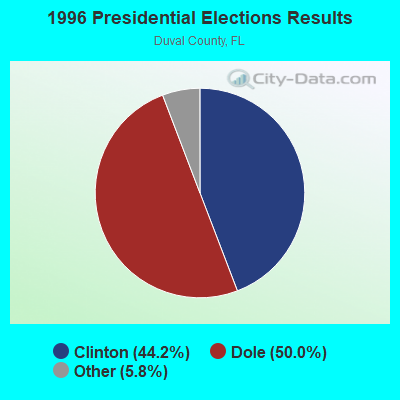
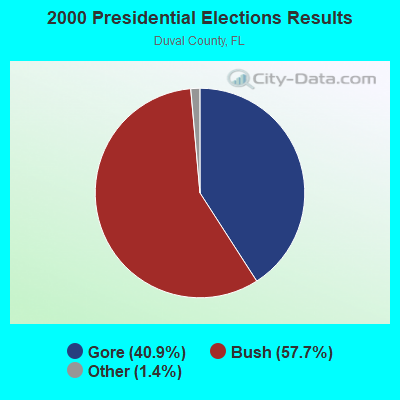
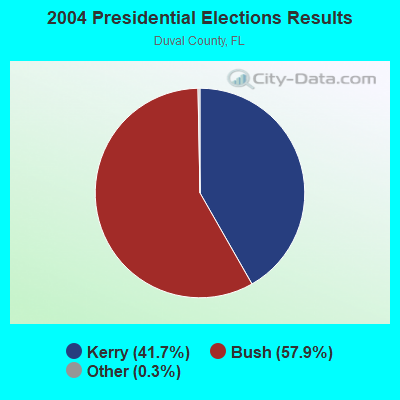
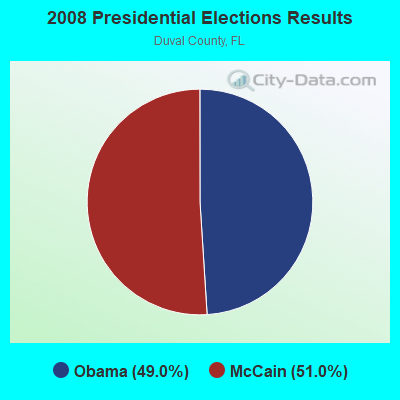
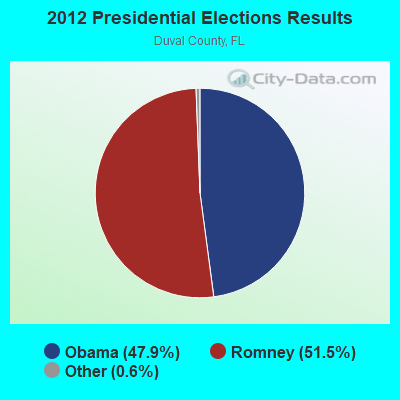
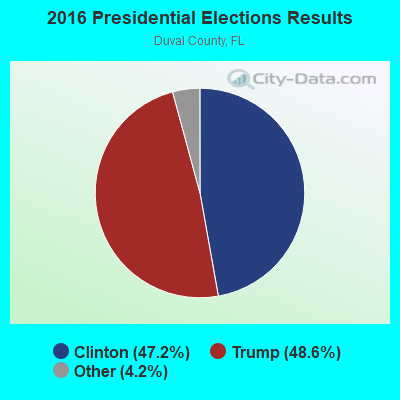
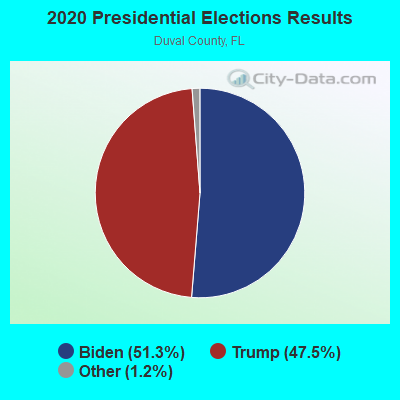
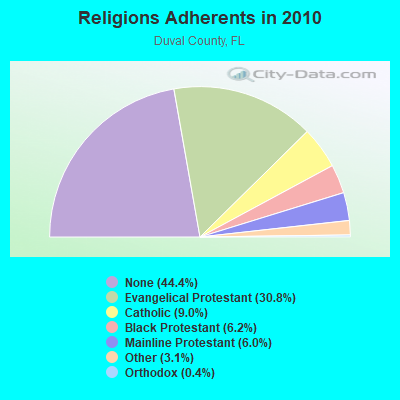
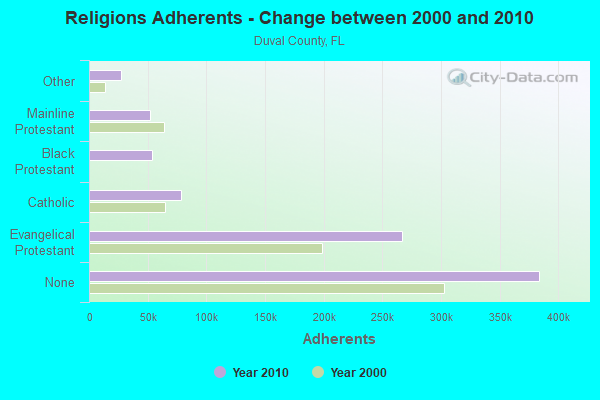
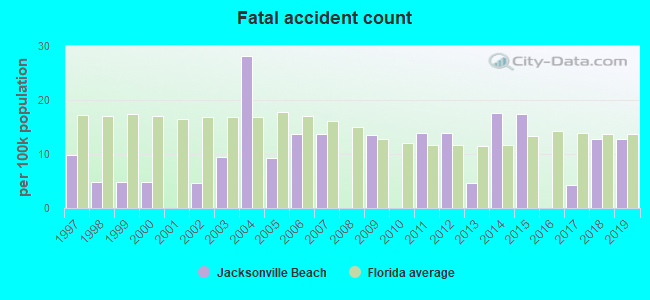
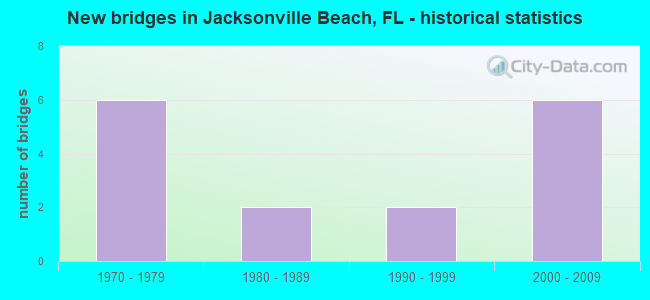
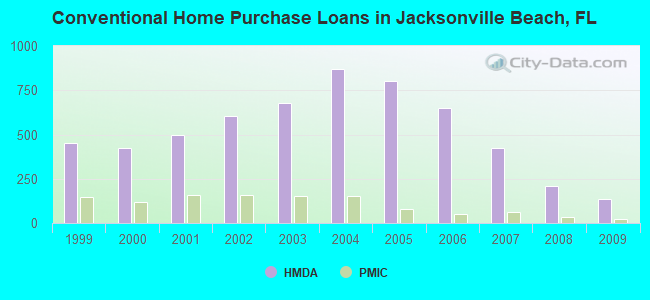
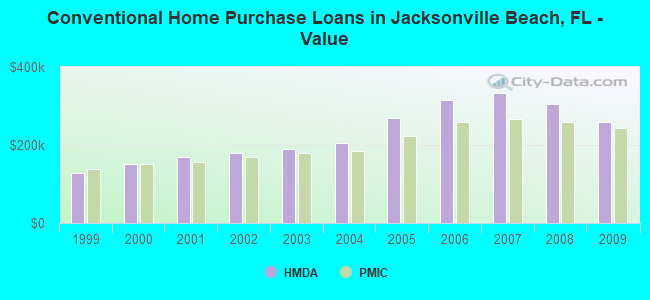
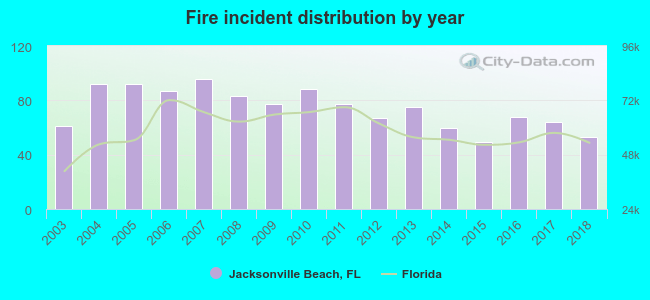 According to the data from the years 2003 - 2018 the average number of fire incidents per year is 74. The highest number of reported fires - 96 took place in 2007, and the least - 49 in 2015. The data has a declining trend.
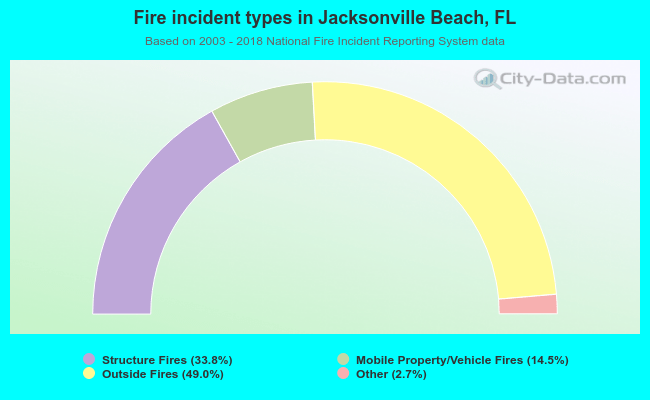 When looking into fire subcategories, the most incidents belonged to: Outside Fires (49.0%), and Structure Fires (33.8%).