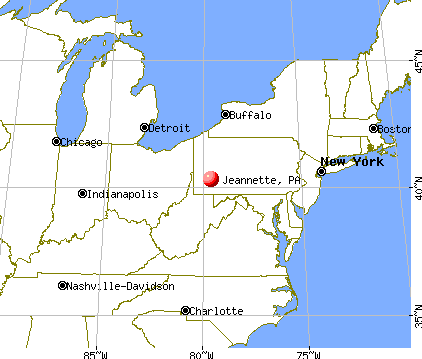
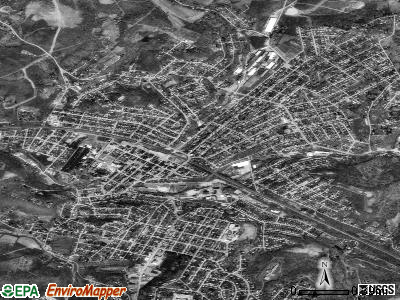
Jeannette, Pennsylvania
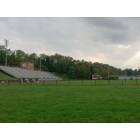
Jeannette: mckee stadium
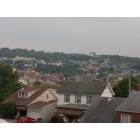
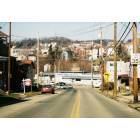
Jeannette: view of jeannette near Italian club
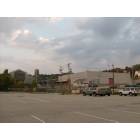
Jeannette: elliot company
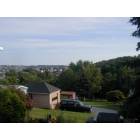
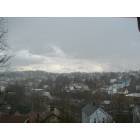
Jeannette: Veiw from Northern Jeannette facing south
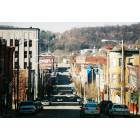
Jeannette: Lowry Avenue entrance to city
Jeannette: jeannette
Jeannette: Clay Avenue (Main Street)
- add
your
Submit your own pictures of this city and show them to the world
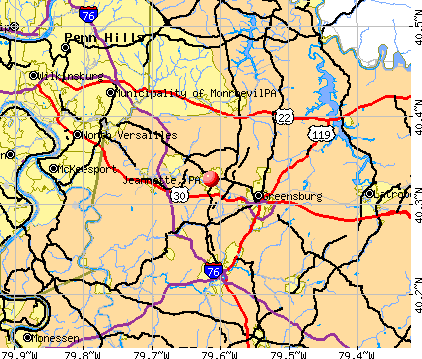
- OSM Map
- General Map
- Google Map
- MSN Map
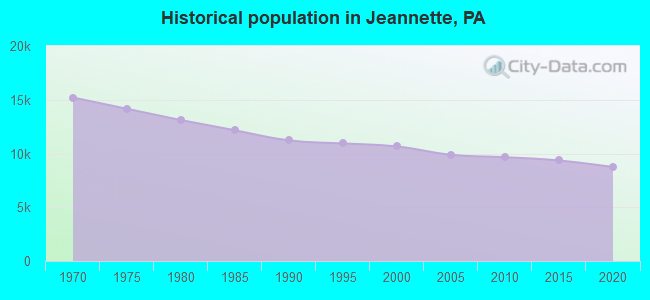
Population change since 2000: -18.9%
 |
| Males: 4,236 | |
| Females: 4,405 |
| Median resident age: | 46.4 years |
| Pennsylvania median age: | 40.9 years |
Zip codes: 15644.
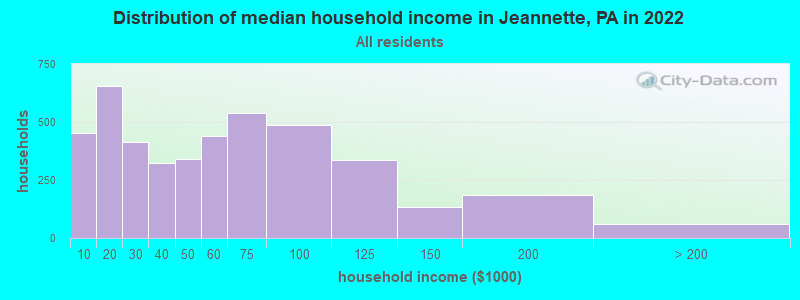
| Jeannette: | $49,115 |
| PA: | $71,798 |
Estimated per capita income in 2022: $34,066 (it was $15,961 in 2000)
Jeannette city income, earnings, and wages data
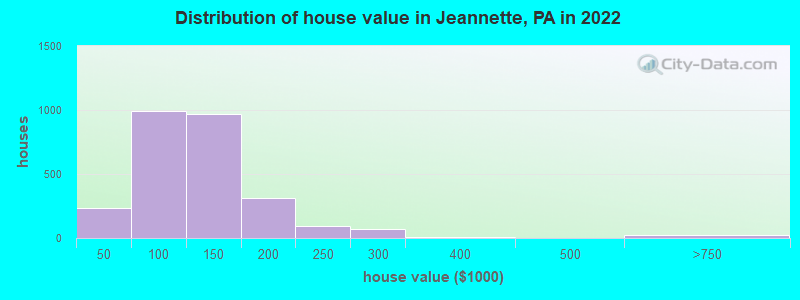
Estimated median house or condo value in 2022: $110,422 (it was $62,300 in 2000)
| Jeannette: | $110,422 |
| PA: | $245,500 |
Mean prices in 2022: all housing units: $228,115; detached houses: $234,173; townhouses or other attached units: $272,830; in 2-unit structures: $182,399; in 3-to-4-unit structures: $188,665; in 5-or-more-unit structures: $107,918; mobile homes: $75,096
Median gross rent in 2022: $841.
(16.2% for White Non-Hispanic residents, 48.2% for Black residents, 85.5% for Hispanic or Latino residents, 82.4% for other race residents, 61.0% for two or more races residents)
Detailed information about poverty and poor residents in Jeannette, PA
Compare current foreclosures in Jeannette, PA:
| Photo | Address | Area | Beds / Baths | Price | Details |
|---|---|---|---|---|---|

|
#1
Marilou Dr
Jeannette, PA 15644
|
- sq. feet
|
1 baths 3 beds |
show details | |

|
#2
Western Ave
Jeannette, PA 15644
|
- sq. feet
|
2 baths 3 beds |
show details | |

|
#3
Wylie Ave
Jeannette, PA 15644
|
- sq. feet
|
- baths - beds |
show details | |

|
#4
Great Star Ct
Jeannette, PA 15644
|
- sq. feet
|
- baths - beds |
show details | |

|
#5
Mapleton Ave
Jeannette, PA 15644
|
- sq. feet
|
- baths - beds |
show details | |

|
#6
Koter Dr
Jeannette, PA 15644
|
- sq. feet
|
- baths - beds |
show details | |

|
#7
N 5th St
Jeannette, PA 15644
|
- sq. feet
|
- baths - beds |
show details | |

|
#8
S 12th St
Jeannette, PA 15644
|
- sq. feet
|
- baths - beds |
show details | |

|
#9
N 2nd St
Jeannette, PA 15644
|
- sq. feet
|
- baths - beds |
show details | |

|
#10
Blair St
Jeannette, PA 15644
|
- sq. feet
|
- baths - beds |
show details |
| Photo | Address | Area | Beds / Baths | Price | Details |
|---|---|---|---|---|---|

|
#11
Jefferson Ave
Jeannette, PA 15644
|
- sq. feet
|
- baths - beds |
show details | |

|
#12
Koter Dr
Jeannette, PA 15644
|
- sq. feet
|
- baths - beds |
show details | |

|
#13
Kepple St
Jeannette, PA 15644
|
- sq. feet
|
- baths - beds |
show details | |

|
#14
Old Oak Ln
Jeannette, PA 15644
|
- sq. feet
|
- baths - beds |
show details | |

|
#15
Clark Ave
Jeannette, PA 15644
|
- sq. feet
|
- baths - beds |
show details | |

|
#16
Lafferty St
Jeannette, PA 15644
|
- sq. feet
|
- baths - beds |
show details | |

|
#17
Harrison Ave
Jeannette, PA 15644
|
- sq. feet
|
- baths - beds |
show details | |

|
#18
Sutherland Rd
Jeannette, PA 15644
|
- sq. feet
|
- baths - beds |
show details | |

|
#19
N 1st St Apt 2
Jeannette, PA 15644
|
- sq. feet
|
- baths - beds |
show details | |

|
#20
Altman Rd
Jeannette, PA 15644
|
- sq. feet
|
- baths - beds |
show details |
| Photo | Address | Area | Beds / Baths | Price | Details |
|---|---|---|---|---|---|

|
#21
Morningside Ave
Jeannette, PA 15644
|
- sq. feet
|
- baths - beds |
show details | |

|
#22
Seslar St
Jeannette, PA 15644
|
- sq. feet
|
- baths - beds |
show details | |

|
#23
Hawk View Ln
Jeannette, PA 15644
|
- sq. feet
|
- baths - beds |
show details | |

|
#24
S 8th St
Jeannette, PA 15644
|
- sq. feet
|
- baths - beds |
show details | |

|
#25
Altman Rd
Jeannette, PA 15644
|
- sq. feet
|
- baths - beds |
show details | |

|
#26
Dry Dam Rd
Jeannette, PA 15644
|
- sq. feet
|
- baths - beds |
show details | |

|
#27
Gaskill Ave
Jeannette, PA 15644
|
- sq. feet
|
- baths - beds |
show details | |

|
#28
Glenn Ave
Jeannette, PA 15644
|
- sq. feet
|
- baths - beds |
show details | |

|
#29
S 6th St
Jeannette, PA 15644
|
- sq. feet
|
- baths - beds |
show details | |

|
#30
Fritchman Dr
Jeannette, PA 15644
|
- sq. feet
|
- baths - beds |
show details |
| Photo | Address | Area | Beds / Baths | Price | Details |
|---|---|---|---|---|---|

|
#31
Great Star Ct
Jeannette, PA 15644
|
- sq. feet
|
- baths - beds |
show details | |

|
#32
Saint Clair Ave
Jeannette, PA 15644
|
- sq. feet
|
- baths - beds |
show details | |

|
#33
Beech St
Jeannette, PA 15644
|
- sq. feet
|
- baths - beds |
show details | |

|
#34
N 5th St
Jeannette, PA 15644
|
- sq. feet
|
- baths - beds |
show details | |

|
#35
Nancy Dr
Jeannette, PA 15644
|
- sq. feet
|
- baths - beds |
show details | |

|
#36
Western Ave
Jeannette, PA 15644
|
- sq. feet
|
- baths - beds |
show details | |

|
#37
Lentz St
Jeannette, PA 15644
|
- sq. feet
|
- baths - beds |
show details | |

|
#38
Penn Ave
Jeannette, PA 15644
|
- sq. feet
|
- baths - beds |
show details | |

|
#39
Allwine Ave
Jeannette, PA 15644
|
- sq. feet
|
- baths - beds |
show details | |

|
#40
Michigan Ave
Jeannette, PA 15644
|
- sq. feet
|
- baths - beds |
show details |
| Photo | Address | Area | Beds / Baths | Price | Details |
|---|---|---|---|---|---|

|
#41
Saint Clair Ave
Jeannette, PA 15644
|
- sq. feet
|
- baths - beds |
show details | |

|
#42
Western Ave
Jeannette, PA 15644
|
- sq. feet
|
- baths - beds |
show details | |

|
#43
Lynnwood St
Jeannette, PA 15644
|
- sq. feet
|
- baths - beds |
show details | |

|
#44
Marilou Dr
Jeannette, PA 15644
|
- sq. feet
|
- baths - beds |
show details | |

|
#45
Starry Ln
Jeannette, PA 15644
|
- sq. feet
|
- baths - beds |
show details | |

|
Check over 1 million property listings on Foreclosure.com!
|
browse all offers | |||


- 6,80477.9%White alone
- 7378.4%Black alone
- 6097.0%Two or more races
- 5025.7%Hispanic
- 841.0%Asian alone
- 20.02%American Indian alone
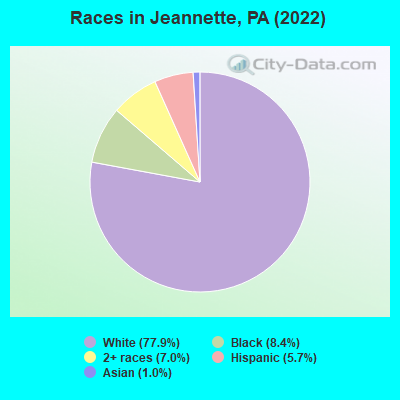
Races in Jeannette detailed stats: ancestries, foreign born residents, place of birth
According to our research of Pennsylvania and other state lists, there were 28 registered sex offenders living in Jeannette, Pennsylvania as of May 01, 2024.
The ratio of all residents to sex offenders in Jeannette is 336 to 1.
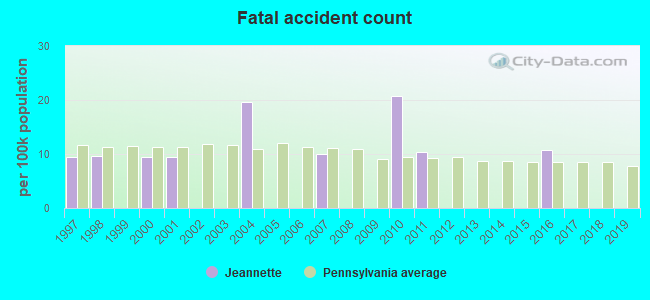
Type |
2009 |
2010 |
2011 |
2012 |
2013 |
2014 |
2015 |
2016 |
2017 |
2018 |
2019 |
2020 |
2021 |
2022 |
|---|---|---|---|---|---|---|---|---|---|---|---|---|---|---|
| Murders (per 100,000) | 0 (0.0) | 0 (0.0) | 0 (0.0) | 0 (0.0) | 0 (0.0) | 0 (0.0) | 1 (10.7) | 0 (0.0) | 1 (10.9) | 0 (0.0) | 1 (11.0) | 0 (0.0) | 1 (11.2) | 1 (11.6) |
| Rapes (per 100,000) | 1 (10.2) | 0 (0.0) | 0 (0.0) | 0 (0.0) | 0 (0.0) | 0 (0.0) | 0 (0.0) | 0 (0.0) | 0 (0.0) | 0 (0.0) | 0 (0.0) | 0 (0.0) | 0 (0.0) | 1 (11.6) |
| Robberies (per 100,000) | 5 (51.1) | 1 (10.4) | 5 (51.6) | 4 (41.5) | 2 (21.1) | 8 (84.7) | 5 (53.5) | 3 (32.3) | 3 (32.7) | 5 (54.8) | 5 (55.1) | 6 (66.6) | 2 (22.4) | 4 (46.3) |
| Assaults (per 100,000) | 63 (644.4) | 25 (259.0) | 4 (41.3) | 2 (20.7) | 5 (52.7) | 6 (63.5) | 2 (21.4) | 7 (75.5) | 5 (54.5) | 5 (54.8) | 5 (55.1) | 17 (188.7) | 38 (425.2) | 59 (683.2) |
| Burglaries (per 100,000) | 37 (378.4) | 23 (238.2) | 19 (196.2) | 23 (238.3) | 14 (147.5) | 33 (349.2) | 19 (203.4) | 16 (172.5) | 14 (152.5) | 12 (131.5) | 7 (77.2) | 4 (44.4) | 4 (44.8) | 5 (57.9) |
| Thefts (per 100,000) | 122 (1,248) | 74 (766.5) | 49 (505.9) | 37 (383.4) | 63 (663.6) | 85 (899.5) | 48 (513.9) | 62 (668.5) | 46 (501.1) | 39 (427.3) | 48 (529.3) | 27 (299.6) | 35 (391.7) | 25 (289.5) |
| Auto thefts (per 100,000) | 0 (0.0) | 0 (0.0) | 0 (0.0) | 0 (0.0) | 0 (0.0) | 0 (0.0) | 0 (0.0) | 0 (0.0) | 0 (0.0) | 0 (0.0) | 0 (0.0) | 0 (0.0) | 0 (0.0) | 0 (0.0) |
| Arson (per 100,000) | 3 (30.7) | 1 (10.4) | 3 (31.0) | 2 (20.7) | 1 (10.5) | 0 (0.0) | 0 (0.0) | 0 (0.0) | 0 (0.0) | 1 (11.0) | 0 (0.0) | 0 (0.0) | 0 (0.0) | 0 (0.0) |
| City-Data.com crime index | 228.8 | 102.2 | 57.7 | 48.6 | 53.7 | 98.5 | 76.6 | 63.6 | 73.2 | 53.7 | 76.2 | 72.8 | 132.9 | 198.6 |
The City-Data.com crime index weighs serious crimes and violent crimes more heavily. Higher means more crime, U.S. average is 246.1. It adjusts for the number of visitors and daily workers commuting into cities.
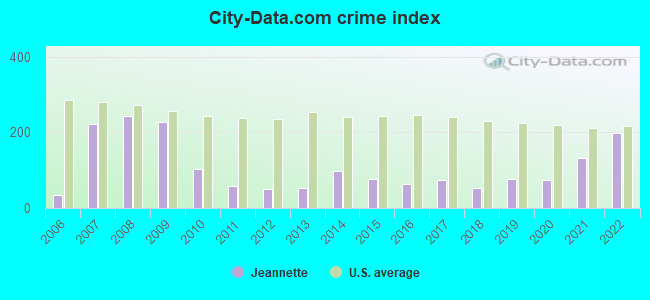
Crime rate in Jeannette detailed stats: murders, rapes, robberies, assaults, burglaries, thefts, arson
Full-time law enforcement employees in 2020, including police officers: 14 (13 officers - 13 male; 0 female).
| Officers per 1,000 residents here: | 1.44 |
| Pennsylvania average: | 2.70 |
 Recent articles from our blog. Our writers, many of them Ph.D. graduates or candidates, create easy-to-read articles on a wide variety of topics.

 | Exurb of the Week: Jeannette (2 replies) |
| LESS than anemic job growth for region, #84/90 (290 replies) |
| Exurb of the Week: Penn Township (Westmoreland County) (1 reply) |
| Exurb of the Week: Hempfield Township (3 replies) |
| Wanting to move back but where??? (31 replies) |
| Midrise towers in the Pittsburgh suburbs (38 replies) |
Latest news from Jeannette, PA collected exclusively by city-data.com from local newspapers, TV, and radio stations
Ancestries: Italian (16.8%), German (14.1%), English (5.8%), Irish (4.8%), American (4.1%), Polish (3.8%).
Current Local Time: EST time zone
Incorporated in 1938
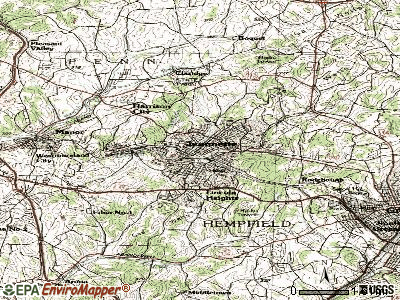
Elevation: 1040 feet
Land area: 2.41 square miles.
Population density: 3,580 people per square mile (average).
363 residents are foreign born (2.2% Europe, 1.1% Asia, 0.7% Latin America).
| This city: | 4.2% |
| Pennsylvania: | 7.3% |
Median real estate property taxes paid for housing units with mortgages in 2022: $1,661 (1.4%)
Median real estate property taxes paid for housing units with no mortgage in 2022: $1,488 (1.4%)
Nearest city with pop. 50,000+: Pittsburgh, PA  (20.7 miles , pop. 334,563).
Nearest city with pop. 1,000,000+: Philadelphia, PA (237.3 miles , pop. 1,517,550).
Nearest cities:
), ), ), Latitude: 40.33 N, Longitude: 79.61 W
Daytime population change due to commuting: -1,164 (-13.3%)
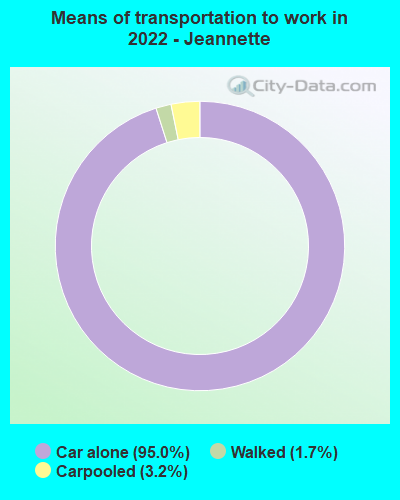
Workers who live and work in this city: 569 (14.4%)
Area code: 724
Jeannette, Pennsylvania accommodation & food services, waste management - Economy and Business Data
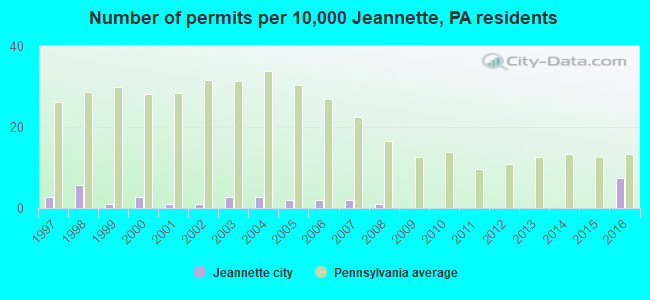
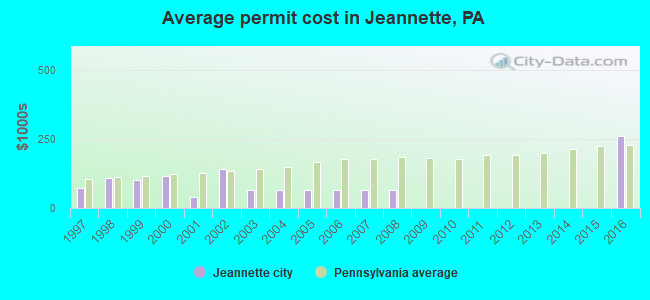
Single-family new house construction building permits:
- 2016: 8 buildings, average cost: $261,800
- 2008: 1 building, cost: $65,000
- 2007: 2 buildings, average cost: $65,000
- 2006: 2 buildings, average cost: $65,000
- 2005: 2 buildings, average cost: $65,000
- 2004: 3 buildings, average cost: $65,000
- 2003: 3 buildings, average cost: $65,000
- 2002: 1 building, cost: $142,000
- 2001: 1 building, cost: $40,000
- 2000: 3 buildings, average cost: $116,700
- 1999: 1 building, cost: $100,000
- 1998: 6 buildings, average cost: $109,000
- 1997: 3 buildings, average cost: $72,100
| Here: | 3.0% |
| Pennsylvania: | 2.9% |
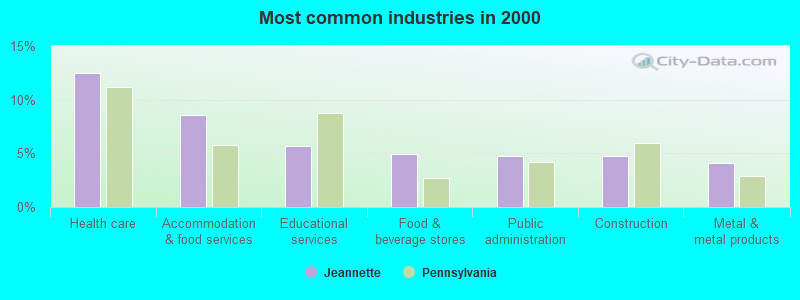
- Health care (12.5%)
- Accommodation & food services (8.6%)
- Educational services (5.7%)
- Food & beverage stores (4.9%)
- Public administration (4.8%)
- Construction (4.8%)
- Metal & metal products (4.1%)
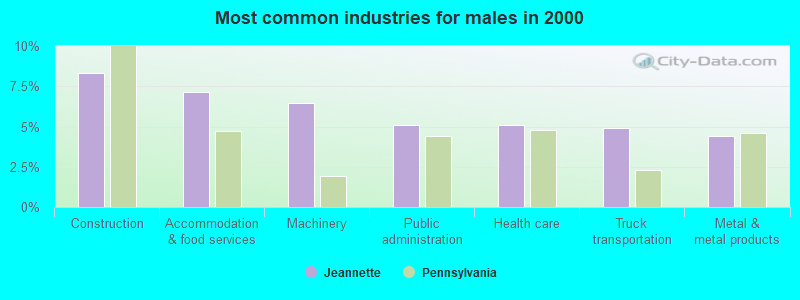
- Construction (8.3%)
- Accommodation & food services (7.2%)
- Machinery (6.4%)
- Public administration (5.1%)
- Health care (5.1%)
- Truck transportation (4.9%)
- Metal & metal products (4.4%)
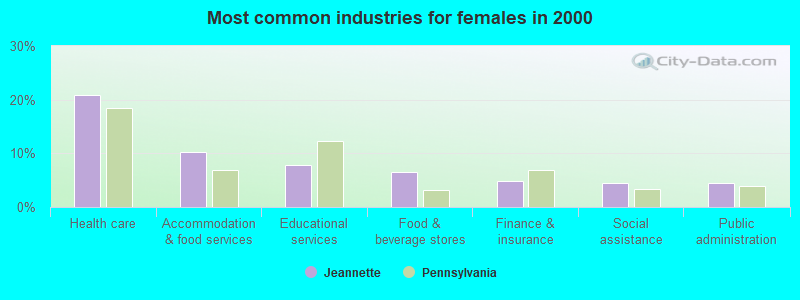
- Health care (20.9%)
- Accommodation & food services (10.2%)
- Educational services (7.7%)
- Food & beverage stores (6.4%)
- Finance & insurance (4.9%)
- Social assistance (4.5%)
- Public administration (4.4%)
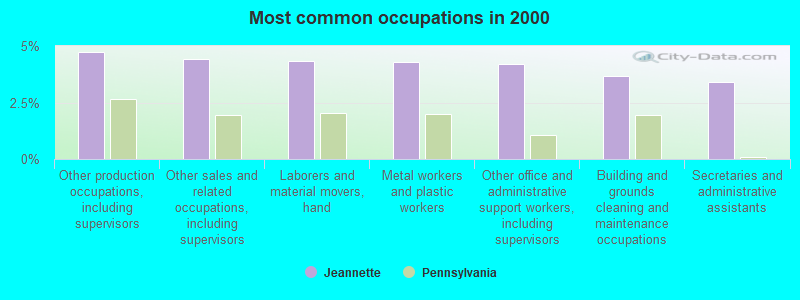
- Other production occupations, including supervisors (4.7%)
- Other sales and related occupations, including supervisors (4.4%)
- Laborers and material movers, hand (4.3%)
- Metal workers and plastic workers (4.3%)
- Other office and administrative support workers, including supervisors (4.2%)
- Building and grounds cleaning and maintenance occupations (3.7%)
- Secretaries and administrative assistants (3.4%)
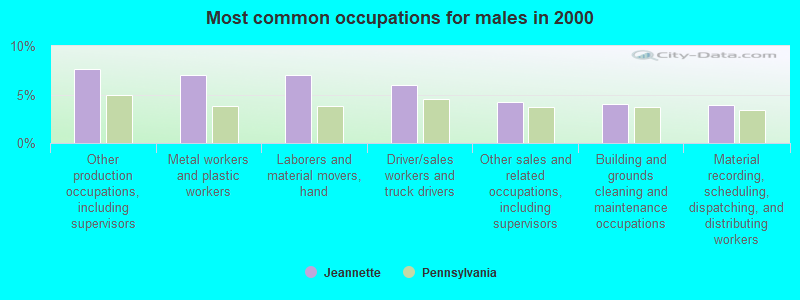
- Other production occupations, including supervisors (7.6%)
- Metal workers and plastic workers (7.0%)
- Laborers and material movers, hand (7.0%)
- Driver/sales workers and truck drivers (6.0%)
- Other sales and related occupations, including supervisors (4.3%)
- Building and grounds cleaning and maintenance occupations (4.0%)
- Material recording, scheduling, dispatching, and distributing workers (3.9%)
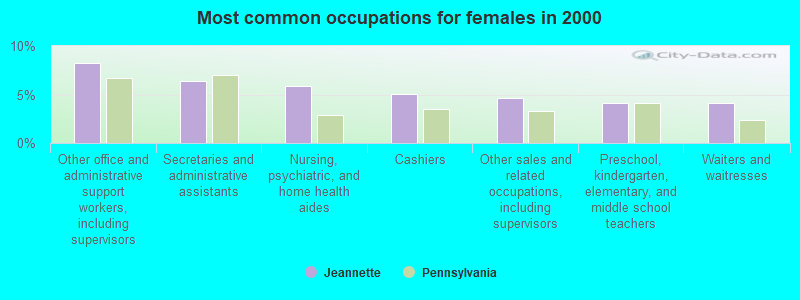
- Other office and administrative support workers, including supervisors (8.2%)
- Secretaries and administrative assistants (6.4%)
- Nursing, psychiatric, and home health aides (5.9%)
- Cashiers (5.1%)
- Other sales and related occupations, including supervisors (4.6%)
- Preschool, kindergarten, elementary, and middle school teachers (4.1%)
- Waiters and waitresses (4.1%)
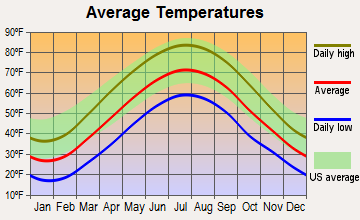
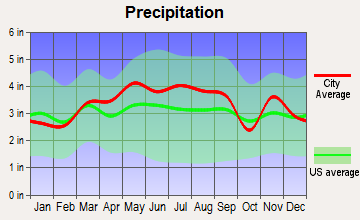
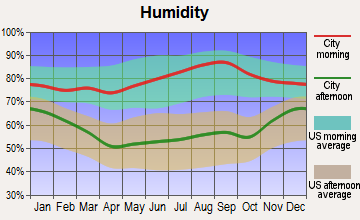
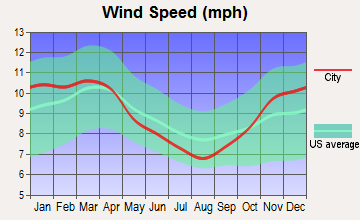
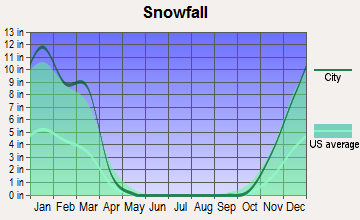
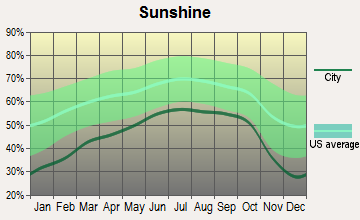
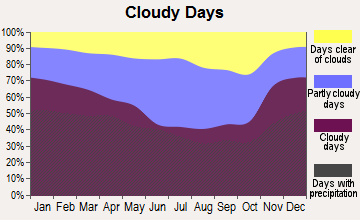
Average climate in Jeannette, Pennsylvania
Based on data reported by over 4,000 weather stations
|
|

(lower is better)
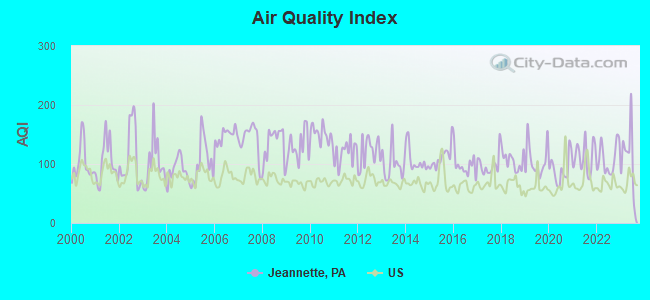
Air Quality Index (AQI) level in 2023 was 111. This is significantly worse than average.
| City: | 111 |
| U.S.: | 73 |
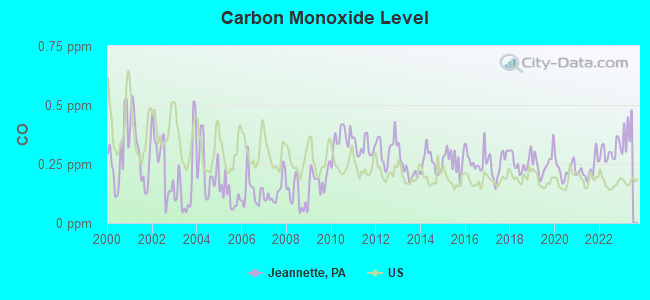
Carbon Monoxide (CO) [ppm] level in 2022 was 0.304. This is worse than average. Closest monitor was 6.0 miles away from the city center.
| City: | 0.304 |
| U.S.: | 0.251 |
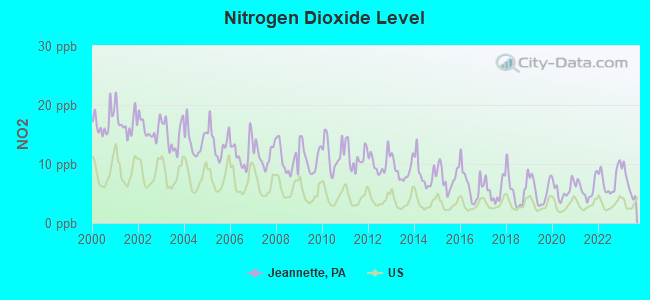
Nitrogen Dioxide (NO2) [ppb] level in 2023 was 6.74. This is worse than average. Closest monitor was 6.0 miles away from the city center.
| City: | 6.74 |
| U.S.: | 5.11 |
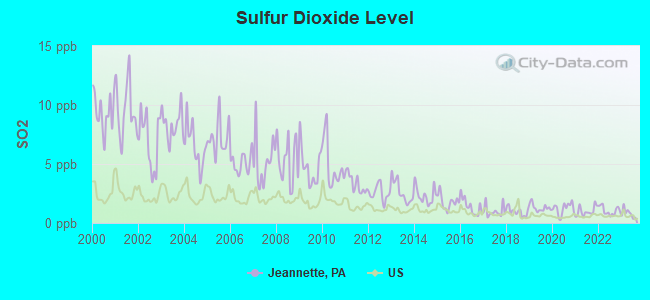
Sulfur Dioxide (SO2) [ppb] level in 2023 was 0.819. This is significantly better than average. Closest monitor was 4.0 miles away from the city center.
| City: | 0.819 |
| U.S.: | 1.515 |
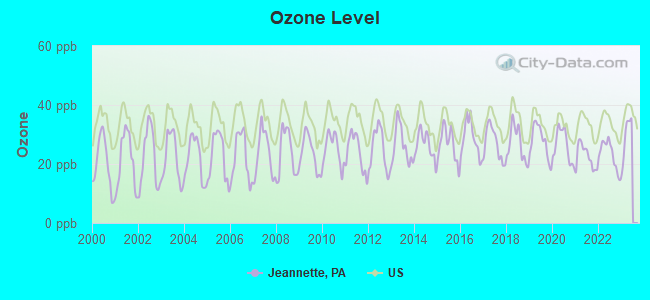
Ozone [ppb] level in 2022 was 23.2. This is significantly better than average. Closest monitor was 6.0 miles away from the city center.
| City: | 23.2 |
| U.S.: | 33.3 |
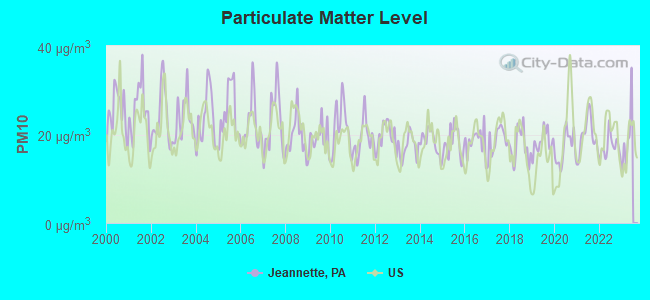
Particulate Matter (PM10) [µg/m3] level in 2022 was 17.2. This is about average. Closest monitor was 6.0 miles away from the city center.
| City: | 17.2 |
| U.S.: | 19.2 |
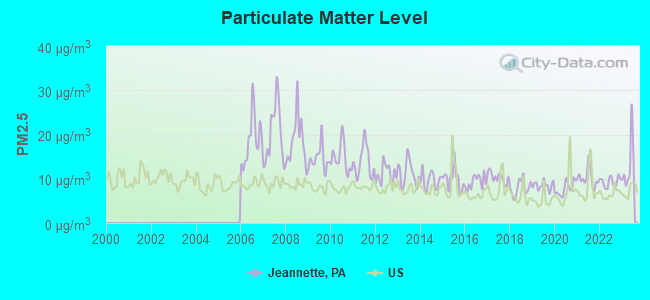
Particulate Matter (PM2.5) [µg/m3] level in 2023 was 13.0. This is significantly worse than average. Closest monitor was 6.0 miles away from the city center.
| City: | 13.0 |
| U.S.: | 8.1 |
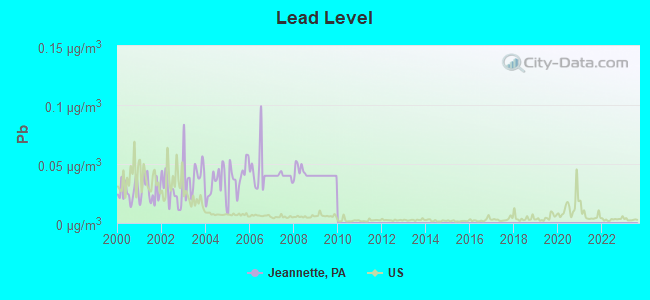
Lead (Pb) [µg/m3] level in 2009 was 0.0400. This is significantly worse than average. Closest monitor was 6.2 miles away from the city center.
| City: | 0.0400 |
| U.S.: | 0.0093 |
Tornado activity:
Jeannette-area historical tornado activity is slightly below Pennsylvania state average. It is 27% smaller than the overall U.S. average.
On 6/3/1980, a category F4 (max. wind speeds 207-260 mph) tornado 18.4 miles away from the Jeannette city center injured 140 people and caused between $50,000,000 and $500,000,000 in damages.
On 6/2/1998, a category F4 tornado 28.4 miles away from the city center injured 5 people and caused $6 million in damages.
Earthquake activity:
Jeannette-area historical earthquake activity is significantly above Pennsylvania state average. It is 57% smaller than the overall U.S. average.On 8/23/2011 at 17:51:04, a magnitude 5.8 (5.8 MW, Depth: 3.7 mi, Class: Moderate, Intensity: VI - VII) earthquake occurred 190.0 miles away from Jeannette center
On 9/25/1998 at 19:52:52, a magnitude 5.2 (4.8 MB, 4.3 MS, 5.2 LG, 4.5 MW, Depth: 3.1 mi) earthquake occurred 90.2 miles away from the city center
On 1/31/1986 at 16:46:43, a magnitude 5.0 (5.0 MB) earthquake occurred 119.5 miles away from the city center
On 7/27/1980 at 18:52:21, a magnitude 5.2 (5.1 MB, 4.7 MS, 5.0 UK, 5.2 UK) earthquake occurred 274.4 miles away from the city center
On 8/9/2020 at 12:07:37, a magnitude 5.1 (5.1 MW, Depth: 4.7 mi) earthquake occurred 278.3 miles away from Jeannette center
On 1/16/1994 at 01:49:16, a magnitude 4.6 (4.6 MB, 4.6 LG, Depth: 3.1 mi, Class: Light, Intensity: IV - V) earthquake occurred 188.6 miles away from the city center
Magnitude types: regional Lg-wave magnitude (LG), body-wave magnitude (MB), surface-wave magnitude (MS), moment magnitude (MW)
Natural disasters:
The number of natural disasters in Westmoreland County (17) is near the US average (15).Major Disasters (Presidential) Declared: 12
Emergencies Declared: 5
Causes of natural disasters: Floods: 5, Snowstorms: 4, Storms: 4, Winter Storms: 4, Hurricanes: 2, Blizzard: 1, Snowfall: 1, Tropical Depression: 1, Tropical Storm: 1, Other: 1 (Note: some incidents may be assigned to more than one category).
Hospitals and medical centers in Jeannette:
Airports and heliports located in Jeannette:
- Greensburg Jeannette Regional Airport (5G8) (Runways: 1, Itinerant Ops: 1,610, Local Ops: 2,000, Military Ops: 100)
- Mmc Heliport (83PA)
Amtrak stations near Jeannette:
- 4 miles: GREENSBURG (HARRISON AVE.) . Services: enclosed waiting area, public payphones, free short-term parking, free long-term parking, call for taxi service.
- 13 miles: LATROBE (329 KCKINLEY AVE.) . Services: enclosed waiting area, public payphones, full-service food facilities, call for taxi service.
Colleges/universities with over 2000 students nearest to Jeannette:
- Seton Hill University (about 4 miles; Greensburg, PA; Full-time enrollment: 2,167)
- Westmoreland County Community College (about 8 miles; Youngwood, PA; FT enrollment: 4,669)
- Carnegie Mellon University (about 20 miles; Pittsburgh, PA; FT enrollment: 14,186)
- University of Pittsburgh-Pittsburgh Campus (about 20 miles; Pittsburgh, PA; FT enrollment: 27,137)
- Duquesne University (about 22 miles; Pittsburgh, PA; FT enrollment: 8,211)
- The Art Institute of Pittsburgh-Online Division (about 22 miles; Pittsburgh, PA; FT enrollment: 11,040)
- Point Park University (about 22 miles; Pittsburgh, PA; FT enrollment: 3,525)
Public high school in Jeannette:
- JEANNETTE SHS (Students: 427, Location: 200 FLORIDA AVENUE, Grades: 9-12)
Private high school in Jeannette:
Public elementary/middle schools in Jeannette:
- PENN MS (Students: 713, Location: 11 PENN MIDDLE WAY, Grades: 6-8)
- HARRISON PARK EL SCH (Students: 511, Location: DELL AVENUE, Grades: KG-5)
- MCCULLOUGH EL SCH (Students: 412, Location: 213 WATT RD, Grades: KG-5)
- JEANNETTE MCKEE MS (Location: 1000 LOWRY AVE, Grades: 6-8)
- JEANNETTE MCKEE EL SCH (Location: 1000 LOWRY AVE, Grades: PK-5)
Private elementary/middle school in Jeannette:
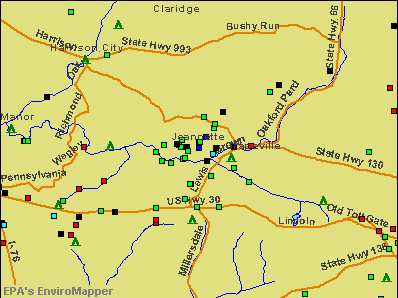
Points of interest:
Notable locations in Jeannette: Jeannette Police Department (A), Sister Veronica Learning Center (B), Jeannette Fire Department (C). Display/hide their locations on the map
Church in Jeannette: Saint Marks Church (A). Display/hide its location on the map
Tourist attractions: Bushy Run Battlefield Park (Museums; Bushy Run), Cecchetti BROS Vending Inc (Arcades & Amusements; 309 Sycamore Street).
Birthplace of: Frank Fitzsimmons - Labor leader, Chad Alan - Musician, Jack O'Brien (American football) - College football player, Marissa Moss - Children's writer, William A. Shomo - Air Force Medal of Honor recipient, Jack G. Merrell - General, Tyler Johnston - Soccer player, Dick Hoak - Football player and coach, James Casorio - Politician, Karen D. Beyer - Politician.
| This city: | 2.2 people |
| Pennsylvania: | 2.5 people |
| This city: | 59.3% |
| Whole state: | 65.0% |
| This city: | 7.4% |
| Whole state: | 6.6% |
Likely homosexual households (counted as self-reported same-sex unmarried-partner households)
- Lesbian couples: 0.3% of all households
- Gay men: 0.2% of all households
People in group quarters in Jeannette in 2010:
- 6 people in group homes for juveniles (non-correctional)
- 6 people in college/university student housing
- 4 people in group homes intended for adults
- 3 people in workers' group living quarters and job corps centers
People in group quarters in Jeannette in 2000:
- 39 people in nursing homes
- 11 people in mental (psychiatric) hospitals or wards
- 8 people in homes for the mentally retarded
- 4 people in other nonhousehold living situations
Banks with branches in Jeannette (2011 data):
- PNC Bank, National Association: Harrison City Branch at 1066 Harrison City-Export Road, branch established on 1964/06/29; Lincoln Heights Branch at 1220 Lowery Avenue, branch established on 1961/08/28. Info updated 2012/03/20: Bank assets: $263,309.6 mil, Deposits: $197,343.0 mil, headquarters in Wilmington, DE, positive income, Commercial Lending Specialization, 3085 total offices, Holding Company: Pnc Financial Services Group, Inc., The
- Citizens Bank of Pennsylvania: Penn Township Giant Eagle Branch at 2000 Penny Lane, branch established on 2010/07/01. Info updated 2010/09/24: Bank assets: $32,316.9 mil, Deposits: $25,297.1 mil, headquarters in Philadelphia, PA, positive income, 396 total offices, Holding Company: Uk Financial Investments Limited
- First Niagara Bank, National Association: Jeannette Branch at 411 Clay Avenue, branch established on 1954/08/02. Info updated 2011/06/09: Bank assets: $32,750.6 mil, Deposits: $19,595.4 mil, headquarters in Buffalo, NY, positive income, Commercial Lending Specialization, 351 total offices, Holding Company: First Niagara Financial Group, Inc.
- The Huntington National Bank: Jeanette Branch at 401 Clay Avenue, branch established on 1987/06/30. Info updated 2012/04/02: Bank assets: $54,183.4 mil, Deposits: $44,300.3 mil, headquarters in Columbus, OH, positive income, Commercial Lending Specialization, 878 total offices, Holding Company: Huntington Bancshares Incorporated
For population 15 years and over in Jeannette:
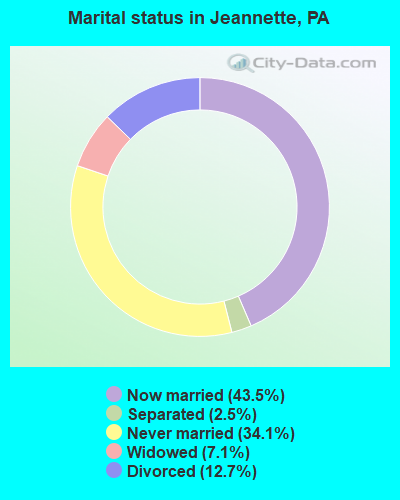
- Never married: 34.1%
- Now married: 43.5%
- Separated: 2.5%
- Widowed: 7.1%
- Divorced: 12.7%
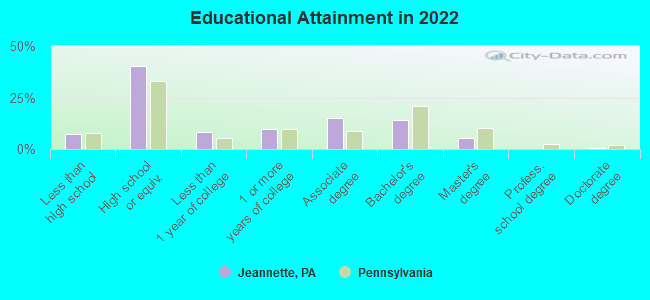
For population 25 years and over in Jeannette:
- High school or higher: 91.7%
- Bachelor's degree or higher: 18.8%
- Graduate or professional degree: 5.5%
- Unemployed: 6.1%
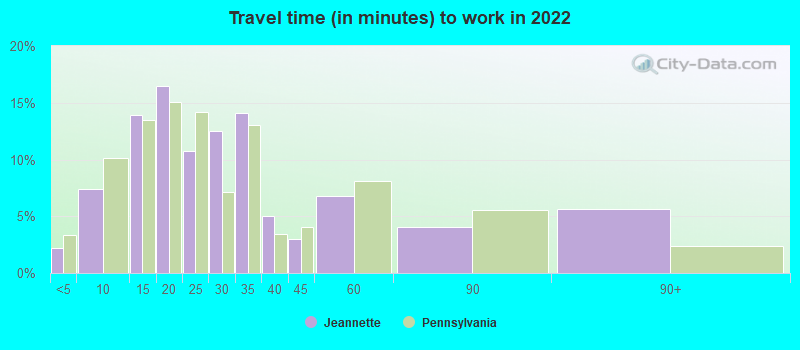
- Mean travel time to work (commute): 26.3 minutes
| Here: | 8.2 |
| Pennsylvania average: | 11.4 |
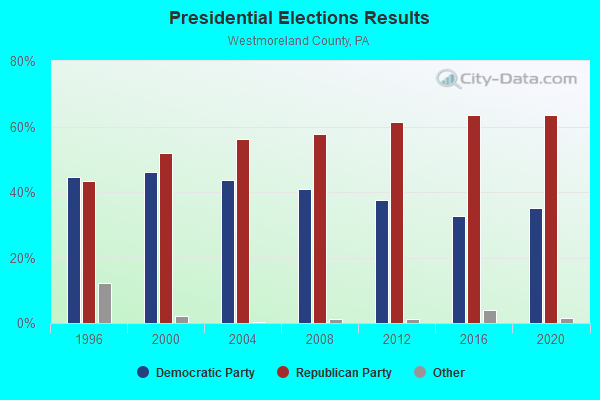
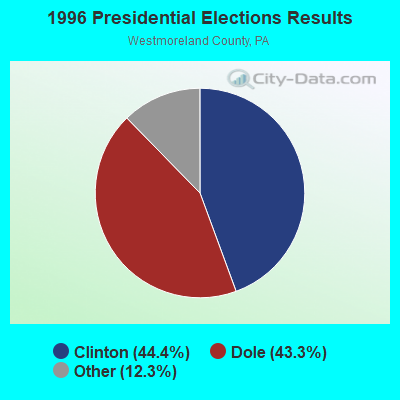
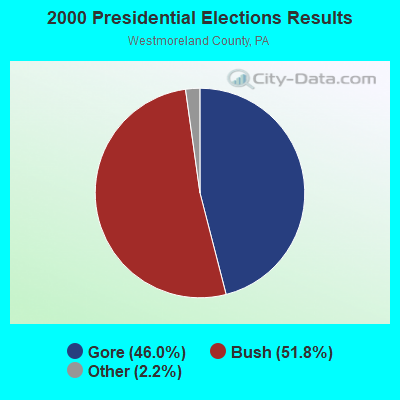
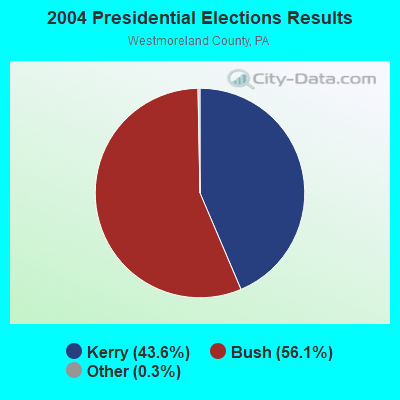
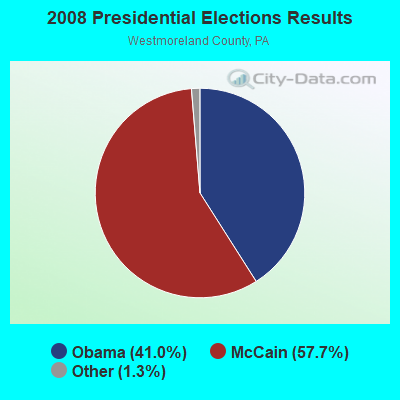
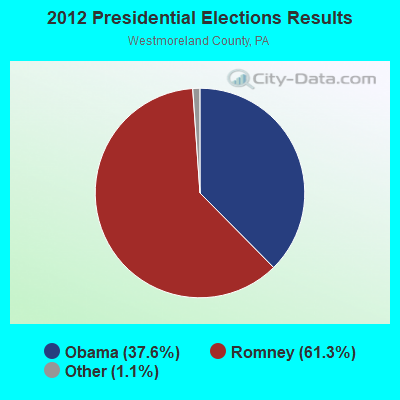
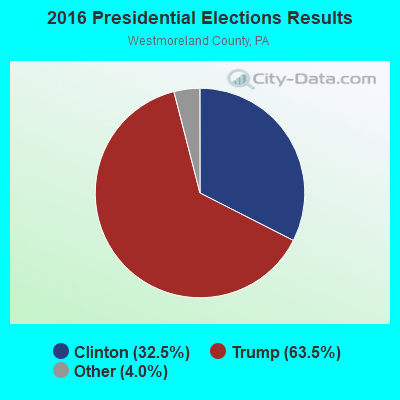
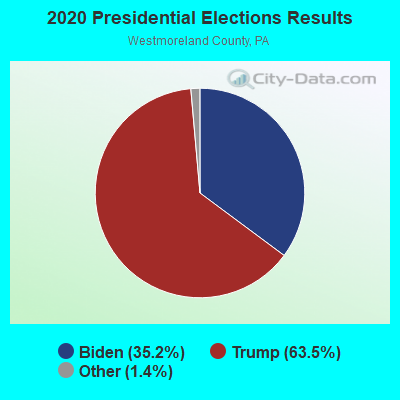
Graphs represent county-level data. Detailed 2008 Election Results
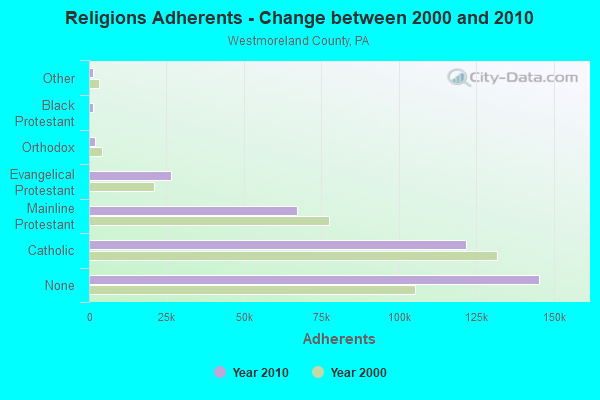
Religion statistics for Jeannette, PA (based on Westmoreland County data)
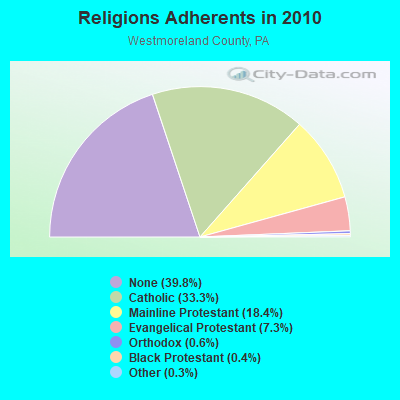
| Religion | Adherents | Congregations |
|---|---|---|
| Catholic | 121,691 | 60 |
| Mainline Protestant | 67,009 | 194 |
| Evangelical Protestant | 26,600 | 170 |
| Orthodox | 2,036 | 17 |
| Black Protestant | 1,320 | 11 |
| Other | 1,164 | 16 |
| None | 145,349 | - |
Food Environment Statistics:
| Here: | 1.49 / 10,000 pop. |
| State: | 2.04 / 10,000 pop. |
| Here: | 0.14 / 10,000 pop. |
| Pennsylvania: | 0.09 / 10,000 pop. |
| Westmoreland County: | 0.47 / 10,000 pop. |
| Pennsylvania: | 0.88 / 10,000 pop. |
| Westmoreland County: | 3.06 / 10,000 pop. |
| Pennsylvania: | 2.52 / 10,000 pop. |
| Westmoreland County: | 6.79 / 10,000 pop. |
| Pennsylvania: | 7.12 / 10,000 pop. |
| Here: | 8.7% |
| Pennsylvania: | 9.1% |
| This county: | 23.9% |
| State: | 27.2% |
| Westmoreland County: | 12.9% |
| Pennsylvania: | 11.5% |
Health and Nutrition:
| Jeannette: | 52.5% |
| State: | 50.2% |
| Here: | 49.9% |
| State: | 47.1% |
| This city: | 28.9 |
| Pennsylvania: | 28.7 |
| Jeannette: | 20.0% |
| Pennsylvania: | 20.8% |
| Jeannette: | 11.4% |
| Pennsylvania: | 10.9% |
| Jeannette: | 6.9 |
| Pennsylvania: | 6.8 |
| Jeannette: | 35.5% |
| Pennsylvania: | 34.3% |
| Jeannette: | 58.3% |
| Pennsylvania: | 56.2% |
| Jeannette: | 77.8% |
| Pennsylvania: | 78.3% |
More about Health and Nutrition of Jeannette, PA Residents
| Local government employment and payroll (March 2022) | |||||
| Function | Full-time employees | Monthly full-time payroll | Average yearly full-time wage | Part-time employees | Monthly part-time payroll |
|---|---|---|---|---|---|
| Police Protection - Officers | 13 | $93,019 | $85,864 | 0 | $0 |
| Solid Waste Management | 5 | $21,986 | $52,766 | 0 | $0 |
| Other Government Administration | 5 | $16,707 | $40,097 | 0 | $0 |
| Streets and Highways | 5 | $24,301 | $58,322 | 0 | $0 |
| Financial Administration | 4 | $13,504 | $40,512 | 0 | $0 |
| Firefighters | 3 | $21,633 | $86,532 | 0 | $0 |
| Totals for Government | 35 | $191,150 | $65,537 | 0 | $0 |
Jeannette government finances - Expenditure in 2018 (per resident):
- Current Operations - Police Protection: $1,746,000 ($202.06)
Regular Highways: $989,000 ($114.45)
General - Other: $776,000 ($89.80)
Local Fire Protection: $685,000 ($79.27)
Solid Waste Management: $672,000 ($77.77)
Housing and Community Development: $520,000 ($60.18)
Financial Administration: $204,000 ($23.61)
Libraries: $67,000 ($7.75)
General Public Buildings: $61,000 ($7.06)
Protective Inspection and Regulation - Other: $43,000 ($4.98)
Judicial and Legal Services: $28,000 ($3.24)
Health - Other: $25,000 ($2.89)
Natural Resources - Other: $23,000 ($2.66)
Parks and Recreation: $18,000 ($2.08)
Transit Utilities: $7,000 ($0.81)
Central Staff Services: $5,000 ($0.58)
Parking Facilities: $3,000 ($0.35)
- General - Interest on Debt: $108,000 ($12.50)
- Other Capital Outlay - Central Staff Services: $318,000 ($36.80)
- Total Salaries and Wages: $2,219,000 ($256.80)
Jeannette government finances - Revenue in 2018 (per resident):
- Charges - Solid Waste Management: $1,158,000 ($134.01)
Other: $103,000 ($11.92)
Regular Highways: $32,000 ($3.70)
- Federal Intergovernmental - Housing and Community Development: $273,000 ($31.59)
- Local Intergovernmental - Other: $154,000 ($17.82)
General Local Government Support: $6,000 ($0.69)
- Miscellaneous - General Revenue - Other: $45,000 ($5.21)
Fines and Forfeits: $38,000 ($4.40)
Sale of Property: $29,000 ($3.36)
Donations From Private Sources: $16,000 ($1.85)
Interest Earnings: $9,000 ($1.04)
- State Intergovernmental - Other: $431,000 ($49.88)
Highways: $308,000 ($35.64)
Housing and Community Development: $30,000 ($3.47)
General Local Government Support: $8,000 ($0.93)
- Tax - Property: $2,029,000 ($234.81)
Individual Income: $1,969,000 ($227.87)
Occupation and Business License - Other: $203,000 ($23.49)
Public Utility License: $179,000 ($20.72)
Documentary and Stock Transfer: $82,000 ($9.49)
Jeannette government finances - Debt in 2018 (per resident):
- Long Term Debt - Outstanding Unspecified Public Purpose: $5,386,000 ($623.31)
Beginning Outstanding - Unspecified Public Purpose: $4,233,000 ($489.87)
Issue, Unspecified Public Purpose: $1,381,000 ($159.82)
Retired Unspecified Public Purpose: $228,000 ($26.39)
Jeannette government finances - Cash and Securities in 2018 (per resident):
- Bond Funds - Cash and Securities: $3,696,000 ($427.73)
- Other Funds - Cash and Securities: $4,467,000 ($516.95)
| Businesses in Jeannette, PA | ||||
| Name | Count | Name | Count | |
|---|---|---|---|---|
| 7-Eleven | 1 | FedEx | 1 | |
| Advance Auto Parts | 1 | Penske | 1 | |
| AutoZone | 1 | Rite Aid | 1 | |
| Cricket Wireless | 1 | Subway | 2 | |
| Dairy Queen | 1 | True Value | 1 | |
Strongest AM radio stations in Jeannette:
- WKTW (1530 AM; daytime; 1 kW; JEANNETTE, PA; Owner: BROADCAST COMMUNICATIONS, INC.)
- WKHB (620 AM; 6 kW; IRWIN, PA; Owner: BROADCAST COMMUNICATIONS, INC.)
- KDKA (1020 AM; 50 kW; PITTSBURGH, PA; Owner: INFINITY BROADCASTING OPERATIONS, INC.)
- WAVL (910 AM; 5 kW; APOLLO, PA; Owner: EVANGEL HEIGHTS ASSEMBLY OF GOD)
- WJAS (1320 AM; 6 kW; PITTSBURGH, PA; Owner: RENDA BROADCASTING CORP. OF NEVADA)
- WPGR (1510 AM; 5 kW; MONROEVILLE, PA; Owner: MCL/ MCM- INC.)
- WPIT (730 AM; 5 kW; PITTSBURGH, PA; Owner: PENNSYLVANIA MEDIA ASSOCIATES, INC.)
- WPTT (1360 AM; 5 kW; MCKEESPORT, PA; Owner: RENDA BROADCASTING CORPORATION OF NEVADA)
- WEAE (1250 AM; 5 kW; PITTSBURGH, PA; Owner: ABC, INC.)
- WCCS (1160 AM; 10 kW; HOMER CITY, PA; Owner: RENDA RADIO, INC.)
- WEDO (810 AM; daytime; 1 kW; MCKEESPORT, PA; Owner: 810 INCORPORATED)
- WWVA (1170 AM; 53 kW; WHEELING, WV; Owner: CAPSTAR TX LIMITED PARTNERSHIP)
- WWCS (540 AM; 5 kW; CANONSBURG, PA; Owner: BIRACH BROADCASTING CORPORATION)
Strongest FM radio stations in Jeannette:
- WSSZ (107.1 FM; GREENSBURG, PA; Owner: MCL/MCM-INC.)
- WZPT (100.7 FM; NEW KENSINGTON, PA; Owner: INFINITY RADIO SUBSIDIARY OPERATIONS INC.)
- WSHH (99.7 FM; PITTSBURGH, PA; Owner: RENDA B/CING CORP. OF NEVADA)
- WDSY-FM (107.9 FM; PITTSBURGH, PA; Owner: INFINITY RADIO SUBSIDIARY OPERATIONS INC.)
- WWSW-FM (94.5 FM; PITTSBURGH, PA; Owner: AMFM RADIO LICENSES, L.L.C.)
- WLTJ (92.9 FM; PITTSBURGH, PA; Owner: WPNT, INC.)
- WLSW (103.9 FM; SCOTTDALE, PA; Owner: L. STANLEY WALL)
- WOGG (94.9 FM; OLIVER, PA; Owner: KEYMARKET LICENSES, LLC)
- WJJJ (104.7 FM; PITTSBURGH, PA; Owner: CAPSTAR TX LIMITED PARTNERSHIP)
- WQED-FM (89.3 FM; PITTSBURGH, PA; Owner: WQED MULTIMEDIA)
- WDVE (102.5 FM; PITTSBURGH, PA; Owner: CAPSTAR TX LIMITED PARTNERSHIP)
- WRRK (96.9 FM; BRADDOCK, PA; Owner: WPNT INC)
- WQEJ (89.7 FM; JOHNSTOWN, PA; Owner: WQED MULTIMEDIA)
- WKST-FM (96.1 FM; PITTSBURGH, PA; Owner: CAPSTAR TX LIMITED PARTNERSHIP)
- WFRJ (88.9 FM; JOHNSTOWN, PA; Owner: FAMILY STATIONS, INC.)
- WKYE (95.5 FM; JOHNSTOWN, PA; Owner: FOREVER OF JOHNSTOWN, INC.)
- WQKK (92.1 FM; JOHNSTOWN, PA; Owner: DAME BROADCASTING, LLC)
- WVPM (90.9 FM; MORGANTOWN, WV; Owner: WEST VIRGINIA EDUCATIONAL BROADCASTING AUTHORITY)
- WRWJ (88.1 FM; MURRYSVILLE, PA; Owner: HE'S ALIVE, INCORPORATED)
- WPTS-FM (92.1 FM; PITTSBURGH, PA; Owner: UNIV. OF PITTSBURGH COMMONWEALTH SYS)
TV broadcast stations around Jeannette:
- WQVC-CA (Channel 28; GREENSBURG, PA; Owner: ABACUS TELEVISION)
- W56CG (Channel 56; GREENSBURG, PA; Owner: TURNPIKE TELEVISION)
- WTAE-TV (Channel 4; PITTSBURGH, PA; Owner: WTAE HEARST-ARGYLE TV, INC. (CA CORP.))
- WCWB (Channel 22; PITTSBURGH, PA; Owner: WCWB LICENSEE, LLC)
- WPCB-TV (Channel 40; GREENSBURG, PA; Owner: CORNERSTONE TELEVISION, INC.)
- W65CG (Channel 65; PITTSBURGH, PA; Owner: TRINITY BROADCASTING NETWORK)
- WPXI (Channel 11; PITTSBURGH, PA; Owner: WPXI-TV HOLDINGS, INC.)
- WBGN-LP (Channel 59; PITTSBURGH, PA; Owner: BRUNO GOODWORTH NETWORK, INC.)
- WPTG-LP (Channel 69; PITTSBURGH, PA; Owner: ABACUS TELEVISION)
- WQEX (Channel 16; PITTSBURGH, PA; Owner: WQED MULTIMEDIA)
- KDKA-TV (Channel 2; PITTSBURGH, PA; Owner: CBS BROADCASTING INC.)
- WPGH-TV (Channel 53; PITTSBURGH, PA; Owner: WPGH LICENSEE, LLC)
- WQED (Channel 13; PITTSBURGH, PA; Owner: WQED MULTIMEDIA)
- W61CC (Channel 61; PITTSBURGH, PA; Owner: THE VIDEOHOUSE, INC.)
- WIIC-LP (Channel 29; PITTSBURGH, PA; Owner: ABACUS TELEVISION)
- WBPA-LP (Channel 29; PITTSBURGH, PA; Owner: VENTURE TECHNOLOGIES GROUP, LLC)
- WTOV-TV (Channel 9; STEUBENVILLE, OH; Owner: WTOV-TV HOLDINGS, INC.)
- WLLS-LP (Channel 49; INDIANA, PA; Owner: LARRY L. SCHRECONGOST)
- WBYD-CA (Channel 35; JOHNSTOWN, PA; Owner: BENJAMIN PEREZ)
- W63AU (Channel 63; PITTSBURGH, PA; Owner: THE BON-TELE NETWORK, INC.)
- W26AV (Channel 26; CHARLEROI, PA; Owner: DEBRA GOODWORTH)
Medal of Honor Recipients
Medal of Honor Recipient born in Jeannette: William A. Shomo.
- National Bridge Inventory (NBI) Statistics
- 53Number of bridges
- 417ft / 127mTotal length
- $1,068,000Total costs
- 258,816Total average daily traffic
- 27,456Total average daily truck traffic
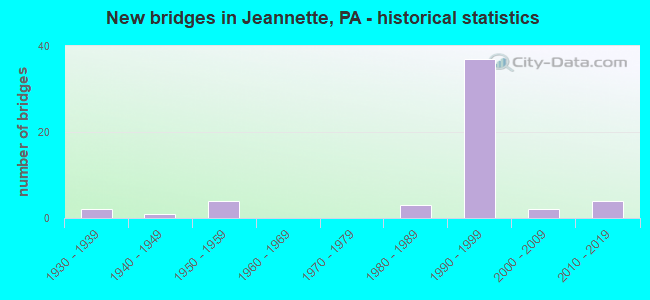
- New bridges - historical statistics
- 21930-1939
- 11940-1949
- 41950-1959
- 31980-1989
- 371990-1999
- 22000-2009
- 42010-2019
FCC Registered Antenna Towers:
20 (See the full list of FCC Registered Antenna Towers in Jeannette)FCC Registered Broadcast Land Mobile Towers:
6- 400 Baughman Ave (Lat: 40.315611 Lon: -79.606972), Call Sign: KKD218,
Assigned Frequencies: 33.6400 MHz, 33.7000 MHz, Grant Date: 04/12/2002, Expiration Date: 06/22/2012, Cancellation Date: 08/25/2012, Registrant: High Park Volunteer Fire Department, 400 Baughman Avenue, Jeannette, PA 15644, Phone: (724) 527-3560
- Second & Clay Ave (Lat: 40.326444 Lon: -79.615333), Call Sign: KNIF275,
Assigned Frequencies: 155.010 MHz, 155.130 MHz, 155.430 MHz, Grant Date: 11/20/2013, Expiration Date: 02/04/2024, Cancellation Date: 11/17/2023, Registrant: 911 Public Safety Road, Greensburg, PA 15601, Phone: (724) 600-7302, Fax: (724) 600-7388, Email:
- Jefferson St (Lat: 40.319500 Lon: -79.612278), Call Sign: WNLF977, Licensee ID: L00073958,
Assigned Frequencies: 453.175 MHz, Grant Date: 02/10/1998, Expiration Date: 04/22/2003, Cancellation Date: 07/27/2003, Registrant: Jeannette District Memorial Hospital, Jefferson St, Jeannette, PA 15644, Phone: (412) 527-3551
- 600 Jefferson Ave (Lat: 40.319500 Lon: -79.610611), Type: Building, Structure height: 27 m, Overall height: 31 m, Call Sign: WPOX681,
Assigned Frequencies: 35.6800 MHz, Grant Date: 07/07/2004, Expiration Date: 08/25/2014, Cancellation Date: 10/25/2014, Registrant: Federal Licensing Inc, 1588 Fairfield Road, Gettysburg, PA 17325, Phone: (717) 334-9262, Fax: (717) 334-6440
- 200 Lincoln Way W 1.3 Mi S (Lat: 40.312278 Lon: -79.627278), Structure height: 82 m, Call Sign: KVJ501,
Assigned Frequencies: 48.0400 MHz, 48.0600 MHz, 48.1000 MHz, 47.9200 MHz, Grant Date: 10/29/2022, Expiration Date: 10/30/2032, Certifier: Ernest N Maley Jr., Registrant: Felhc, Inc, 76 South Main Street, Akron, OH 44308, Phone: (330) 436-2208, Email:
- 209 S 6th St (Lat: 40.327278 Lon: -79.519472), Call Sign: WRJ455,
Assigned Frequencies: 152.450 MHz, Grant Date: 05/06/1999, Expiration Date: 07/17/2004, Cancellation Date: 09/26/2004, Registrant: Jeannette Taxi Co Inc, 209 S Sixth St, Jeannette, PA 15644, Phone: (412) 523-3421
FCC Registered Microwave Towers:
4- LINCOLN WAY, 200 Lincoln Way W 1.3 Mi S (Lat: 40.312278 Lon: -79.627278), Type: Tower, Structure height: 81.7 m, Call Sign: WNEN349,
Assigned Frequencies: 5945.20 MHz, 6093.45 MHz, 6004.50 MHz, 6152.75 MHz, Grant Date: 04/07/2021, Expiration Date: 04/11/2031, Certifier: Ernest N Maley Jr, Registrant: Firstenergy Corp., 341 White Pond Drive, Akron, OH 44320, Phone: (330) 436-2208, Email:
- PIT0611, 65 Burrell Hill Road (Lat: 40.343083 Lon: -79.632250), Type: Mast, Structure height: 60.9 m, Call Sign: WQFE599, Licensee ID: L01728370,
Assigned Frequencies: 10995.0 MHz, 10835.0 MHz, 19380.0 MHz, 10915.0 MHz, 10875.0 MHz, 19315.0 MHz, Grant Date: 06/27/2006, Expiration Date: 06/27/2016, Cancellation Date: 08/16/2013, Certifier: Joseph M Sandri Jr., Registrant: Fibertower Network Services, Corp., Debtor-In-Possession, 1875 Eye Street, Nw, 5th Floor, Room 505, Washington, DC 20006, Phone: (202) 223-1028, Email:
- PIT0646, 200 Lincoln Way W 1.3 Mi S (Lat: 40.312222 Lon: -79.627222), Type: Tower, Structure height: 81.7 m, Call Sign: WQNF233,
Assigned Frequencies: 17755.0 MHz, Grant Date: 01/14/2011, Expiration Date: 01/14/2021, Cancellation Date: 08/08/2012, Certifier: Joseph M Sandri Jr., Registrant: Fibertower Corporation, 1730 Rhode Island Avenue Nw, Suite 304, Washington, DC 20036, Phone: (202) 223-1028, Fax: (202) 315-3415, Email:
- A4J0435A, 1 College Avenue (Lat: 40.334722 Lon: -79.619167), Type: Mtower, Structure height: 33.5 m, Call Sign: WQRM438,
Assigned Frequencies: 18015.0 MHz, 18015.0 MHz, 18015.0 MHz, 18015.0 MHz, 18015.0 MHz, 18015.0 MHz, 18015.0 MHz, 18015.0 MHz, Grant Date: 06/18/2013, Expiration Date: 06/18/2023, Cancellation Date: 09/10/2021, Certifier: Dan Menser, Registrant: T-Mobile Usa, Inc., 12920 Se 38th Street, Bellevue, WA 98006, Phone: (425) 383-8401, Email:
FCC Registered Maritime Coast & Aviation Ground Towers:
1- Lat: 40.376333 Lon: -79.608778, Call Sign: WRWZ608,
Assigned Frequencies: 122.900 MHz, Grant Date: 04/17/2023, Expiration Date: 04/17/2033, Certifier: Jon R Little, Registrant: Near Earth Autonomy, 150 N. Lexington Street, Pittsburgh, PA 15208, Phone: (412) 671-9769, Email:
FCC Registered Amateur Radio Licenses:
63 (See the full list of FCC Registered Amateur Radio Licenses in Jeannette)FAA Registered Aircraft:
5- Aircraft: PIPER PA-28-180 (Category: Land, Seats: 4, Weight: Up to 12,499 Pounds, Speed: 107 mph), Engine: LYCOMING O&VO-360 SER (180 HP) (Reciprocating)
N-Number: 16509, N16509, N-16509, Serial Number: 28-7305271, Year manufactured: 1973, Airworthiness Date: 02/14/1973, Certificate Issue Date: 12/30/2016
Registrant (Corporation): Greensburg Jeannette Airport Administration, 1200 Airport Rd, Jeannette, PA 15644 - Aircraft: CESSNA 172G (Category: Land, Seats: 4, Weight: Up to 12,499 Pounds, Speed: 105 mph), Engine: CONT MOTOR 0-300 SER (145 HP) (Reciprocating)
N-Number: 3808L, N3808L, N-3808L, Serial Number: 17253977, Airworthiness Date: 01/10/1966, Certificate Issue Date: 05/14/2018
Registrant (Corporation): Greensburg Jeanette Airport Administration, 1200 Airport Rd, Jeannette, PA 15644 - Aircraft: CESSNA 337B (Category: Land, Engines: 2, Seats: 6, Weight: Up to 12,499 Pounds, Speed: 142 mph), Engine: CONT MOTOR IO-360 SER (300 HP) (Reciprocating)
N-Number: 5431S, N5431S, N-5431S, Serial Number: 337-0531, Year manufactured: 1966, Airworthiness Date: 11/25/1966, Certificate Issue Date: 02/01/2019
Registrant (Corporation): Greensburg Jeanette Airport Administration Inc, 1200 Airport Rd, Jeannette, PA 15644 - Aircraft: CESSNA 172M (Category: Land, Seats: 4, Weight: Up to 12,499 Pounds, Speed: 108 mph), Engine: LYCOMING 0-320 SERIES (180 HP) (4 Cycle)
N-Number: 80230, N80230, N-80230, Serial Number: 17266461, Year manufactured: 1975, Airworthiness Date: 02/04/1976, Certificate Issue Date: 11/09/2020
Registrant (Individual): Laverne Lee Coates, 1022 Wedgewood Dr, Jeannette, PA 15644 - Aircraft: PIPER PA-24-250 (Category: Land, Seats: 4, Weight: Up to 12,499 Pounds, Speed: 135 mph), Engine: LYCOMING 0-540 SERIES (250 HP) (Reciprocating)
N-Number: 7768P, N7768P, N-7768P, Serial Number: 24-2984, Year manufactured: 1961, Airworthiness Date: 12/29/1961, Certificate Issue Date: 10/30/2013
Registrant (Corporation): Greensburg Jeannette Airport Administration, Airport Rd, Jeannette, PA 15644
Deregistered: Cancel Date: 02/03/2020
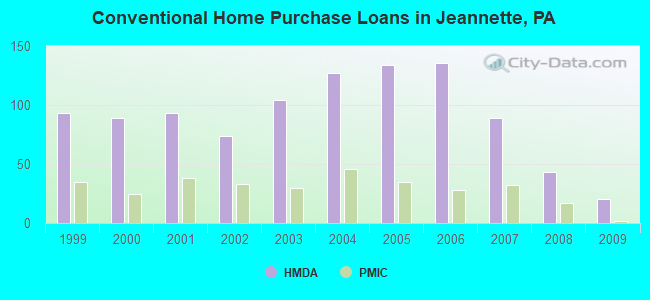
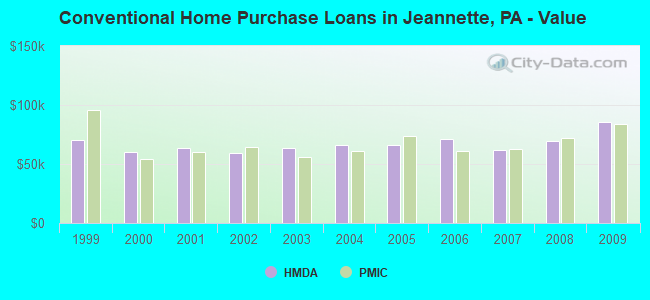
| Home Mortgage Disclosure Act Aggregated Statistics For Year 2009 (Based on 3 full and 1 partial tracts) | ||||||||||||||
| A) FHA, FSA/RHS & VA Home Purchase Loans | B) Conventional Home Purchase Loans | C) Refinancings | D) Home Improvement Loans | E) Loans on Dwellings For 5+ Families | F) Non-occupant Loans on < 5 Family Dwellings (A B C & D) | G) Loans On Manufactured Home Dwelling (A B C & D) | ||||||||
|---|---|---|---|---|---|---|---|---|---|---|---|---|---|---|
| Number | Average Value | Number | Average Value | Number | Average Value | Number | Average Value | Number | Average Value | Number | Average Value | Number | Average Value | |
| LOANS ORIGINATED | 59 | $79,935 | 20 | $85,746 | 65 | $94,057 | 19 | $16,655 | 0 | $0 | 4 | $90,000 | 0 | $0 |
| APPLICATIONS APPROVED, NOT ACCEPTED | 2 | $104,500 | 1 | $146,000 | 16 | $107,620 | 1 | $12,160 | 0 | $0 | 0 | $0 | 0 | $0 |
| APPLICATIONS DENIED | 9 | $68,222 | 5 | $48,400 | 76 | $79,387 | 27 | $37,969 | 1 | $81,000 | 9 | $62,243 | 1 | $60,000 |
| APPLICATIONS WITHDRAWN | 4 | $86,718 | 2 | $56,760 | 42 | $82,504 | 6 | $25,333 | 0 | $0 | 4 | $79,000 | 0 | $0 |
| FILES CLOSED FOR INCOMPLETENESS | 0 | $0 | 0 | $0 | 10 | $78,019 | 1 | $105,000 | 0 | $0 | 1 | $8,920 | 0 | $0 |
Detailed HMDA statistics for the following Tracts: 8025.00 , 8026.00, 8027.00, 8028.00
| Private Mortgage Insurance Companies Aggregated Statistics For Year 2009 (Based on 3 full and 1 partial tracts) | ||||
| A) Conventional Home Purchase Loans | B) Refinancings | |||
|---|---|---|---|---|
| Number | Average Value | Number | Average Value | |
| LOANS ORIGINATED | 2 | $84,115 | 4 | $139,122 |
| APPLICATIONS APPROVED, NOT ACCEPTED | 1 | $247,000 | 3 | $184,000 |
| APPLICATIONS DENIED | 0 | $0 | 2 | $113,460 |
| APPLICATIONS WITHDRAWN | 0 | $0 | 0 | $0 |
| FILES CLOSED FOR INCOMPLETENESS | 0 | $0 | 0 | $0 |
Detailed PMIC statistics for the following Tracts: 8025.00 , 8026.00, 8027.00, 8028.00
2003 - 2018 National Fire Incident Reporting System (NFIRS) incidents
- Fire incident types reported to NFIRS in Jeannette, PA
- 85771.8%Structure Fires
- 14412.1%Outside Fires
- 1189.9%Other
- 756.3%Mobile Property/Vehicle Fires
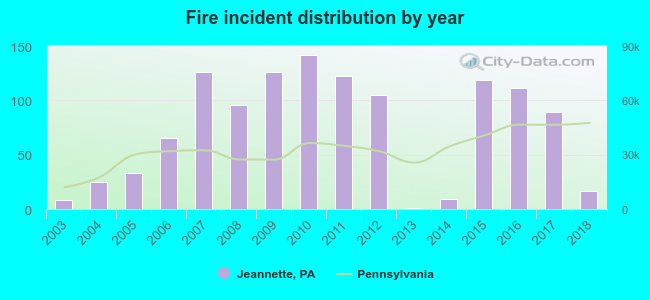 Based on the data from the years 2003 - 2018 the average number of fires per year is 75. The highest number of reported fire incidents - 142 took place in 2010, and the least - 1 in 2013. The data has a growing trend.
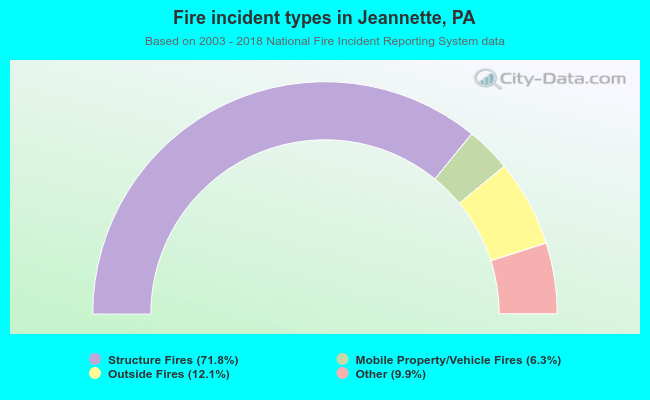 When looking into fire subcategories, the most reports belonged to: Structure Fires (71.8%), and Outside Fires (12.1%).
| Most common first names in Jeannette, PA among deceased individuals | ||
| Name | Count | Lived (average) |
|---|---|---|
| John | 319 | 73.8 years |
| Mary | 282 | 79.7 years |
| William | 224 | 74.1 years |
| Joseph | 163 | 74.8 years |
| James | 153 | 71.1 years |
| George | 146 | 73.7 years |
| Charles | 138 | 74.2 years |
| Robert | 126 | 69.5 years |
| Anna | 116 | 82.5 years |
| Helen | 111 | 78.0 years |
| Most common last names in Jeannette, PA among deceased individuals | ||
| Last name | Count | Lived (average) |
|---|---|---|
| Miller | 91 | 76.0 years |
| Smith | 64 | 76.2 years |
| Loughner | 48 | 73.2 years |
| Brown | 39 | 73.3 years |
| Jones | 37 | 73.5 years |
| Kemerer | 37 | 76.0 years |
| Baughman | 28 | 77.4 years |
| Myers | 27 | 77.6 years |
| Baker | 26 | 74.0 years |
| Johnson | 25 | 76.4 years |
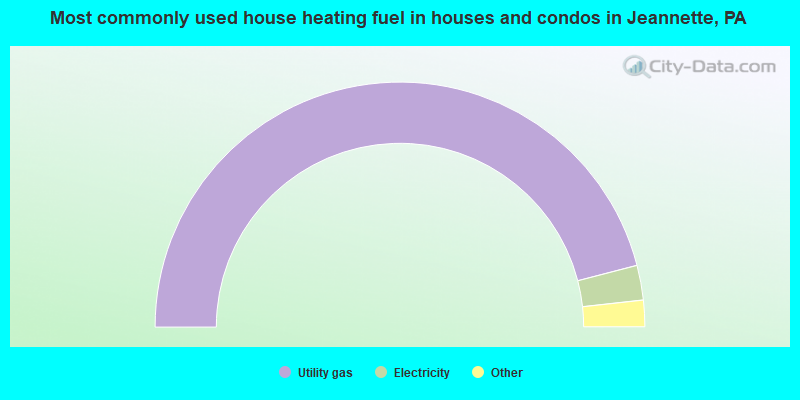
- 92.0%Utility gas
- 4.6%Electricity
- 2.0%Fuel oil, kerosene, etc.
- 0.5%Bottled, tank, or LP gas
- 0.5%Other fuel
- 0.5%No fuel used
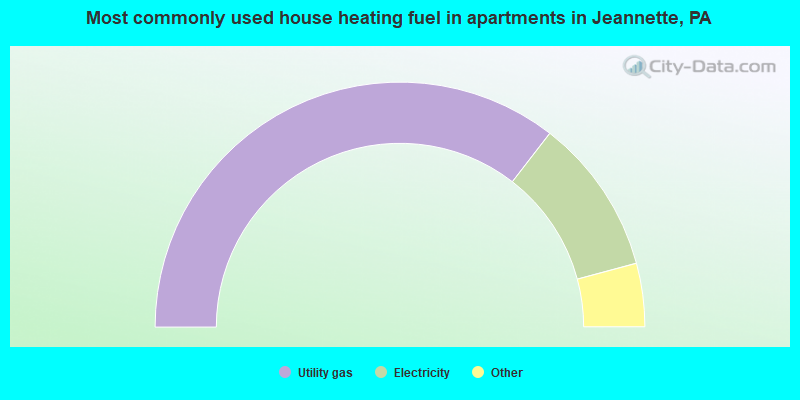
- 71.1%Utility gas
- 20.7%Electricity
- 3.4%Fuel oil, kerosene, etc.
- 2.5%No fuel used
- 1.2%Bottled, tank, or LP gas
- 1.2%Wood
Jeannette compared to Pennsylvania state average:
- Median house value below state average.
- Unemployed percentage below state average.
- Hispanic race population percentage below state average.
- Foreign-born population percentage below state average.
- Length of stay since moving in above state average.
Jeannette on our top lists:
- #53 on the list of "Top 101 cities with the most residents born in Belarus (population 500+)"
- #91 on the list of "Top 101 cities with the lowest number of auto thefts per 100,000 residents (population 5,000+)"
- #13 on the list of "Top 101 counties with the lowest number of births per 1000 residents 2007-2013"
- #22 on the list of "Top 101 counties with the most Mainline Protestant congregations"
- #22 on the list of "Top 101 counties with the most Orthodox congregations"
- #26 on the list of "Top 101 counties with the lowest percentage of residents relocating to other counties in 2011"
- #40 on the list of "Top 101 counties with the most Catholic congregations"

|
|
Total of 84 patent applications in 2008-2024.