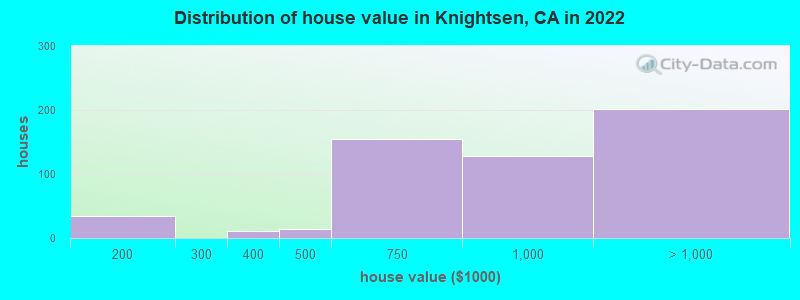
Estimated median house or condo value in 2022: $911,328 (it was $329,800 in 2000)
Knightsen:
$911,328
CA:
$715,900
Mean prices in 2022:all housing units: over $1,000,000; detached houses: over $1,000,000; townhouses or other attached units: $865,348; in 2-unit structures: $602,949; in 3-to-4-unit structures: $772,223; in 5-or-more-unit structures: $695,046; mobile homes: $193,193; occupied boats, rvs, vans, etc.: $261,954
Median gross rent in 2022: $2,048.
March 2022 cost of living index in Knightsen: 108.4 (more than average, U.S. average is 100)
Percentage of residents living in poverty in 2022: 3.4%
(3.9% for White Non-Hispanic residents, 3.4% for Hispanic or Latino residents, 7.8% for two or more races residents)
According to our research of California and other state lists, there were 2 registered sex offenders living in Knightsen, California as of May 18, 2024. The ratio of all residents to sex offenders in Knightsen is 823 to 1. The ratio of registered sex offenders to all residents in this city is near the state average.
Recent articles from our blog. Our writers, many of them Ph.D. graduates or candidates, create easy-to-read articles on a wide variety of topics.
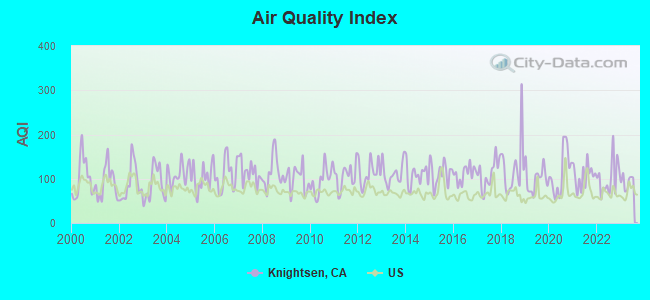
Air Quality Index (AQI) level in 2023 was 93.8. This is worse than average.
City:
93.8
U.S.:
72.6
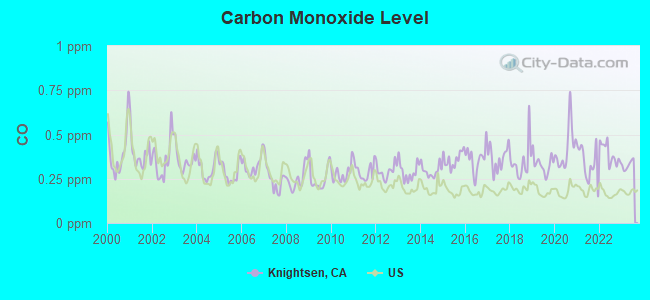
Carbon Monoxide (CO) [ppm] level in 2023 was 0.328. This is worse than average.Closest monitor was 2.9 miles away from the city center.
City:
0.328
U.S.:
0.251
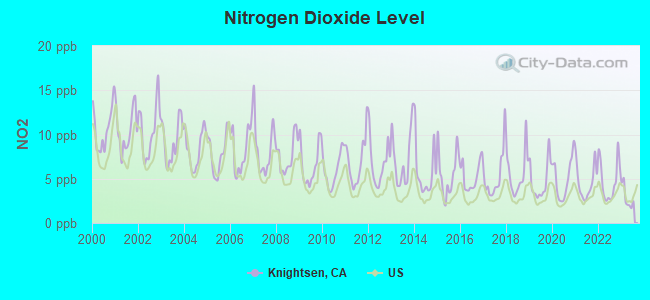
Nitrogen Dioxide (NO2) [ppb] level in 2023 was 2.89. This is significantly better than average.Closest monitor was 2.9 miles away from the city center.
City:
2.89
U.S.:
5.11
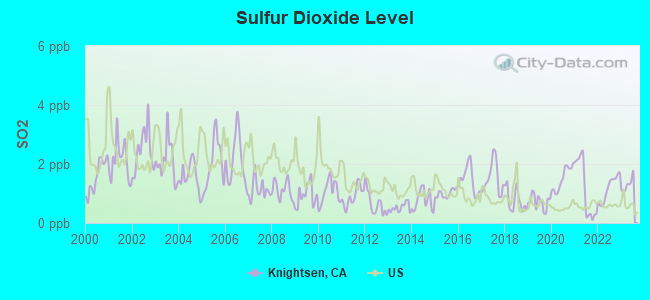
Sulfur Dioxide (SO2) [ppb] level in 2023 was 1.30. This is about average.Closest monitor was 2.9 miles away from the city center.
City:
1.30
U.S.:
1.51
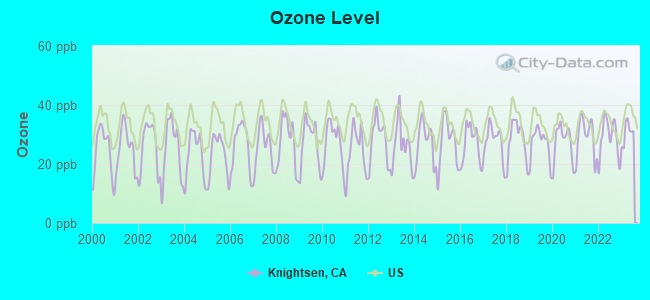
Ozone [ppb] level in 2023 was 30.6. This is about average.Closest monitor was 2.9 miles away from the city center.
City:
30.6
U.S.:
33.3
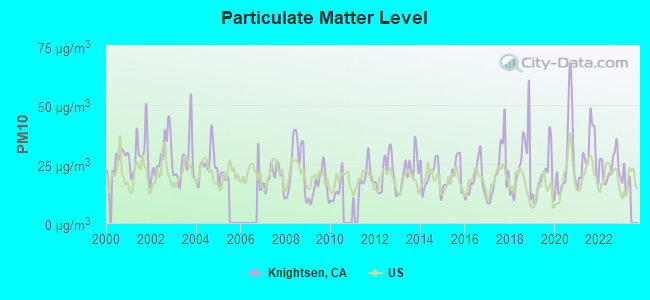
Particulate Matter (PM10) [µg/m3] level in 2022 was 23.7. This is worse than average.Closest monitor was 2.9 miles away from the city center.
City:
23.7
U.S.:
19.2
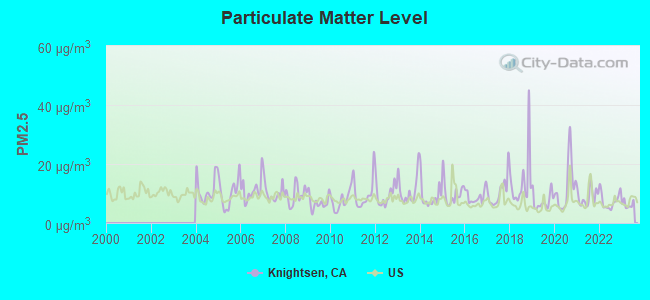
Particulate Matter (PM2.5) [µg/m3] level in 2023 was 6.28. This is better than average.Closest monitor was 19.8 miles away from the city center.
City:
6.28
U.S.:
8.11
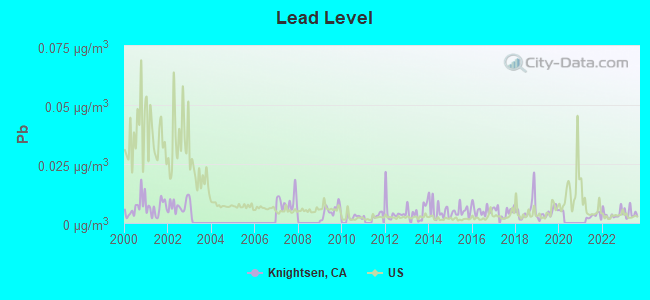
Lead (Pb) [µg/m3] level in 2023 was 0.00414. This is significantly better than average.Closest monitor was 2.9 miles away from the city center.
City:
0.00414
U.S.:
0.00931
Earthquake activity:
Knightsen-area historical earthquake activity is significantly above California state average. It is 7852% greater than the overall U.S. average.
On 4/18/1906 at 13:12:21, a magnitude 7.9 (7.9 UK, Class: Major, Intensity: VIII - XII) earthquake occurred 72.8 miles away from the city center, causing $524,000,000 total damage On 10/18/1989 at 00:04:15, a magnitude 7.1 (6.5 MB, 7.1 MS, 6.9 MW, 7.0 ML) earthquake occurred 59.7 miles away from Knightsen center, causing 62 deaths (62 shaking deaths) and 3757 injuries, causing $1,305,032,704 total damage On 7/21/1952 at 11:52:14, a magnitude 7.7 (7.7 UK) earthquake occurred 253.3 miles away from the city center, causing $50,000,000 total damage On 11/4/1927 at 13:51:53, a magnitude 7.5 (7.5 UK) earthquake occurred 214.2 miles away from Knightsen center On 1/31/1922 at 13:17:28, a magnitude 7.6 (7.6 UK) earthquake occurred 280.9 miles away from the city center On 10/3/1915 at 06:52:48, a magnitude 7.6 (7.6 UK) earthquake occurred 283.6 miles away from Knightsen center Magnitude types: body-wave magnitude (MB), local magnitude (ML), surface-wave magnitude (MS), moment magnitude (MW)
Natural disasters:
The number of natural disasters in Contra Costa County (18) is near the US average (15). Major Disasters (Presidential) Declared: 11 Emergencies Declared: 3
Causes of natural disasters: Floods: 13, Storms: 7, Winter Storms: 7, Mudslides: 5, Landslides: 4, Drought: 1, Earthquake: 1, Hurricane: 1, Tornado: 1, Wind: 1, Other: 1 (Note: some incidents may be assigned to more than one category).
Hospitals and medical centers near Knightsen:
KC'S SUNSHINE HOMES, ANGELIC II (Hospital, about 3 miles away; OAKLEY, CA)
FMC DIABLO BRENTWOOD (Dialysis Facility, about 3 miles away; BRENTWOOD, CA)
KAISER FOUNDATION HOSPITAL - ANTIOCH Acute Care Hospitals (about 5 miles away; ANTIOCH, CA)
FMC EAST ANTIOCH (Dialysis Facility, about 7 miles away; ANTIOCH, CA)
LONE TREE CONV HOSP (Nursing Home, about 7 miles away; ANTIOCH, CA)
SUTTER DELTA MEDICAL CENTER Acute Care Hospitals (about 7 miles away; ANTIOCH, CA)
AMERICAN STAR HOME II ICF/DD-N (Hospital, about 8 miles away; ANTIOCH, CA)
9 miles: ANTIOCH-PITTSBURG (ANTIOCH, I ST. & SANTA FE TRACKS) . Services: public payphones, full-service food facilities, free short-term parking, free long-term parking, call for taxi service, intercity bus service, public transit connection.
19 miles: LIVERMORE (720 LAS FLORES DR.) - Bus Station . Services: fully wheelchair accessible, enclosed waiting area, public restrooms, public payphones, full-service food facilities, free short-term parking, free long-term parking, call for taxi service, intercity bus service, public transit connection.
20 miles: TRACY (725 W. CLOVER RD.) - Bus Station . Services: fully wheelchair accessible, public restrooms, public payphones, snack bar, free short-term parking, call for taxi service.
Colleges/universities with over 2000 students nearest to Knightsen:
Los Medanos College (about 11 miles; Pittsburg, CA; Full-time enrollment: 5,289)
San Joaquin Delta College (about 20 miles; Stockton, CA; FT enrollment: 12,167)
Las Positas College (about 20 miles; Livermore, CA; FT enrollment: 5,112)
University of the Pacific (about 20 miles; Stockton, CA; FT enrollment: 4,999)
Diablo Valley College (about 23 miles; Pleasant Hill, CA; FT enrollment: 13,015)
Saint Mary's College of California (about 26 miles; Moraga, CA; FT enrollment: 4,200)
Merritt College (about 31 miles; Oakland, CA; FT enrollment: 2,842)
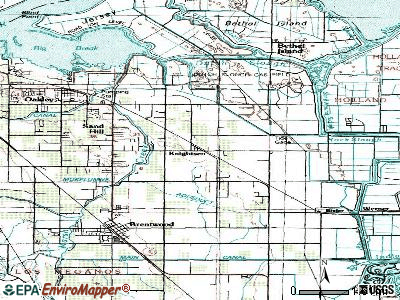
Notable locations in Knightsen: Smith Family Farms (A), Village Nurseries Landscape Center (B), East Contra Costa Fire Protection District Station 94 (C). Display/hide their locations on the map
Contra Costa County has a predicted average indoor radon screening level between 2 and 4 pCi/L (pico curies per liter) - Moderate Potential
Drinking water stations with addresses in Knightsen and their reported violations in the past:
Religion statistics for Knightsen, CA (based on Contra Costa County data)
Religion
Adherents
Congregations
Catholic
228,400
34
Evangelical Protestant
81,120
352
Other
48,553
123
Mainline Protestant
32,693
101
Black Protestant
10,395
34
Orthodox
2,435
8
None
645,429
-
Source: Clifford Grammich, Kirk Hadaway, Richard Houseal, Dale E.Jones, Alexei Krindatch, Richie Stanley and Richard H.Taylor. 2012. 2010 U.S.Religion Census: Religious Congregations & Membership Study. Association of Statisticians of American Religious Bodies. Jones, Dale E., et al. 2002. Congregations and Membership in the United States 2000. Nashville, TN: Glenmary Research Center. Graphs represent county-level data
2nd And A Sts (Lat: 37.969639 Lon: -121.667167), Call Sign: KEY924, Assigned Frequencies: 46.1000 MHz, 46.1800 MHz, 46.2400 MHz, 46.3800 MHz, Grant Date: 09/08/2021, Expiration Date: 12/04/2031, Registrant: Csi Telecommunications, Inc. Consulting Engineers, Six Hamilton Landing, Suite 170, Novato, CA 94949, Phone: (415) 751-8845, Email:
N Knightsen Ave 250 N Of Rr Tracks (Lat: 37.974917 Lon: -121.667722), Call Sign: KNCX677, Licensee ID: L00114435, Assigned Frequencies: 151.595 MHz, Grant Date: 05/08/2012, Expiration Date: 05/07/2022, Cancellation Date: 07/09/2022, Registrant: Albert G Bello, Knightsen, CA 94548, Phone: (510) 625-3553, Email:
KNIGHTSEN ELEMENTARY, 1923 Delta Road (Lat: 37.967889 Lon: -121.660278), Type: Building, Structure height: 9 m, Call Sign: WQVK648, Assigned Frequencies: 462.925 MHz, Grant Date: 03/12/2015, Expiration Date: 03/12/2025, Certifier: Theresa Estrada, Registrant: Visiplex, Inc., 1287 North Barclay Boulevard, Buffalo Grove, IL 60089, Phone: (847) 229-0250, Fax: (847) 229-0259, Email:
FCC Registered Amateur Radio Licenses:
5
Call Sign: KE6WKG, Licensee ID: L01012152, Grant Date: 07/30/2015, Expiration Date: 07/31/2025, Certifier: Thomas L Jepsen, Registrant: Thomas L Jepsen, Knightsen, CA 94548
Call Sign: KE6YLR, Grant Date: 03/13/1997, Expiration Date: 09/17/2005, Cancellation Date: 09/18/2007, Registrant: Lawrence W Gold, C/O Safe Harbor Services, Knightsen, CA 94548
Call Sign: KJ6USR, Licensee ID: L01694398, Grant Date: 03/08/2012, Expiration Date: 03/08/2022, Cancellation Date: 03/09/2024, Certifier: Russell A Lockwood, Registrant: Russell A Lockwood, Knightsen, CA 94548
Call Sign: KM6HDR, Licensee ID: L02069173, Grant Date: 12/12/2016, Expiration Date: 12/12/2026, Certifier: Eric S Peterson, Registrant: Eric S Peterson, Knightsen, CA 94548
Call Sign: KM6QLP, Licensee ID: L02163587, Grant Date: 02/16/2018, Expiration Date: 02/16/2028, Certifier: Michael L Mullinix, Registrant: Michael L Mullinix, Knightsen, CA 94548
FAA Registered Aircraft:
1
Aircraft: CESSNA 150J (Category: Land, Seats: 2, Weight: Up to 12,499 Pounds, Speed: 90 mph), Engine: CONT MOTOR 0-200 SERIES (100 HP) (Reciprocating) N-Number: 61360, N61360, N-61360, Serial Number: 15070988, Year manufactured: 1969, Airworthiness Date: 07/07/1969, Certificate Issue Date: 11/14/2011 Registrant (Corporation): T & G Apache Enterprise Inc, Po Box 596, Knightsen, CA 94548 Deregistered:Cancel Date: 01/05/2018
Home Mortgage Disclosure Act Aggregated Statistics For Year 2009 (Based on 2 partial tracts)
A) FHA, FSA/RHS & VA Home Purchase Loans
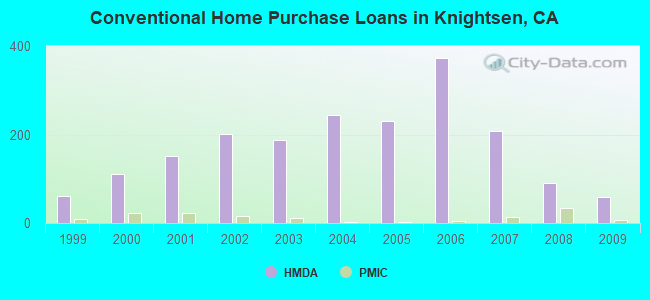
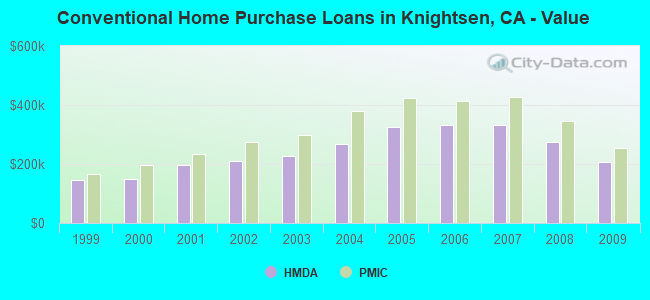
B) Conventional Home Purchase Loans
C) Refinancings
D) Home Improvement Loans
F) Non-occupant Loans on < 5 Family Dwellings (A B C & D)
Number
Average Value
Number
Average Value
Number
Average Value
Number
Average Value
Number
Average Value
LOANS ORIGINATED
116
$252,987
58
$206,965
80
$271,292
3
$71,207
24
$171,136
APPLICATIONS APPROVED, NOT ACCEPTED
7
$256,813
9
$228,642
12
$273,407
1
$56,730
3
$174,307
APPLICATIONS DENIED
17
$256,251
17
$215,624
48
$281,908
3
$145,813
11
$207,600
APPLICATIONS WITHDRAWN
10
$238,712
6
$202,515
21
$281,153
0
$0
3
$193,023
FILES CLOSED FOR INCOMPLETENESS
5
$244,248
2
$239,865
6
$311,277
0
$0
1
$257,750
Aggregated Statistics For Year 2008 (Based on 2 partial tracts)
A) FHA, FSA/RHS & VA Home Purchase Loans
B) Conventional Home Purchase Loans
C) Refinancings
D) Home Improvement Loans
F) Non-occupant Loans on < 5 Family Dwellings (A B C & D)
G) Loans On Manufactured Home Dwelling (A B C & D)
Number
Average Value
Number
Average Value
Number
Average Value
Number
Average Value
Number
Average Value
Number
Average Value
LOANS ORIGINATED
75
$291,631
90
$275,340
36
$273,288
4
$66,245
24
$201,585
1
$144,160
APPLICATIONS APPROVED, NOT ACCEPTED
7
$331,631
26
$310,686
14
$313,160
1
$128,220
5
$239,618
0
$0
APPLICATIONS DENIED
18
$325,751
38
$293,944
58
$342,895
13
$123,675
10
$229,510
0
$0
APPLICATIONS WITHDRAWN
7
$333,509
14
$305,085
20
$339,031
1
$178,480
4
$226,188
1
$503,550
FILES CLOSED FOR INCOMPLETENESS
1
$398,380
7
$258,259
8
$343,512
1
$84,750
2
$275,480
0
$0
Aggregated Statistics For Year 2007 (Based on 2 partial tracts)
A) FHA, FSA/RHS & VA Home Purchase Loans
B) Conventional Home Purchase Loans
C) Refinancings
D) Home Improvement Loans
F) Non-occupant Loans on < 5 Family Dwellings (A B C & D)
G) Loans On Manufactured Home Dwelling (A B C & D)
Number
Average Value
Number
Average Value
Number
Average Value
Number
Average Value
Number
Average Value
Number
Average Value
LOANS ORIGINATED
1
$264,770
207
$331,533
188
$338,860
30
$202,490
25
$332,170
1
$179,860
APPLICATIONS APPROVED, NOT ACCEPTED
0
$0
60
$368,394
60
$350,002
12
$134,855
6
$341,623
0
$0
APPLICATIONS DENIED
0
$0
106
$385,850
182
$401,560
32
$215,262
22
$368,654
2
$123,275
APPLICATIONS WITHDRAWN
0
$0
44
$374,419
63
$384,504
8
$248,200
8
$335,650
0
$0
FILES CLOSED FOR INCOMPLETENESS
0
$0
9
$365,584
20
$402,786
4
$154,455
1
$266,060
0
$0
Aggregated Statistics For Year 2006 (Based on 2 partial tracts)
B) Conventional Home Purchase Loans
C) Refinancings
D) Home Improvement Loans
F) Non-occupant Loans on < 5 Family Dwellings (A B C & D)
G) Loans On Manufactured Home Dwelling (A B C & D)
Number
Average Value
Number
Average Value
Number
Average Value
Number
Average Value
Number
Average Value
LOANS ORIGINATED
374
$331,941
297
$346,958
41
$233,731
37
$346,335
1
$412,810
APPLICATIONS APPROVED, NOT ACCEPTED
110
$329,148
68
$352,339
11
$242,375
9
$299,049
1
$86,430
APPLICATIONS DENIED
115
$349,079
147
$385,783
34
$229,640
18
$368,325
1
$36,910
APPLICATIONS WITHDRAWN
82
$365,063
86
$361,065
7
$239,649
8
$386,101
0
$0
FILES CLOSED FOR INCOMPLETENESS
12
$358,915
24
$357,515
2
$285,795
3
$388,827
0
$0
Aggregated Statistics For Year 2005 (Based on 2 partial tracts)
B) Conventional Home Purchase Loans
C) Refinancings
D) Home Improvement Loans
F) Non-occupant Loans on < 5 Family Dwellings (A B C & D)
G) Loans On Manufactured Home Dwelling (A B C & D)
Number
Average Value
Number
Average Value
Number
Average Value
Number
Average Value
Number
Average Value
LOANS ORIGINATED
231
$325,292
382
$342,035
37
$243,875
44
$313,015
2
$351,945
APPLICATIONS APPROVED, NOT ACCEPTED
48
$307,912
60
$347,525
6
$212,488
8
$308,309
1
$257,300
APPLICATIONS DENIED
90
$337,443
135
$342,927
26
$162,971
15
$317,764
2
$229,025
APPLICATIONS WITHDRAWN
50
$305,001
90
$322,605
9
$264,300
9
$324,106
0
$0
FILES CLOSED FOR INCOMPLETENESS
13
$316,085
27
$353,539
4
$226,565
3
$317,453
0
$0
Aggregated Statistics For Year 2004 (Based on 2 partial tracts)
B) Conventional Home Purchase Loans
C) Refinancings
D) Home Improvement Loans
E) Loans on Dwellings For 5+ Families
F) Non-occupant Loans on < 5 Family Dwellings (A B C & D)
G) Loans On Manufactured Home Dwelling (A B C & D)
Number
Average Value
Number
Average Value
Number
Average Value
Number
Average Value
Number
Average Value
Number
Average Value
LOANS ORIGINATED
244
$268,214
303
$267,819
39
$184,506
1
$1,348,360
33
$251,105
2
$148,970
APPLICATIONS APPROVED, NOT ACCEPTED
57
$261,992
55
$265,917
5
$133,658
0
$0
4
$257,728
1
$155,450
APPLICATIONS DENIED
76
$261,703
113
$272,752
22
$121,318
0
$0
12
$268,337
1
$141,670
APPLICATIONS WITHDRAWN
45
$269,495
91
$258,212
7
$176,223
0
$0
5
$227,710
0
$0
FILES CLOSED FOR INCOMPLETENESS
16
$251,092
18
$290,884
3
$132,983
0
$0
1
$391,390
0
$0
Aggregated Statistics For Year 2003 (Based on 2 partial tracts)
A) FHA, FSA/RHS & VA Home Purchase Loans
B) Conventional Home Purchase Loans
C) Refinancings
D) Home Improvement Loans
F) Non-occupant Loans on < 5 Family Dwellings (A B C & D)
Number
Average Value
Number
Average Value
Number
Average Value
Number
Average Value
Number
Average Value
LOANS ORIGINATED
8
$248,591
187
$228,057
445
$220,128
21
$55,214
33
$202,298
APPLICATIONS APPROVED, NOT ACCEPTED
1
$236,050
27
$270,995
74
$224,200
5
$62,400
4
$206,180
APPLICATIONS DENIED
1
$164,850
35
$208,091
116
$219,394
14
$70,584
7
$187,917
APPLICATIONS WITHDRAWN
2
$255,380
36
$231,328
93
$218,707
5
$93,542
3
$234,417
FILES CLOSED FOR INCOMPLETENESS
0
$0
6
$319,907
18
$238,194
1
$82,500
1
$382,900
Aggregated Statistics For Year 2002 (Based on 2 partial tracts)
A) FHA, FSA/RHS & VA Home Purchase Loans
B) Conventional Home Purchase Loans
C) Refinancings
D) Home Improvement Loans
F) Non-occupant Loans on < 5 Family Dwellings (A B C & D)
Number
Average Value
Number
Average Value
Number
Average Value
Number
Average Value
Number
Average Value
LOANS ORIGINATED
18
$235,649
201
$211,557
312
$202,236
12
$46,217
27
$185,052
APPLICATIONS APPROVED, NOT ACCEPTED
2
$246,340
25
$223,563
55
$206,429
10
$36,707
2
$233,760
APPLICATIONS DENIED
3
$188,550
37
$215,089
79
$194,606
14
$34,364
5
$234,386
APPLICATIONS WITHDRAWN
4
$227,478
39
$245,330
61
$200,943
6
$51,517
3
$194,770
FILES CLOSED FOR INCOMPLETENESS
0
$0
17
$247,322
28
$219,282
0
$0
1
$338,340
Aggregated Statistics For Year 2001 (Based on 2 partial tracts)
A) FHA, FSA/RHS & VA Home Purchase Loans
B) Conventional Home Purchase Loans
C) Refinancings
D) Home Improvement Loans
E) Loans on Dwellings For 5+ Families
F) Non-occupant Loans on < 5 Family Dwellings (A B C & D)
Number
Average Value
Number
Average Value
Number
Average Value
Number
Average Value
Number
Average Value
Number
Average Value
LOANS ORIGINATED
21
$219,609
152
$196,054
265
$180,876
14
$37,664
1
$653,780
16
$175,479
APPLICATIONS APPROVED, NOT ACCEPTED
2
$185,635
27
$196,591
35
$157,704
4
$36,948
0
$0
3
$210,463
APPLICATIONS DENIED
2
$174,190
29
$183,710
79
$176,534
14
$37,841
0
$0
3
$203,147
APPLICATIONS WITHDRAWN
2
$288,265
43
$212,985
62
$167,267
4
$21,788
0
$0
3
$161,233
FILES CLOSED FOR INCOMPLETENESS
0
$0
7
$231,690
17
$171,577
1
$26,700
0
$0
0
$0
Aggregated Statistics For Year 2000 (Based on 2 partial tracts)
A) FHA, FSA/RHS & VA Home Purchase Loans
B) Conventional Home Purchase Loans
C) Refinancings
D) Home Improvement Loans
E) Loans on Dwellings For 5+ Families
F) Non-occupant Loans on < 5 Family Dwellings (A B C & D)
Number
Average Value
Number
Average Value
Number
Average Value
Number
Average Value
Number
Average Value
Number
Average Value
LOANS ORIGINATED
35
$183,761
111
$150,276
61
$126,044
16
$28,089
1
$515,620
9
$144,290
APPLICATIONS APPROVED, NOT ACCEPTED
3
$179,483
14
$178,889
13
$133,816
7
$28,949
0
$0
1
$139,490
APPLICATIONS DENIED
3
$147,327
16
$176,376
46
$120,230
9
$24,286
0
$0
3
$130,217
APPLICATIONS WITHDRAWN
3
$170,057
19
$175,152
28
$125,139
2
$41,515
0
$0
2
$128,425
FILES CLOSED FOR INCOMPLETENESS
1
$143,490
5
$174,144
17
$159,279
0
$0
0
$0
1
$73,240
Aggregated Statistics For Year 1999 (Based on 2 partial tracts)
A) FHA, FSA/RHS & VA Home Purchase Loans
B) Conventional Home Purchase Loans
C) Refinancings
D) Home Improvement Loans
E) Loans on Dwellings For 5+ Families
F) Non-occupant Loans on < 5 Family Dwellings (A B C & D)
#8 on the list of "Top 101 cities with the largest percentage of people in hospices or homes for chronically ill (population 1,000+)"
#66 on the list of "Top 101 cities with the largest percentage of people in hospitals/wards and hospices for chronically ill (population 1,000+)"
#10 on the list of "Top 101 counties with the largest increase in the number of infant deaths per 1000 residents 2000-2006 to 2007-2013 (pop. 50,000+)"
#15 on the list of "Top 101 counties with the lowest Sulfur Oxides Annual air pollution readings in 2012 (µg/m3)"
#17 on the list of "Top 101 counties with the highest Nitrogen Dioxide air pollution readings in 2012 (ppm)"
#31 on the list of "Top 101 counties with the highest percentage of residents that drank alcohol in the past 30 days"
#34 on the list of "Top 101 counties with the highest surface withdrawal of fresh water for public supply (pop. 50,000+)"
There are 2 pilots and no other airmen in this city.


 Recent articles from our blog. Our writers, many of them Ph.D. graduates or candidates, create easy-to-read articles on a wide variety of topics.

 , pop. 73,778).