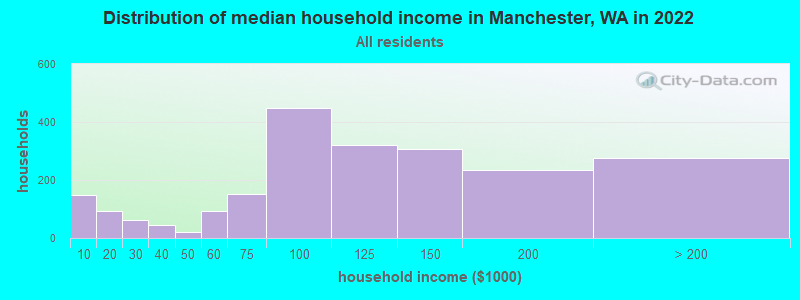
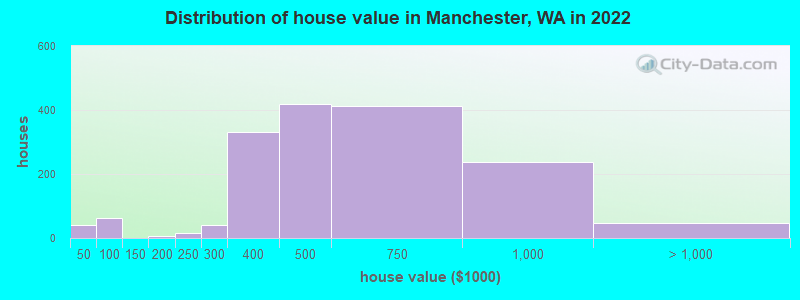
Estimated median house or condo value in 2022: $504,212 (it was $137,300 in 2000)
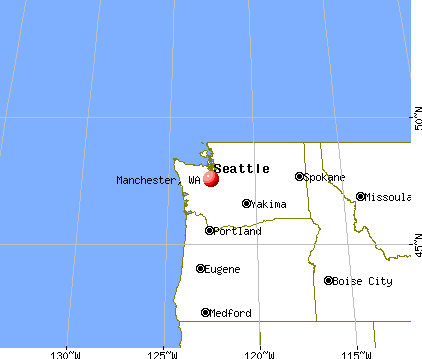
Manchester:
$504,212
WA:
$569,500
Mean prices in 2022:all housing units: $649,234; detached houses: $689,246; townhouses or other attached units: $490,921; in 2-unit structures: $615,215; in 3-to-4-unit structures: $532,551; in 5-or-more-unit structures: $413,149; mobile homes: $252,413; occupied boats, rvs, vans, etc.: $80,405
Median gross rent in 2022: $1,483.
March 2022 cost of living index in Manchester: 106.9 (more than average, U.S. average is 100)
Latest news from Manchester, WA collected exclusively by city-data.com from local newspapers, TV, and radio stations
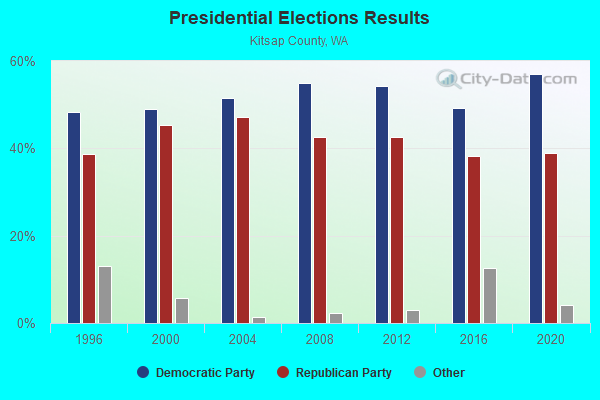
Ancestries: German (12.6%), American (10.7%), English (9.8%), Scottish (3.5%), Arab (3.4%), Norwegian (3.0%).
Current Local Time: PST time zone
Elevation: 40 feet
Land area: 2.93 square miles.
Population density: 1,849 people per square mile (low).
169 residents are foreign born (1.8% Asia, 0.3% Europe, 0.3% Latin America).
This place:
2.8%
Washington:
14.9%
Median real estate property taxes paid for housing units with mortgages in 2022: $3,460 (0.7%) Median real estate property taxes paid for housing units with no mortgage in 2022: $3,404 (0.7%)
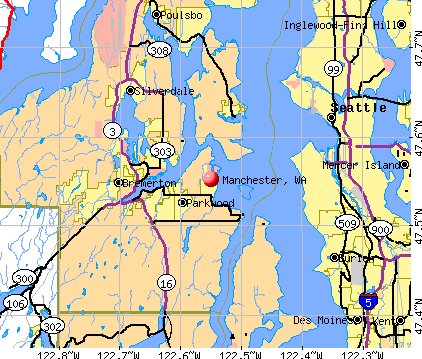
Nearest city with pop. 50,000+: Seattle, WA (11.3 miles , pop. 563,374).
Nearest city with pop. 1,000,000+: Los Angeles, CA (956.3 miles , pop. 3,694,820).
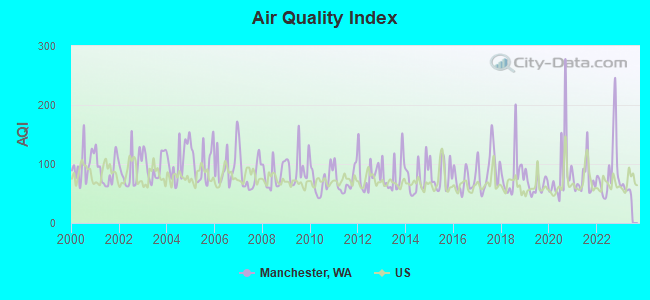
Air Quality Index (AQI) level in 2022 was 90.9. This is worse than average.
City:
90.9
U.S.:
72.6
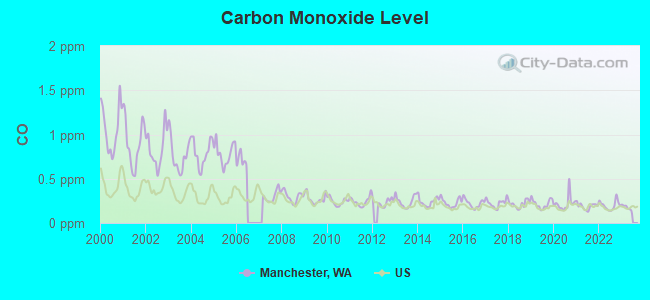
Carbon Monoxide (CO) [ppm] level in 2022 was 0.200. This is better than average.Closest monitor was 4.5 miles away from the city center.
City:
0.200
U.S.:
0.251
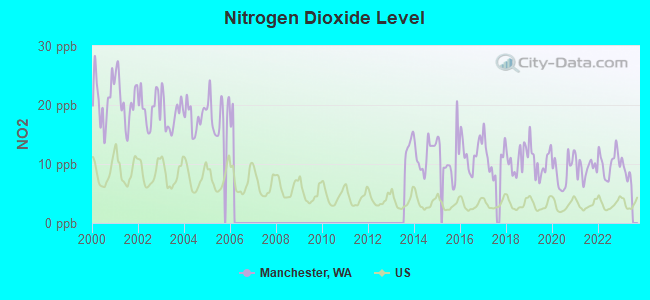
Nitrogen Dioxide (NO2) [ppb] level in 2022 was 10.2. This is significantly worse than average.Closest monitor was 10.6 miles away from the city center.
City:
10.2
U.S.:
5.1
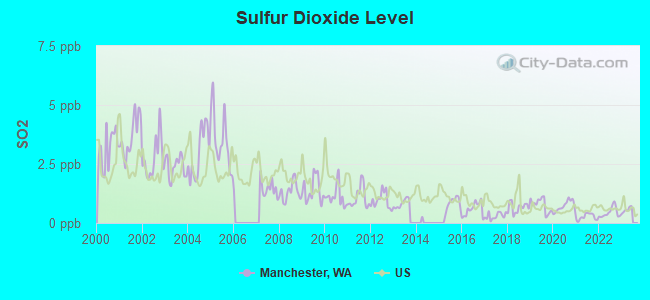
Sulfur Dioxide (SO2) [ppb] level in 2022 was 0.443. This is significantly better than average.Closest monitor was 3.6 miles away from the city center.
City:
0.443
U.S.:
1.515
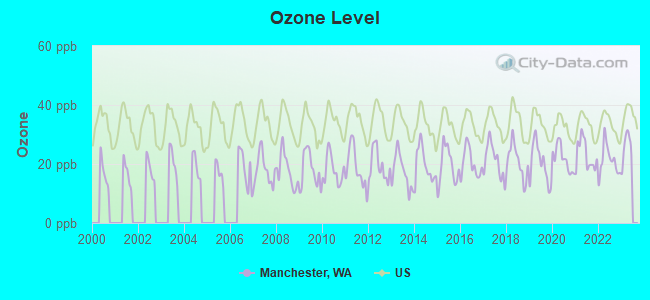
Ozone [ppb] level in 2022 was 21.1. This is significantly better than average.Closest monitor was 10.4 miles away from the city center.
City:
21.1
U.S.:
33.3
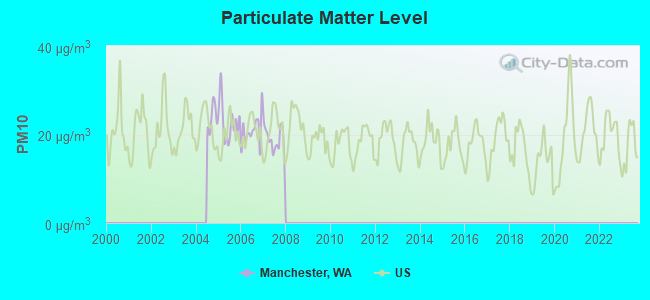
Particulate Matter (PM10) [µg/m3] level in 2007 was 18.9. This is about average.Closest monitor was 6.9 miles away from the city center.
City:
18.9
U.S.:
19.2
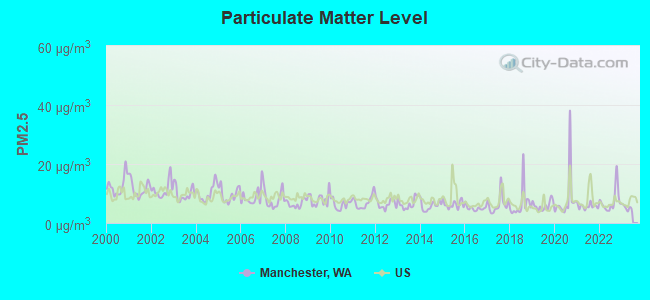
Particulate Matter (PM2.5) [µg/m3] level in 2022 was 7.45. This is about average.Closest monitor was 4.6 miles away from the city center.
City:
7.45
U.S.:
8.11
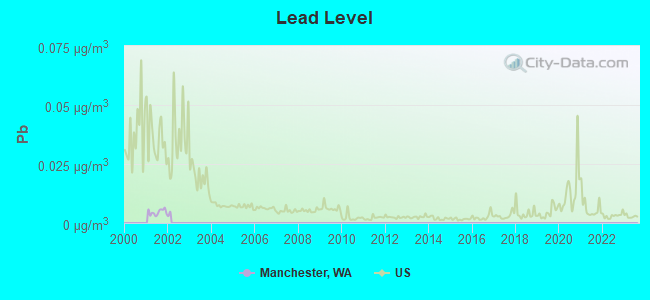
Lead (Pb) [µg/m3] level in 2001 was 0.00461. This is significantly better than average.Closest monitor was 9.4 miles away from the city center.
City:
0.00461
U.S.:
0.00931
Earthquake activity:
Manchester-area historical earthquake activity is significantly above Washington state average. It is 1298% greater than the overall U.S. average.
On 4/13/1949 at 19:55:42, a magnitude 7.0 (7.0 UK, Class: Major, Intensity: VIII - XII) earthquake occurred 21.0 miles away from Manchester center, causing $80,000,000 total damage On 2/28/2001 at 18:54:32, a magnitude 6.8 (6.8 MD, Depth: 32.2 mi, Class: Strong, Intensity: VII - IX) earthquake occurred 29.1 miles away from the city center On 2/28/2001 at 18:54:32, a magnitude 6.8 (6.5 MB, 6.6 MS, 6.8 MW) earthquake occurred 32.0 miles away from Manchester center, causing $2,000,000,000 total damage and $305,000,000 insured losses On 4/29/1965 at 15:28:43, a magnitude 6.6 (6.6 UK) earthquake occurred 19.2 miles away from the city center, causing $28,000,000 total damage On 7/3/1999 at 01:43:54, a magnitude 5.8 (5.4 MB, 5.5 MS, 5.8 MW, 5.3 ME, Depth: 25.2 mi, Class: Moderate, Intensity: VI - VII) earthquake occurred 46.8 miles away from the city center On 5/3/1996 at 04:04:22, a magnitude 5.5 (5.2 MB, 5.3 MD, 5.5 ML, Depth: 2.5 mi) earthquake occurred 42.3 miles away from the city center Magnitude types: body-wave magnitude (MB), duration magnitude (MD), energy magnitude (ME), local magnitude (ML), surface-wave magnitude (MS), moment magnitude (MW)
Natural disasters:
The number of natural disasters in Kitsap County (15) is near the US average (15). Major Disasters (Presidential) Declared: 14 Emergencies Declared: 1
Causes of natural disasters: Floods: 9, Storms: 9, Mudslides: 4, Landslides: 3, Earthquakes: 2, Hurricane: 1, Snow: 1, Volcanic Eruption: 1, Winter Storm: 1, Other: 1 (Note: some incidents may be assigned to more than one category).
Hospitals and medical centers near Manchester:
RESTHAVEN NURSING HOME (Nursing Home, about 3 miles away; BREMERTON, WA)
LONG LAKE MANOR (Nursing Home, about 4 miles away; PORT ORCHARD, WA)
HARRISON MEDICAL CENTER Acute Care Hospitals (about 5 miles away; BREMERTON, WA)
HARRISON HOME HEALTH (Home Health Center, about 5 miles away; BREMERTON, WA)
OLYMPIC PENINSULA KIDNEY CENTER (Dialysis Facility, about 5 miles away; BREMERTON, WA)
BREMERTON CONVALESCENT CENTER (Nursing Home, about 5 miles away; BREMERTON, WA)
BREMERTON HEALTH AND REHABILITATION CENTER (Nursing Home, about 5 miles away; BREMERTON, WA)
Amtrak stations near Manchester:
11 miles: SEATTLE (303 S. JACKSON ST.) . Services: ticket office, fully wheelchair accessible, enclosed waiting area, public restrooms, public payphones, vending machines, paid short-term parking, paid long-term parking, call for car rental service, taxi stand, intercity bus service, public transit connection.
20 miles: EDMONDS (211 RAILROAD AVE.) . Services: ticket office, fully wheelchair accessible, enclosed waiting area, public restrooms, public payphones, vending machines, paid short-term parking, paid long-term parking, call for taxi service, public transit connection.
Colleges/universities with over 2000 students nearest to Manchester:
Olympic College (about 5 miles; Bremerton, WA; Full-time enrollment: 6,158)
Seattle Community College-South Campus (about 10 miles; Seattle, WA; FT enrollment: 3,986)
Seattle Pacific University (about 12 miles; Seattle, WA; FT enrollment: 3,897)
Seattle University (about 12 miles; Seattle, WA; FT enrollment: 5,808)
Seattle Central College (about 12 miles; Seattle, WA; FT enrollment: 5,825)
University of Washington-Seattle Campus (about 14 miles; Seattle, WA; FT enrollment: 39,445)
Seattle Community College-North Campus (about 15 miles; Seattle, WA; FT enrollment: 4,220)
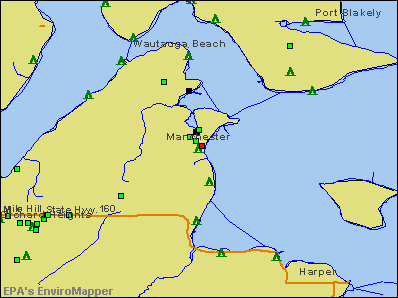
Notable locations in Manchester: Kitsap County Manchester Sewage Treatment Plant (A), Puget Sound Federal Fire Department Manchester Fire Department (B), Kitsap County Fire District 7 South Kitsap Fire and Rescue Station 9 Yukon Harbor (C), Manchester Library (D). Display/hide their locations on the map
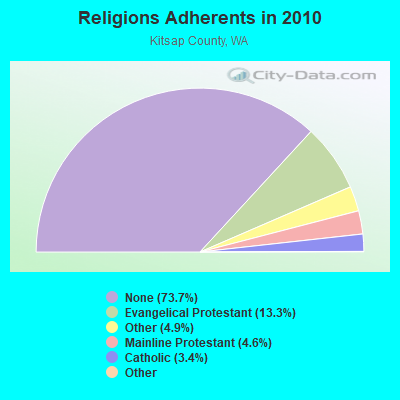
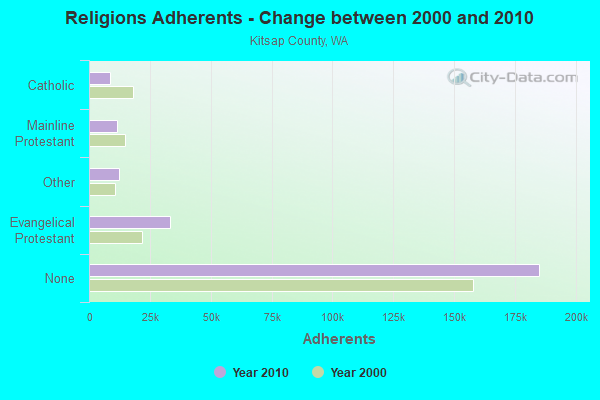
Religion statistics for Manchester, WA (based on Kitsap County data)
Religion
Adherents
Congregations
Evangelical Protestant
33,373
118
Other
12,378
42
Mainline Protestant
11,484
39
Catholic
8,572
5
Orthodox
140
2
Black Protestant
84
1
None
185,102
-
Source: Clifford Grammich, Kirk Hadaway, Richard Houseal, Dale E.Jones, Alexei Krindatch, Richie Stanley and Richard H.Taylor. 2012. 2010 U.S.Religion Census: Religious Congregations & Membership Study. Association of Statisticians of American Religious Bodies. Jones, Dale E., et al. 2002. Congregations and Membership in the United States 2000. Nashville, TN: Glenmary Research Center. Graphs represent county-level data
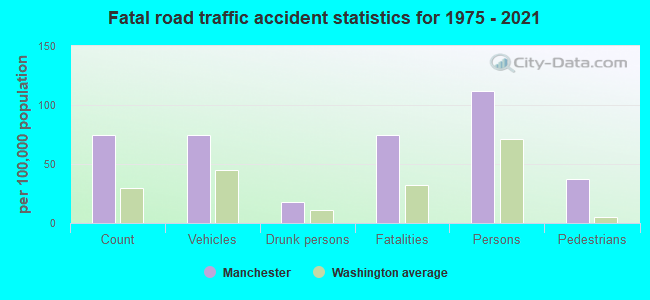
Manchester fatal accident statistics for 1975 - 2021
Manchester fatal accident list:
Mar 7, 2014 06:07 PM, Cr-Beach Dr E, Lat: 47.568956, Lon: -122.553983, Vehicles: 1, Persons: 1, Fatalities: 1, Drunk persons involved: 1
Dec 2, 2011 06:01 PM, Sr-160, Locker, Lat: 47.525122, Lon: -122.547975, Vehicles: 1, Persons: 2, Pedestrians: 1, Fatalities: 1
Sep 8, 2007 05:50 PM, Se Mile Hill Dr, Lat: 47.534039, Lon: -122.556869, Vehicles: 1, Persons: 2, Pedestrians: 1, Fatalities: 1
Nov 4, 2006 09:52 AM, E Chester Rd, Lat: 47.552220, Lon: -122.556520, Vehicles: 1, Persons: 1, Fatalities: 1
FCC Registered Broadcast Land Mobile Towers:
1
Blake Island (Lat: 47.541944 Lon: -122.483611), Type: Pole, Structure height: 15 m, Call Sign: KNIS348, Assigned Frequencies: 151.280 MHz, 151.295 MHz, Grant Date: 12/17/2020, Expiration Date: 02/15/2031, Registrant: Washington State Department Of Natural Resources, 815 88th Ave, Se, Tumwater, WA 98501, Phone: (360) 902-1478, Email:
Aircraft: PIPER PA-28RT-201T (Category: Land, Seats: 4, Weight: Up to 12,499 Pounds), Engine: CONT MOTOR TSIO-360 SER (225 HP) (Reciprocating) N-Number: 2106Z, N2106Z, N-2106Z, Serial Number: 28R-7931154, Year manufactured: 1979, Airworthiness Date: 09/10/1979, Certificate Issue Date: 06/05/2007 Registrant (Co-Owned): Dean W Schafer, Po Box 882, Manchester, WA 98353, Other Owners: Patricia L Schafer
Aircraft: FORSBERG DAN J DJ3 (Category: Land, Seats: 2, Weight: Up to 12,499 Pounds), Engine: CONT MOTOR C90 SERIES (95 HP) (Reciprocating) N-Number: 33253, N33253, N-33253, Serial Number: 001, Year manufactured: 2000, Airworthiness Date: 08/17/2000, Certificate Issue Date: 12/30/2019 Registrant (LLC): Yellowbird J-3 LLC, Po Box 365, Manchester, WA 98353
Home Mortgage Disclosure Act Aggregated Statistics For Year 2009 (Based on 1 partial tract)
A) FHA, FSA/RHS & VA Home Purchase Loans
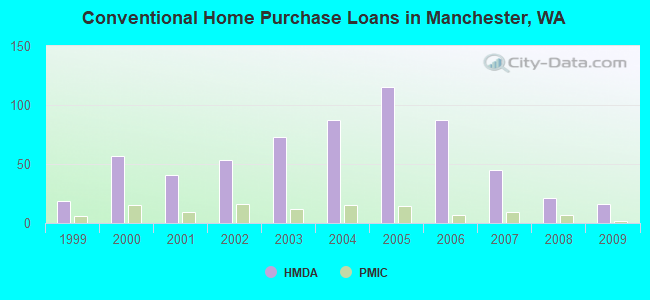
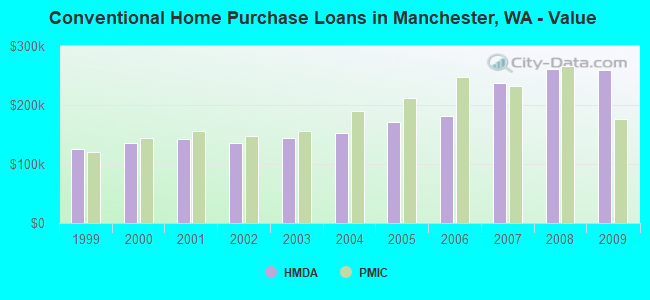
B) Conventional Home Purchase Loans
C) Refinancings
D) Home Improvement Loans
F) Non-occupant Loans on < 5 Family Dwellings (A B C & D)
G) Loans On Manufactured Home Dwelling (A B C & D)
Number
Average Value
Number
Average Value
Number
Average Value
Number
Average Value
Number
Average Value
Number
Average Value
LOANS ORIGINATED
33
$221,887
16
$259,054
130
$213,861
12
$96,779
9
$176,939
8
$140,695
APPLICATIONS APPROVED, NOT ACCEPTED
3
$168,093
1
$78,530
10
$275,434
1
$15,490
2
$141,030
1
$122,870
APPLICATIONS DENIED
4
$228,102
2
$227,300
44
$244,105
6
$278,140
6
$154,117
3
$145,123
APPLICATIONS WITHDRAWN
3
$200,503
2
$267,365
20
$275,166
1
$43,800
1
$275,650
1
$115,920
FILES CLOSED FOR INCOMPLETENESS
1
$126,070
1
$178,960
4
$232,510
1
$32,050
1
$178,960
0
$0
Aggregated Statistics For Year 2008 (Based on 1 partial tract)
A) FHA, FSA/RHS & VA Home Purchase Loans
B) Conventional Home Purchase Loans
C) Refinancings
D) Home Improvement Loans
F) Non-occupant Loans on < 5 Family Dwellings (A B C & D)
G) Loans On Manufactured Home Dwelling (A B C & D)
Number
Average Value
Number
Average Value
Number
Average Value
Number
Average Value
Number
Average Value
Number
Average Value
LOANS ORIGINATED
13
$232,048
21
$260,893
82
$224,651
10
$79,382
12
$217,953
4
$189,908
APPLICATIONS APPROVED, NOT ACCEPTED
0
$0
4
$286,465
13
$231,268
2
$68,110
2
$177,890
0
$0
APPLICATIONS DENIED
4
$199,390
4
$367,662
58
$232,092
14
$142,288
2
$157,590
4
$182,830
APPLICATIONS WITHDRAWN
4
$196,052
1
$384,620
25
$233,873
2
$128,210
2
$320,785
1
$85,470
FILES CLOSED FOR INCOMPLETENESS
1
$134,620
1
$507,490
6
$260,512
1
$27,240
1
$150,640
1
$80,130
Aggregated Statistics For Year 2007 (Based on 1 partial tract)
A) FHA, FSA/RHS & VA Home Purchase Loans
B) Conventional Home Purchase Loans
C) Refinancings
D) Home Improvement Loans
F) Non-occupant Loans on < 5 Family Dwellings (A B C & D)
G) Loans On Manufactured Home Dwelling (A B C & D)
Number
Average Value
Number
Average Value
Number
Average Value
Number
Average Value
Number
Average Value
Number
Average Value
LOANS ORIGINATED
9
$255,822
45
$237,470
113
$231,848
18
$94,346
16
$195,384
6
$133,015
APPLICATIONS APPROVED, NOT ACCEPTED
1
$316,250
7
$349,367
22
$225,578
2
$22,435
3
$250,717
1
$105,240
APPLICATIONS DENIED
3
$223,473
13
$208,297
67
$236,850
12
$96,022
5
$197,012
3
$85,117
APPLICATIONS WITHDRAWN
2
$205,400
5
$303,318
36
$215,713
4
$133,950
2
$138,625
1
$74,790
FILES CLOSED FOR INCOMPLETENESS
0
$0
1
$112,180
7
$253,059
1
$178,960
1
$112,180
0
$0
Aggregated Statistics For Year 2006 (Based on 1 partial tract)
A) FHA, FSA/RHS & VA Home Purchase Loans
B) Conventional Home Purchase Loans
C) Refinancings
D) Home Improvement Loans
F) Non-occupant Loans on < 5 Family Dwellings (A B C & D)
G) Loans On Manufactured Home Dwelling (A B C & D)
Number
Average Value
Number
Average Value
Number
Average Value
Number
Average Value
Number
Average Value
Number
Average Value
LOANS ORIGINATED
9
$223,949
87
$180,682
151
$194,562
21
$82,674
21
$177,710
7
$148,660
APPLICATIONS APPROVED, NOT ACCEPTED
1
$269,770
12
$223,874
27
$222,623
1
$83,870
5
$309,408
0
$0
APPLICATIONS DENIED
2
$182,695
22
$176,845
65
$181,694
11
$106,452
3
$150,467
9
$82,623
APPLICATIONS WITHDRAWN
0
$0
12
$154,651
45
$203,352
6
$146,193
2
$201,660
2
$128,740
FILES CLOSED FOR INCOMPLETENESS
1
$161,860
2
$163,465
7
$251,684
0
$0
0
$0
0
$0
Aggregated Statistics For Year 2005 (Based on 1 partial tract)
A) FHA, FSA/RHS & VA Home Purchase Loans
B) Conventional Home Purchase Loans
C) Refinancings
D) Home Improvement Loans
E) Loans on Dwellings For 5+ Families
F) Non-occupant Loans on < 5 Family Dwellings (A B C & D)
G) Loans On Manufactured Home Dwelling (A B C & D)
Number
Average Value
Number
Average Value
Number
Average Value
Number
Average Value
Number
Average Value
Number
Average Value
Number
Average Value
LOANS ORIGINATED
12
$213,902
115
$172,031
153
$161,168
19
$96,634
0
$0
30
$158,960
9
$98,056
APPLICATIONS APPROVED, NOT ACCEPTED
2
$192,845
14
$170,829
21
$180,407
2
$12,820
0
$0
4
$184,832
1
$71,050
APPLICATIONS DENIED
1
$125,540
17
$147,911
72
$164,719
17
$74,756
1
$175,220
3
$239,857
7
$111,800
APPLICATIONS WITHDRAWN
1
$168,270
17
$143,637
50
$159,106
9
$176,642
0
$0
4
$155,318
3
$82,623
FILES CLOSED FOR INCOMPLETENESS
0
$0
4
$156,922
19
$195,911
1
$93,480
0
$0
1
$108,440
2
$160,795
Aggregated Statistics For Year 2004 (Based on 1 partial tract)
A) FHA, FSA/RHS & VA Home Purchase Loans
B) Conventional Home Purchase Loans
C) Refinancings
D) Home Improvement Loans
F) Non-occupant Loans on < 5 Family Dwellings (A B C & D)
G) Loans On Manufactured Home Dwelling (A B C & D)
Number
Average Value
Number
Average Value
Number
Average Value
Number
Average Value
Number
Average Value
Number
Average Value
LOANS ORIGINATED
19
$163,943
87
$152,186
150
$141,421
10
$62,448
25
$133,101
13
$116,866
APPLICATIONS APPROVED, NOT ACCEPTED
3
$162,930
14
$155,986
29
$153,831
2
$13,890
4
$139,692
2
$120,460
APPLICATIONS DENIED
4
$159,458
14
$127,025
54
$134,806
12
$47,410
4
$122,732
6
$95,888
APPLICATIONS WITHDRAWN
2
$162,395
9
$137,408
45
$141,017
2
$27,510
2
$99,360
3
$102,923
FILES CLOSED FOR INCOMPLETENESS
0
$0
1
$215,820
17
$166,953
3
$79,773
1
$48,610
0
$0
Aggregated Statistics For Year 2003 (Based on 1 partial tract)
A) FHA, FSA/RHS & VA Home Purchase Loans
B) Conventional Home Purchase Loans
C) Refinancings
D) Home Improvement Loans
F) Non-occupant Loans on < 5 Family Dwellings (A B C & D)
Number
Average Value
Number
Average Value
Number
Average Value
Number
Average Value
Number
Average Value
LOANS ORIGINATED
29
$161,697
73
$144,900
289
$134,352
12
$47,944
32
$118,843
APPLICATIONS APPROVED, NOT ACCEPTED
3
$144,767
17
$141,909
38
$144,614
3
$20,477
7
$155,757
APPLICATIONS DENIED
2
$170,945
9
$154,740
56
$138,520
8
$32,920
3
$127,853
APPLICATIONS WITHDRAWN
3
$126,960
9
$171,893
72
$140,435
3
$47,723
5
$91,990
FILES CLOSED FOR INCOMPLETENESS
2
$174,950
1
$327,460
7
$131,566
1
$22,440
1
$53,950
Aggregated Statistics For Year 2002 (Based on 1 partial tract)
A) FHA, FSA/RHS & VA Home Purchase Loans
B) Conventional Home Purchase Loans
C) Refinancings
D) Home Improvement Loans
F) Non-occupant Loans on < 5 Family Dwellings (A B C & D)
Number
Average Value
Number
Average Value
Number
Average Value
Number
Average Value
Number
Average Value
LOANS ORIGINATED
29
$135,337
53
$136,191
166
$138,464
9
$17,807
15
$131,627
APPLICATIONS APPROVED, NOT ACCEPTED
1
$73,190
5
$144,876
20
$125,030
2
$15,490
2
$154,115
APPLICATIONS DENIED
3
$110,400
7
$114,777
46
$168,110
4
$21,768
3
$97,403
APPLICATIONS WITHDRAWN
5
$138,572
7
$76,620
40
$130,211
1
$1,070
1
$69,450
FILES CLOSED FOR INCOMPLETENESS
1
$49,150
1
$158,120
11
$210,377
1
$6,410
1
$37,930
Aggregated Statistics For Year 2001 (Based on 1 partial tract)
A) FHA, FSA/RHS & VA Home Purchase Loans
B) Conventional Home Purchase Loans
C) Refinancings
D) Home Improvement Loans
F) Non-occupant Loans on < 5 Family Dwellings (A B C & D)
Number
Average Value
Number
Average Value
Number
Average Value
Number
Average Value
Number
Average Value
LOANS ORIGINATED
29
$128,871
41
$142,084
133
$118,805
19
$24,039
11
$115,047
APPLICATIONS APPROVED, NOT ACCEPTED
2
$81,200
7
$134,466
13
$148,015
3
$13,533
1
$33,120
APPLICATIONS DENIED
3
$123,043
7
$115,769
49
$121,809
13
$14,547
1
$4,810
APPLICATIONS WITHDRAWN
2
$117,525
11
$105,043
31
$108,184
1
$29,380
2
$187,235
FILES CLOSED FOR INCOMPLETENESS
1
$105,770
2
$73,455
9
$109,154
1
$69,450
1
$201,930
Aggregated Statistics For Year 2000 (Based on 1 partial tract)
A) FHA, FSA/RHS & VA Home Purchase Loans
B) Conventional Home Purchase Loans
C) Refinancings
D) Home Improvement Loans
F) Non-occupant Loans on < 5 Family Dwellings (A B C & D)
Number
Average Value
Number
Average Value
Number
Average Value
Number
Average Value
Number
Average Value
LOANS ORIGINATED
17
$110,548
57
$134,853
36
$98,575
13
$16,560
8
$118,860
APPLICATIONS APPROVED, NOT ACCEPTED
2
$89,210
10
$117,577
10
$92,791
3
$21,547
1
$116,460
APPLICATIONS DENIED
3
$99,717
15
$94,589
26
$81,260
10
$13,836
1
$115,920
APPLICATIONS WITHDRAWN
3
$108,087
8
$114,252
11
$87,949
2
$16,025
2
$90,815
FILES CLOSED FOR INCOMPLETENESS
1
$89,210
2
$118,590
9
$121,144
0
$0
0
$0
Aggregated Statistics For Year 1999 (Based on 1 partial tract)
A) FHA, FSA/RHS & VA Home Purchase Loans
B) Conventional Home Purchase Loans
C) Refinancings
D) Home Improvement Loans
F) Non-occupant Loans on < 5 Family Dwellings (A B C & D)
#5 on the list of "Top 101 cities with largest percentage of females in occupations: fire fighting and prevention workers including supervisors (population 5,000+)"
#22 on the list of "Top 101 cities with the most people taking a ferryboat to work (population 5,000+)"
#93 on the list of "Top 101 cities with the highest percentage of English-only speaking households, population 5,000+"
#96 on the list of "Top 101 cities with largest percentage of males in occupations: installation, maintenance, and repair occupations (population 5,000+)"
#98 on the list of "Top 101 cities with largest percentage of males in industries: information (population 5,000+)"
#100 on the list of "Top 101 cities with largest percentage of females in industries: construction (population 5,000+)"
#17 on the list of "Top 101 counties with the lowest Particulate Matter (PM2.5) Annual air pollution readings in 2012 (µg/m3)"
#26 on the list of "Top 101 counties with the highest percentage of residents relocating from foreign countries between 2010 and 2011"
#36 on the list of "Top 101 counties with the highest average weight of females"
#38 on the list of "Top 101 counties with the highest percentage of residents relocating to foreign countries in 2011 (pop. 50,000+)"
#42 on the list of "Top 101 counties with the highest percentage of residents that exercised in the past month"


 Recent articles from our blog. Our writers, many of them Ph.D. graduates or candidates, create easy-to-read articles on a wide variety of topics.

 (11.3 miles