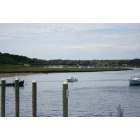
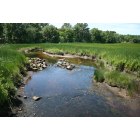
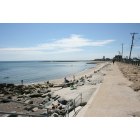
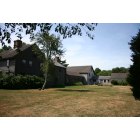
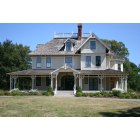
Marshfield, Massachusetts Submit your own pictures of this place and show them to the world
OSM Map
General Map
Google Map
MSN Map
OSM Map
General Map
Google Map
MSN Map
OSM Map
General Map
Google Map
MSN Map
OSM Map
General Map
Google Map
MSN Map
Please wait while loading the map...
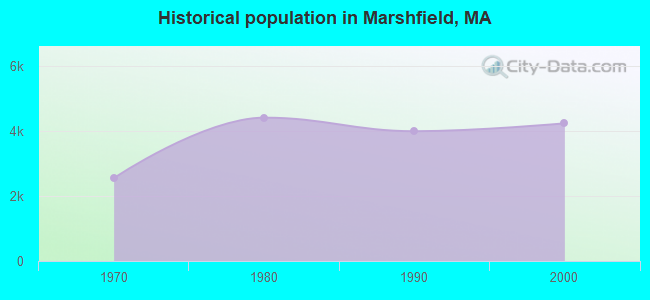
Population in 2010: 4,335. Population change since 2000: +2.1%Males: 2,191 Females: 2,144
March 2022 cost of living index in Marshfield: 134.8 (high, U.S. average is 100) Percentage of residents living in poverty in 2022: 17.5%
Profiles of local businesses
Business Search - 14 Million verified businesses
Data:
Median household income ($)
Median household income (% change since 2000)
Household income diversity
Ratio of average income to average house value (%)
Ratio of average income to average rent
Median household income ($) - White
Median household income ($) - Black or African American
Median household income ($) - Asian
Median household income ($) - Hispanic or Latino
Median household income ($) - American Indian and Alaska Native
Median household income ($) - Multirace
Median household income ($) - Other Race
Median household income for houses/condos with a mortgage ($)
Median household income for apartments without a mortgage ($)
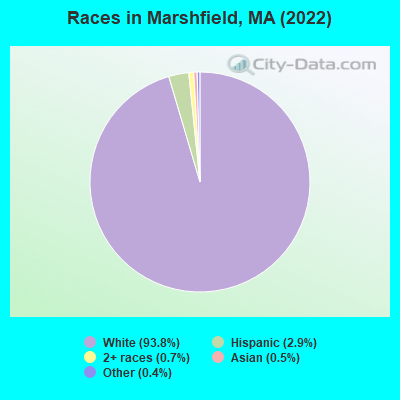
Races - White alone (%)
Races - White alone (% change since 2000)
Races - Black alone (%)
Races - Black alone (% change since 2000)
Races - American Indian alone (%)
Races - American Indian alone (% change since 2000)
Races - Asian alone (%)
Races - Asian alone (% change since 2000)
Races - Hispanic (%)
Races - Hispanic (% change since 2000)
Races - Native Hawaiian and Other Pacific Islander alone (%)
Races - Native Hawaiian and Other Pacific Islander alone (% change since 2000)
Races - Two or more races (%)
Races - Two or more races (% change since 2000)
Races - Other race alone (%)
Races - Other race alone (% change since 2000)
Racial diversity
Unemployment (%)
Unemployment (% change since 2000)
Unemployment (%) - White
Unemployment (%) - Black or African American
Unemployment (%) - Asian
Unemployment (%) - Hispanic or Latino
Unemployment (%) - American Indian and Alaska Native
Unemployment (%) - Multirace
Unemployment (%) - Other Race
Population density (people per square mile)
Population - Males (%)
Population - Females (%)
Population - Males (%) - White
Population - Males (%) - Black or African American
Population - Males (%) - Asian
Population - Males (%) - Hispanic or Latino
Population - Males (%) - American Indian and Alaska Native
Population - Males (%) - Multirace
Population - Males (%) - Other Race
Population - Females (%) - White
Population - Females (%) - Black or African American
Population - Females (%) - Asian
Population - Females (%) - Hispanic or Latino
Population - Females (%) - American Indian and Alaska Native
Population - Females (%) - Multirace
Population - Females (%) - Other Race
Coronavirus confirmed cases (May 20, 2024)
Deaths caused by coronavirus (May 20, 2024)
Coronavirus confirmed cases (per 100k population) (May 20, 2024)
Deaths caused by coronavirus (per 100k population) (May 20, 2024)
Daily increase in number of cases (May 20, 2024)
Weekly increase in number of cases (May 20, 2024)
Cases doubled (in days) (May 20, 2024)
Hospitalized patients (Apr 18, 2022)
Negative test results (Apr 18, 2022)
Total test results (Apr 18, 2022)
COVID Vaccine doses distributed (per 100k population) (Sep 19, 2023)
COVID Vaccine doses administered (per 100k population) (Sep 19, 2023)
COVID Vaccine doses distributed (Sep 19, 2023)
COVID Vaccine doses administered (Sep 19, 2023)
Likely homosexual households (%)
Likely homosexual households (% change since 2000)
Likely homosexual households - Lesbian couples (%)
Likely homosexual households - Lesbian couples (% change since 2000)
Likely homosexual households - Gay men (%)
Likely homosexual households - Gay men (% change since 2000)
Cost of living index
Median gross rent ($)
Median contract rent ($)
Median monthly housing costs ($)
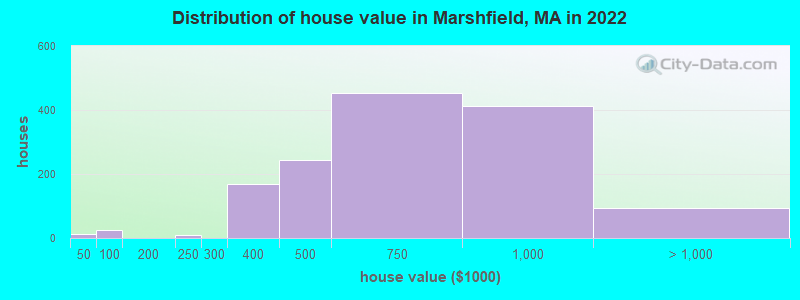
Median house or condo value ($)
Median house or condo value ($ change since 2000)
Mean house or condo value by units in structure - 1, detached ($)
Mean house or condo value by units in structure - 1, attached ($)
Mean house or condo value by units in structure - 2 ($)
Mean house or condo value by units in structure by units in structure - 3 or 4 ($)
Mean house or condo value by units in structure - 5 or more ($)
Mean house or condo value by units in structure - Boat, RV, van, etc. ($)
Mean house or condo value by units in structure - Mobile home ($)
Median house or condo value ($) - White
Median house or condo value ($) - Black or African American
Median house or condo value ($) - Asian
Median house or condo value ($) - Hispanic or Latino
Median house or condo value ($) - American Indian and Alaska Native
Median house or condo value ($) - Multirace
Median house or condo value ($) - Other Race
Median resident age
Resident age diversity
Median resident age - Males
Median resident age - Females
Median resident age - White
Median resident age - Black or African American
Median resident age - Asian
Median resident age - Hispanic or Latino
Median resident age - American Indian and Alaska Native
Median resident age - Multirace
Median resident age - Other Race
Median resident age - Males - White
Median resident age - Males - Black or African American
Median resident age - Males - Asian
Median resident age - Males - Hispanic or Latino
Median resident age - Males - American Indian and Alaska Native
Median resident age - Males - Multirace
Median resident age - Males - Other Race
Median resident age - Females - White
Median resident age - Females - Black or African American
Median resident age - Females - Asian
Median resident age - Females - Hispanic or Latino
Median resident age - Females - American Indian and Alaska Native
Median resident age - Females - Multirace
Median resident age - Females - Other Race
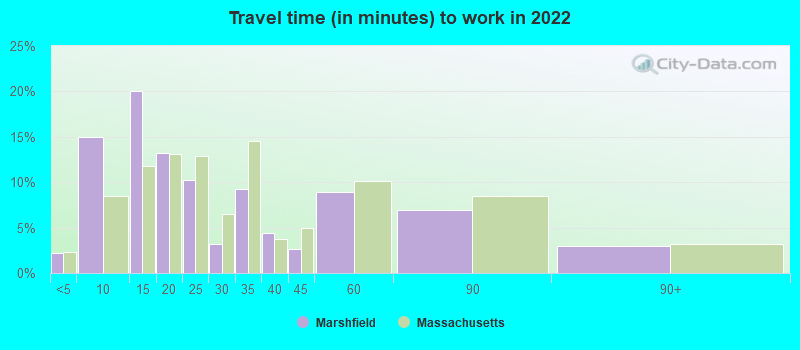
Commute - mean travel time to work (minutes)
Travel time to work - Less than 5 minutes (%)
Travel time to work - Less than 5 minutes (% change since 2000)
Travel time to work - 5 to 9 minutes (%)
Travel time to work - 5 to 9 minutes (% change since 2000)
Travel time to work - 10 to 19 minutes (%)
Travel time to work - 10 to 19 minutes (% change since 2000)
Travel time to work - 20 to 29 minutes (%)
Travel time to work - 20 to 29 minutes (% change since 2000)
Travel time to work - 30 to 39 minutes (%)
Travel time to work - 30 to 39 minutes (% change since 2000)
Travel time to work - 40 to 59 minutes (%)
Travel time to work - 40 to 59 minutes (% change since 2000)
Travel time to work - 60 to 89 minutes (%)
Travel time to work - 60 to 89 minutes (% change since 2000)
Travel time to work - 90 or more minutes (%)
Travel time to work - 90 or more minutes (% change since 2000)
Marital status - Never married (%)
Marital status - Now married (%)
Marital status - Separated (%)
Marital status - Widowed (%)
Marital status - Divorced (%)
Median family income ($)
Median family income (% change since 2000)
Median non-family income ($)
Median non-family income (% change since 2000)
Median per capita income ($)
Median per capita income (% change since 2000)
Median family income ($) - White
Median family income ($) - Black or African American
Median family income ($) - Asian
Median family income ($) - Hispanic or Latino
Median family income ($) - American Indian and Alaska Native
Median family income ($) - Multirace
Median family income ($) - Other Race
Median year house/condo built
Median year apartment built
Year house built - Built 2005 or later (%)
Year house built - Built 2000 to 2004 (%)
Year house built - Built 1990 to 1999 (%)
Year house built - Built 1980 to 1989 (%)
Year house built - Built 1970 to 1979 (%)
Year house built - Built 1960 to 1969 (%)
Year house built - Built 1950 to 1959 (%)
Year house built - Built 1940 to 1949 (%)
Year house built - Built 1939 or earlier (%)
Average household size
Household density (households per square mile)
Average household size - White
Average household size - Black or African American
Average household size - Asian
Average household size - Hispanic or Latino
Average household size - American Indian and Alaska Native
Average household size - Multirace
Average household size - Other Race
Occupied housing units (%)
Vacant housing units (%)
Owner occupied housing units (%)
Renter occupied housing units (%)
Vacancy status - For rent (%)
Vacancy status - For sale only (%)
Vacancy status - Rented or sold, not occupied (%)
Vacancy status - For seasonal, recreational, or occasional use (%)
Vacancy status - For migrant workers (%)
Vacancy status - Other vacant (%)
Residents with income below the poverty level (%)
Residents with income below 50% of the poverty level (%)
Children below poverty level (%)
Poor families by family type - Married-couple family (%)
Poor families by family type - Male, no wife present (%)
Poor families by family type - Female, no husband present (%)
Poverty status for native-born residents (%)
Poverty status for foreign-born residents (%)
Poverty among high school graduates not in families (%)
Poverty among people who did not graduate high school not in families (%)
Residents with income below the poverty level (%) - White
Residents with income below the poverty level (%) - Black or African American
Residents with income below the poverty level (%) - Asian
Residents with income below the poverty level (%) - Hispanic or Latino
Residents with income below the poverty level (%) - American Indian and Alaska Native
Residents with income below the poverty level (%) - Multirace
Residents with income below the poverty level (%) - Other Race
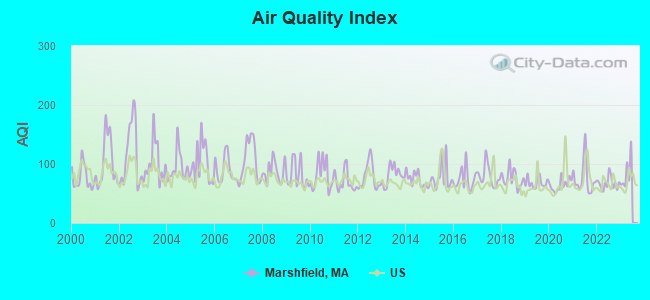
Air pollution - Air Quality Index (AQI)
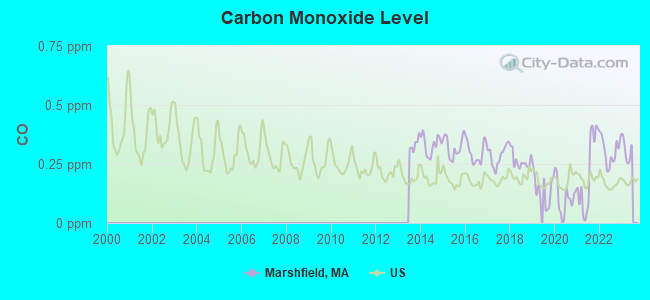
Air pollution - CO
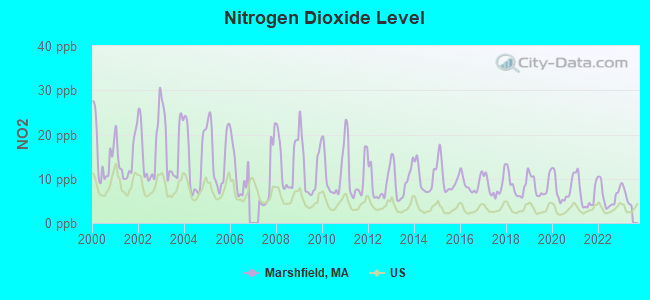
Air pollution - NO2
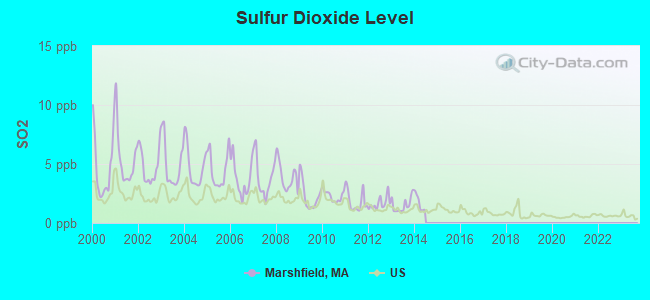
Air pollution - SO2
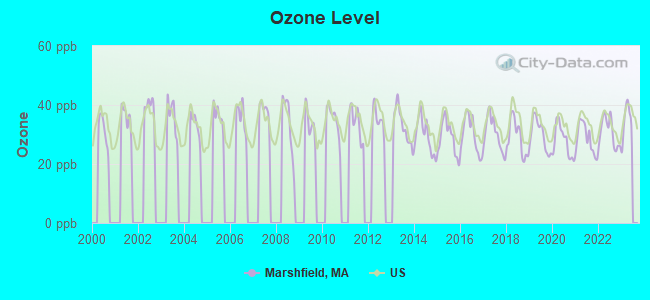
Air pollution - Ozone
Air pollution - PM10
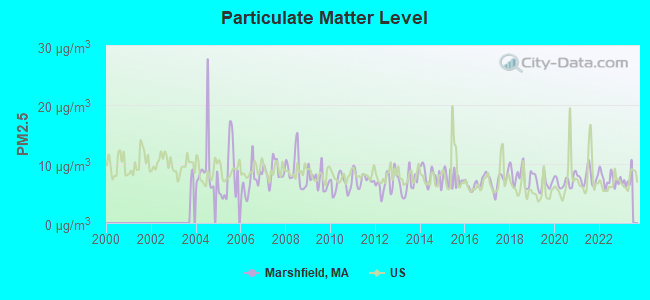
Air pollution - PM25
Air pollution - Pb
Crime - Murders per 100,000 population
Crime - Rapes per 100,000 population
Crime - Robberies per 100,000 population
Crime - Assaults per 100,000 population
Crime - Burglaries per 100,000 population
Crime - Thefts per 100,000 population
Crime - Auto thefts per 100,000 population
Crime - Arson per 100,000 population
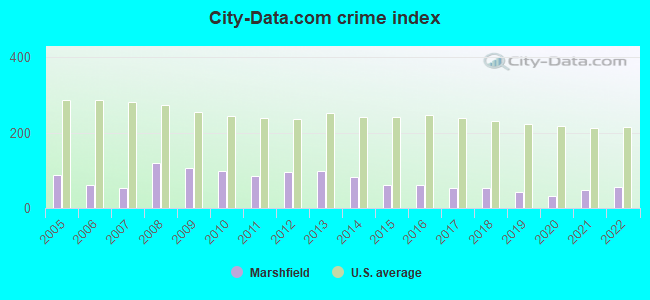
Crime - City-data.com crime index
Crime - Violent crime index
Crime - Property crime index
Crime - Murders per 100,000 population (5 year average)
Crime - Rapes per 100,000 population (5 year average)
Crime - Robberies per 100,000 population (5 year average)
Crime - Assaults per 100,000 population (5 year average)
Crime - Burglaries per 100,000 population (5 year average)
Crime - Thefts per 100,000 population (5 year average)
Crime - Auto thefts per 100,000 population (5 year average)
Crime - Arson per 100,000 population (5 year average)
Crime - City-data.com crime index (5 year average)
Crime - Violent crime index (5 year average)
Crime - Property crime index (5 year average)
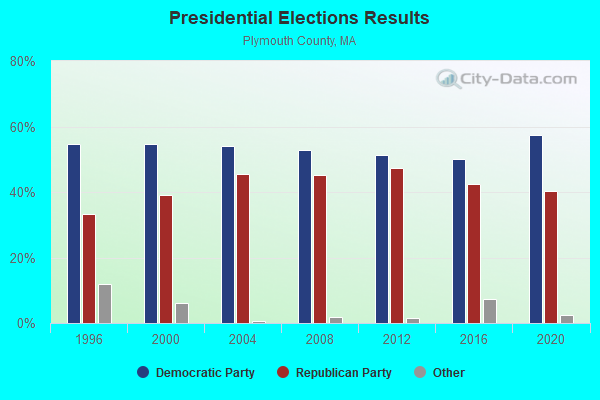
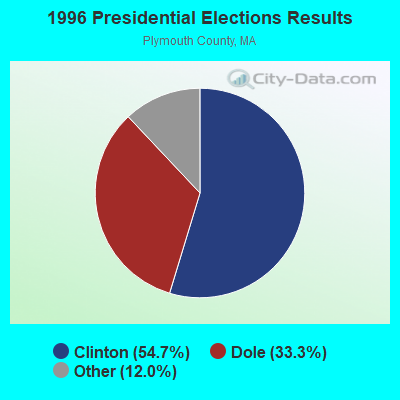
1996 Presidential Elections Results (%) - Democratic Party (Clinton)
1996 Presidential Elections Results (%) - Republican Party (Dole)
1996 Presidential Elections Results (%) - Other
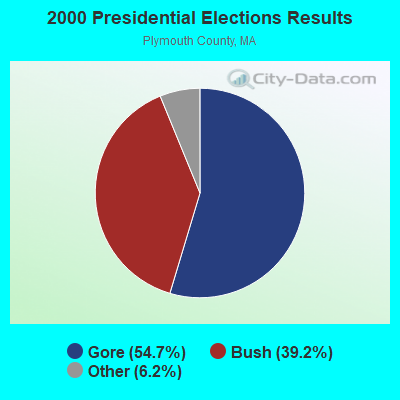
2000 Presidential Elections Results (%) - Democratic Party (Gore)
2000 Presidential Elections Results (%) - Republican Party (Bush)
2000 Presidential Elections Results (%) - Other
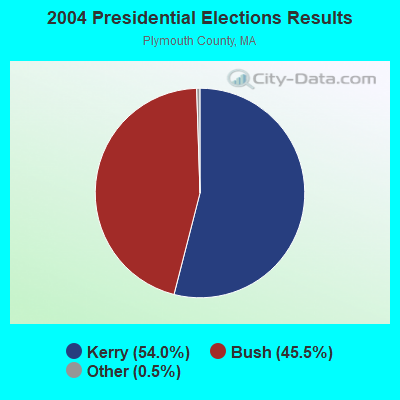
2004 Presidential Elections Results (%) - Democratic Party (Kerry)
2004 Presidential Elections Results (%) - Republican Party (Bush)
2004 Presidential Elections Results (%) - Other
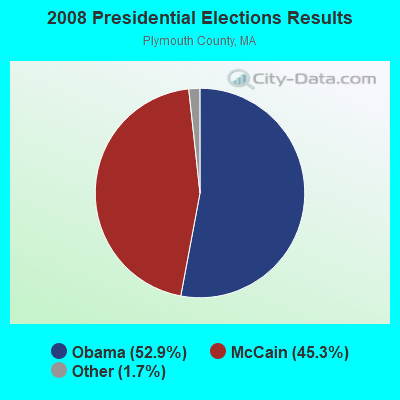
2008 Presidential Elections Results (%) - Democratic Party (Obama)
2008 Presidential Elections Results (%) - Republican Party (McCain)
2008 Presidential Elections Results (%) - Other
2012 Presidential Elections Results (%) - Democratic Party (Obama)
2012 Presidential Elections Results (%) - Republican Party (Romney)
2012 Presidential Elections Results (%) - Other
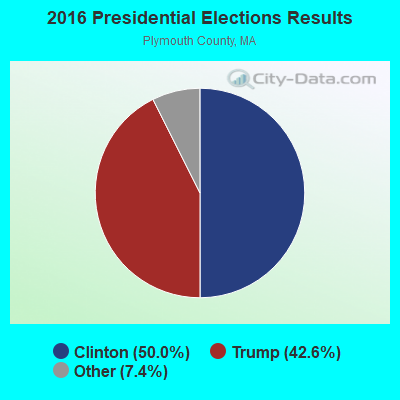
2016 Presidential Elections Results (%) - Democratic Party (Clinton)
2016 Presidential Elections Results (%) - Republican Party (Trump)
2016 Presidential Elections Results (%) - Other
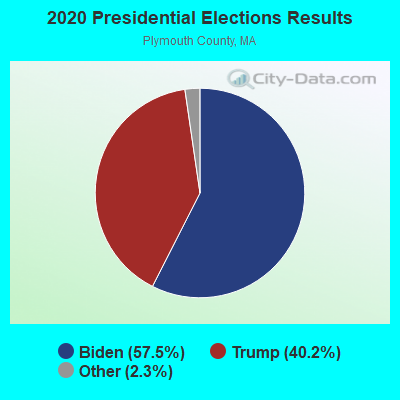
2020 Presidential Elections Results (%) - Democratic Party (Biden)
2020 Presidential Elections Results (%) - Republican Party (Trump)
2020 Presidential Elections Results (%) - Other
Ancestries Reported - Arab (%)
Ancestries Reported - Czech (%)
Ancestries Reported - Danish (%)
Ancestries Reported - Dutch (%)
Ancestries Reported - English (%)
Ancestries Reported - French (%)
Ancestries Reported - French Canadian (%)
Ancestries Reported - German (%)
Ancestries Reported - Greek (%)
Ancestries Reported - Hungarian (%)
Ancestries Reported - Irish (%)
Ancestries Reported - Italian (%)
Ancestries Reported - Lithuanian (%)
Ancestries Reported - Norwegian (%)
Ancestries Reported - Polish (%)
Ancestries Reported - Portuguese (%)
Ancestries Reported - Russian (%)
Ancestries Reported - Scotch-Irish (%)
Ancestries Reported - Scottish (%)
Ancestries Reported - Slovak (%)
Ancestries Reported - Subsaharan African (%)
Ancestries Reported - Swedish (%)
Ancestries Reported - Swiss (%)
Ancestries Reported - Ukrainian (%)
Ancestries Reported - United States (%)
Ancestries Reported - Welsh (%)
Ancestries Reported - West Indian (%)
Ancestries Reported - Other (%)
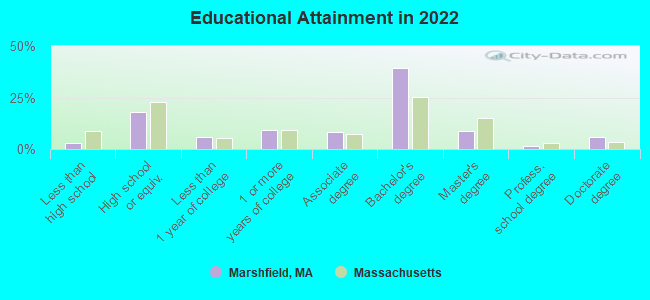
Educational Attainment - No schooling completed (%)
Educational Attainment - Less than high school (%)
Educational Attainment - High school or equivalent (%)
Educational Attainment - Less than 1 year of college (%)
Educational Attainment - 1 or more years of college (%)
Educational Attainment - Associate degree (%)
Educational Attainment - Bachelor's degree (%)
Educational Attainment - Master's degree (%)
Educational Attainment - Professional school degree (%)
Educational Attainment - Doctorate degree (%)
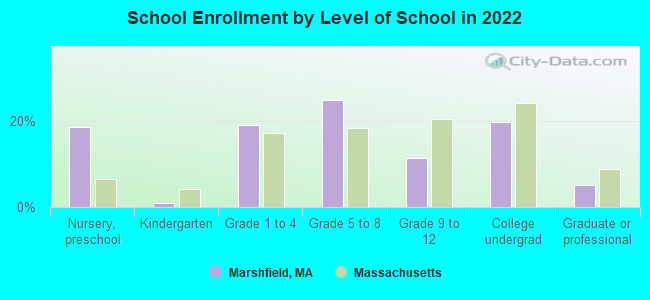
School Enrollment - Nursery, preschool (%)
School Enrollment - Kindergarten (%)
School Enrollment - Grade 1 to 4 (%)
School Enrollment - Grade 5 to 8 (%)
School Enrollment - Grade 9 to 12 (%)
School Enrollment - College undergrad (%)
School Enrollment - Graduate or professional (%)
School Enrollment - Not enrolled in school (%)
School enrollment - Public schools (%)
School enrollment - Private schools (%)
School enrollment - Not enrolled (%)
Median number of rooms in houses and condos
Median number of rooms in apartments
Housing units lacking complete plumbing facilities (%)
Housing units lacking complete kitchen facilities (%)
Density of houses
Urban houses (%)
Rural houses (%)
Households with people 60 years and over (%)
Households with people 65 years and over (%)
Households with people 75 years and over (%)
Households with one or more nonrelatives (%)
Households with no nonrelatives (%)
Population in households (%)
Family households (%)
Nonfamily households (%)
Population in families (%)
Family households with own children (%)
Median number of bedrooms in owner occupied houses
Mean number of bedrooms in owner occupied houses
Median number of bedrooms in renter occupied houses
Mean number of bedrooms in renter occupied houses
Median number of vehichles in owner occupied houses
Mean number of vehichles in owner occupied houses
Median number of vehichles in renter occupied houses
Mean number of vehichles in renter occupied houses
Mortgage status - with mortgage (%)
Mortgage status - with second mortgage (%)
Mortgage status - with home equity loan (%)
Mortgage status - with both second mortgage and home equity loan (%)
Mortgage status - without a mortgage (%)
Average family size
Average family size - White
Average family size - Black or African American
Average family size - Asian
Average family size - Hispanic or Latino
Average family size - American Indian and Alaska Native
Average family size - Multirace
Average family size - Other Race
Geographical mobility - Same house 1 year ago (%)
Geographical mobility - Moved within same county (%)
Geographical mobility - Moved from different county within same state (%)
Geographical mobility - Moved from different state (%)
Geographical mobility - Moved from abroad (%)
Place of birth - Born in state of residence (%)
Place of birth - Born in other state (%)
Place of birth - Native, outside of US (%)
Place of birth - Foreign born (%)
Housing units in structures - 1, detached (%)
Housing units in structures - 1, attached (%)
Housing units in structures - 2 (%)
Housing units in structures - 3 or 4 (%)
Housing units in structures - 5 to 9 (%)
Housing units in structures - 10 to 19 (%)
Housing units in structures - 20 to 49 (%)
Housing units in structures - 50 or more (%)
Housing units in structures - Mobile home (%)
Housing units in structures - Boat, RV, van, etc. (%)
House/condo owner moved in on average (years ago)
Renter moved in on average (years ago)
Year householder moved into unit - Moved in 1999 to March 2000 (%)
Year householder moved into unit - Moved in 1995 to 1998 (%)
Year householder moved into unit - Moved in 1990 to 1994 (%)
Year householder moved into unit - Moved in 1980 to 1989 (%)
Year householder moved into unit - Moved in 1970 to 1979 (%)
Year householder moved into unit - Moved in 1969 or earlier (%)
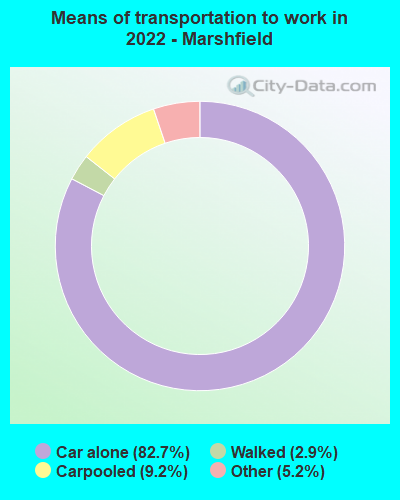
Means of transportation to work - Drove car alone (%)
Means of transportation to work - Carpooled (%)
Means of transportation to work - Public transportation (%)
Means of transportation to work - Bus or trolley bus (%)
Means of transportation to work - Streetcar or trolley car (%)
Means of transportation to work - Subway or elevated (%)
Means of transportation to work - Railroad (%)
Means of transportation to work - Ferryboat (%)
Means of transportation to work - Taxicab (%)
Means of transportation to work - Motorcycle (%)
Means of transportation to work - Bicycle (%)
Means of transportation to work - Walked (%)
Means of transportation to work - Other means (%)
Working at home (%)
Industry diversity
Most Common Industries - Agriculture, forestry, fishing and hunting, and mining (%)
Most Common Industries - Agriculture, forestry, fishing and hunting (%)
Most Common Industries - Mining, quarrying, and oil and gas extraction (%)
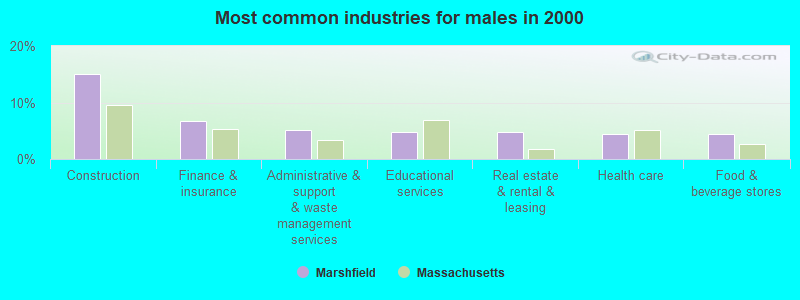
Most Common Industries - Construction (%)
Most Common Industries - Manufacturing (%)
Most Common Industries - Wholesale trade (%)
Most Common Industries - Retail trade (%)
Most Common Industries - Transportation and warehousing, and utilities (%)
Most Common Industries - Transportation and warehousing (%)
Most Common Industries - Utilities (%)
Most Common Industries - Information (%)
Most Common Industries - Finance and insurance, and real estate and rental and leasing (%)
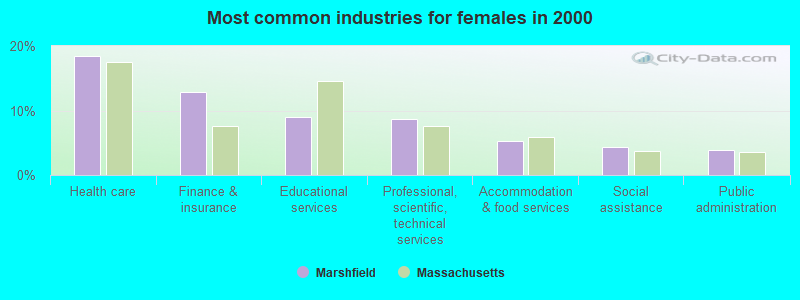
Most Common Industries - Finance and insurance (%)
Most Common Industries - Real estate and rental and leasing (%)
Most Common Industries - Professional, scientific, and management, and administrative and waste management services (%)
Most Common Industries - Professional, scientific, and technical services (%)
Most Common Industries - Management of companies and enterprises (%)
Most Common Industries - Administrative and support and waste management services (%)
Most Common Industries - Educational services, and health care and social assistance (%)
Most Common Industries - Educational services (%)
Most Common Industries - Health care and social assistance (%)
Most Common Industries - Arts, entertainment, and recreation, and accommodation and food services (%)
Most Common Industries - Arts, entertainment, and recreation (%)
Most Common Industries - Accommodation and food services (%)
Most Common Industries - Other services, except public administration (%)
Most Common Industries - Public administration (%)
Occupation diversity
Most Common Occupations - Management, business, science, and arts occupations (%)
Most Common Occupations - Management, business, and financial occupations (%)
Most Common Occupations - Management occupations (%)
Most Common Occupations - Business and financial operations occupations (%)
Most Common Occupations - Computer, engineering, and science occupations (%)
Most Common Occupations - Computer and mathematical occupations (%)
Most Common Occupations - Architecture and engineering occupations (%)
Most Common Occupations - Life, physical, and social science occupations (%)
Most Common Occupations - Education, legal, community service, arts, and media occupations (%)
Most Common Occupations - Community and social service occupations (%)
Most Common Occupations - Legal occupations (%)
Most Common Occupations - Education, training, and library occupations (%)
Most Common Occupations - Arts, design, entertainment, sports, and media occupations (%)
Most Common Occupations - Healthcare practitioners and technical occupations (%)
Most Common Occupations - Health diagnosing and treating practitioners and other technical occupations (%)
Most Common Occupations - Health technologists and technicians (%)
Most Common Occupations - Service occupations (%)
Most Common Occupations - Healthcare support occupations (%)
Most Common Occupations - Protective service occupations (%)
Most Common Occupations - Fire fighting and prevention, and other protective service workers including supervisors (%)
Most Common Occupations - Law enforcement workers including supervisors (%)
Most Common Occupations - Food preparation and serving related occupations (%)
Most Common Occupations - Building and grounds cleaning and maintenance occupations (%)
Most Common Occupations - Personal care and service occupations (%)
Most Common Occupations - Sales and office occupations (%)
Most Common Occupations - Sales and related occupations (%)
Most Common Occupations - Office and administrative support occupations (%)
Most Common Occupations - Natural resources, construction, and maintenance occupations (%)
Most Common Occupations - Farming, fishing, and forestry occupations (%)
Most Common Occupations - Construction and extraction occupations (%)
Most Common Occupations - Installation, maintenance, and repair occupations (%)
Most Common Occupations - Production, transportation, and material moving occupations (%)
Most Common Occupations - Production occupations (%)
Most Common Occupations - Transportation occupations (%)
Most Common Occupations - Material moving occupations (%)
People in Group quarters - Institutionalized population (%)
People in Group quarters - Correctional institutions (%)
People in Group quarters - Federal prisons and detention centers (%)
People in Group quarters - Halfway houses (%)
People in Group quarters - Local jails and other confinement facilities (including police lockups) (%)
People in Group quarters - Military disciplinary barracks (%)
People in Group quarters - State prisons (%)
People in Group quarters - Other types of correctional institutions (%)
People in Group quarters - Nursing homes (%)
People in Group quarters - Hospitals/wards, hospices, and schools for the handicapped (%)
People in Group quarters - Hospitals/wards and hospices for chronically ill (%)
People in Group quarters - Hospices or homes for chronically ill (%)
People in Group quarters - Military hospitals or wards for chronically ill (%)
People in Group quarters - Other hospitals or wards for chronically ill (%)
People in Group quarters - Hospitals or wards for drug/alcohol abuse (%)
People in Group quarters - Mental (Psychiatric) hospitals or wards (%)
People in Group quarters - Schools, hospitals, or wards for the mentally retarded (%)
People in Group quarters - Schools, hospitals, or wards for the physically handicapped (%)
People in Group quarters - Institutions for the deaf (%)
People in Group quarters - Institutions for the blind (%)
People in Group quarters - Orthopedic wards and institutions for the physically handicapped (%)
People in Group quarters - Wards in general hospitals for patients who have no usual home elsewhere (%)
People in Group quarters - Wards in military hospitals for patients who have no usual home elsewhere (%)
People in Group quarters - Juvenile institutions (%)
People in Group quarters - Long-term care (%)
People in Group quarters - Homes for abused, dependent, and neglected children (%)
People in Group quarters - Residential treatment centers for emotionally disturbed children (%)
People in Group quarters - Training schools for juvenile delinquents (%)
People in Group quarters - Short-term care, detention or diagnostic centers for delinquent children (%)
People in Group quarters - Type of juvenile institution unknown (%)
People in Group quarters - Noninstitutionalized population (%)
People in Group quarters - College dormitories (includes college quarters off campus) (%)
People in Group quarters - Military quarters (%)
People in Group quarters - On base (%)
People in Group quarters - Barracks, unaccompanied personnel housing (UPH), (Enlisted/Officer), ;and similar group living quarters for military personnel (%)
People in Group quarters - Transient quarters for temporary residents (%)
People in Group quarters - Military ships (%)
People in Group quarters - Group homes (%)
People in Group quarters - Homes or halfway houses for drug/alcohol abuse (%)
People in Group quarters - Homes for the mentally ill (%)
People in Group quarters - Homes for the mentally retarded (%)
People in Group quarters - Homes for the physically handicapped (%)
People in Group quarters - Other group homes (%)
People in Group quarters - Religious group quarters (%)
People in Group quarters - Dormitories (%)
People in Group quarters - Agriculture workers' dormitories on farms (%)
People in Group quarters - Job Corps and vocational training facilities (%)
People in Group quarters - Other workers' dormitories (%)
People in Group quarters - Crews of maritime vessels (%)
People in Group quarters - Other nonhousehold living situations (%)
People in Group quarters - Other noninstitutional group quarters (%)
Residents speaking English at home (%)
Residents speaking English at home - Born in the United States (%)
Residents speaking English at home - Native, born elsewhere (%)
Residents speaking English at home - Foreign born (%)
Residents speaking Spanish at home (%)
Residents speaking Spanish at home - Born in the United States (%)
Residents speaking Spanish at home - Native, born elsewhere (%)
Residents speaking Spanish at home - Foreign born (%)
Residents speaking other language at home (%)
Residents speaking other language at home - Born in the United States (%)
Residents speaking other language at home - Native, born elsewhere (%)
Residents speaking other language at home - Foreign born (%)
Class of Workers - Employee of private company (%)
Class of Workers - Self-employed in own incorporated business (%)
Class of Workers - Private not-for-profit wage and salary workers (%)
Class of Workers - Local government workers (%)
Class of Workers - State government workers (%)
Class of Workers - Federal government workers (%)
Class of Workers - Self-employed workers in own not incorporated business and Unpaid family workers (%)
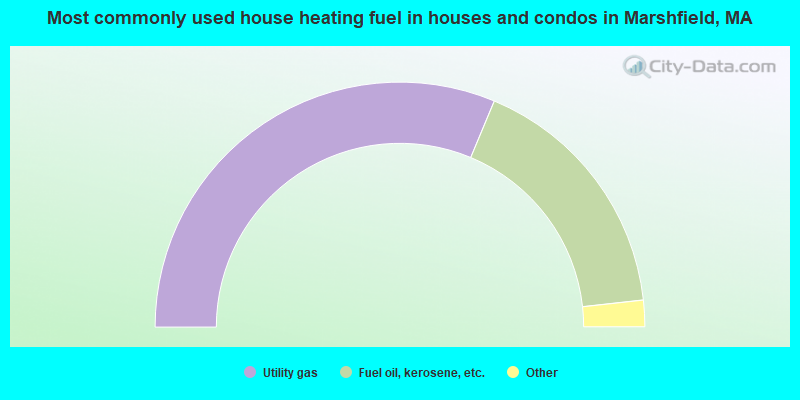
House heating fuel used in houses and condos - Utility gas (%)
House heating fuel used in houses and condos - Bottled, tank, or LP gas (%)
House heating fuel used in houses and condos - Electricity (%)
House heating fuel used in houses and condos - Fuel oil, kerosene, etc. (%)
House heating fuel used in houses and condos - Coal or coke (%)
House heating fuel used in houses and condos - Wood (%)
House heating fuel used in houses and condos - Solar energy (%)
House heating fuel used in houses and condos - Other fuel (%)
House heating fuel used in houses and condos - No fuel used (%)
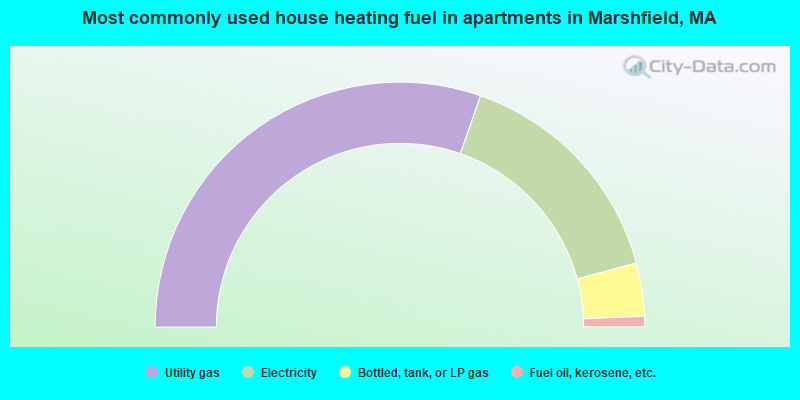
House heating fuel used in apartments - Utility gas (%)
House heating fuel used in apartments - Bottled, tank, or LP gas (%)
House heating fuel used in apartments - Electricity (%)
House heating fuel used in apartments - Fuel oil, kerosene, etc. (%)
House heating fuel used in apartments - Coal or coke (%)
House heating fuel used in apartments - Wood (%)
House heating fuel used in apartments - Solar energy (%)
House heating fuel used in apartments - Other fuel (%)
House heating fuel used in apartments - No fuel used (%)
Armed forces status - In Armed Forces (%)
Armed forces status - Civilian (%)
Armed forces status - Civilian - Veteran (%)
Armed forces status - Civilian - Nonveteran (%)
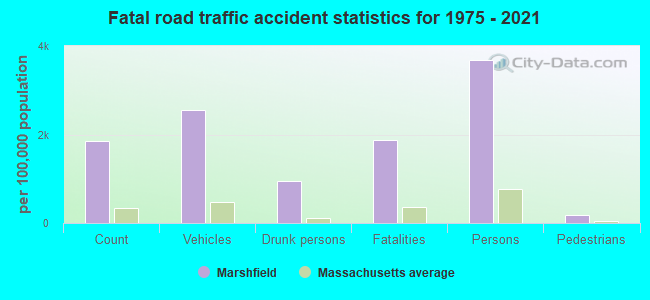
Fatal accidents locations in years 2005-2021
Fatal accidents locations in 2005
Fatal accidents locations in 2006
Fatal accidents locations in 2007
Fatal accidents locations in 2008
Fatal accidents locations in 2009
Fatal accidents locations in 2010
Fatal accidents locations in 2011
Fatal accidents locations in 2012
Fatal accidents locations in 2013
Fatal accidents locations in 2014
Fatal accidents locations in 2015
Fatal accidents locations in 2016
Fatal accidents locations in 2017
Fatal accidents locations in 2018
Fatal accidents locations in 2019
Fatal accidents locations in 2020
Fatal accidents locations in 2021
Alcohol use - People drinking some alcohol every month (%)
Alcohol use - People not drinking at all (%)
Alcohol use - Average days/month drinking alcohol
Alcohol use - Average drinks/week
Alcohol use - Average days/year people drink much
Audiometry - Average condition of hearing (%)
Audiometry - People that can hear a whisper from across a quiet room (%)
Audiometry - People that can hear normal voice from across a quiet room (%)
Audiometry - Ears ringing, roaring, buzzing (%)
Audiometry - Had a job exposure to loud noise (%)
Audiometry - Had off-work exposure to loud noise (%)
Blood Pressure & Cholesterol - Has high blood pressure (%)
Blood Pressure & Cholesterol - Checking blood pressure at home (%)
Blood Pressure & Cholesterol - Frequently checking blood cholesterol (%)
Blood Pressure & Cholesterol - Has high cholesterol level (%)
Consumer Behavior - Money monthly spent on food at supermarket/grocery store
Consumer Behavior - Money monthly spent on food at other stores
Consumer Behavior - Money monthly spent on eating out
Consumer Behavior - Money monthly spent on carryout/delivered foods
Consumer Behavior - Income spent on food at supermarket/grocery store (%)
Consumer Behavior - Income spent on food at other stores (%)
Consumer Behavior - Income spent on eating out (%)
Consumer Behavior - Income spent on carryout/delivered foods (%)
Current Health Status - General health condition (%)
Current Health Status - Blood donors (%)
Current Health Status - Has blood ever tested for HIV virus (%)
Current Health Status - Left-handed people (%)
Dermatology - People using sunscreen (%)
Diabetes - Diabetics (%)
Diabetes - Had a blood test for high blood sugar (%)
Diabetes - People taking insulin (%)
Diet Behavior & Nutrition - Diet health (%)
Diet Behavior & Nutrition - Milk product consumption (# of products/month)
Diet Behavior & Nutrition - Meals not home prepared (#/week)
Diet Behavior & Nutrition - Meals from fast food or pizza place (#/week)
Diet Behavior & Nutrition - Ready-to-eat foods (#/month)
Diet Behavior & Nutrition - Frozen meals/pizza (#/month)
Drug Use - People that ever used marijuana or hashish (%)
Drug Use - Ever used hard drugs (%)
Drug Use - Ever used any form of cocaine (%)
Drug Use - Ever used heroin (%)
Drug Use - Ever used methamphetamine (%)
Health Insurance - People covered by health insurance (%)
Kidney Conditions-Urology - Avg. # of times urinating at night
Medical Conditions - People with asthma (%)
Medical Conditions - People with anemia (%)
Medical Conditions - People with psoriasis (%)
Medical Conditions - People with overweight (%)
Medical Conditions - Elderly people having difficulties in thinking or remembering (%)
Medical Conditions - People who ever received blood transfusion (%)
Medical Conditions - People having trouble seeing even with glass/contacts (%)
Medical Conditions - People with arthritis (%)
Medical Conditions - People with gout (%)
Medical Conditions - People with congestive heart failure (%)
Medical Conditions - People with coronary heart disease (%)
Medical Conditions - People with angina pectoris (%)
Medical Conditions - People who ever had heart attack (%)
Medical Conditions - People who ever had stroke (%)
Medical Conditions - People with emphysema (%)
Medical Conditions - People with thyroid problem (%)
Medical Conditions - People with chronic bronchitis (%)
Medical Conditions - People with any liver condition (%)
Medical Conditions - People who ever had cancer or malignancy (%)
Mental Health - People who have little interest in doing things (%)
Mental Health - People feeling down, depressed, or hopeless (%)
Mental Health - People who have trouble sleeping or sleeping too much (%)
Mental Health - People feeling tired or having little energy (%)
Mental Health - People with poor appetite or overeating (%)
Mental Health - People feeling bad about themself (%)
Mental Health - People who have trouble concentrating on things (%)
Mental Health - People moving or speaking slowly or too fast (%)
Mental Health - People having thoughts they would be better off dead (%)
Oral Health - Average years since last visit a dentist
Oral Health - People embarrassed because of mouth (%)
Oral Health - People with gum disease (%)
Oral Health - General health of teeth and gums (%)
Oral Health - Average days a week using dental floss/device
Oral Health - Average days a week using mouthwash for dental problem
Oral Health - Average number of teeth
Pesticide Use - Households using pesticides to control insects (%)
Pesticide Use - Households using pesticides to kill weeds (%)
Physical Activity - People doing vigorous-intensity work activities (%)
Physical Activity - People doing moderate-intensity work activities (%)
Physical Activity - People walking or bicycling (%)
Physical Activity - People doing vigorous-intensity recreational activities (%)
Physical Activity - People doing moderate-intensity recreational activities (%)
Physical Activity - Average hours a day doing sedentary activities
Physical Activity - Average hours a day watching TV or videos
Physical Activity - Average hours a day using computer
Physical Functioning - People having limitations keeping them from working (%)
Physical Functioning - People limited in amount of work they can do (%)
Physical Functioning - People that need special equipment to walk (%)
Physical Functioning - People experiencing confusion/memory problems (%)
Physical Functioning - People requiring special healthcare equipment (%)
Prescription Medications - Average number of prescription medicines taking
Preventive Aspirin Use - Adults 40+ taking low-dose aspirin (%)
Reproductive Health - Vaginal deliveries (%)
Reproductive Health - Cesarean deliveries (%)
Reproductive Health - Deliveries resulted in a live birth (%)
Reproductive Health - Pregnancies resulted in a delivery (%)
Reproductive Health - Women breastfeeding newborns (%)
Reproductive Health - Women that had a hysterectomy (%)
Reproductive Health - Women that had both ovaries removed (%)
Reproductive Health - Women that have ever taken birth control pills (%)
Reproductive Health - Women taking birth control pills (%)
Reproductive Health - Women that have ever used Depo-Provera or injectables (%)
Reproductive Health - Women that have ever used female hormones (%)
Sexual Behavior - People 18+ that ever had sex (vaginal, anal, or oral) (%)
Sexual Behavior - Males 18+ that ever had vaginal sex with a woman (%)
Sexual Behavior - Males 18+ that ever performed oral sex on a woman (%)
Sexual Behavior - Males 18+ that ever had anal sex with a woman (%)
Sexual Behavior - Males 18+ that ever had any sex with a man (%)
Sexual Behavior - Females 18+ that ever had vaginal sex with a man (%)
Sexual Behavior - Females 18+ that ever performed oral sex on a man (%)
Sexual Behavior - Females 18+ that ever had anal sex with a man (%)
Sexual Behavior - Females 18+ that ever had any kind of sex with a woman (%)
Sexual Behavior - Average age people first had sex
Sexual Behavior - Average number of female sex partners in lifetime (males 18+)
Sexual Behavior - Average number of female vaginal sex partners in lifetime (males 18+)
Sexual Behavior - Average age people first performed oral sex on a woman (18+)
Sexual Behavior - Average number of woman performed oral sex on in lifetime (18+)
Sexual Behavior - Average number of male sex partners in lifetime (males 18+)
Sexual Behavior - Average number of male anal sex partners in lifetime (males 18+)
Sexual Behavior - Average age people first performed oral sex on a man (18+)
Sexual Behavior - Average number of male oral sex partners in lifetime (18+)
Sexual Behavior - People using protection when performing oral sex (%)
Sexual Behavior - Average number of times people have vaginal or anal sex a year
Sexual Behavior - People having sex without condom (%)
Sexual Behavior - Average number of male sex partners in lifetime (females 18+)
Sexual Behavior - Average number of male vaginal sex partners in lifetime (females 18+)
Sexual Behavior - Average number of female sex partners in lifetime (females 18+)
Sexual Behavior - Circumcised males 18+ (%)
Sleep Disorders - Average hours sleeping at night
Sleep Disorders - People that has trouble sleeping (%)
Smoking-Cigarette Use - People smoking cigarettes (%)
Taste & Smell - People 40+ having problems with smell (%)
Taste & Smell - People 40+ having problems with taste (%)
Taste & Smell - People 40+ that ever had wisdom teeth removed (%)
Taste & Smell - People 40+ that ever had tonsils teeth removed (%)
Taste & Smell - People 40+ that ever had a loss of consciousness because of a head injury (%)
Taste & Smell - People 40+ that ever had a broken nose or other serious injury to face or skull (%)
Taste & Smell - People 40+ that ever had two or more sinus infections (%)
Weight - Average height (inches)
Weight - Average weight (pounds)
Weight - Average BMI
Weight - People that are obese (%)
Weight - People that ever were obese (%)
Weight - People trying to lose weight (%)
Officers per 1,000 residents here:
1.55Massachusetts average:
2.59
Latest news from Marshfield, MA collected exclusively by city-data.com from local newspapers, TV, and radio stations
Marshfield, MA City Guides: Ancestries: Irish (39.2%), American (15.6%), Italian (15.0%), English (9.6%), Dutch (2.9%), Scotch-Irish (1.9%).
Current Local Time:
Land area: 5.09 square miles.
Population density: 852 people per square mile (low).
186 residents are foreign born (2.3% Europe , 0.8% Latin America , 0.5% Asia ).
This place:
3.8%Massachusetts:
17.6%
Median real estate property taxes paid for housing units with mortgages in 2022: $6,476 (0.9%)Median real estate property taxes paid for housing units with no mortgage in 2022: $5,771 (1.0%)
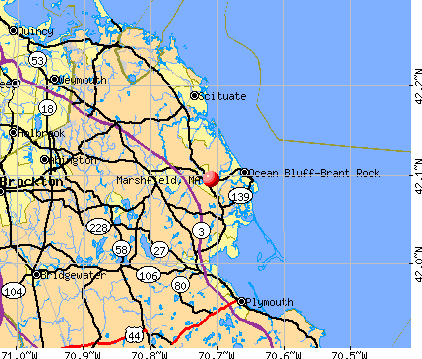
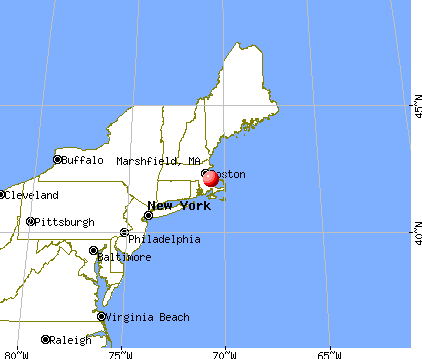
Nearest city with pop. 50,000+: Weymouth, MA
Nearest city with pop. 200,000+: Boston, MA
Nearest city with pop. 1,000,000+: Bronx, NY
Nearest cities:
Latitude: 42.09 N, Longitude: 70.71 W
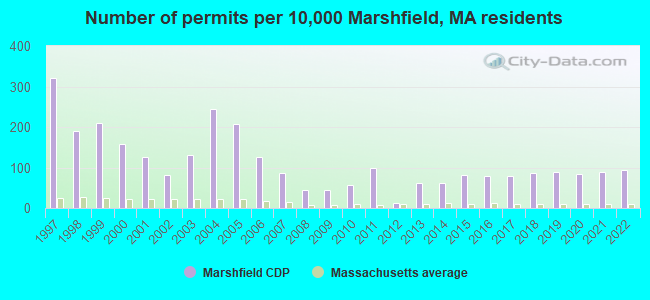
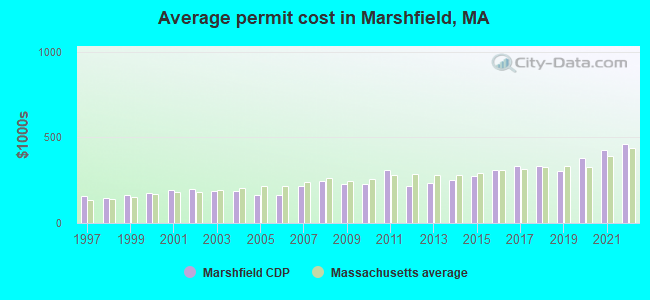
Single-family new house construction building permits:
2022: 40 buildings , average cost: $460,0002021: 38 buildings , average cost: $428,8002020: 36 buildings , average cost: $377,9002019: 38 buildings , average cost: $304,5002018: 37 buildings , average cost: $332,8002017: 33 buildings , average cost: $333,8002016: 34 buildings , average cost: $309,8002015: 35 buildings , average cost: $275,7002014: 26 buildings , average cost: $248,5002013: 26 buildings , average cost: $230,5002012: 5 buildings , average cost: $213,5002011: 42 buildings , average cost: $307,1002010: 24 buildings , average cost: $227,7002009: 19 buildings , average cost: $226,4002008: 19 buildings , average cost: $246,0002007: 37 buildings , average cost: $218,3002006: 53 buildings , average cost: $162,7002005: 88 buildings , average cost: $161,5002004: 104 buildings , average cost: $185,9002003: 55 buildings , average cost: $184,8002002: 35 buildings , average cost: $200,7002001: 53 buildings , average cost: $194,6002000: 67 buildings , average cost: $174,6001999: 89 buildings , average cost: $161,9001998: 81 buildings , average cost: $149,4001997: 136 buildings , average cost: $154,700Unemployment in December 2023: Here:
3.6%Massachusetts:
3.5%
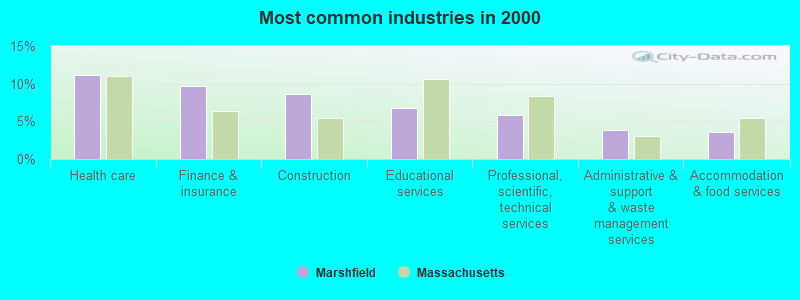
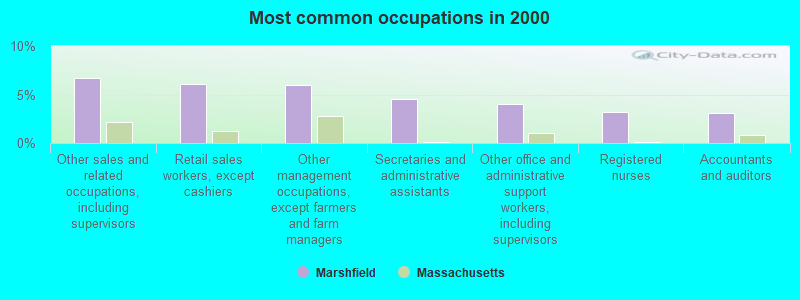
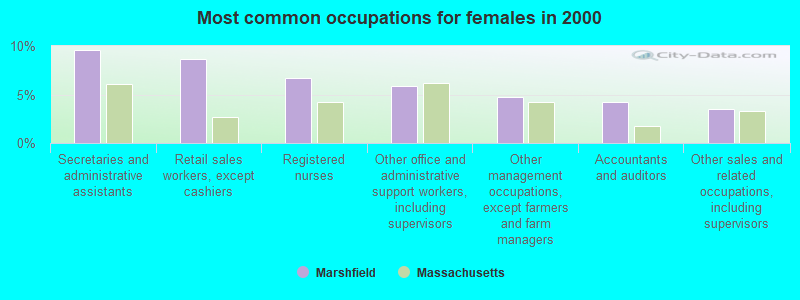
Most common occupations in Marshfield, MA (%)
Both Males Females
Other sales and related occupations, including supervisors (6.7%)
Retail sales workers, except cashiers (6.1%)
Other management occupations, except farmers and farm managers (6.0%)
Secretaries and administrative assistants (4.6%)
Other office and administrative support workers, including supervisors (4.0%)
Registered nurses (3.2%)
Accountants and auditors (3.1%)
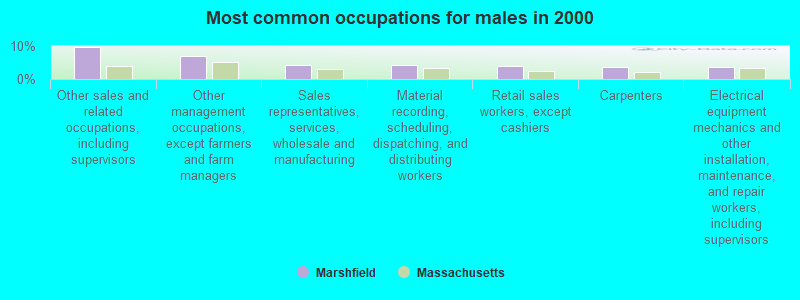
Other sales and related occupations, including supervisors (9.7%)
Other management occupations, except farmers and farm managers (7.1%)
Sales representatives, services, wholesale and manufacturing (4.2%)
Material recording, scheduling, dispatching, and distributing workers (4.2%)
Retail sales workers, except cashiers (3.8%)
Carpenters (3.7%)
Electrical equipment mechanics and other installation, maintenance, and repair workers, including supervisors (3.6%)
Secretaries and administrative assistants (9.6%)
Retail sales workers, except cashiers (8.7%)
Registered nurses (6.7%)
Other office and administrative support workers, including supervisors (5.9%)
Other management occupations, except farmers and farm managers (4.7%)
Accountants and auditors (4.2%)
Other sales and related occupations, including supervisors (3.6%)
Tornado activity:
Marshfield-area historical tornado activity is below Massachusetts state average. It is 65% smaller than the overall U.S. average.
On 6/9/1953, a category F4 (max. wind speeds 207-260 mph) tornado 43.9 miles away from the Marshfield place center killed 90 people and injured 1228 people and caused between $50,000,000 and $500,000,000 in damages.
On 6/9/1953, a category F3 (max. wind speeds 158-206 mph) tornado 25.4 miles away from the place center injured 17 people and caused between $500,000 and $5,000,000 in damages.
Earthquake activity:
Marshfield-area historical earthquake activity is significantly above Massachusetts state average. It is 75% smaller than the overall U.S. average. On 10/7/1983 at 10:18:46, a magnitude 5.3 (5.1 MB, 5.3 LG, 5.1 ML, Class: Moderate, Intensity: VI - VII) earthquake occurred 224.2 miles away from Marshfield center On 4/20/2002 at 10:50:47, a magnitude 5.3 (5.3 ML, Depth: 3.0 mi) earthquake occurred 224.9 miles away from Marshfield center On 10/16/2012 at 23:12:25, a magnitude 4.7 (4.7 ML, Depth: 10.0 mi, Class: Light, Intensity: IV - V) earthquake occurred 104.0 miles away from Marshfield center On 1/19/1982 at 00:14:42, a magnitude 4.7 (4.5 MB, 4.7 MD, 4.5 LG) earthquake occurred 107.2 miles away from Marshfield center On 4/20/2002 at 10:50:47, a magnitude 5.2 (5.2 MB, 4.2 MS, 5.2 MW, 5.0 MW) earthquake occurred 224.3 miles away from the city center On 8/22/1992 at 12:20:32, a magnitude 4.8 (4.8 MB, 3.8 MS, 4.7 LG, Depth: 6.2 mi) earthquake occurred 207.7 miles away from Marshfield center Magnitude types: regional Lg-wave magnitude (LG), body-wave magnitude (MB), duration magnitude (MD), local magnitude (ML), surface-wave magnitude (MS), moment magnitude (MW) Natural disasters: The number of natural disasters in Plymouth County (26) is a lot greater than the US average (15).Major Disasters (Presidential) Declared: 17Emergencies Declared: 9Floods: 11, Storms: 9, Hurricanes: 7, Snows: 3, Snowstorms: 3, Blizzards: 2, Winter Storms: 2, Heavy Rain: 1, Snowfall: 1, Tropical Storm: 1, Wind: 1 (Note: some incidents may be assigned to more than one category). Hospitals and medical centers in Marshfield: NIGHTINGALE HOME HEALTHCARE OF MASSACHUSETTS INC (1020 PLAIN STREET, SUITE 106)
Other hospitals and medical centers near Marshfield: PEMBROKE HOSPITAL (Hospital, about 3 miles away; PEMBROKE, MA)
BAY PATH AT DUXBURY NURSING AND REHABILITATION CTR (Nursing Home, about 5 miles away; DUXBURY, MA)
STETSON MANOR NURSING HOME (Nursing Home, about 5 miles away; NORWELL, MA)
NORTH RIVER NURSING HOME (Nursing Home, about 5 miles away; PEMBROKE, MA)
BAY COLONY VISITING NURSE ASSOCIATIOM (Home Health Center, about 6 miles away; PEMBROKE, MA)
LIFE CARE CENTER OF THE SOUTH SHORE (Nursing Home, about 6 miles away; SCITUATE, MA)
SCITUATE OCEAN MANOR (Nursing Home, about 6 miles away; SCITUATE, MA)
Airports located in Marshfield: Operable nuclear power plant near Marshfield:
10 miles: Pilgrim in Plymouth, MA.
Colleges/universities with over 2000 students nearest to Marshfield:
Massasoit Community College (about 15 miles; Brockton, MA ; Full-time enrollment: 5,442)
Bridgewater State University (about 16 miles; Bridgewater, MA ; FT enrollment: 9,802)
Quincy College (about 19 miles; Quincy, MA ; FT enrollment: 3,184)
Stonehill College (about 20 miles; Easton, MA ; FT enrollment: 2,563)
University of Massachusetts-Boston (about 23 miles; Boston, MA ; FT enrollment: 12,625)
Curry College (about 24 miles; Milton, MA ; FT enrollment: 2,586)
Suffolk University (about 26 miles; Boston, MA ; FT enrollment: 6,982)
Public high school in Marshfield:
Public elementary/middle schools in Marshfield: FURNACE BROOK MIDDLE Students: 1,103, Location: 500 FURNACE STREET, Grades: 6-8)MARTINSON ELEMENTARY Students: 524, Location: 275 FOREST STREET, Grades: PK-5)GOV EDWARD WINSLOW Students: 483, Location: 60 REGIS RD, Grades: KG-5)SOUTH RIVER Students: 474, Location: 59 HATCH STREET, Grades: KG-5)DANIEL WEBSTER Students: 436, Location: 1456 OCEAN STREET, Grades: PK-5)EAMES WAY SCHOOL Students: 382, Location: 165 EAMES WAY, Grades: KG-5)See full list of schools located in Marshfield Library in Marshfield: VENTRESS MEMORIAL LIBRARY Operating income: $765,111; Location: LIBRARY PLAZA; 65,713 books ; 4,227 audio materials ; 5,009 video materials ; 14 local licensed databases ; 34 state licensed databases ; 1 other licensed databases ; 180 print serial subscriptions )
Notable locations in Marshfield: (A) , Marshfield Plaza (B) , Marshfield Plaza East (C) , Marshfield Country Club (D) , Massachusetts State Fish Hatchery (E) , Marshfield Fire Department Station 3 Headquarters (F) , Ventress Memorial Library (G) , Marshfield Town Hall (H) . Display/hide their locations on the map
Shopping Centers: (1) , Webster Square Shops Shopping Center (2) . Display/hide their locations on the map
Church in Marshfield: (A) . Display/hide its location on the map
Lakes and swamps: (A) , Furnace Pond (B) , Chandlers Pond (C) , Green Harbor Marsh (D) . Display/hide their locations on the map
Streams, rivers, and creeks: (A) , Furnace Brook (B) , Green Harbor Brook (C) . Display/hide their locations on the map
Tourist attraction:
Hotels:
Birthplace of: Patrick Crowley - Union Organizing Political Agitation, Sean Morey - 2005 NFL player (Pittsburgh Steelers, born : Feb 26, 1976), Sean Morris - Lacrosse player, Mike Sullivan (ice hockey b. 1968) - Ice hockey player, Joseph W. Clift - Politician, Ryan Gibbons - Football player, Todd Faiella - College football player (Brown Bears).
Plymouth County has a predicted average indoor radon screening level between 2 and 4 pCi/L (pico curies per liter) - Moderate Potential Drinking water stations with addresses in Marshfield and their reported violations in the past:
MARSHFIELD WATER DEPARTMENT (Population served: 34,000, Groundwater):
Past health violations:
MCL, Monthly (TCR) - In JUN-2013, Contaminant: Coliform. Follow-up actions: St AO (w/o penalty) issued (AUG-30-2013), St Compliance achieved (AUG-30-2013)
MCL, Monthly (TCR) - In SEP-2012, Contaminant: Coliform. Follow-up actions: St AO (w/o penalty) issued (NOV-30-2012), St Compliance achieved (NOV-30-2012)
MCL, Monthly (TCR) - In JUN-2010, Contaminant: Coliform. Follow-up actions: St AO (w/o penalty) issued (AUG-30-2010), St Compliance achieved (AUG-30-2010)
MCL, Monthly (TCR) - In MAY-2010, Contaminant: Coliform. Follow-up actions: St AO (w/o penalty) issued (AUG-30-2010), St Compliance achieved (AUG-30-2010)
MCL, Monthly (TCR) - In OCT-2008, Contaminant: Coliform. Follow-up actions: St AO (w/o penalty) issued (FEB-27-2009), St Compliance achieved (FEB-27-2009)
Past monitoring violations:
One minor monitoring violation
23 regular monitoring violations
Average household size: This place:
2.4 peopleMassachusetts:
2.5 people
Percentage of family households: This place:
63.8%Whole state:
63.0%
Percentage of households with unmarried partners: This place:
5.0%Whole state:
7.0%
Likely homosexual households (counted as self-reported same-sex unmarried-partner households)
Lesbian couples: 0.0% of all households Gay men: 0.3% of all households
4 people in emergency and transitional shelters (with sleeping facilities) for people experiencing homelessness in 2010
Banks with branches in Marshfield (2011 data):
Sovereign Bank, National Association: Marshfield Branch at 880 Plain Street, branch established on 2004/01/26. Info updated 2012/01/31: Bank assets: $78,146.9 mil, Deposits: $48,042.9 mil, headquarters in Wilmington, DE, positive income , Commercial Lending Specialization, 718 total offices , Holding Company: Banco Santander, S.A.
Bank of America, National Association: Marshfield Branch at 934 Plain Street, branch established on 1981/07/01. Info updated 2009/11/18: Bank assets: $1,451,969.3 mil, Deposits: $1,077,176.8 mil, headquarters in Charlotte, NC, positive income , 5782 total offices , Holding Company: Bank Of America Corporation
Eastern Bank: Marshfield Branch at 1932 Ocean Street, branch established on 1998/03/23. Info updated 2011/03/30: Bank assets: $7,812.9 mil, Deposits: $6,295.8 mil, headquarters in Boston, MA, positive income , Commercial Lending Specialization, 94 total offices , Holding Company: Eastern Bank Corporation
RBS Citizens, National Association: Marshfield Branch at One Snow Road, branch established on 1962/04/23. Info updated 2007/09/19: Bank assets: $106,940.6 mil, Deposits: $75,690.2 mil, headquarters in Providence, RI, positive income , 1135 total offices , Holding Company: Uk Financial Investments Limited
Rockland Trust Company: Marshfield Branch at 73 Snow Road, branch established on 1948/06/14. Info updated 2009/05/20: Bank assets: $4,974.4 mil, Deposits: $3,903.9 mil, headquarters in Rockland, MA, positive income , Commercial Lending Specialization, 67 total offices , Holding Company: Independent Bank Corp.
The Bank of Canton: Marshfield Loan Production Office at 20 Congress Street, branch established on 2009/02/25. Info updated 2009/02/04: Bank assets: $634.2 mil, Deposits: $543.9 mil, headquarters in Canton, MA, positive income , Commercial Lending Specialization, 9 total offices , Holding Company: Ponkapoag Bancorp, Mhc
Scituate Federal Savings Bank: Green Harbor Branch at 259 Dyke Road, branch established on 2000/07/01. Info updated 2011/07/21: Bank assets: $261.5 mil, Deposits: $218.7 mil, headquarters in Scituate, MA, positive income , Mortgage Lending Specialization, 5 total offices
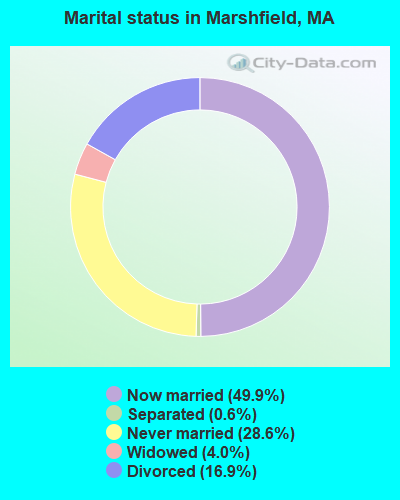
For population 15 years and over in Marshfield:
Never married: 21.1%Now married: 61.8%Separated: 0.6%Widowed: 3.0%Divorced: 13.5% For population 25 years and over in Marshfield:
High school or higher: 96.6%Bachelor's degree or higher: 53.1%Graduate or professional degree: 14.3%Unemployed: 3.0%Mean travel time to work (commute): 26.5 minutes
Education Gini index (Inequality in education) Here:
9.6Massachusetts average:
13.0
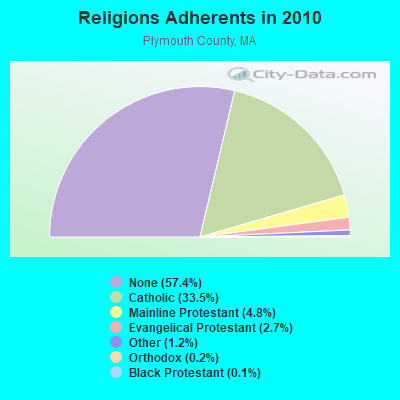
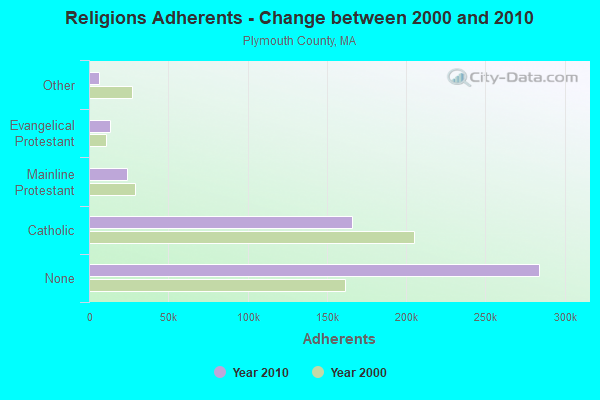
Religion statistics for Marshfield, MA (based on Plymouth County data)
Religion Adherents Congregations Catholic 165,985 35 Mainline Protestant 23,724 91 Evangelical Protestant 13,159 96 Other 6,129 43 Orthodox 1,140 3 Black Protestant 611 5 None 284,171 -
Source: Clifford Grammich, Kirk Hadaway, Richard Houseal, Dale E.Jones, Alexei Krindatch, Richie Stanley and Richard H.Taylor. 2012. 2010 U.S.Religion Census: Religious Congregations & Membership Study. Association of Statisticians of American Religious Bodies. Jones, Dale E., et al. 2002. Congregations and Membership in the United States 2000. Nashville, TN: Glenmary Research Center. Graphs represent county-level data
Food Environment Statistics: Number of grocery stores : 85Plymouth County :
1.74 / 10,000 pop.State :
1.98 / 10,000 pop.
Number of supercenters and club stores : 2This county :
0.04 / 10,000 pop.Massachusetts :
0.05 / 10,000 pop.
Number of convenience stores (no gas) : 139Plymouth County :
2.84 / 10,000 pop.Massachusetts :
2.22 / 10,000 pop.
Number of convenience stores (with gas) : 108This county :
2.20 / 10,000 pop.State :
1.77 / 10,000 pop.
Number of full-service restaurants : 361Here :
7.37 / 10,000 pop.Massachusetts :
8.76 / 10,000 pop.
Adult diabetes rate : Plymouth County :
7.9%State :
8.1%
Adult obesity rate : This county :
21.7%Massachusetts :
22.5%
Low-income preschool obesity rate : Plymouth County :
16.3%State :
16.5%
Health and Nutrition: Healthy diet rate : Marshfield:
59.7%State:
50.5%
Average overall health of teeth and gums : Here:
61.4%Massachusetts:
48.0%
People feeling badly about themselves : This city:
14.9%Massachusetts:
20.7%
Average hours sleeping at night : This city:
6.9Massachusetts:
6.8
Overweight people : This city:
30.3%Massachusetts:
33.4%
General health condition : This city:
66.9%Massachusetts:
57.1%
Average condition of hearing : Here:
80.5%Massachusetts:
79.2%
More about Health and Nutrition of Marshfield, MA Residents
5.54% of this county's 2020 resident taxpayers moved to other counties in 2021 ($85,482 average adjusted gross income )
Here:
5.54%Massachusetts average:
7.18%
0.01% of residents moved to foreign countries ($80 average AGI )Plymouth County:
0.01%Massachusetts average:
0.02%
Top counties to which taxpayers relocated from this county between 2020 and 2021:
Businesses in Marshfield, MA
Name Count Name Count
Ace Hardware 1 MasterBrand Cabinets 2 AutoZone 1 McDonald's 1 Blockbuster 1 RadioShack 1 CVS 1 Rite Aid 1 Curves 1 Shaw's 1 Dairy Queen 1 Starbucks 1 Dunkin Donuts 2 T-Mobile 1 FedEx 6 UPS 6 GNC 1 Walgreens 1 Marshalls 1 Wendy's 1
Strongest AM radio stations in Marshfield:
WBZ (1030 AM; 50 kW; BOSTON, MA; Owner: INFINITY BROADCASTING OPERATIONS, INC.)
WEEI (850 AM; 50 kW; BOSTON, MA; Owner: ENTERCOM BOSTON LICENSE, LLC)
WRKO (680 AM; 50 kW; BOSTON, MA; Owner: ENTERCOM BOSTON LICENSE, LLC)
WPLM (1390 AM; 5 kW; PLYMOUTH, MA; Owner: PLYMOUTH ROCK BROADCASTING CO., INC.)
WWZN (1510 AM; 50 kW; BOSTON, MA; Owner: ROSE CITY RADIO CORPORATION)
WKOX (1200 AM; 50 kW; FRAMINGHAM, MA; Owner: CAPSTAR TX LIMITED PARTNERSHIP)
WBIX (1060 AM; 40 kW; NATICK, MA; Owner: LANGER BROADCASTING CORPORATION)
WALE (990 AM; 50 kW; GREENVILLE, RI; Owner: NORTH AMERICAN BROADCASTING CO., INC.)
WAMG (890 AM; 25 kW; DEDHAM, MA; Owner: MEGA COMMUNICATIONS OF DEDHAM LICENSEE, LLC)
WRCA (1330 AM; 25 kW; WALTHAM, MA; Owner: WRCA LICENSE, LLC)
WUNR (1600 AM; 20 kW; BROOKLINE, MA; Owner: CHAMPION BROADCASTING SYSTEMS, INC.)
WCRN (830 AM; 50 kW; WORCESTER, MA; Owner: CARTER BROADCASTING CORPORATION)
WBET (1460 AM; 5 kW; BROCKTON, MA; Owner: KJI BROADCASTING, LLC)
Strongest FM radio stations in Marshfield:
WATD-FM (95.9 FM; MARSHFIELD, MA; Owner: MARSHFIELD BROADCASTING CO., INC.)
WPLM-FM (99.1 FM; PLYMOUTH, MA; Owner: PLYMOUTH ROCK BROADCASTING CO., INC.)
WXKS-FM (107.9 FM; MEDFORD, MA; Owner: AMFM RADIO LICENSES, L.L.C.)
WMJX (106.7 FM; BOSTON, MA; Owner: GREATER BOSTON RADIO, INC.)
WBMX (98.5 FM; BOSTON, MA; Owner: INFINITY RADIO OPERATIONS INC.)
WBOS (92.9 FM; BROOKLINE, MA; Owner: GREATER BOSTON RADIO, INC.)
WJMN (94.5 FM; BOSTON, MA; Owner: AMFM RADIO LICENSES, L.L.C.)
WCRB (102.5 FM; WALTHAM, MA; Owner: CHARLES RIVER BROADCASTING WCRB LICE)
WTKK (96.9 FM; BOSTON, MA; Owner: GREATER BOSTON RADIO, INC.)
WROR-FM (105.7 FM; FRAMINGHAM, MA; Owner: GREATER BOSTON RADIO, INC.)
WGBH (89.7 FM; BOSTON, MA; Owner: WGBH EDUCATIONAL FOUNDATION)
WBUR-FM (90.9 FM; BOSTON, MA; Owner: TRUSTEES OF BOSTON UNIVERSITY)
WBOT (97.7 FM; BROCKTON, MA; Owner: RADIO ONE LICENSES, LLC)
WBCN (104.1 FM; BOSTON, MA; Owner: HEMISPHERE BROADCASTING CORPORATION)
WZLX (100.7 FM; BOSTON, MA; Owner: INFINITY BROADCASTING CORPORATION OF BOSTON)
W267AI (101.3 FM; BOSTON, MA; Owner: MCC BROADCASTING COMPANY, INC.)
WERS (88.9 FM; BOSTON, MA; Owner: EMERSON COLLEGE)
WODS (103.3 FM; BOSTON, MA; Owner: INFINITY BROADCASTING OPERATIONS, INC.)
WWBB (101.5 FM; PROVIDENCE, RI; Owner: CLEAR CHANNEL BROADCASTING LICENSES, INC.)
WHRB (95.3 FM; CAMBRIDGE, MA; Owner: HARVARD RADIO BROADCASTING CO., INC.)
TV broadcast stations around Marshfield:
WWDP (Channel 46; NORWELL, MA; Owner: NORWELL TELEVISION, LLC)
WCVB-TV (Channel 5; BOSTON, MA; Owner: WCVB HEARST-ARGYLE TV, INC.)
WGBH-TV (Channel 2; BOSTON, MA; Owner: WGBH EDUCATIONAL FOUNDATION)
WHDH-TV (Channel 7; BOSTON, MA; Owner: WHDH-TV)
WMFP (Channel 62; LAWRENCE, MA; Owner: WSAH LICENSE, INC.)
WSBK-TV (Channel 38; BOSTON, MA; Owner: VIACOM INC.)
WLVI-TV (Channel 56; CAMBRIDGE, MA; Owner: WLVI, INC.)
WBZ-TV (Channel 4; BOSTON, MA; Owner: VIACOM INC.)
WGBX-TV (Channel 44; BOSTON, MA; Owner: WGBH EDUCATIONAL FOUNDATION)
WBPX (Channel 68; BOSTON, MA; Owner: PAXSON BOSTON-68 LICENSE, INC.)
WFXT (Channel 25; BOSTON, MA; Owner: FOX TELEVISION STATIONS INC.)
WTMU-LP (Channel 32; BOSTON, MA; Owner: ZGS BOSTON, INC.)
WCEA-LP (Channel 58; BOSTON, MA; Owner: CHANNEL 19 TV CORPORATION)
WLWC (Channel 28; NEW BEDFORD, MA; Owner: C-28 FCC LICENSEE SUBSIDIARY, LLC)
WLNE-TV (Channel 6; NEW BEDFORD, MA; Owner: FREEDOM BROADCASTING OF SOUTHERN NEW ENGLAND, INC.)
W40BO (Channel 40; BOSTON, MA; Owner: PAXSON COMMUNICATIONS LPTV, INC.)
WPRI-TV (Channel 12; PROVIDENCE, RI; Owner: TVL BROADCASTING OF RHODE ISLAND, LLC)
WNAC-TV (Channel 64; PROVIDENCE, RI; Owner: WNAC, LLC)
WJAR (Channel 10; PROVIDENCE, RI; Owner: OUTLET BROADCASTING, INC.)
WUTF (Channel 66; MARLBOROUGH, MA; Owner: TELEFUTURA BOSTON LLC)
WSBE-TV (Channel 36; PROVIDENCE, RI; Owner: RHODE ISLAND PUBLIC TELECOM. AUTHORITY)
National Bridge Inventory (NBI) Statistics 6 Number of bridges102ft / 31.0m Total length $23,316,000 Total costs118,629 Total average daily traffic7,494 Total average daily truck traffic214,942 Total future (year 2032) average daily traffic
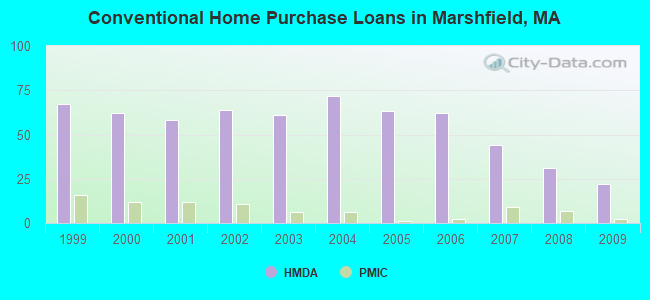
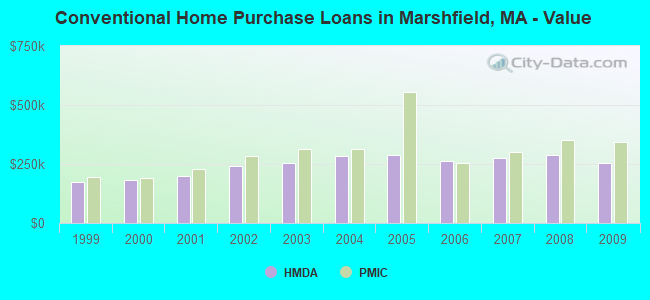
Home Mortgage Disclosure Act Aggregated Statistics For Year 2009(Based on 3 partial tracts) A) FHA, FSA/RHS & VA B) Conventional C) Refinancings D) Home Improvement Loans E) Loans on Dwellings For 5+ Families F) Non-occupant Loans on Number Average Value Number Average Value Number Average Value Number Average Value Number Average Value Number Average Value
LOANS ORIGINATED 16 $300,572 22 $253,092 174 $251,466 10 $139,878 1 $666,650 6 $248,778 APPLICATIONS APPROVED, NOT ACCEPTED 0 $0 1 $407,120 6 $250,093 1 $111,350 0 $0 0 $0 APPLICATIONS DENIED 5 $293,556 3 $198,807 35 $272,701 3 $184,503 0 $0 2 $331,935 APPLICATIONS WITHDRAWN 1 $274,730 5 $297,646 30 $271,950 2 $262,310 0 $0 1 $211,550 FILES CLOSED FOR INCOMPLETENESS 1 $290,670 1 $178,530 5 $324,792 1 $114,040 0 $0 0 $0
Aggregated Statistics For Year 2008(Based on 3 partial tracts) A) FHA, FSA/RHS & VA B) Conventional C) Refinancings D) Home Improvement Loans F) Non-occupant Loans on Number Average Value Number Average Value Number Average Value Number Average Value Number Average Value
LOANS ORIGINATED 7 $312,207 31 $287,322 79 $266,014 11 $119,617 6 $307,818 APPLICATIONS APPROVED, NOT ACCEPTED 0 $0 3 $310,947 9 $285,942 0 $0 0 $0 APPLICATIONS DENIED 1 $358,560 5 $324,474 27 $282,443 5 $158,282 1 $218,300 APPLICATIONS WITHDRAWN 1 $288,990 4 $318,720 18 $281,268 0 $0 1 $426,490 FILES CLOSED FOR INCOMPLETENESS 0 $0 1 $245,030 4 $272,708 1 $201,970 0 $0
Aggregated Statistics For Year 2007(Based on 3 partial tracts) A) FHA, FSA/RHS & VA B) Conventional C) Refinancings D) Home Improvement Loans F) Non-occupant Loans on Number Average Value Number Average Value Number Average Value Number Average Value Number Average Value
LOANS ORIGINATED 2 $262,080 44 $276,083 83 $261,462 17 $88,871 11 $281,767 APPLICATIONS APPROVED, NOT ACCEPTED 0 $0 8 $229,571 14 $241,859 1 $41,000 1 $178,320 APPLICATIONS DENIED 0 $0 8 $286,744 41 $296,741 6 $120,767 5 $284,576 APPLICATIONS WITHDRAWN 0 $0 4 $280,455 18 $294,474 2 $93,410 1 $243,590 FILES CLOSED FOR INCOMPLETENESS 0 $0 1 $103,340 6 $335,438 0 $0 0 $0
Aggregated Statistics For Year 2006(Based on 3 partial tracts) A) FHA, FSA/RHS & VA B) Conventional C) Refinancings D) Home Improvement Loans F) Non-occupant Loans on Number Average Value Number Average Value Number Average Value Number Average Value Number Average Value
LOANS ORIGINATED 1 $326,260 62 $263,365 126 $229,920 35 $102,401 8 $285,175 APPLICATIONS APPROVED, NOT ACCEPTED 0 $0 8 $232,350 13 $191,058 4 $126,732 0 $0 APPLICATIONS DENIED 1 $266,780 10 $315,432 51 $272,020 7 $91,541 3 $217,430 APPLICATIONS WITHDRAWN 0 $0 6 $279,498 31 $258,960 4 $149,295 1 $510,960 FILES CLOSED FOR INCOMPLETENESS 0 $0 1 $171,580 11 $275,545 1 $121,250 0 $0
Aggregated Statistics For Year 2005(Based on 3 partial tracts) B) Conventional C) Refinancings D) Home Improvement Loans E) Loans on Dwellings For 5+ Families F) Non-occupant Loans on Number Average Value Number Average Value Number Average Value Number Average Value Number Average Value
LOANS ORIGINATED 63 $286,277 158 $250,520 30 $154,542 1 $617,720 9 $264,121 APPLICATIONS APPROVED, NOT ACCEPTED 5 $259,424 15 $249,625 3 $88,417 0 $0 1 $239,500 APPLICATIONS DENIED 10 $263,254 45 $300,898 7 $79,487 0 $0 2 $282,675 APPLICATIONS WITHDRAWN 10 $241,127 42 $259,911 5 $152,178 0 $0 1 $355,800 FILES CLOSED FOR INCOMPLETENESS 4 $297,975 14 $289,555 0 $0 0 $0 0 $0
Aggregated Statistics For Year 2004(Based on 3 partial tracts) A) FHA, FSA/RHS & VA B) Conventional C) Refinancings D) Home Improvement Loans F) Non-occupant Loans on G) Loans On Manufactured Number Average Value Number Average Value Number Average Value Number Average Value Number Average Value Number Average Value
LOANS ORIGINATED 2 $239,145 72 $283,646 192 $230,690 25 $117,361 9 $216,291 1 $212,280 APPLICATIONS APPROVED, NOT ACCEPTED 0 $0 9 $322,637 16 $237,049 4 $81,872 1 $193,950 0 $0 APPLICATIONS DENIED 0 $0 10 $236,393 35 $259,701 9 $64,040 5 $253,490 0 $0 APPLICATIONS WITHDRAWN 0 $0 7 $284,776 47 $240,687 3 $210,610 1 $228,720 0 $0 FILES CLOSED FOR INCOMPLETENESS 0 $0 1 $176,860 11 $262,947 0 $0 0 $0 0 $0
Aggregated Statistics For Year 2003(Based on 3 partial tracts) A) FHA, FSA/RHS & VA B) Conventional C) Refinancings D) Home Improvement Loans F) Non-occupant Loans on Number Average Value Number Average Value Number Average Value Number Average Value Number Average Value
LOANS ORIGINATED 2 $220,650 61 $255,812 460 $195,044 14 $85,836 13 $194,583 APPLICATIONS APPROVED, NOT ACCEPTED 0 $0 6 $285,593 48 $192,915 4 $70,425 1 $157,450 APPLICATIONS DENIED 0 $0 7 $218,291 73 $221,645 7 $78,190 3 $183,793 APPLICATIONS WITHDRAWN 0 $0 5 $320,902 40 $202,022 1 $66,130 4 $188,528 FILES CLOSED FOR INCOMPLETENESS 0 $0 0 $0 8 $235,706 0 $0 1 $25,280
Aggregated Statistics For Year 2002(Based on 3 partial tracts) A) FHA, FSA/RHS & VA B) Conventional C) Refinancings D) Home Improvement Loans F) Non-occupant Loans on Number Average Value Number Average Value Number Average Value Number Average Value Number Average Value
LOANS ORIGINATED 3 $159,743 64 $241,074 329 $183,856 21 $67,027 12 $157,097 APPLICATIONS APPROVED, NOT ACCEPTED 0 $0 5 $197,040 39 $168,981 6 $55,262 2 $264,210 APPLICATIONS DENIED 1 $161,130 6 $211,020 35 $197,481 9 $51,593 2 $164,485 APPLICATIONS WITHDRAWN 0 $0 4 $179,452 33 $172,871 3 $60,270 0 $0 FILES CLOSED FOR INCOMPLETENESS 0 $0 1 $290,350 14 $229,918 0 $0 0 $0
Aggregated Statistics For Year 2001(Based on 3 partial tracts) A) FHA, FSA/RHS & VA B) Conventional C) Refinancings D) Home Improvement Loans E) Loans on Dwellings For 5+ Families F) Non-occupant Loans on Number Average Value Number Average Value Number Average Value Number Average Value Number Average Value Number Average Value
LOANS ORIGINATED 3 $174,170 58 $198,563 262 $174,217 22 $50,177 1 $330,370 8 $172,678 APPLICATIONS APPROVED, NOT ACCEPTED 0 $0 6 $194,573 31 $152,267 5 $46,864 0 $0 1 $177,340 APPLICATIONS DENIED 0 $0 3 $218,070 35 $134,893 7 $30,229 0 $0 2 $129,915 APPLICATIONS WITHDRAWN 0 $0 4 $211,602 36 $174,974 3 $70,493 0 $0 0 $0 FILES CLOSED FOR INCOMPLETENESS 0 $0 0 $0 4 $188,020 0 $0 0 $0 0 $0
Aggregated Statistics For Year 2000(Based on 3 partial tracts) A) FHA, FSA/RHS & VA B) Conventional C) Refinancings D) Home Improvement Loans F) Non-occupant Loans on Number Average Value Number Average Value Number Average Value Number Average Value Number Average Value
LOANS ORIGINATED 3 $135,793 62 $181,243 57 $127,101 22 $33,547 3 $151,567 APPLICATIONS APPROVED, NOT ACCEPTED 0 $0 5 $238,390 7 $113,314 9 $35,426 0 $0 APPLICATIONS DENIED 1 $136,320 5 $169,916 20 $121,009 10 $28,047 0 $0 APPLICATIONS WITHDRAWN 0 $0 3 $248,783 19 $112,895 3 $31,940 0 $0 FILES CLOSED FOR INCOMPLETENESS 1 $119,250 1 $149,720 5 $134,700 0 $0 0 $0
Aggregated Statistics For Year 1999(Based on 3 partial tracts) A) FHA, FSA/RHS & VA B) Conventional C) Refinancings D) Home Improvement Loans F) Non-occupant Loans on Number Average Value Number Average Value Number Average Value Number Average Value Number Average Value
LOANS ORIGINATED 6 $147,100 67 $175,072 114 $135,399 20 $31,021 6 $118,422 APPLICATIONS APPROVED, NOT ACCEPTED 0 $0 6 $215,443 18 $152,001 4 $26,230 1 $172,550 APPLICATIONS DENIED 1 $162,670 4 $166,020 23 $113,669 8 $31,464 1 $98,990 APPLICATIONS WITHDRAWN 0 $0 8 $205,452 14 $122,119 1 $92,630 2 $181,940 FILES CLOSED FOR INCOMPLETENESS 0 $0 2 $166,275 8 $109,871 0 $0 0 $0
Detailed HMDA statistics for the following Tracts:
5061.01
, 5062.02 , 5062.03
Private Mortgage Insurance Companies Aggregated Statistics For Year 2009(Based on 3 partial tracts) A) Conventional B) Refinancings Number Average Value Number Average Value
LOANS ORIGINATED 2 $342,140 4 $336,815 APPLICATIONS APPROVED, NOT ACCEPTED 0 $0 1 $236,640 APPLICATIONS DENIED 1 $331,120 1 $270,720 APPLICATIONS WITHDRAWN 1 $266,610 0 $0 FILES CLOSED FOR INCOMPLETENESS 0 $0 0 $0
Aggregated Statistics For Year 2008(Based on 3 partial tracts) A) Conventional B) Refinancings Number Average Value Number Average Value
LOANS ORIGINATED 7 $351,849 3 $302,347 APPLICATIONS APPROVED, NOT ACCEPTED 2 $225,100 2 $387,190 APPLICATIONS DENIED 0 $0 1 $454,400 APPLICATIONS WITHDRAWN 1 $259,710 0 $0 FILES CLOSED FOR INCOMPLETENESS 0 $0 0 $0
Aggregated Statistics For Year 2007(Based on 3 partial tracts) A) Conventional B) Refinancings Number Average Value Number Average Value
LOANS ORIGINATED 9 $301,661 2 $368,735 APPLICATIONS APPROVED, NOT ACCEPTED 2 $358,290 0 $0 APPLICATIONS DENIED 0 $0 0 $0 APPLICATIONS WITHDRAWN 1 $337,620 0 $0 FILES CLOSED FOR INCOMPLETENESS 0 $0 0 $0
Aggregated Statistics For Year 2006(Based on 3 partial tracts) A) Conventional B) Refinancings Number Average Value Number Average Value
LOANS ORIGINATED 2 $254,385 2 $252,035 APPLICATIONS APPROVED, NOT ACCEPTED 0 $0 0 $0 APPLICATIONS DENIED 0 $0 0 $0 APPLICATIONS WITHDRAWN 0 $0 0 $0 FILES CLOSED FOR INCOMPLETENESS 0 $0 0 $0
Aggregated Statistics For Year 2005(Based on 3 partial tracts) A) Conventional B) Refinancings Number Average Value Number Average Value
LOANS ORIGINATED 1 $553,020 2 $296,545 APPLICATIONS APPROVED, NOT ACCEPTED 1 $242,690 0 $0 APPLICATIONS DENIED 0 $0 0 $0 APPLICATIONS WITHDRAWN 1 $267,110 1 $252,760 FILES CLOSED FOR INCOMPLETENESS 0 $0 0 $0
Aggregated Statistics For Year 2004(Based on 3 partial tracts) A) Conventional B) Refinancings C) Non-occupant Loans on Number Average Value Number Average Value Number Average Value
LOANS ORIGINATED 6 $311,567 1 $159,770 1 $156,650 APPLICATIONS APPROVED, NOT ACCEPTED 0 $0 1 $481,840 0 $0 APPLICATIONS DENIED 0 $0 0 $0 0 $0 APPLICATIONS WITHDRAWN 0 $0 0 $0 0 $0 FILES CLOSED FOR INCOMPLETENESS 0 $0 0 $0 0 $0
Aggregated Statistics For Year 2003(Based on 3 partial tracts) A) Conventional B) Refinancings C) Non-occupant Loans on Number Average Value Number Average Value Number Average Value
LOANS ORIGINATED 6 $313,438 6 $304,423 1 $416,880 APPLICATIONS APPROVED, NOT ACCEPTED 1 $287,260 3 $230,813 0 $0 APPLICATIONS DENIED 0 $0 0 $0 0 $0 APPLICATIONS WITHDRAWN 1 $377,670 0 $0 0 $0 FILES CLOSED FOR INCOMPLETENESS 0 $0 1 $124,480 0 $0
Aggregated Statistics For Year 2002(Based on 3 partial tracts) A) Conventional B) Refinancings C) Non-occupant Loans on Number Average Value Number Average Value Number Average Value
LOANS ORIGINATED 11 $283,375 3 $235,823 1 $166,660 APPLICATIONS APPROVED, NOT ACCEPTED 2 $153,580 1 $137,620 0 $0 APPLICATIONS DENIED 0 $0 0 $0 0 $0 APPLICATIONS WITHDRAWN 0 $0 0 $0 0 $0 FILES CLOSED FOR INCOMPLETENESS 0 $0 0 $0 0 $0
Aggregated Statistics For Year 2001(Based on 3 partial tracts) A) Conventional B) Refinancings Number Average Value Number Average Value
LOANS ORIGINATED 12 $228,435 9 $200,376 APPLICATIONS APPROVED, NOT ACCEPTED 1 $211,810 1 $173,020 APPLICATIONS DENIED 0 $0 1 $139,020 APPLICATIONS WITHDRAWN 0 $0 0 $0 FILES CLOSED FOR INCOMPLETENESS 0 $0 0 $0
Aggregated Statistics For Year 2000(Based on 3 partial tracts) A) Conventional B) Refinancings C) Non-occupant Loans on Number Average Value Number Average Value Number Average Value
LOANS ORIGINATED 12 $192,082 4 $167,238 1 $75,860 APPLICATIONS APPROVED, NOT ACCEPTED 3 $193,287 1 $166,170 0 $0 APPLICATIONS DENIED 0 $0 0 $0 0 $0 APPLICATIONS WITHDRAWN 1 $184,890 0 $0 0 $0 FILES CLOSED FOR INCOMPLETENESS 1 $138,330 0 $0 0 $0
Aggregated Statistics For Year 1999(Based on 3 partial tracts) A) Conventional B) Refinancings Number Average Value Number Average Value
LOANS ORIGINATED 16 $193,938 5 $186,014 APPLICATIONS APPROVED, NOT ACCEPTED 2 $200,310 1 $251,600 APPLICATIONS DENIED 1 $149,070 0 $0 APPLICATIONS WITHDRAWN 1 $125,830 0 $0 FILES CLOSED FOR INCOMPLETENESS 0 $0 0 $0
Detailed PMIC statistics for the following Tracts:
5061.01
, 5062.02 , 5062.03 Marshfield compared to Massachusetts state average:
Unemployed percentage significantly below state average. Black race population percentage significantly below state average. Hispanic race population percentage significantly below state average. Median age above state average. Foreign-born population percentage significantly below state average. Length of stay since moving in above state average. House age below state average. Percentage of population with a bachelor's degree or higher above state average. Marshfield on our top lists :
#38 on the list of "Top 101 cities with the most residents born in Brazil (population 500+)"
#26 (02050) on the list of "Top 101 zip codes with the largest percentage of Irish first ancestries (pop 5,000+)"
#18 on the list of "Top 101 counties with the highest percentage of residents that visited a dentist within the past year"
#24 on the list of "Top 101 counties with the highest percentage of residents that smoked 100+ cigarettes in their lives"
#35 on the list of "Top 101 counties with the largest decrease in the number of births per 1000 residents 2000-2006 to 2007-2013 (pop 50,000+)"
#39 on the list of "Top 101 counties with the lowest percentage of residents that keep firearms around their homes"
#39 on the list of "Top 101 counties with the lowest number of infant deaths per 1000 residents 2007-2013 (pop. 50,000+)"
Top Patent Applicants
James A. Grau (17)
James R. Ellsworth (15)
Ben C. Askew (13)
Benny C. Askew, Jr. (10)
Paul Birkmeyer (9)
John V. Roderick (6)
Peter B. Laxton (6)
Gary Stacey (5)
Robert Claude Prescott (5)
Robert Silvers (5)
Total of 222 patent applications in 2008-2024.


 Recent articles from our blog. Our writers, many of them Ph.D. graduates or candidates, create easy-to-read articles on a wide variety of topics.

 (14.4 miles
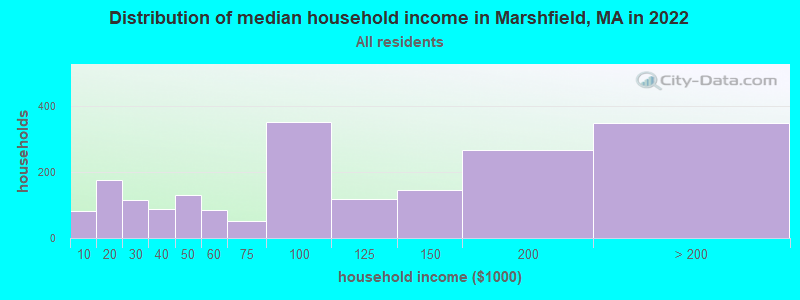


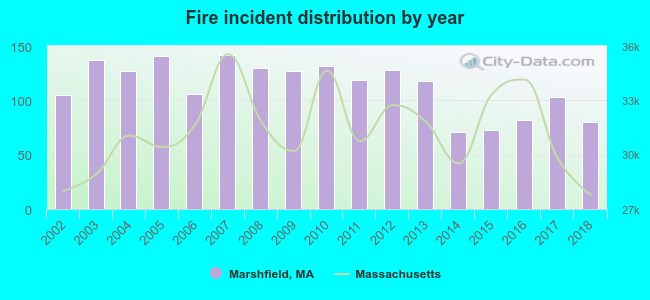 Based on the data from the years 2002 - 2018 the average number of fire incidents per year is 113. The highest number of fires - 142 took place in 2007, and the least - 71 in 2014. The data has a decreasing trend.
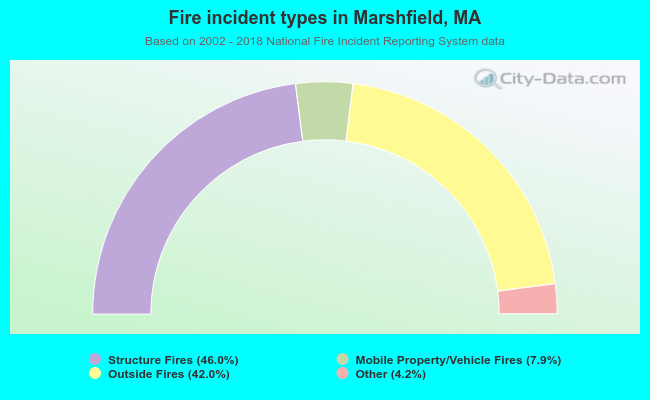 When looking into fire subcategories, the most reports belonged to: Structure Fires (46.0%), and Outside Fires (42.0%).