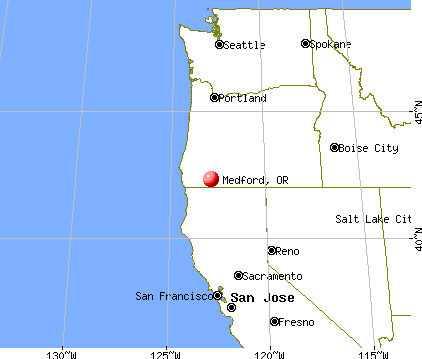
Medford, Oregon
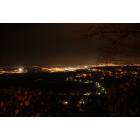
Medford: Looking out from Rogue Valley Manor
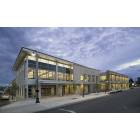
Medford: Medford Library
Medford: Looking out from rogue valley manor

Medford: Crater Lake - 60 Miles North of Medford

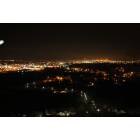
Medford: View of Medford at Dusk From a House On Mt. Roxian
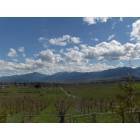
Medford: The Hillcrest Orchards (View From McAndrews)
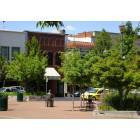
Medford: Vogel Plaza
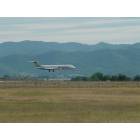
Medford: Allegiant Airlines Landing In Medford
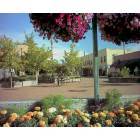
Medford: Vogel Plaza
Medford
Medford: Cheap Gas at Dairy Queen
- see
21
more - add
your
Submit your own pictures of this city and show them to the world
- OSM Map
- General Map
- Google Map
- MSN Map
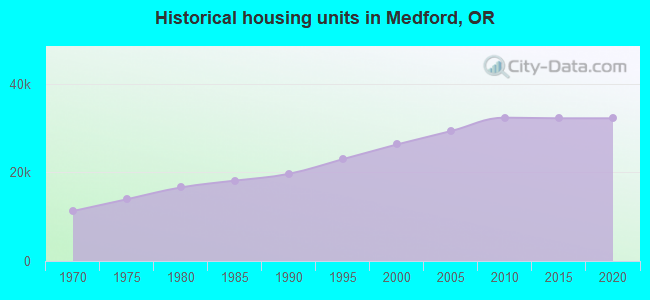
Population change since 2000: +35.5%
 |
| Males: 41,400 | |
| Females: 44,156 |
| Median resident age: | 39.5 years |
| Oregon median age: | 40.5 years |
Zip codes: 97504.
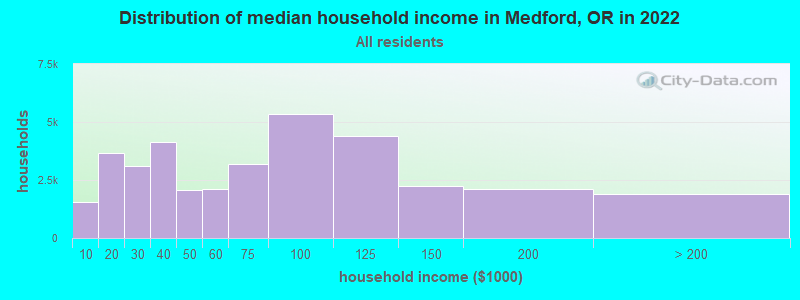
| Medford: | $67,303 |
| OR: | $75,657 |
Estimated per capita income in 2022: $36,492 (it was $20,170 in 2000)
Medford city income, earnings, and wages data
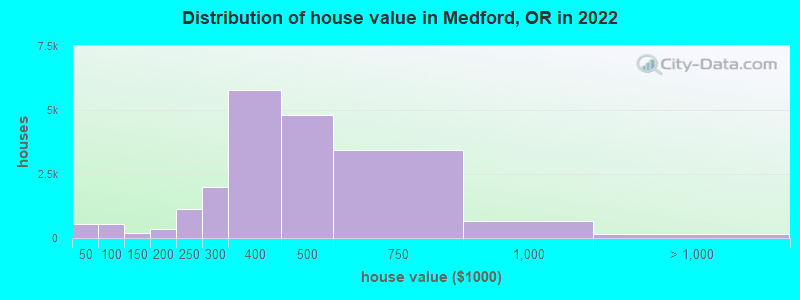
Estimated median house or condo value in 2022: $401,900 (it was $128,500 in 2000)
| Medford: | $401,900 |
| OR: | $475,600 |
Mean prices in 2022: all housing units: $412,151; detached houses: $437,345; townhouses or other attached units: $361,362; in 2-unit structures: $218,662; in 3-to-4-unit structures: $371,147; in 5-or-more-unit structures: $281,052; mobile homes: $66,465
Median gross rent in 2022: $1,207.
(13.5% for White Non-Hispanic residents, 22.2% for Black residents, 18.1% for Hispanic or Latino residents, 27.1% for American Indian residents, 15.7% for other race residents, 10.6% for two or more races residents)
Detailed information about poverty and poor residents in Medford, OR


Compare current foreclosures in Medford, OR:
| Photo | Address | Area | Beds / Baths | Price | Details |
|---|---|---|---|---|---|

|
#1
Cherry St
Medford, OR 97501
|
1,485 sq. feet
|
2 baths 4 beds |
$419,900
|
show details |

|
#2
Alder St
Medford, OR 97501
|
1,578 sq. feet
|
1 baths 3 beds |
show details | |

|
#3
Springbrook Rd
Medford, OR 97504
|
1,600 sq. feet
|
2 baths 3 beds |
show details | |

|
#4
E Barnett Rd # 5
Medford, OR 97504
|
1,226 sq. feet
|
2 baths 2 beds |
show details | |

|
#5
Lillian St
Medford, OR 97501
|
1,283 sq. feet
|
2 baths 3 beds |
show details | |

|
#6
Stacie Way
Medford, OR 97504
|
2,042 sq. feet
|
2 baths 3 beds |
show details | |

|
#7
Bianca Ct
Medford, OR 97504
|
2,133 sq. feet
|
2 baths 3 beds |
show details | |

|
#8
Garfield St
Medford, OR 97501
|
1,434 sq. feet
|
1 baths 3 beds |
show details | |

|
#9
Elliott Ave
Medford, OR 97501
|
1,144 sq. feet
|
1 baths 3 beds |
show details | |

|
#10
Dakota Ave
Medford, OR 97501
|
1,352 sq. feet
|
2 baths 3 beds |
show details |
| Photo | Address | Area | Beds / Baths | Price | Details |
|---|---|---|---|---|---|

|
#11
Grant Ave
Medford, OR 97501
|
1,541 sq. feet
|
2 baths 2 beds |
show details | |

|
#12
Harrison Ave
Medford, OR 97504
|
1,674 sq. feet
|
2 baths 2 beds |
show details | |

|
#13
Brookside Dr
Medford, OR 97504
|
1,212 sq. feet
|
2 baths 2 beds |
show details | |

|
#14
De Hague Rd
Medford, OR 97501
|
1,392 sq. feet
|
2 baths 2 beds |
show details | |

|
#15
Angel Crest Dr
Medford, OR 97504
|
1,706 sq. feet
|
2 baths 3 beds |
show details | |

|
#16
Gilman Rd
Medford, OR 97504
|
1,476 sq. feet
|
2 baths 3 beds |
show details | |

|
#17
Ashland Ave
Medford, OR 97504
|
3,450 sq. feet
|
2 baths 3 beds |
show details | |

|
#18
Erin Way
Medford, OR 97501
|
1,275 sq. feet
|
2 baths 3 beds |
show details | |

|
#19
Moon Ter
Medford, OR 97504
|
1,426 sq. feet
|
2 baths 3 beds |
show details | |

|
#20
Terrace Dr
Medford, OR 97504
|
1,068 sq. feet
|
1 baths 3 beds |
show details |
| Photo | Address | Area | Beds / Baths | Price | Details |
|---|---|---|---|---|---|

|
#21
Murray Ave
Medford, OR 97501
|
1,176 sq. feet
|
3 baths 4 beds |
show details | |

|
#22
Lillian St
Medford, OR 97501
|
1,276 sq. feet
|
2 baths 3 beds |
show details | |

|
#23
W Clark St
Medford, OR 97501
|
1,296 sq. feet
|
1 baths 3 beds |
show details | |

|
#24
Candlis Point Ct
Medford, OR 97504
|
2,578 sq. feet
|
3 baths 2 beds |
show details | |

|
#25
Hillcourt St
Medford, OR 97504
|
841 sq. feet
|
1 baths 2 beds |
show details | |

|
#26
Silky Oaks Ln
Medford, OR 97501
|
1,251 sq. feet
|
2 baths 3 beds |
show details | |

|
#27
Worchester Dr
Medford, OR 97501
|
1,702 sq. feet
|
2 baths 3 beds |
show details | |

|
#28
Eagle Trace Dr
Medford, OR 97504
|
2,418 sq. feet
|
2 baths 3 beds |
show details | |

|
#29
Lillian St
Medford, OR 97501
|
1,451 sq. feet
|
2 baths 3 beds |
show details | |

|
#30
Brookhurst St
Medford, OR 97504
|
1,586 sq. feet
|
2 baths 4 beds |
show details |
| Photo | Address | Area | Beds / Baths | Price | Details |
|---|---|---|---|---|---|

|
#31
Corona Ave
Medford, OR 97504
|
1,000 sq. feet
|
1 baths 3 beds |
show details | |

|
#32
Reager St
Medford, OR 97501
|
1,264 sq. feet
|
1 baths 3 beds |
show details | |

|
#33
Cambridge Cir
Medford, OR 97504
|
1,840 sq. feet
|
2 baths 3 beds |
show details | |

|
#34
Perrydale Ave
Medford, OR 97501
|
1,242 sq. feet
|
1 baths 3 beds |
show details | |

|
#35
Effie St
Medford, OR 97504
|
672 sq. feet
|
1 baths 2 beds |
show details | |

|
#36
Stardust Way
Medford, OR 97504
|
2,292 sq. feet
|
3 baths 3 beds |
show details | |

|
#37
Orchard Home Dr
Medford, OR 97501
|
1,065 sq. feet
|
1 baths 2 beds |
show details | |

|
#38
Westfield Way
Medford, OR 97501
|
2,359 sq. feet
|
2 baths 3 beds |
show details | |

|
#39
W 14th St
Medford, OR 97501
|
876 sq. feet
|
1 baths 2 beds |
show details | |

|
#40
Cody St
Medford, OR 97504
|
994 sq. feet
|
2 baths 3 beds |
show details |
| Photo | Address | Area | Beds / Baths | Price | Details |
|---|---|---|---|---|---|

|
#41
Griffin Creek Rd
Medford, OR 97501
|
1,987 sq. feet
|
3 baths 4 beds |
show details | |

|
#42
Clearwater Dr
Medford, OR 97501
|
- sq. feet
|
2 baths 3 beds |
show details | |

|
#43
Oleander St
Medford, OR 97504
|
1,869 sq. feet
|
2 baths 4 beds |
show details | |

|
#44
N Peach St
Medford, OR 97501
|
1,377 sq. feet
|
1 baths 3 beds |
show details | |

|
#45
Crater Lake Ave
Medford, OR 97504
|
1,143 sq. feet
|
1 baths 3 beds |
show details | |

|
#46
Mira Mar Ave
Medford, OR 97504
|
1,581 sq. feet
|
2 baths 3 beds |
show details | |

|
#47
Marie St
Medford, OR 97504
|
1,026 sq. feet
|
1 baths 2 beds |
show details | |

|
#48
Peebler Way
Medford, OR 97501
|
1,372 sq. feet
|
2 baths 3 beds |
show details | |

|
#49
W Jackson St
Medford, OR 97501
|
616 sq. feet
|
2 baths 3 beds |
show details | |

|
Check over 1 million property listings on Foreclosure.com!
|
browse all offers | |||


- 63,16573.8%White alone
- 15,59818.2%Hispanic
- 3,1983.7%Two or more races
- 1,3521.6%Asian alone
- 9611.1%Other race alone
- 7990.9%Black alone
- 4080.5%American Indian alone
- 750.09%Native Hawaiian and Other
Pacific Islander alone
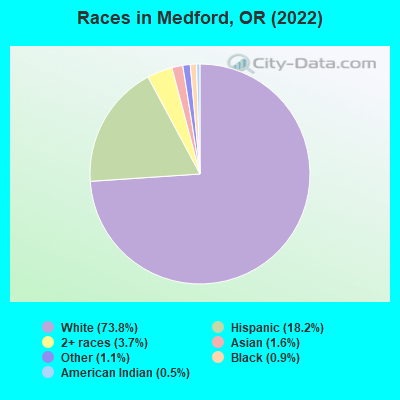
Races in Medford detailed stats: ancestries, foreign born residents, place of birth
According to our research of Oregon and other state lists, there were 38 registered sex offenders living in Medford, Oregon as of May 02, 2024.
The ratio of all residents to sex offenders in Medford is 2,148 to 1.
The ratio of registered sex offenders to all residents in this city is near the state average.
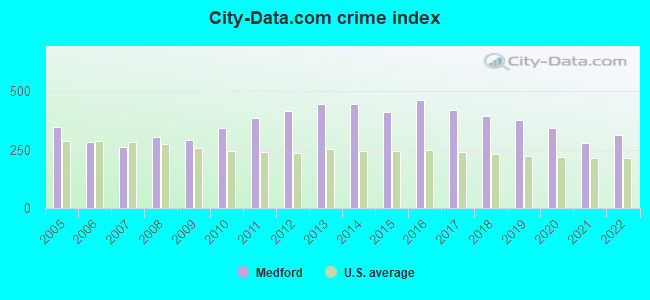
The City-Data.com crime index weighs serious crimes and violent crimes more heavily. Higher means more crime, U.S. average is 246.1. It adjusts for the number of visitors and daily workers commuting into cities.
- means the value is smaller than the state average.- means the value is about the same as the state average.
- means the value is bigger than the state average.
- means the value is much bigger than the state average.
Crime rate in Medford detailed stats: murders, rapes, robberies, assaults, burglaries, thefts, arson
Full-time law enforcement employees in 2021, including police officers: 143 (108 officers - 91 male; 17 female).
| Officers per 1,000 residents here: | 1.28 |
| Oregon average: | 1.48 |
 Recent articles from our blog. Our writers, many of them Ph.D. graduates or candidates, create easy-to-read articles on a wide variety of topics.

 | Housing, Medford Area (3 replies) |
| How competitive are jobs in Medford area? (12 replies) |
| Moving to Medford as a new physician with family pros and cons? (23 replies) |
| How hard to find doctors who accept medicare in medford? (6 replies) |
| Possibly moving to Medford (11 replies) |
| Possible move to Medford area from Kelowna, British Columbia Canada (2 replies) |
Latest news from Medford, OR collected exclusively by city-data.com from local newspapers, TV, and radio stations
Ancestries: English (10.4%), American (9.3%), German (9.3%), Irish (7.1%), European (4.7%), Italian (2.6%).
Current Local Time: PST time zone
Incorporated in 1885
Elevation: 1383 feet
Land area: 21.7 square miles.
Population density: 3,943 people per square mile (average).
5,263 residents are foreign born (3.5% Latin America, 1.0% Europe, 0.9% Asia).
| This city: | 6.2% |
| Oregon: | 9.8% |
Median real estate property taxes paid for housing units with mortgages in 2022: $2,853 (0.7%)
Median real estate property taxes paid for housing units with no mortgage in 2022: $3,454 (0.8%)
Nearest city with pop. 200,000+: Northwest Clackamas, OR (212.4 miles  , pop. 224,220).
Nearest city with pop. 1,000,000+: Los Angeles, CA (620.0 miles , pop. 3,694,820).
Nearest cities:
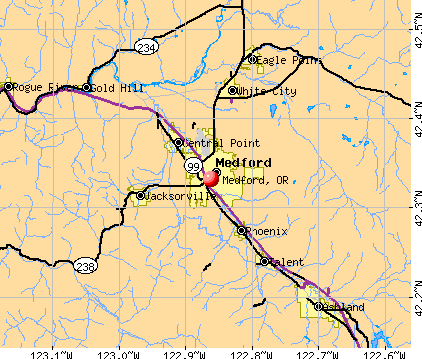
), )Latitude: 42.33 N, Longitude: 122.86 W
Daytime population change due to commuting: +15,163 (+17.7%)
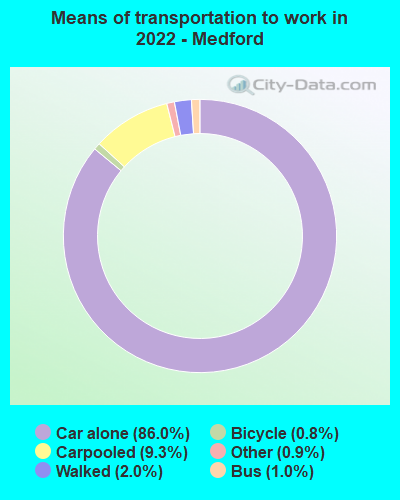
Workers who live and work in this city: 29,343 (74.9%)
Area code: 541
Medford tourist attractions:
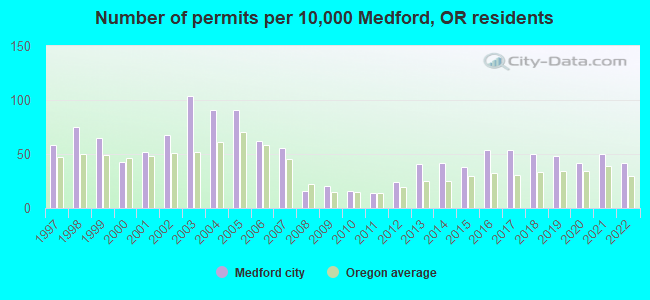
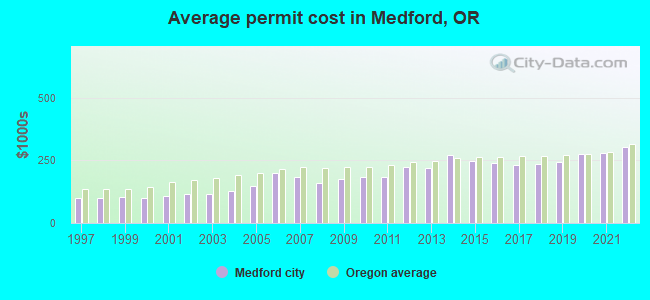
Single-family new house construction building permits:
- 2022: 264 buildings, average cost: $304,800
- 2021: 318 buildings, average cost: $278,900
- 2020: 265 buildings, average cost: $276,200
- 2019: 303 buildings, average cost: $244,100
- 2018: 316 buildings, average cost: $236,600
- 2017: 343 buildings, average cost: $229,500
- 2016: 339 buildings, average cost: $240,600
- 2015: 243 buildings, average cost: $245,900
- 2014: 267 buildings, average cost: $272,600
- 2013: 262 buildings, average cost: $219,500
- 2012: 150 buildings, average cost: $221,600
- 2011: 86 buildings, average cost: $181,900
- 2010: 102 buildings, average cost: $182,400
- 2009: 128 buildings, average cost: $175,500
- 2008: 102 buildings, average cost: $159,100
- 2007: 351 buildings, average cost: $184,400
- 2006: 391 buildings, average cost: $199,900
- 2005: 574 buildings, average cost: $147,500
- 2004: 577 buildings, average cost: $126,800
- 2003: 657 buildings, average cost: $115,400
- 2002: 432 buildings, average cost: $116,800
- 2001: 328 buildings, average cost: $105,600
- 2000: 269 buildings, average cost: $99,000
- 1999: 410 buildings, average cost: $103,200
- 1998: 471 buildings, average cost: $99,100
- 1997: 366 buildings, average cost: $97,500
| Here: | 4.2% |
| Oregon: | 3.9% |
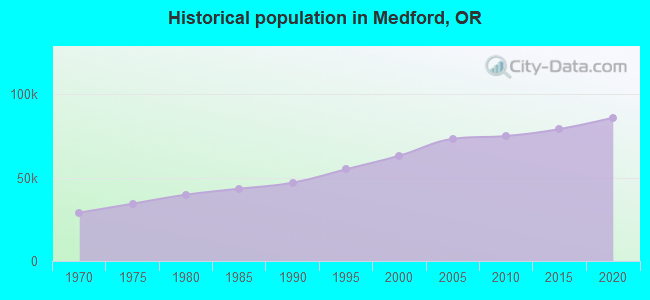
Population change in the 1990s: +14,074 (+28.7%).
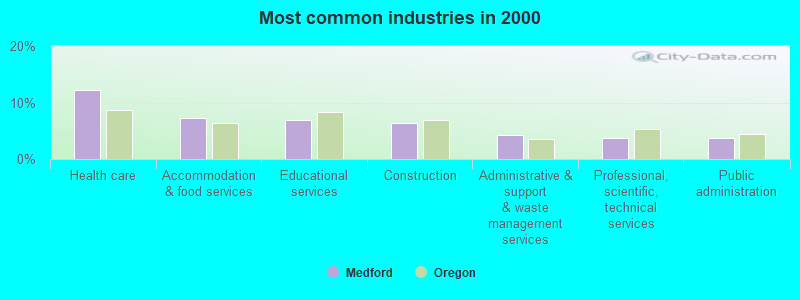
- Health care (12.1%)
- Accommodation & food services (7.2%)
- Educational services (7.0%)
- Construction (6.4%)
- Administrative & support & waste management services (4.2%)
- Professional, scientific, technical services (3.8%)
- Public administration (3.6%)
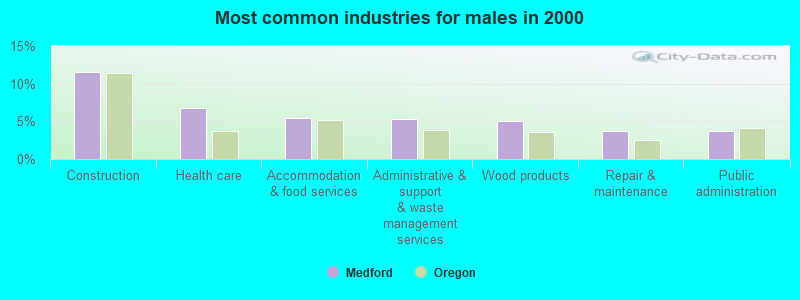
- Construction (11.5%)
- Health care (6.8%)
- Accommodation & food services (5.4%)
- Administrative & support & waste management services (5.3%)
- Wood products (5.0%)
- Repair & maintenance (3.7%)
- Public administration (3.7%)
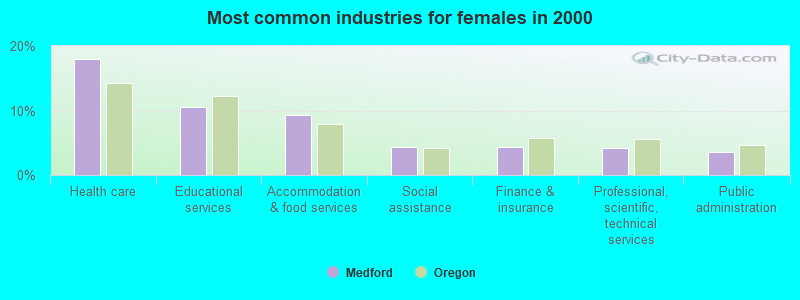
- Health care (17.9%)
- Educational services (10.5%)
- Accommodation & food services (9.2%)
- Social assistance (4.4%)
- Finance & insurance (4.3%)
- Professional, scientific, technical services (4.1%)
- Public administration (3.6%)
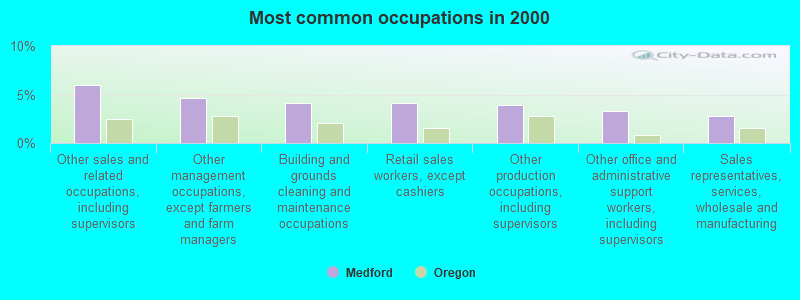
- Other sales and related occupations, including supervisors (6.0%)
- Other management occupations, except farmers and farm managers (4.7%)
- Building and grounds cleaning and maintenance occupations (4.2%)
- Retail sales workers, except cashiers (4.1%)
- Other production occupations, including supervisors (3.9%)
- Other office and administrative support workers, including supervisors (3.3%)
- Sales representatives, services, wholesale and manufacturing (2.7%)
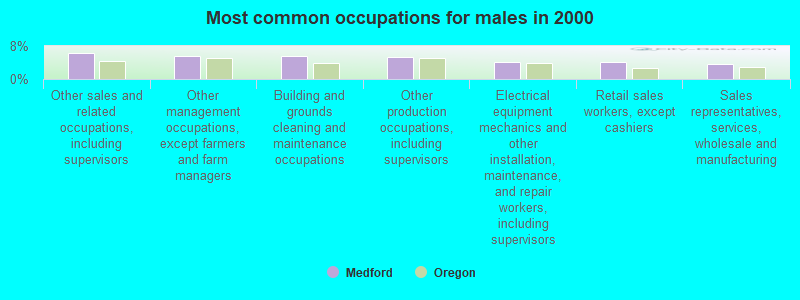
- Other sales and related occupations, including supervisors (6.4%)
- Other management occupations, except farmers and farm managers (5.5%)
- Building and grounds cleaning and maintenance occupations (5.5%)
- Other production occupations, including supervisors (5.3%)
- Electrical equipment mechanics and other installation, maintenance, and repair workers, including supervisors (4.2%)
- Retail sales workers, except cashiers (4.1%)
- Sales representatives, services, wholesale and manufacturing (3.6%)
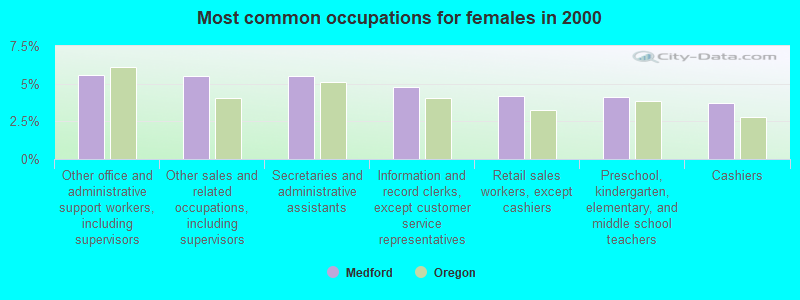
- Other office and administrative support workers, including supervisors (5.6%)
- Other sales and related occupations, including supervisors (5.5%)
- Secretaries and administrative assistants (5.5%)
- Information and record clerks, except customer service representatives (4.8%)
- Retail sales workers, except cashiers (4.2%)
- Preschool, kindergarten, elementary, and middle school teachers (4.1%)
- Cashiers (3.7%)
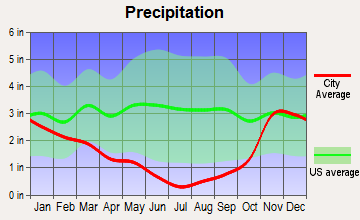
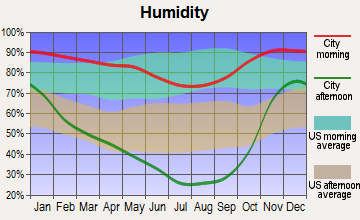
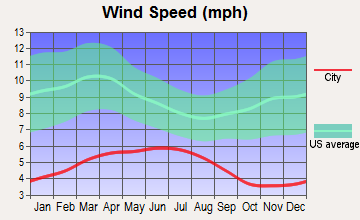
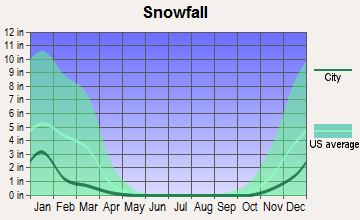
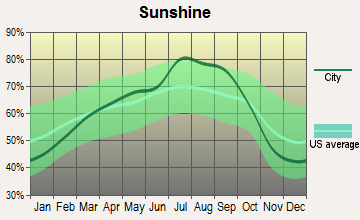
Average climate in Medford, Oregon
Based on data reported by over 4,000 weather stations


|
|

(lower is better)
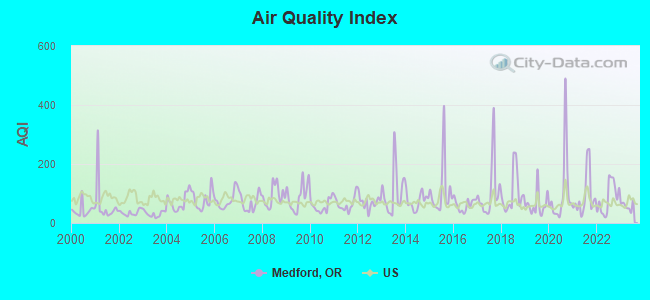
Air Quality Index (AQI) level in 2023 was 57.7. This is better than average.
| City: | 57.7 |
| U.S.: | 72.6 |
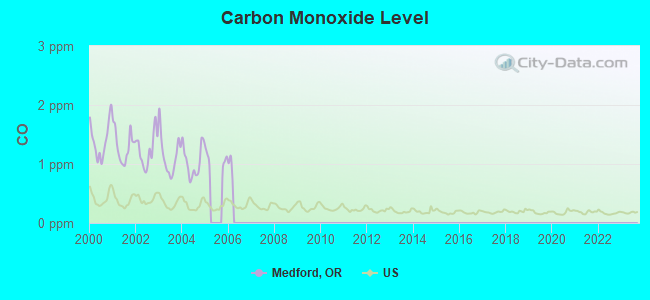
Carbon Monoxide (CO) [ppm] level in 2004 was 1.04. This is significantly worse than average. Closest monitor was 0.7 miles away from the city center.
| City: | 1.04 |
| U.S.: | 0.25 |
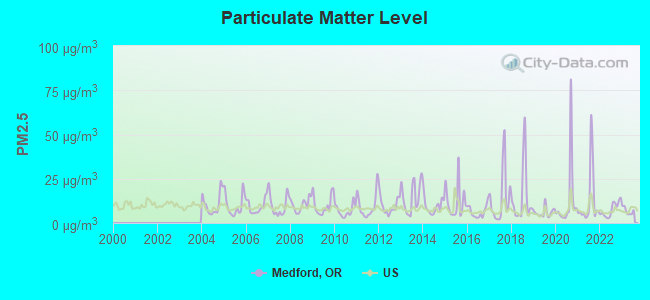
Particulate Matter (PM2.5) [µg/m3] level in 2023 was 6.85. This is about average. Closest monitor was 0.9 miles away from the city center.
| City: | 6.85 |
| U.S.: | 8.11 |
Earthquake activity:
Medford-area historical earthquake activity is significantly above Oregon state average. It is 3355% greater than the overall U.S. average.On 1/31/1922 at 13:17:28, a magnitude 7.6 (7.6 UK, Class: Major, Intensity: VIII - XII) earthquake occurred 179.3 miles away from Medford center
On 11/8/1980 at 10:27:34, a magnitude 7.2 (6.2 MB, 7.2 MS, 7.2 MW, 7.0 ML) earthquake occurred 112.5 miles away from the city center
On 4/18/1906 at 13:12:21, a magnitude 7.9 (7.9 UK) earthquake occurred 299.7 miles away from Medford center, causing $524,000,000 total damage
On 4/25/1992 at 18:06:04, a magnitude 7.2 (6.3 MB, 7.1 MS, 7.2 MW, 7.1 MW, Depth: 9.4 mi) earthquake occurred 150.7 miles away from Medford center, causing $75,000,000 total damage
On 8/17/1991 at 22:17:14, a magnitude 7.1 (6.2 MB, 7.1 MS, 7.1 MW, 6.8 ML, Depth: 8.4 mi) earthquake occurred 145.6 miles away from Medford center
On 6/15/2005 at 02:50:54, a magnitude 7.2 (7.2 MW, Depth: 9.9 mi) earthquake occurred 174.8 miles away from Medford center
Magnitude types: body-wave magnitude (MB), local magnitude (ML), surface-wave magnitude (MS), moment magnitude (MW)
Natural disasters:
The number of natural disasters in Jackson County (12) is smaller than the US average (15).Major Disasters (Presidential) Declared: 5
Emergencies Declared: 2
Causes of natural disasters: Fires: 5, Floods: 4, Storms: 2, Drought: 1, Heavy Rain: 1, Hurricane: 1, Landslide: 1, Mudslide: 1, Snow: 1, Wind: 1, Winter Storm: 1, Other: 1 (Note: some incidents may be assigned to more than one category).
Main business address for: PREMIERWEST BANCORP (FINANCE SERVICES), LITHIA MOTORS INC (RETAIL-AUTO DEALERS & GASOLINE STATIONS).
Hospitals in Medford:
- ASANTE ROGUE REGIONAL MEDICAL CENTER (Voluntary non-profit - Private, 2825 E BARNETT ROAD)
- PROVIDENCE MEDFORD HOSPICE (2033 COMMERCE DRIVE)
- PROVIDENCE MEDFORD MEDICAL CENTER (Voluntary non-profit - Church, 1111 CRATER LAKE AVENUE)
- RVMC HOME CARE SERVICES HOSPIC (2960 DOCTORS PARK DRIVE)
Nursing Homes in Medford:
- AVAMERE AT THREE FOUNTAINS (835 CRATER LAKE AVENUE)
- HEARTHSTONE NURSING AND REHABILITATION CENTER (2901 E. BARNETT ROAD)
- MEDFORD REHAB AND HEALTHCARE (625 STEVENS STREET)
- ROGUE VALLEY CARE CENTER (3693 S PACIFIC HWY)
- ROGUE VALLEY MANOR (1200 MIRA MAR AVENUE)
- VILLA ROYAL HEALTH CARE CENTER (625 STEVENS ST)
Dialysis Facilities in Medford:
Home Health Centers in Medford:
Airports and heliports located in Medford:
- Rogue Valley International - Medford Airport (MFR) (Runways: 1, Commercial Ops: 6,646, Air Taxi Ops: 9,749, Itinerant Ops: 15,663, Local Ops: 5,528, Military Ops: 479)
- Beagle Sky Ranch Airport (OR96) (Runways: 1)
- Burrill Airport (OR97) (Runways: 1)
- Snider Creek Airport (OR06) (Runways: 1)
- Providence Hospital Heliport (0OR0)
- Rogue Valley Medical Center Heliport (OR99)
Colleges/Universities in Medford:
Colleges/universities with over 2000 students nearest to Medford:
- Southern Oregon University (about 14 miles; Ashland, OR; Full-time enrollment: 4,650)
- Rogue Community College (about 28 miles; Grants Pass, OR; FT enrollment: 3,600)
- Oregon Institute of Technology (about 56 miles; Klamath Falls, OR; FT enrollment: 2,900)
- Lane Community College (about 117 miles; Eugene, OR; FT enrollment: 6,373)
- University of Oregon (about 119 miles; Eugene, OR; FT enrollment: 23,329)
- Humboldt State University (about 119 miles; Arcata, CA; FT enrollment: 7,353)
- Shasta College (about 122 miles; Redding, CA; FT enrollment: 5,645)
Public high schools in Medford:
- SOUTH MEDFORD HIGH SCHOOL (Students: 1,920, Location: 1551 CUNNINGHAM AVE, Grades: 9-12)
- NORTH MEDFORD HIGH SCHOOL (Students: 1,890, Location: 1900 N KEENE WAY DR, Grades: 9-12)
- LOGOS PUBLIC CHARTER SCHOOL (Location: 400 EARHART, Grades: KG-12, Charter school)
- CENTRAL MEDFORD HIGH SCHOOL (Location: 815 S OAKDALE AVE, Grades: 9-12)
Private high school in Medford:
Biggest public elementary/middle schools in Medford:
- HEDRICK MIDDLE SCHOOL (Students: 922, Location: 1501 E JACKSON ST, Grades: 6-8)
- MCLOUGHLIN MIDDLE SCHOOL (Students: 866, Location: 320 W SECOND ST, Grades: 6-8)
- KENNEDY ELEMENTARY SCHOOL (Students: 587, Location: 2860 N KEENE WAY DR, Grades: KG-6)
- LONE PINE ELEMENTARY SCHOOL (Students: 569, Location: 3158 LONE PINE RD, Grades: KG-6)
- JEFFERSON ELEMENTARY SCHOOL (Students: 549, Location: 333 HOLMES AVE, Grades: KG-6)
- GRIFFIN CREEK ELEMENTARY SCHOOL (Students: 538, Location: 2430 GRIFFIN CREEK RD, Grades: KG-6)
- HOWARD ELEMENTARY SCHOOL (Students: 531, Location: 286 MACE RD, Grades: KG-6)
- ABRAHAM LINCOLN ELEMENTARY (Students: 524, Location: 3101 MCLOUGHLIN DR, Grades: KG-6)
- OAK GROVE ELEMENTARY SCHOOL (Students: 514, Location: 2838 W MAIN ST, Grades: KG-6)
- WASHINGTON ELEMENTARY SCHOOL (Students: 439, Location: 610 S PEACH ST, Grades: KG-6)
Private elementary/middle schools in Medford:
- SACRED HEART CATHOLIC SCHOOL (Students: 265, Location: 431 S IVY ST, Grades: PK-8)
- HARVEST BAPTIST CHRISTIAN SCHOOL (Students: 96, Location: 2001 S COLUMBUS AVE, Grades: PK-8)
- MEDFORD MONTESSORI SCHOOL (Students: 94, Location: 1398 POPLAR DR, Grades: PK-4)
- NEW DIMENSION CHRISTIAN SCHOOL (Students: 37, Location: 129 N OAKDALE AVE, Grades: PK-7)
Library in Medford:
User-submitted facts and corrections:
- Your listing of "creeks" does not include "Bear Creek", he largest of the creeks traversing Medford, and the namesake for the "Bear Creek Watershed" which provides water resources to the Medford valley.
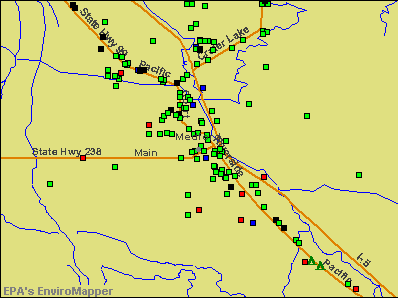
Points of interest:
Notable locations in Medford: Rogue Valley Country Club (A), Greyhound Bus Station (B), Front Street Station Park and Ride (C), Asante Health Rogue Valley Medical Center Blood Bank (D), American Red Cross Southern Oregon Chapter (E), American Red Cross Medford Donor Center (F), Oregon Railway Historical Society Railroad Museum / Park (G), Medford Public Works Department Office (H), Medford Municipal Court (I), Medford City Hall (J), Medford Branch Library (K), Craterian Ginger Rogers Theatre (L), The RRRink Southern Oregon Ice Arena (M), CSL Plasma Services (N), Medford Fire and Rescue Station 2 (O), Medford Fire Department Station 6 (P), Medford Fire Department Station 5 (Q), Department of Motor Vehicles Medford Drive Test Center (R), Rogue Valley International Medford Airport Fire Department (S), Medford Fire Department Station 3 (T). Display/hide their locations on the map
Main business address in Medford include: PREMIERWEST BANCORP (A), LITHIA MOTORS INC (B). Display/hide their locations on the map
Cemeteries: Medford IOOF Cemetery (1), Siskiyou Memorial Park (2). Display/hide their locations on the map
Creeks: Larson Creek (A), Crooked Creek (B), Lazy Creek (C). Display/hide their locations on the map
Parks in Medford include: Jefferson School Park (1), Bear Creek Park (2). Display/hide their locations on the map
Tourist attractions: Southern Oregon Historical Society (Historical Places & Services; 106 North Central Avenue) (1), Amusement Connection (Amusement & Theme Parks; 3320 North Pacific Highway) (2), Tilt (Amusement & Theme Parks; 1600 North Riverside Avenue) (3), Slick KART Track & Arcade (Amusement & Theme Parks; 1029 Narregan Street) (4), Amusement Unlimited Inc (Amusement & Theme Parks; 526 South Fir Street) (5), Quick Shop 2 (Amusement & Theme Parks; 3320 North Pacific Highway) (6), M.E.K. Enterprises- Inc. (Arcades & Amusements; 39 N. Orange Street) (7), AAA Travel Agency (Tours & Charters; 1777 East Barnett Road) (8), AAA Oregon (Tours & Charters; 1777 East Barnett Road) (9). Display/hide their approximate locations on the map
Hotels: Bear Creek Motel (2715 South Pacific Highway) (1), Red Lion Hotel Medford (200 N Riverside Ave) (2), Best Inn & Suites (1015 South Riverside Avenue) (3), Clayhill Lodge (PO Box 855) (4), Royal Crest Motel (411 East Barnett Road) (5), Courtyard by Marriott Medford (600 Airport Road) (6), Best 4 Less Village Inn Motel (722 North Riverside Avenue) (7), Shilo Inn Medford (2111 Biddle Road) (8), City Center Hotel (324 South Central Avenue) (9). Display/hide their approximate locations on the map
Court: Medford City - Municipal Court- Traffic & Parking Tickets (City Hall) (1). Display/hide its approximate location on the map
Birthplace of: John Gunderson - Martial artist, Kyle Singler - Basketball player, Mike Whitehead - Martial artist, David B. Frohnmayer - Politician, Devin Cole - Martial artist, Jennifer Murphy - Beauty pageant queen, Jon Lindstrom - Soap opera actor, Lisa Rinna - Soap opera actor, Mark Ryden - Painter, Marshall Holman - Bowling player.
Drinking water stations with addresses in Medford and their reported violations in the past:
MEDFORD WATER COMMISSION (Population served: 90,932, Surface water):Past monitoring violations:SHADY COVE LIBRARY (Population served: 150, Groundwater):
- One minor monitoring violation
Past monitoring violations:FERN VALLEY ESTATES IMPR DIST (Population served: 135, Groundwater):
- 2 routine major monitoring violations
- 2 regular monitoring violations
Past monitoring violations:ROGUE VALLEY STATIONS (Population served: 100, Groundwater):
- 4 routine major monitoring violations
Past health violations:PARADISE LODGE (Population served: 100, Groundwater):Past monitoring violations:
- MCL, Monthly (TCR) - Between JUL-2013 and SEP-2013, Contaminant: Coliform. Follow-up actions: St Public Notif requested (SEP-18-2013), St Compliance achieved (DEC-05-2013)
- Monitoring, Source Water (GWR) - In AUG-29-2013, Contaminant: E. COLI
- Monitoring, Source Water (GWR) - In NOV-01-2010, Contaminant: E. COLI. Follow-up actions: St Violation/Reminder Notice (DEC-27-2010)
- Monitoring, Source Water (GWR) - In JUN-01-2010, Contaminant: E. COLI. Follow-up actions: St Violation/Reminder Notice (AUG-02-2010)
- Monitoring, Repeat Major (TCR) - Between APR-2010 and JUN-2010, Contaminant: Coliform (TCR). Follow-up actions: St Public Notif requested (JUL-27-2010), St Violation/Reminder Notice (AUG-02-2010), St Compliance achieved (MAR-31-2011)
- 5 routine major monitoring violations
- 2 minor monitoring violations
- One regular monitoring violation
Past monitoring violations:STAGE STOP STORE (Population served: 100, Groundwater):
- Monitoring, Repeat Major (TCR) - In OCT-2005, Contaminant: Coliform (TCR). Follow-up actions: St Compliance achieved (NOV-03-2005)
- Monitoring, Turbidity (Enhanced SWTR) - In MAY-2005, Contaminant: IESWTR. Follow-up actions: St Compliance achieved (SEP-19-2005)
- 18 routine major monitoring violations
- 3 minor monitoring violations
- 2 regular monitoring violations
Past monitoring violations:DESERT MOBILE HOME ESTATES (Population served: 100, Groundwater):
- 5 routine major monitoring violations
Past health violations:LEISURE DAY MOBILE HOME PARK (Population served: 90, Groundwater):Past monitoring violations:
- MCL, Monthly (TCR) - In DEC-2012, Contaminant: Coliform. Follow-up actions: St Public Notif received (DEC-12-2012), St Public Notif requested (DEC-21-2012), St Violation/Reminder Notice (DEC-31-2012), St Compliance achieved (FEB-08-2013)
- MCL, Monthly (TCR) - In SEP-2006, Contaminant: Coliform. Follow-up actions: St Compliance achieved (OCT-10-2006)
- MCL, Monthly (TCR) - In DEC-2005, Contaminant: Coliform. Follow-up actions: St Compliance achieved (JAN-09-2006)
- One routine major monitoring violation
Past health violations:Past monitoring violations:
- MCL, Monthly (TCR) - In MAR-2010, Contaminant: Coliform. Follow-up actions: St Violation/Reminder Notice (MAR-22-2010), St Public Notif requested (APR-19-2010), St Compliance achieved (JUN-25-2010)
- Monitoring, Source Water (GWR) - In APR-01-2010, Contaminant: E. COLI. Follow-up actions: St Violation/Reminder Notice (MAY-24-2010), St Compliance achieved (MAR-08-2012)
- Monitoring, Repeat Major (TCR) - In APR-2010, Contaminant: Coliform (TCR). Follow-up actions: St Public Notif requested (MAY-18-2010), St Violation/Reminder Notice (MAY-24-2010), St Compliance achieved (JUN-25-2010)
- Monitoring and Reporting (DBP) - Between JAN-2010 and DEC-2010, Contaminant: Total Haloacetic Acids (HAA5). Follow-up actions: St Violation/Reminder Notice (FEB-22-2011), St Compliance achieved (AUG-24-2011)
- Monitoring and Reporting (DBP) - Between JAN-2010 and DEC-2010, Contaminant: TTHM. Follow-up actions: St Violation/Reminder Notice (FEB-22-2011), St Compliance achieved (AUG-24-2011)
- 6 routine major monitoring violations
- One minor monitoring violation
- 2 regular monitoring violations
Drinking water stations with addresses in Medford that have no violations reported:
- USFS MCKEE BRIDGE PICNIC GRND (Population served: 25, Primary Water Source Type: Groundwater)
| This city: | 2.4 people |
| Oregon: | 2.5 people |
| This city: | 63.4% |
| Whole state: | 63.4% |
| This city: | 8.6% |
| Whole state: | 8.0% |
Likely homosexual households (counted as self-reported same-sex unmarried-partner households)
- Lesbian couples: 0.4% of all households
- Gay men: 0.3% of all households
People in group quarters in Medford in 2010:
- 450 people in nursing facilities/skilled-nursing facilities
- 389 people in group homes intended for adults
- 210 people in local jails and other municipal confinement facilities
- 169 people in residential treatment centers for adults
- 152 people in other noninstitutional facilities
- 137 people in emergency and transitional shelters (with sleeping facilities) for people experiencing homelessness
- 15 people in workers' group living quarters and job corps centers
- 12 people in residential treatment centers for juveniles (non-correctional)
- 11 people in correctional facilities intended for juveniles
- 8 people in group homes for juveniles (non-correctional)
People in group quarters in Medford in 2000:
- 432 people in nursing homes
- 402 people in other noninstitutional group quarters
- 195 people in local jails and other confinement facilities (including police lockups)
- 156 people in other group homes
- 34 people in hospitals or wards for drug/alcohol abuse
- 29 people in homes or halfway houses for drug/alcohol abuse
- 18 people in homes for the mentally ill
- 9 people in other types of correctional institutions
- 7 people in homes for the physically handicapped
- 3 people in agriculture workers' dormitories on farms
Banks with most branches in Medford (2011 data):
- PremierWest Bank: 7 branches. Info updated 2011/05/20: Bank assets: $1,264.9 mil, Deposits: $1,128.9 mil, local headquarters, negative income in the last year, Commercial Lending Specialization, 46 total offices, Holding Company: Premierwest Bancorp
- U.S. Bank National Association: Medford Branch, North Medford Branch, Barnett & Phoenix Albertsons Branch, Jacksonville & Ross Albertsons Branc, Rogue Valley Manor Branch, South Medford Branch. Info updated 2012/01/30: Bank assets: $330,470.8 mil, Deposits: $236,091.5 mil, headquarters in Cincinnati, OH, positive income, 3121 total offices, Holding Company: U.S. Bancorp
- JPMorgan Chase Bank, National Association: Crater Lake Plaza, I-5 South Branch, Medford Consumer Finance Branch, North Medford, South Medford Branch, Crater Branch. Info updated 2011/11/10: Bank assets: $1,811,678.0 mil, Deposits: $1,190,738.0 mil, headquarters in Columbus, OH, positive income, International Specialization, 5577 total offices, Holding Company: Jpmorgan Chase & Co.
- Bank of the Cascades: Barnett Road Branch, Medford Branch, Crater Lake Highway Branch, Medford Courier Service Branch. Info updated 2007/01/18: Bank assets: $1,334.8 mil, Deposits: $1,087.3 mil, headquarters in Bend, OR, negative income in the last year, Commercial Lending Specialization, 35 total offices, Holding Company: Cascade Bancorp
- Umpqua Bank: Mcandrews Branch, Medford Main Branch, Stewart Avenue Branch, Poplar Branch. Info updated 2011/09/02: Bank assets: $11,556.7 mil, Deposits: $9,325.3 mil, headquarters in Roseburg, OR, positive income, Commercial Lending Specialization, 193 total offices, Holding Company: Umpqua Holdings Corporation
- South Valley Bank & Trust: Hillcrest Branch, Biddle Branch, Medford Trust Office, Navigator's Landing Branch. Info updated 2010/07/27: Bank assets: $865.2 mil, Deposits: $771.3 mil, headquarters in Klamath Falls, OR, negative income in the last year, Commercial Lending Specialization, 26 total offices, Holding Company: South Valley Bancorp, Inc.
- Wells Fargo Bank, National Association: West Medford Branch, East Mcandrews Branch, Crater Lake Plaza Branch, South Riverside Avenue Branch. Info updated 2011/04/05: Bank assets: $1,161,490.0 mil, Deposits: $905,653.0 mil, headquarters in Sioux Falls, SD, positive income, 6395 total offices, Holding Company: Wells Fargo & Company
- KeyBank National Association: East Medford Branch, Medford Main Branch, Black Oak Branch. Info updated 2008/03/03: Bank assets: $86,198.8 mil, Deposits: $64,214.8 mil, headquarters in Cleveland, OH, positive income, Commercial Lending Specialization, 1067 total offices, Holding Company: Keycorp
- Sterling Savings Bank: Medford-Stewart Branch at 620 Stewart Avenue, branch established on 2004/01/02; Medford Branch at 1420 East Mcandrews Road, branch established on 1990/02/12. Info updated 2012/03/21: Bank assets: $9,207.8 mil, Deposits: $6,454.1 mil, headquarters in Spokane, WA, positive income, Commercial Lending Specialization, 192 total offices, Holding Company: Sterling Financial Corporation
- 6 other banks with 8 local branches
For population 15 years and over in Medford:
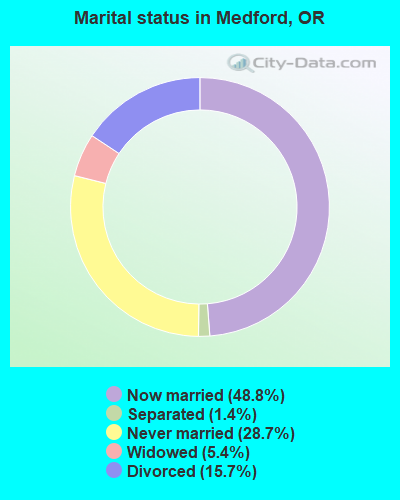
- Never married: 28.7%
- Now married: 48.8%
- Separated: 1.4%
- Widowed: 5.4%
- Divorced: 15.7%
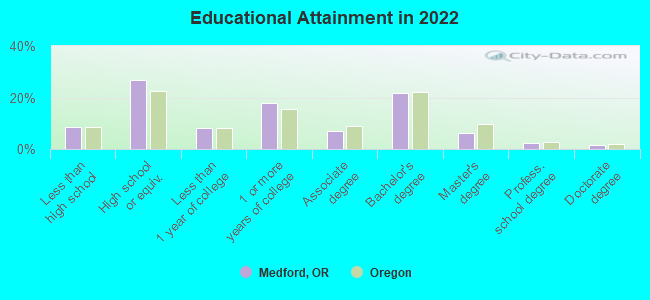
For population 25 years and over in Medford:
- High school or higher: 91.6%
- Bachelor's degree or higher: 31.8%
- Graduate or professional degree: 10.1%
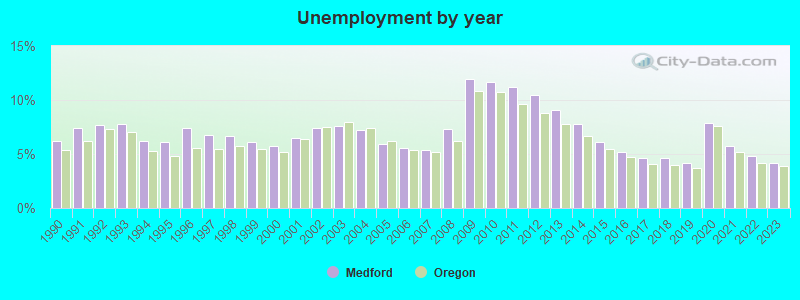
- Unemployed: 3.8%
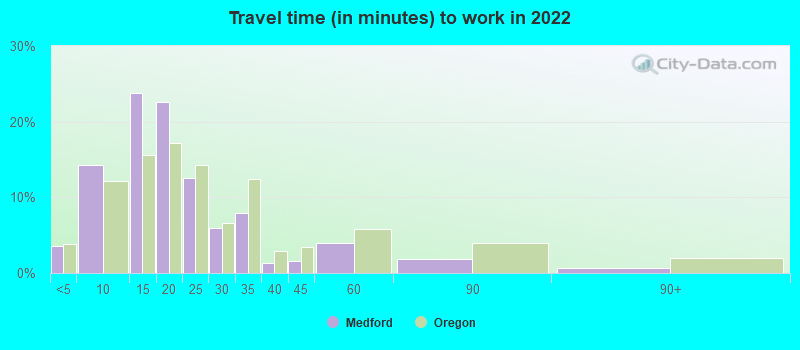
- Mean travel time to work (commute): 13.2 minutes
| Here: | 10.9 |
| Oregon average: | 11.6 |
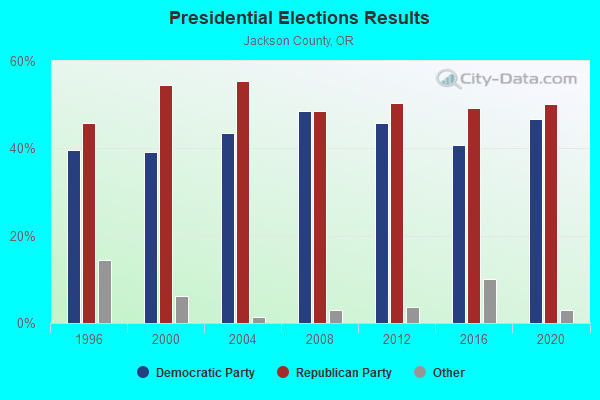
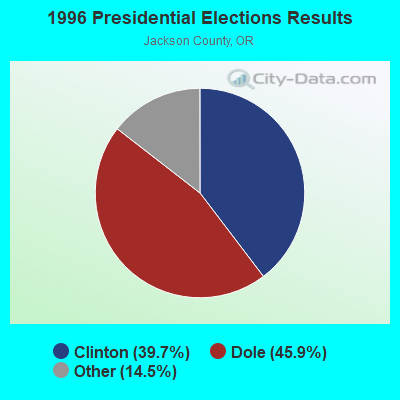
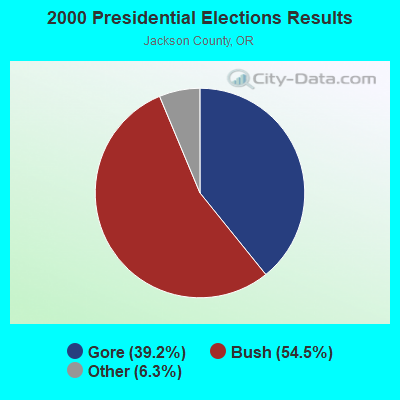
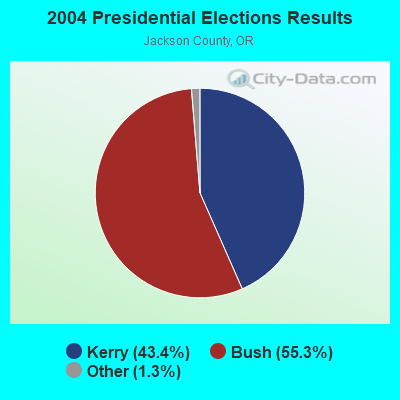

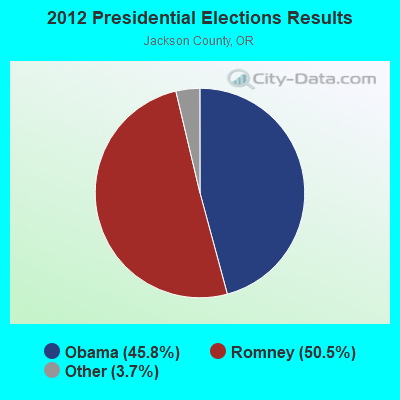
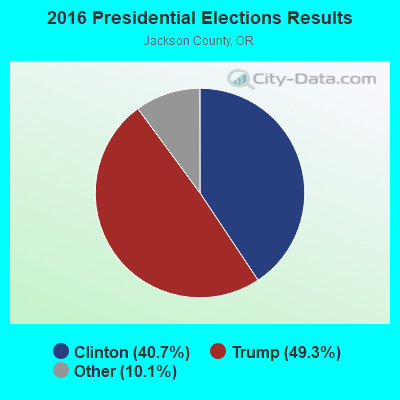
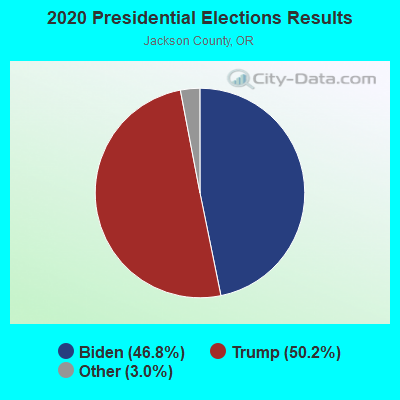
Graphs represent county-level data. Detailed 2008 Election Results
Religion statistics for Medford, OR (based on Jackson County data)
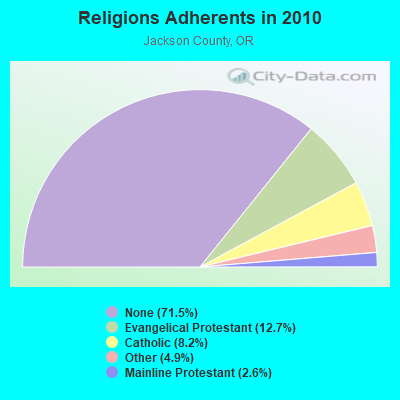
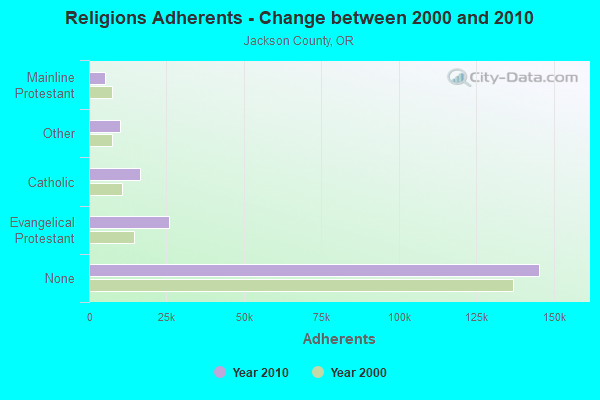
| Religion | Adherents | Congregations |
|---|---|---|
| Evangelical Protestant | 25,890 | 122 |
| Catholic | 16,565 | 6 |
| Other | 10,057 | 44 |
| Mainline Protestant | 5,252 | 23 |
| Orthodox | 100 | 2 |
| None | 145,342 | - |
Food Environment Statistics:
| Jackson County: | 1.66 / 10,000 pop. |
| State: | 2.03 / 10,000 pop. |
| Jackson County: | 0.30 / 10,000 pop. |
| Oregon: | 0.33 / 10,000 pop. |
| Jackson County: | 2.26 / 10,000 pop. |
| Oregon: | 2.01 / 10,000 pop. |
| This county: | 1.66 / 10,000 pop. |
| Oregon: | 1.69 / 10,000 pop. |
| Here: | 10.00 / 10,000 pop. |
| Oregon: | 9.93 / 10,000 pop. |
| Here: | 7.9% |
| Oregon: | 7.4% |
| This county: | 23.2% |
| Oregon: | 25.6% |
| Jackson County: | 11.1% |
| State: | 14.2% |
Health and Nutrition:
| Medford: | 49.7% |
| Oregon: | 49.6% |
| This city: | 46.4% |
| Oregon: | 46.8% |
| Medford: | 28.3 |
| State: | 28.5 |
| Medford: | 21.7% |
| Oregon: | 21.2% |
| Medford: | 10.5% |
| Oregon: | 10.1% |
| This city: | 6.9 |
| State: | 6.8 |
| Medford: | 32.9% |
| Oregon: | 33.3% |
| Medford: | 55.6% |
| State: | 56.5% |
| Here: | 77.7% |
| State: | 78.7% |
More about Health and Nutrition of Medford, OR Residents
| Local government employment and payroll (March 2022) | |||||
| Function | Full-time employees | Monthly full-time payroll | Average yearly full-time wage | Part-time employees | Monthly part-time payroll |
|---|---|---|---|---|---|
| Police Protection - Officers | 122 | $1,014,124 | $99,750 | 0 | $0 |
| Firefighters | 78 | $703,400 | $108,215 | 0 | $0 |
| Sewerage | 62 | $342,885 | $66,365 | 1 | $975 |
| Streets and Highways | 43 | $272,729 | $76,110 | 2 | $4,099 |
| Parks and Recreation | 31 | $171,751 | $66,484 | 54 | $51,491 |
| Financial Administration | 29 | $190,386 | $78,780 | 2 | $612 |
| Other and Unallocable | 24 | $146,554 | $73,277 | 4 | $4,743 |
| Police - Other | 23 | $122,257 | $63,786 | 16 | $40,504 |
| Other Government Administration | 23 | $190,552 | $99,418 | 0 | $0 |
| Judicial and Legal | 13 | $86,089 | $79,467 | 2 | $792 |
| Fire - Other | 5 | $28,314 | $67,954 | 1 | $1,820 |
| Housing and Community Development (Local) | 1 | $6,363 | $76,356 | 0 | $0 |
| Totals for Government | 454 | $3,275,405 | $86,575 | 82 | $105,035 |
Medford government finances - Expenditure in 2021 (per resident):
- Construction - Regular Highways: $9,990,000 ($116.77)
Sewerage: $4,902,000 ($57.30)
Water Utilities: $4,875,000 ($56.98)
Parks and Recreation: $2,849,000 ($33.30)
Central Staff Services: $83,000 ($0.97)
General Public Buildings: $73,000 ($0.85)
- Current Operations - Police Protection: $25,863,000 ($302.29)
Local Fire Protection: $16,364,000 ($191.27)
Water Utilities: $13,547,000 ($158.34)
Sewerage: $10,561,000 ($123.44)
Regular Highways: $9,318,000 ($108.91)
Parks and Recreation: $6,653,000 ($77.76)
General - Other: $6,247,000 ($73.02)
Central Staff Services: $5,525,000 ($64.58)
General Public Buildings: $2,407,000 ($28.13)
Financial Administration: $2,384,000 ($27.86)
Judicial and Legal Services: $2,202,000 ($25.74)
Protective Inspection and Regulation - Other: $2,168,000 ($25.34)
Housing and Community Development: $962,000 ($11.24)
Parking Facilities: $511,000 ($5.97)
Miscellaneous Commercial Activities - Other: $5,000 ($0.06)
- General - Interest on Debt: $16,958,000 ($198.21)
- Intergovernmental to Local - Other - Housing and Community Development: $166,000 ($1.94)
- Other Capital Outlay - Water Utilities: $3,361,000 ($39.28)
Central Staff Services: $1,667,000 ($19.48)
Police Protection: $944,000 ($11.03)
General - Other: $261,000 ($3.05)
Sewerage: $209,000 ($2.44)
Regular Highways: $183,000 ($2.14)
Parks and Recreation: $64,000 ($0.75)
Local Fire Protection: $31,000 ($0.36)
- Total Salaries and Wages: $45,833,000 ($535.71)
Medford government finances - Revenue in 2021 (per resident):
- Charges - Sewerage: $19,253,000 ($225.03)
Other: $3,602,000 ($42.10)
Parks and Recreation: $1,229,000 ($14.36)
Parking Facilities: $319,000 ($3.73)
Regular Highways: $194,000 ($2.27)
Miscellaneous Commercial Activities: $6,000 ($0.07)
- Federal Intergovernmental - Other: $1,209,000 ($14.13)
Housing and Community Development: $806,000 ($9.42)
Water Utilities: $241,000 ($2.82)
- Local Intergovernmental - Sewerage: $3,671,000 ($42.91)
Other: $2,417,000 ($28.25)
General Local Government Support: $220,000 ($2.57)
- Miscellaneous - Interest Earnings: $15,196,000 ($177.61)
Fines and Forfeits: $1,911,000 ($22.34)
Sale of Property: $1,723,000 ($20.14)
General Revenue - Other: $619,000 ($7.24)
Donations From Private Sources: $141,000 ($1.65)
Rents: $5,000 ($0.06)
- Revenue - Water Utilities: $21,760,000 ($254.34)
- State Intergovernmental - Highways: $6,495,000 ($75.92)
General Local Government Support: $3,086,000 ($36.07)
Other: $1,297,000 ($15.16)
Sewerage: $11,000 ($0.13)
- Tax - Property: $44,698,000 ($522.44)
Other License: $19,771,000 ($231.09)
Public Utilities Sales: $9,308,000 ($108.79)
Other Selective Sales: $8,232,000 ($96.22)
Occupation and Business License - Other: $738,000 ($8.63)
Medford government finances - Debt in 2021 (per resident):
- Long Term Debt - Beginning Outstanding - Public Debt for Private Purpose: $334,304,000 ($3907.43)
Retired Nonguaranteed - Public Debt for Private Purpose: $302,813,000 ($3539.35)
Outstanding Unspecified Public Purpose: $127,036,000 ($1484.83)
Issue, Unspecified Public Purpose: $99,313,000 ($1160.80)
Beginning Outstanding - Unspecified Public Purpose: $68,322,000 ($798.56)
Retired Unspecified Public Purpose: $40,600,000 ($474.54)
Outstanding Nonguaranteed - Industrial Revenue: $31,492,000 ($368.09)
Medford government finances - Cash and Securities in 2021 (per resident):
- Other Funds - Cash and Securities: $267,573,000 ($3127.46)
- Sinking Funds - Cash and Securities: $35,927,000 ($419.92)
| Businesses in Medford, OR | ||||
| Name | Count | Name | Count | |
|---|---|---|---|---|
| 7-Eleven | 4 | Marriott | 3 | |
| AT&T | 6 | MasterBrand Cabinets | 6 | |
| Ace Hardware | 3 | Maurices | 1 | |
| Aeropostale | 1 | Mazda | 1 | |
| Albertsons | 2 | McDonald's | 4 | |
| American Eagle Outfitters | 1 | Motel 6 | 2 | |
| Applebee's | 1 | Motherhood Maternity | 2 | |
| Arby's | 1 | New Balance | 6 | |
| Ashley Furniture | 1 | Nike | 17 | |
| BMW | 1 | Nissan | 1 | |
| Barnes & Noble | 1 | Office Depot | 1 | |
| Baskin-Robbins | 1 | Old Navy | 1 | |
| Bath & Body Works | 1 | Olive Garden | 1 | |
| Bed Bath & Beyond | 1 | Outback | 1 | |
| Best Western | 1 | Outback Steakhouse | 1 | |
| Blockbuster | 3 | Pac Sun | 1 | |
| Budget Car Rental | 2 | Panda Express | 1 | |
| Burger King | 2 | Papa John's Pizza | 2 | |
| Carl\s Jr. | 3 | Payless | 3 | |
| Catherines | 1 | Penske | 1 | |
| Chevrolet | 1 | PetSmart | 1 | |
| Chico's | 1 | Pier 1 Imports | 1 | |
| Circle K | 1 | Pizza Hut | 2 | |
| Cold Stone Creamery | 1 | Quality | 1 | |
| Coldwater Creek | 1 | Quiznos | 3 | |
| ColorTyme | 1 | RadioShack | 3 | |
| Comfort Inn | 2 | Ramada | 1 | |
| Costco | 1 | Red Lobster | 1 | |
| Curves | 1 | Red Robin | 1 | |
| Dairy Queen | 4 | Rite Aid | 1 | |
| Days Inn | 1 | Rodeway Inn | 1 | |
| Deb | 1 | SONIC Drive-In | 1 | |
| Eddie Bauer | 1 | Safeway | 2 | |
| Famous Footwear | 1 | Sears | 2 | |
| FedEx | 11 | Spencer Gifts | 1 | |
| Foot Locker | 1 | Sprint Nextel | 2 | |
| Ford | 1 | Staples | 1 | |
| GNC | 2 | Starbucks | 7 | |
| GameStop | 2 | Subaru | 1 | |
| Gap | 1 | Subway | 8 | |
| Gymboree | 1 | Super 8 | 1 | |
| H&R Block | 3 | T-Mobile | 6 | |
| Hilton | 2 | T.J.Maxx | 1 | |
| Holiday Inn | 2 | Taco Bell | 4 | |
| HomeTown Buffet | 1 | Target | 1 | |
| Honda | 1 | Toyota | 1 | |
| Hot Topic | 1 | Toys"R"Us | 2 | |
| JCPenney | 1 | Travelodge | 1 | |
| Jack In The Box | 3 | U-Haul | 6 | |
| Jones New York | 3 | U.S. Cellular | 5 | |
| Journeys | 1 | UPS | 21 | |
| Justice | 1 | Vans | 5 | |
| KFC | 2 | Verizon Wireless | 2 | |
| Kincaid | 2 | Victoria's Secret | 1 | |
| Knights Inn | 1 | Volkswagen | 1 | |
| Kohl's | 1 | Vons | 2 | |
| Kroger | 5 | Walgreens | 2 | |
| Lane Furniture | 2 | Walmart | 1 | |
| Little Caesars Pizza | 1 | Wendy's | 4 | |
| Lowe's | 1 | Wet Seal | 1 | |
| Macy's | 1 | YMCA | 1 | |
Strongest AM radio stations in Medford:
- KAPL (1300 AM; 20 kW; PHOENIX, OR; Owner: APPLEGATE MEDIA, INC.)
- KMED (1440 AM; 5 kW; MEDFORD, OR; Owner: CITICASTERS LICENSES, L.P.)
- KRTA (610 AM; 5 kW; MEDFORD, OR; Owner: OPUS BROADCASTING SYSTEMS, INC.)
- KLVB (730 AM; 1 kW; MEDFORD, OR)
- KCMX (880 AM; 1 kW; PHOENIX, OR; Owner: MAPLETON COMMUNICATIONS, LLC)
- KTMT (580 AM; 10 kW; ASHLAND, OR; Owner: MAPLETON COMMUNICATIONS, LLC)
- KAJO (1270 AM; 10 kW; GRANTS PASS, OR; Owner: GRANTS PASS BROADCASTING CORPORATION)
- KGRV (700 AM; 25 kW; WINSTON, OR; Owner: PACIFIC CASCADE COMMUNICATIONS CORP.)
- KSJK (1230 AM; 1 kW; TALENT, OR; Owner: ST. OF OR. ACT & ST. BD. OF HGR ED.)
- KAGI (930 AM; 5 kW; GRANTS PASS, OR; Owner: SOUTHERN OREGON STATE COLLEGE)
- KDUN (1030 AM; 50 kW; REEDSPORT, OR; Owner: PAMPLIN BROADCASTING-OREGON, INC.)
- KPNW (1120 AM; 50 kW; EUGENE, OR; Owner: CAPSTAR TX LIMITED PARTNERSHIP)
- KPOJ (620 AM; 50 kW; PORTLAND, OR; Owner: CITICASTERS LICENSES, L.P.)
Strongest FM radio stations in Medford:
- K254AD (98.7 FM; MEDFORD, OR; Owner: GRANTS PASS BROADCASTING CORPORATION)
- KZZE (106.3 FM; EAGLE POINT, OR; Owner: CITICASTERS LICENSES, L.P.)
- KLDZ (103.5 FM; MEDFORD, OR; Owner: CITICASTERS LICENSES, L.P.)
- KCMX-FM (101.9 FM; ASHLAND, OR; Owner: MAPLETON COMMUNICATIONS, LLC)
- KIFS (107.5 FM; ASHLAND, OR; Owner: CITICASTERS LICENSES, L.P.)
- K216DR (91.1 FM; CENTRAL POINT, OR; Owner: EDUCATIONAL MEDIA FOUNDATION)
- K209CP (89.7 FM; TALENT, OR; Owner: EDUCATIONAL MEDIA FOUNDATION)
- KSMF (89.1 FM; ASHLAND, OR; Owner: STATE OF OREGON/STATE BD HIGHER EDUC)
- K204CY (88.7 FM; MEDFORD, OR; Owner: EDUCATIONAL MEDIA FOUNDATION)
- KSRG (88.3 FM; ASHLAND, OR; Owner: ST. BOARD OF HIGHER ED/SO. OR ST COL)
- K227AA (93.3 FM; ASHLAND, ETC., OR; Owner: MAPLETON COMMUNICATIONS, LLC)
- K284AE (104.7 FM; ASHLAND, OR; Owner: MAPLETON COMMUNICATIONS, LLC)
- K214BO (90.7 FM; ASHLAND, OR; Owner: FAMILY STATIONS, INC.)
- KAKT (105.1 FM; PHOENIX, OR; Owner: MAPLETON COMMUNICATIONS, LLC)
- KTMT-FM (93.7 FM; MEDFORD, OR; Owner: MAPLETON COMMUNICATIONS, LLC)
- KRRM (94.7 FM; ROGUE RIVER, OR; Owner: SHIRLEY M. BELL)
- K290AF (105.9 FM; ROGUE RIVER, OR; Owner: CITICASTERS LICENSES, L.P.)
- KROG (96.9 FM; GRANTS PASS, OR; Owner: OPUS BROADCASTING SYSTEMS, INC.)
- K266AC (101.1 FM; ROGUE RIVER, OR; Owner: CITICASTERS LICENSES, L.P.)
- KLDR (98.3 FM; HARBECK-FRUITDALE, OR; Owner: GRANTS PASS BROADCASTING CORP.)
TV broadcast stations around Medford:
- KMVU (Channel 26; MEDFORD, OR; Owner: BROADCASTING LICENSES, L.P.)
- K07RQ (Channel 7; JACKSONVILLE, OR; Owner: SOUTHERN OREGON PUBLIC TELEVISION)
- K21BG (Channel 21; JACKSONVILLE, OR; Owner: SODA MOUNTAIN BROADCASTING, INC.)
- K03EI (Channel 3; TOLO, ETC., OR; Owner: CALIFORNIA OREGON BROADCASTING, INC.)
- K57EK (Channel 57; MEDFORD, OR; Owner: TRINITY BROADCASTING NETWORK)
- K02IC (Channel 2; JACKSONVILLE, OR; Owner: FREEDOM BROADCASTING OF OREGON, INC.)
- K34DJ (Channel 34; PHOENIX, ETC., OR; Owner: SOUTHERN OREGON PUBLIC TELEVISION)
- K13JR (Channel 13; JACKSONVILLE, ETC., OR; Owner: CALIFORNIA OREGON BROADCASTING, INC.)
- K04EO (Channel 4; ASHLAND, ETC., OR; Owner: FREEDOM BROADCASTING OF OREGON, INC.)
- K23EX (Channel 23; MEDFORD, OR; Owner: BETTER LIFE TELEVISION)
- K28GG (Channel 28; MEDFORD, OR; Owner: WATCHTV, INC.)
- K16CU (Channel 16; PHOENIX, TALENT, OR; Owner: FREEDOM BROADCASTING OF OREGON, INC.)
- K32DY (Channel 32; MEDFORD, OR; Owner: CALIFORNIA OREGON BROADCASTING, INC.)
- K39EF (Channel 39; ASHLAND, OR; Owner: WATCHTV, INC.)
- K52EE (Channel 52; MEDFORD, OR; Owner: BETTER LIFE TELEVISION)
- National Bridge Inventory (NBI) Statistics
- 75Number of bridges
- 1,283ft / 391mTotal length
- $21,979,000Total costs
- 1,310,791Total average daily traffic
- 132,320Total average daily truck traffic
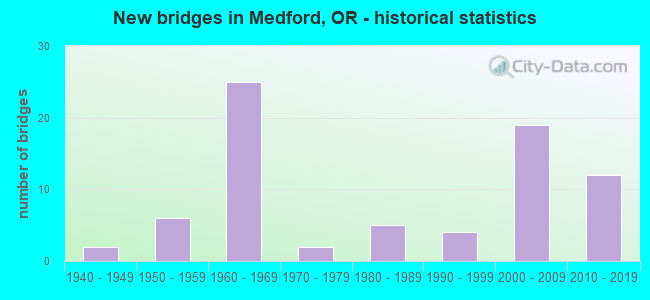
- New bridges - historical statistics
- 21940-1949
- 61950-1959
- 251960-1969
- 21970-1979
- 51980-1989
- 41990-1999
- 192000-2009
- 122010-2019
FCC Registered Antenna Towers: 410 (See the full list of FCC Registered Antenna Towers)
FCC Registered Commercial Land Mobile Towers: 12 (See the full list of FCC Registered Commercial Land Mobile Towers in Medford, OR)
FCC Registered Private Land Mobile Towers: 8 (See the full list of FCC Registered Private Land Mobile Towers)
FCC Registered Broadcast Land Mobile Towers: 86 (See the full list of FCC Registered Broadcast Land Mobile Towers)
FCC Registered Microwave Towers: 192 (See the full list of FCC Registered Microwave Towers in this town)
FCC Registered Paging Towers: 28 (See the full list of FCC Registered Paging Towers)
FCC Registered Maritime Coast & Aviation Ground Towers: 23 (See the full list of FCC Registered Maritime Coast & Aviation Ground Towers)
FCC Registered Amateur Radio Licenses: 701 (See the full list of FCC Registered Amateur Radio Licenses in Medford)
FAA Registered Aircraft Manufacturers and Dealers: 5 (See the full list of FAA Registered Manufacturers and Dealers in Medford)
FAA Registered Aircraft: 335 (See the full list of FAA Registered Aircraft)
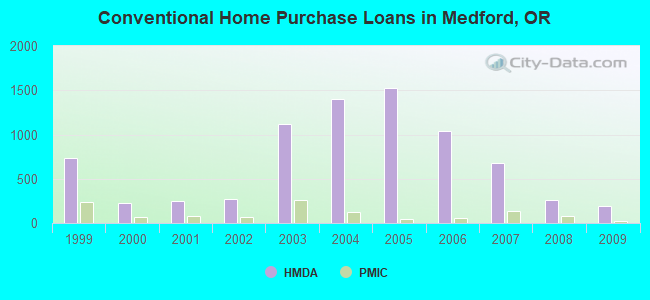
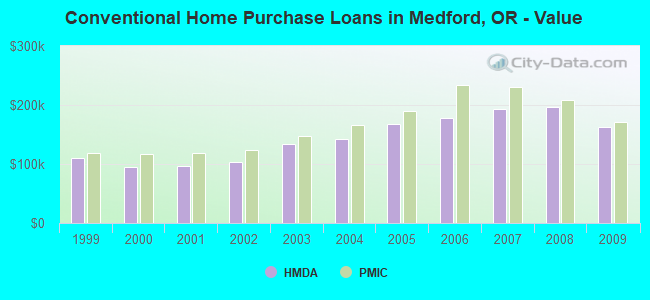
| Home Mortgage Disclosure Act Aggregated Statistics For Year 2009 (Based on 6 full and 6 partial tracts) | ||||||||||||||
| A) FHA, FSA/RHS & VA Home Purchase Loans | B) Conventional Home Purchase Loans | C) Refinancings | D) Home Improvement Loans | E) Loans on Dwellings For 5+ Families | F) Non-occupant Loans on < 5 Family Dwellings (A B C & D) | G) Loans On Manufactured Home Dwelling (A B C & D) | ||||||||
|---|---|---|---|---|---|---|---|---|---|---|---|---|---|---|
| Number | Average Value | Number | Average Value | Number | Average Value | Number | Average Value | Number | Average Value | Number | Average Value | Number | Average Value | |
| LOANS ORIGINATED | 273 | $169,378 | 187 | $162,701 | 842 | $185,362 | 28 | $126,761 | 6 | $2,012,813 | 107 | $153,308 | 5 | $165,302 |
| APPLICATIONS APPROVED, NOT ACCEPTED | 23 | $152,821 | 20 | $145,490 | 96 | $195,436 | 2 | $105,465 | 0 | $0 | 12 | $131,828 | 2 | $88,765 |
| APPLICATIONS DENIED | 51 | $169,280 | 34 | $137,009 | 335 | $199,565 | 20 | $56,868 | 2 | $1,102,045 | 42 | $162,967 | 10 | $97,791 |
| APPLICATIONS WITHDRAWN | 39 | $164,657 | 26 | $191,345 | 188 | $188,948 | 6 | $45,987 | 2 | $422,500 | 32 | $146,603 | 2 | $125,210 |
| FILES CLOSED FOR INCOMPLETENESS | 5 | $139,082 | 13 | $144,883 | 55 | $193,609 | 7 | $66,939 | 0 | $0 | 10 | $160,490 | 1 | $81,820 |
Detailed mortgage data for all 12 tracts in Medford, OR
| Private Mortgage Insurance Companies Aggregated Statistics For Year 2009 (Based on 5 full and 6 partial tracts) | ||||||
| A) Conventional Home Purchase Loans | B) Refinancings | C) Non-occupant Loans on < 5 Family Dwellings (A & B) | ||||
|---|---|---|---|---|---|---|
| Number | Average Value | Number | Average Value | Number | Average Value | |
| LOANS ORIGINATED | 21 | $171,599 | 12 | $222,461 | 0 | $0 |
| APPLICATIONS APPROVED, NOT ACCEPTED | 7 | $217,199 | 7 | $275,316 | 1 | $235,040 |
| APPLICATIONS DENIED | 8 | $234,798 | 3 | $196,787 | 2 | $277,500 |
| APPLICATIONS WITHDRAWN | 2 | $246,940 | 0 | $0 | 0 | $0 |
| FILES CLOSED FOR INCOMPLETENESS | 3 | $147,117 | 1 | $181,020 | 0 | $0 |
2002 - 2018 National Fire Incident Reporting System (NFIRS) incidents
- Fire incident types reported to NFIRS in Medford, OR
- 2,22644.4%Outside Fires
- 1,78735.6%Structure Fires
- 74314.8%Mobile Property/Vehicle Fires
- 2575.1%Other
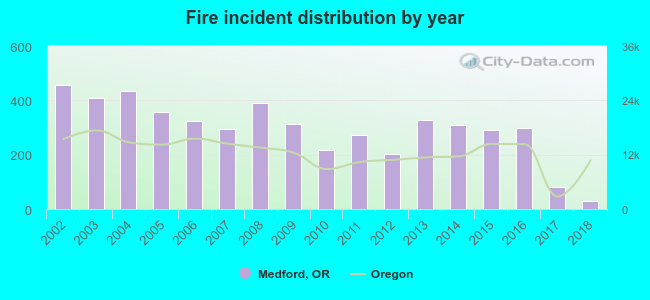 Based on the data from the years 2002 - 2018 the average number of fire incidents per year is 295. The highest number of reported fires - 457 took place in 2002, and the least - 31 in 2018. The data has a dropping trend.
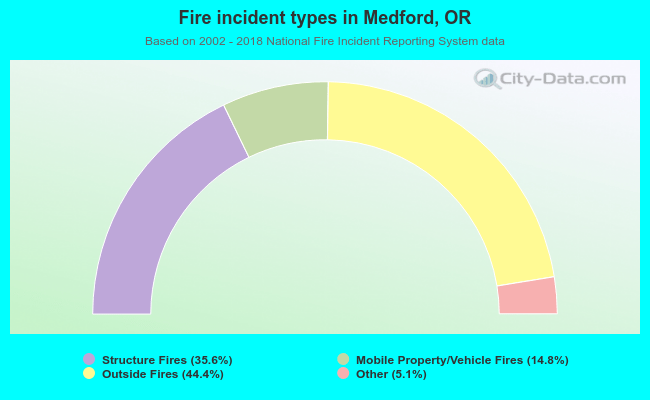 When looking into fire subcategories, the most reports belonged to: Outside Fires (44.4%), and Structure Fires (35.6%).
Fire-safe hotels and motels in Medford, Oregon:
- Shilo Inn Medford, 2111 Biddle Rd, Medford, Oregon 97504 , Phone: (541) 641-6565, Fax: (541) 776-0417
- Red Lion Hotel Medford, 200 N Riverside, Medford, Oregon 97501 , Phone: (541) 779-5811, Fax: (541) 776-4133
- Comfort Inn North, 2280 Biddle Rd, Medford, Oregon 97504 , Phone: (541) 772-9500, Fax: (541) 772-0772
- Comfort Inn South, 60 E Stewart Ave, Medford, Oregon 97501 , Phone: (541) 772-8000, Fax: (541) 772-8208
- Holiday Inn Express, 1501 S Pacific Hwy, Medford, Oregon 97501 , Phone: (541) 732-1400, Fax: (541) 732-0700
- Quality Inn & Suites, 1950 Biddle Rd, Medford, Oregon 97504 , Phone: (541) 779-0050, Fax: (541) 245-0116
- Hampton Inn, 1122 Morrow Rd, Medford, Oregon 97501 , Phone: (541) 779-0660, Fax: (541) 779-0670
- Courtyard By Marriott Medford Airport, 600 Airport Rd, Medford, Oregon 97501 , Phone: (541) 772-5656, Fax: (541) 772-3475
- 12 other hotels and motels
| Most common first names in Medford, OR among deceased individuals | ||
| Name | Count | Lived (average) |
|---|---|---|
| John | 573 | 76.2 years |
| William | 549 | 75.6 years |
| Robert | 506 | 73.1 years |
| Mary | 419 | 81.0 years |
| James | 407 | 74.3 years |
| Charles | 346 | 75.6 years |
| George | 305 | 76.2 years |
| Dorothy | 255 | 79.3 years |
| Helen | 223 | 81.8 years |
| Richard | 217 | 71.2 years |
| Most common last names in Medford, OR among deceased individuals | ||
| Last name | Count | Lived (average) |
|---|---|---|
| Smith | 276 | 78.1 years |
| Johnson | 201 | 77.5 years |
| Miller | 127 | 78.3 years |
| Brown | 119 | 78.8 years |
| Davis | 115 | 73.4 years |
| Anderson | 108 | 78.1 years |
| Jones | 105 | 77.2 years |
| Wilson | 104 | 78.5 years |
| Williams | 101 | 75.9 years |
| Nelson | 87 | 80.1 years |
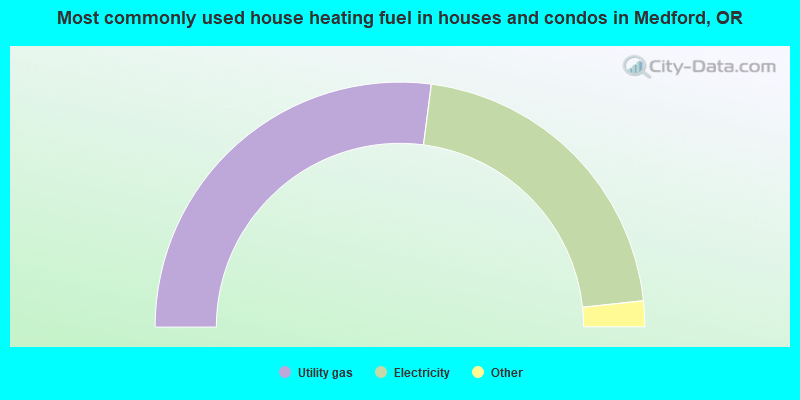
- 54.1%Utility gas
- 42.5%Electricity
- 2.0%Wood
- 0.4%Bottled, tank, or LP gas
- 0.3%Solar energy
- 0.3%Other fuel
- 0.2%Fuel oil, kerosene, etc.
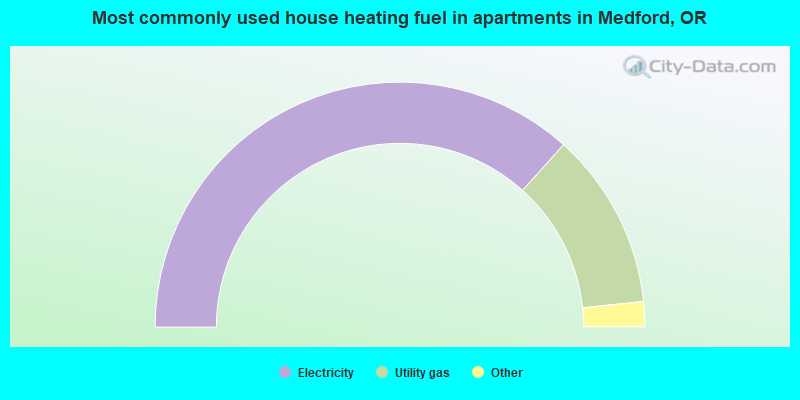
- 73.3%Electricity
- 23.4%Utility gas
- 1.1%Wood
- 1.0%No fuel used
- 0.5%Coal or coke
- 0.4%Bottled, tank, or LP gas
- 0.2%Other fuel
- 0.1%Fuel oil, kerosene, etc.
Medford compared to Oregon state average:
- Unemployed percentage significantly below state average.
- Hispanic race population percentage above state average.
- Length of stay since moving in below state average.
Medford on our top lists:
- #9 on the list of "Top 101 cities with the largest differences between morning and afternoon humidity (population 50,000+)"
- #9 on the list of "Top 101 cities with the largest humidity differences during a year (population 50,000+)"
- #10 on the list of "Top 101 cities with the highest number of thefts per 100,000 residents, excludes tourist destinations and others with a lot of outsiders visiting based on city industries data (population 50,000+)"
- #11 on the list of "Top 101 cities with largest percentage of males in occupations: community and social service occupations (population 50,000+)"
- #11 on the list of "Top 101 cities with largest percentage of females in occupations: personal care and service occupations (population 50,000+)"
- #16 on the list of "Top 101 cities with largest percentage of males in occupations: farming, fishing, and forestry occupations (population 50,000+)"
- #21 on the list of "Top 101 cities with largest percentage of females in industries: health care and social assistance (population 50,000+)"
- #24 on the list of "Top 101 cities with largest percentage of males in industries: agriculture, forestry, fishing and hunting (population 50,000+)"
- #26 on the list of "Top 101 cities with the highest number of arson incidents per 100,000 residents, excludes tourist destinations and others with a lot of outsiders visiting based on city industries data (population 50,000+)"
- #26 on the list of "Top 101 cities with the highest average snowfall in a year (population 50,000+)"
- #28 on the list of "Top 101 cities with largest percentage of females in occupations: food preparation and serving related occupations (population 50,000+)"
- #33 on the list of "Top 101 cities with largest percentage of females in industries: agriculture, forestry, fishing and hunting (population 50,000+)"
- #39 on the list of "Top 101 cities with largest percentage of males in occupations: food preparation and serving related occupations (population 50,000+)"
- #40 on the list of "Top 101 cities with largest percentage of females in occupations: farming, fishing, and forestry occupations (population 50,000+)"
- #65 on the list of "Top 101 cities with the largest city-data.com crime index per police officer (population 50,000+)"
- #68 on the list of "Top 101 cities with largest percentage of females in industries: retail trade (population 50,000+)"
- #77 on the list of "Top 100 cities with shortest commuting times (pop. 50,000+)"
- #78 on the list of "Top 101 cities with the largest city-data.com crime index increase from 2002 to 2012 (population 50,000+)"
- #78 on the list of "Top 101 cities with the lowest minimum monthly morning or afternoon humidity (population 50,000+)"
- #83 on the list of "Top 101 cities with largest percentage of females in industries: accommodation and food services (population 50,000+)"
- #26 on the list of "Top 101 counties with the largest increase in the number of births per 1000 residents 2000-2006 to 2007-2013 (pop 50,000+)"
- #34 on the list of "Top 101 counties with the highest percentage of residents that exercised in the past month"
- #46 on the list of "Top 101 counties with highest percentage of residents voting for 3rd party candidates in the 2012 Presidential Election (pop. 50,000+)"
- #68 on the list of "Top 101 counties with the highest percentage of residents that drank alcohol in the past 30 days"
- #71 on the list of "Top 101 counties with the highest percentage of residents that smoked 100+ cigarettes in their lives"

|
|
Total of 114 patent applications in 2008-2024.