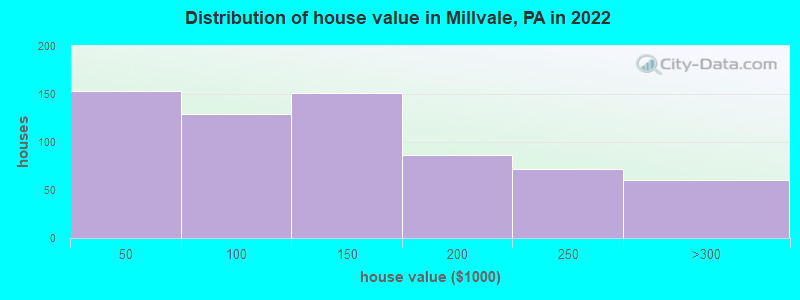
Estimated median house or condo value in 2022: $119,155 (it was $44,700 in 2000)
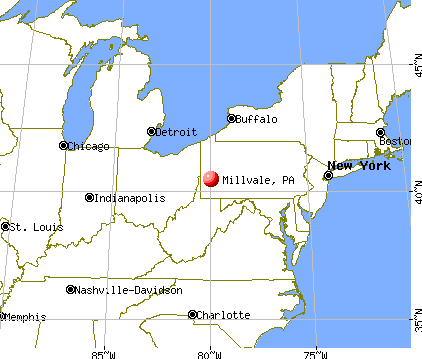
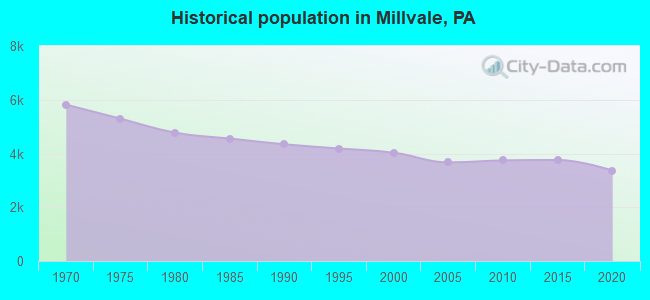
Millvale:
$119,155
PA:
$245,500
Mean prices in 2022:all housing units: $266,371; detached houses: $267,242; townhouses or other attached units: $265,484; in 2-unit structures: $230,538; in 3-to-4-unit structures: $231,495; in 5-or-more-unit structures: $287,359; mobile homes: $84,841; occupied boats, rvs, vans, etc.: $316,945
Median gross rent in 2022: $893.
March 2022 cost of living index in Millvale: 92.6 (less than average, U.S. average is 100)
Percentage of residents living in poverty in 2022: 13.8%
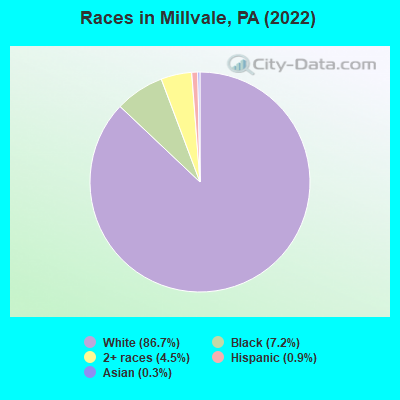
(13.1% for White Non-Hispanic residents, 22.5% for Black residents, 26.7% for Hispanic or Latino residents, 7.7% for two or more races residents)
According to our research of Pennsylvania and other state lists, there were 2 registered sex offenders living in Millvale, Pennsylvania as of May 11, 2024. The ratio of all residents to sex offenders in Millvale is 1,849 to 1. The ratio of registered sex offenders to all residents in this city is much lower than the state average.
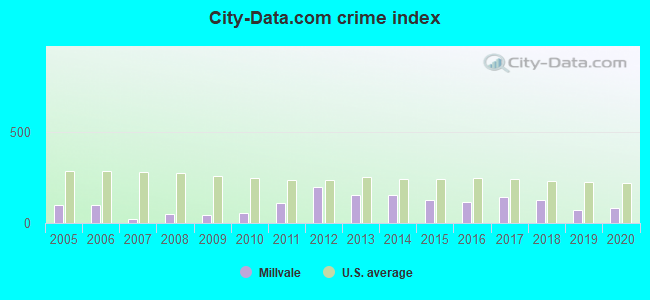
Crime rates in Millvale by year
Type
2009
2010
2011
2012
2013
2014
2015
2016
2017
2018
2019
2020
Murders (per 100,000)
0 (0.0)
0 (0.0)
0 (0.0)
0 (0.0)
0 (0.0)
0 (0.0)
0 (0.0)
0 (0.0)
0 (0.0)
0 (0.0)
0 (0.0)
0 (0.0)
Rapes (per 100,000)
0 (0.0)
0 (0.0)
0 (0.0)
2 (53.2)
1 (26.8)
1 (26.9)
0 (0.0)
1 (27.2)
0 (0.0)
0 (0.0)
0 (0.0)
0 (0.0)
Robberies (per 100,000)
0 (0.0)
0 (0.0)
0 (0.0)
0 (0.0)
3 (80.4)
0 (0.0)
1 (27.0)
0 (0.0)
2 (55.0)
0 (0.0)
0 (0.0)
0 (0.0)
Assaults (per 100,000)
0 (0.0)
1 (26.7)
7 (186.4)
8 (212.9)
0 (0.0)
5 (134.4)
5 (135.1)
1 (27.2)
1 (27.5)
4 (110.0)
2 (55.9)
3 (82.3)
Burglaries (per 100,000)
14 (387.0)
17 (454.1)
19 (505.9)
24 (638.6)
18 (482.2)
0 (0.0)
0 (0.0)
1 (27.2)
2 (55.0)
5 (137.6)
0 (0.0)
1 (27.4)
Thefts (per 100,000)
9 (248.8)
19 (507.5)
26 (692.2)
59 (1,570)
70 (1,875)
99 (2,661)
85 (2,296)
77 (2,094)
100 (2,749)
84 (2,311)
53 (1,481)
53 (1,454)
Auto thefts (per 100,000)
4 (110.6)
0 (0.0)
3 (79.9)
1 (26.6)
0 (0.0)
0 (0.0)
0 (0.0)
1 (27.2)
4 (110.0)
1 (27.5)
1 (27.9)
2 (54.9)
Arson (per 100,000)
0 (0.0)
0 (0.0)
0 (0.0)
0 (0.0)
0 (0.0)
0 (0.0)
0 (0.0)
0 (0.0)
0 (0.0)
0 (0.0)
0 (0.0)
1 (27.4)
City-Data.com crime index
45.9
57.4
106.8
194.8
154.3
154.8
127.0
115.0
144.6
126.3
72.7
80.9
The City-Data.com crime index weighs serious crimes and violent crimes more heavily. Higher means more crime, U.S. average is 246.1. It adjusts for the number of visitors and daily workers commuting into cities.
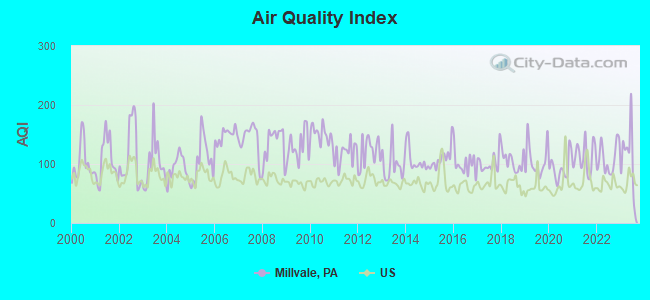
Air Quality Index (AQI) level in 2023 was 112. This is significantly worse than average.
City:
112
U.S.:
73
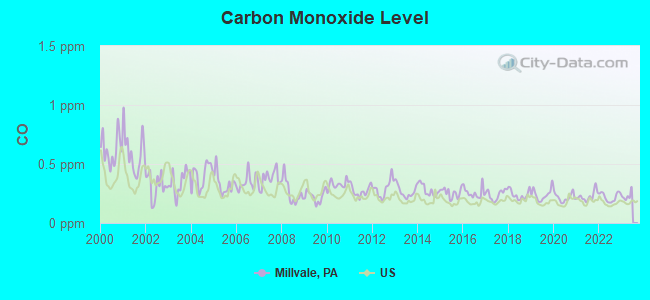
Carbon Monoxide (CO) [ppm] level in 2022 was 0.221. This is about average.Closest monitor was 1.4 miles away from the city center.
City:
0.221
U.S.:
0.251
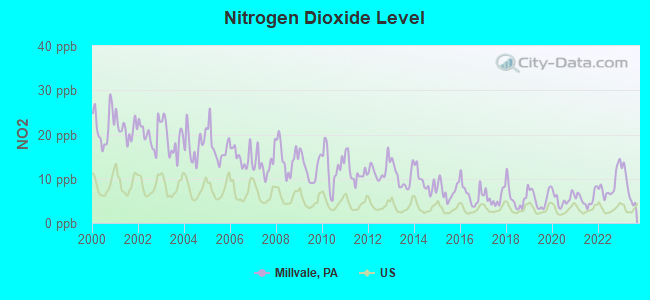
Nitrogen Dioxide (NO2) [ppb] level in 2023 was 8.16. This is significantly worse than average.Closest monitor was 1.4 miles away from the city center.
City:
8.16
U.S.:
5.11
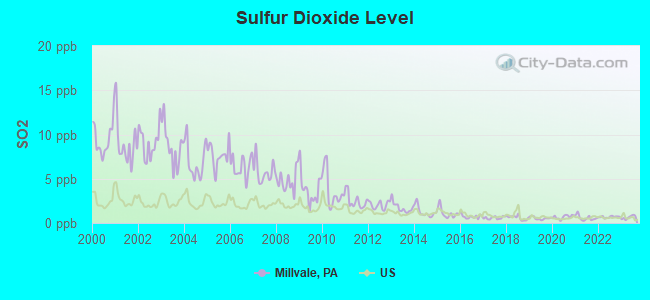
Sulfur Dioxide (SO2) [ppb] level in 2023 was 0.640. This is significantly better than average.Closest monitor was 1.4 miles away from the city center.
City:
0.640
U.S.:
1.515
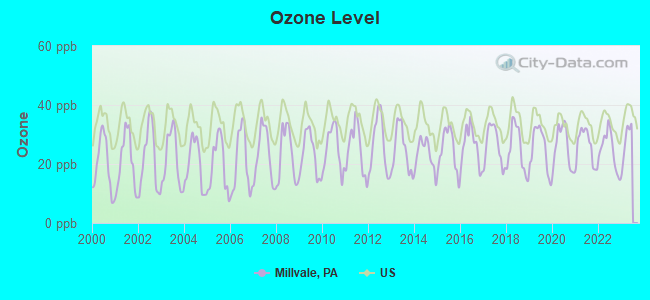
Ozone [ppb] level in 2022 was 24.7. This is better than average.Closest monitor was 1.4 miles away from the city center.
City:
24.7
U.S.:
33.3
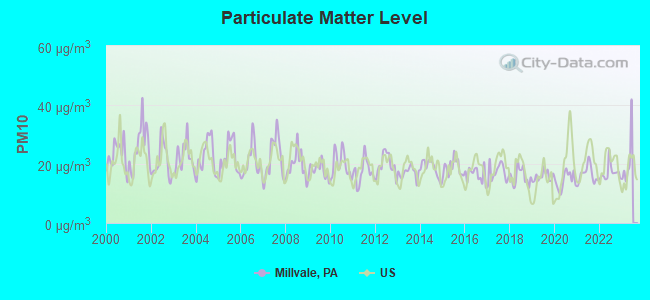
Particulate Matter (PM10) [µg/m3] level in 2022 was 17.0. This is about average.Closest monitor was 1.4 miles away from the city center.
City:
17.0
U.S.:
19.2
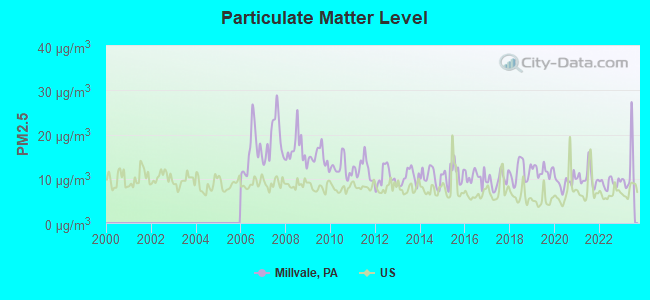
Particulate Matter (PM2.5) [µg/m3] level in 2023 was 12.0. This is significantly worse than average.Closest monitor was 1.4 miles away from the city center.
City:
12.0
U.S.:
8.1
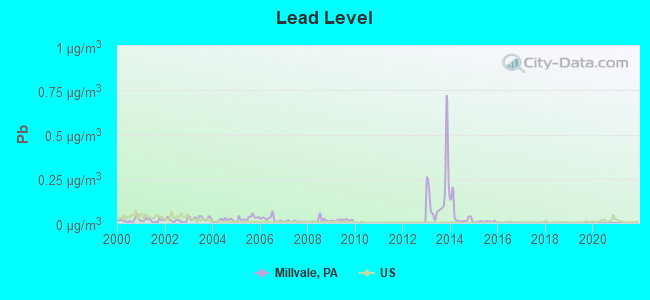
Lead (Pb) [µg/m3] level in 2016 was 0.00226. This is significantly better than average.Closest monitor was 2.9 miles away from the city center.
City:
0.00226
U.S.:
0.00931
Tornado activity:
Millvale-area historical tornado activity is near Pennsylvania state average. It is 18% smaller than the overall U.S. average.
On 6/3/1980, a category F4 (max. wind speeds 207-260 mph) tornado 17.2 miles away from the Millvale borough center injured 140 peopleand causedbetween $50,000,000 and $500,000,000 in damages.
On 8/3/1963, a category F3 (max. wind speeds 158-206 mph) tornado 12.3 miles away from the borough center killed 2 peopleand injured 70 peopleand causedbetween $5,000,000 and $50,000,000 in damages.
Earthquake activity:
Millvale-area historical earthquake activity is significantly above Pennsylvania state average. It is 56% smaller than the overall U.S. average.
On 9/25/1998 at 19:52:52, a magnitude 5.2 (4.8 MB, 4.3 MS, 5.2 LG, 4.5 MW, Depth: 3.1 mi, Class: Moderate, Intensity: VI - VII) earthquake occurred 73.1 miles away from Millvale center On 8/23/2011 at 17:51:04, a magnitude 5.8 (5.8 MW, Depth: 3.7 mi) earthquake occurred 208.8 miles away from Millvale center On 1/31/1986 at 16:46:43, a magnitude 5.0 (5.0 MB) earthquake occurred 99.1 miles away from the city center On 7/27/1980 at 18:52:21, a magnitude 5.2 (5.1 MB, 4.7 MS, 5.0 UK, 5.2 UK) earthquake occurred 264.3 miles away from Millvale center On 12/31/2011 at 20:05:01, a magnitude 4.0 (4.0 ML, Depth: 3.1 mi, Class: Light, Intensity: IV - V) earthquake occurred 57.7 miles away from the city center On 8/9/2020 at 12:07:37, a magnitude 5.1 (5.1 MW, Depth: 4.7 mi) earthquake occurred 283.7 miles away from Millvale center Magnitude types: regional Lg-wave magnitude (LG), body-wave magnitude (MB), local magnitude (ML), surface-wave magnitude (MS), moment magnitude (MW)
Natural disasters:
The number of natural disasters in Allegheny County (15) is near the US average (15). Major Disasters (Presidential) Declared: 12 Emergencies Declared: 3
Causes of natural disasters: Floods: 6, Storms: 6, Winter Storms: 3, Hurricanes: 2, Tornadoes: 2, Blizzard: 1, Snowfall: 1, Snowstorm: 1, Tropical Depression: 1, Tropical Storm: 1, Other: 1 (Note: some incidents may be assigned to more than one category).
Hospitals and medical centers near Millvale:
ST FRANCIS MEDICAL CENTER (Hospital, about 2 miles away; PITTSBURGH, PA)
ST FRANCIS MED CTR TCU (Nursing Home, about 2 miles away; PITTSBURGH, PA)
CANTERBURY PLACE (Nursing Home, about 2 miles away; PITTSBURGH, PA)
WESTERN PSYCHIATRIC INSTI AND CLINIC (Hospital, about 2 miles away; PITTSBURGH, PA)
SKY VUE TERRACE (Nursing Home, about 2 miles away; PITTSBURGH, PA)
CHILDREN'S HOSPITAL OF PITTSBURGH OF UPMC (Hospital, Childrens, about 2 miles away; PITTSBURGH, PA)
DAVITA - PITTSBURGH DIALYSIS (Dialysis Facility, about 2 miles away; PITTSBURGH, PA)
Amtrak station near Millvale:
3 miles: PITTSBURGH (1100 LIBERTY AVE.) . Services: ticket office, fully wheelchair accessible, enclosed waiting area, public restrooms, public payphones, vending machines, ATM, free short-term parking, paid long-term parking, call for car rental service, call for taxi service, intercity bus service, public transit connection.
Colleges/universities with over 2000 students nearest to Millvale:
The Art Institute of Pittsburgh-Online Division (about 3 miles; Pittsburgh, PA; Full-time enrollment: 11,040)
University of Pittsburgh-Pittsburgh Campus (about 3 miles; Pittsburgh, PA; FT enrollment: 27,137)
Carnegie Mellon University (about 4 miles; Pittsburgh, PA; FT enrollment: 14,186)
Community College of Allegheny County (about 4 miles; Pittsburgh, PA; FT enrollment: 13,486)
Duquesne University (about 4 miles; Pittsburgh, PA; FT enrollment: 8,211)
Point Park University (about 4 miles; Pittsburgh, PA; FT enrollment: 3,525)
Pittsburgh Technical Institute (about 13 miles; Oakdale, PA; FT enrollment: 2,805)
Notable locations in Millvale: Millvale Borough Hall (A), Millvale Police Department (B), Whales Tale Millvale Center (C), Millvale Volunteer Fire Department Station 191 (D), Pittsburgh Junction Stock Yard Station (E). Display/hide their locations on the map
Churches in Millvale include: Saint Nicholas Church of Millvale (A), Saint Johns Lutheran Church (B), First United Church of Christ (C). Display/hide their locations on the map
Birthplace of: Anne Jackson - Film actor, Al Wukits - Football linebacker.
Allegheny County has a predicted average indoor radon screening level greater than 4 pCi/L (pico curies per liter) - Highest Potential
Average household size:
This borough:
2.1 people
Pennsylvania:
2.5 people
Percentage of family households:
This borough:
48.6%
Whole state:
65.0%
Percentage of households with unmarried partners:
This borough:
10.1%
Whole state:
6.6%
Likely homosexual households (counted as self-reported same-sex unmarried-partner households)
Lesbian couples: 0.2% of all households
Gay men: 0.3% of all households
12 people in emergency and transitional shelters (with sleeping facilities) for people experiencing homelessness in 2010
7 people in group homes intended for adults in 2010
People in group quarters in Millvale in 2000:
19 people in other noninstitutional group quarters
18 people in nursing homes
7 people in other group homes
6 people in homes for the mentally retarded
Banks with branches in Millvale (2011 data):
PNC Bank, National Association: Millvale Branch at 400 Grant Avenue, branch established on 1965/04/26. Info updated 2012/03/20: Bank assets: $263,309.6 mil, Deposits: $197,343.0 mil, headquarters in Wilmington, DE, positive income, Commercial Lending Specialization, 3085 total offices, Holding Company: Pnc Financial Services Group, Inc., The
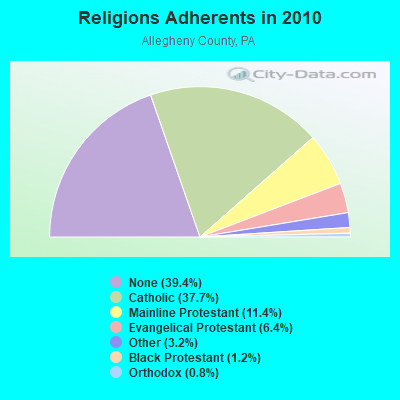
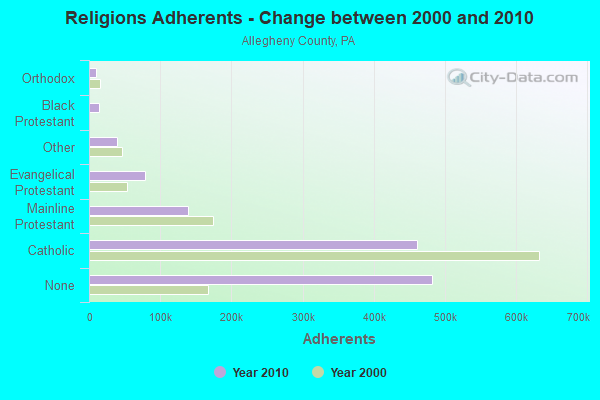
Religion statistics for Millvale, PA (based on Allegheny County data)
Religion
Adherents
Congregations
Catholic
460,672
183
Mainline Protestant
139,551
414
Evangelical Protestant
78,101
349
Other
38,781
98
Black Protestant
14,268
75
Orthodox
9,606
29
None
482,369
-
Source: Clifford Grammich, Kirk Hadaway, Richard Houseal, Dale E.Jones, Alexei Krindatch, Richie Stanley and Richard H.Taylor. 2012. 2010 U.S.Religion Census: Religious Congregations & Membership Study. Association of Statisticians of American Religious Bodies. Jones, Dale E., et al. 2002. Congregations and Membership in the United States 2000. Nashville, TN: Glenmary Research Center. Graphs represent county-level data
Alan L Lincoln, End Of Irwin Lane (Twr 1) (Lat: 40.490833 Lon: -79.981944), Type: 87.2, Overall height: 86.3 m, Registrant: Sheridan Broadcasting Corp., Pitts-burgh, Phone: (412) 456-4070
Alan L Lincoln, End Of Irwin Lane (Twr 3) (Lat: 40.490833 Lon: -79.981944), Type: 87.2, Overall height: 86.3 m, Registrant: Sheridan Broadcasting Corp., Pitts-burgh, Phone: (412) 456-4070
MATTHEW J GORSICH, End Of Irwin Lane (Twr 1) (Lat: 40.490833 Lon: -79.981944), Type: 87.2, Overall height: 86.3 m, Registrant: Sheridan Broadcasting Corp., Pitts-burgh, Phone: (412) 456-4070
MATTHEW J GORSICH, End Of Irwin Lane (Twr 3) (Lat: 40.490833 Lon: -79.981944), Type: 87.2, Overall height: 86.3 m, Registrant: Sheridan Broadcasting Corp., Pitts-burgh, Phone: (412) 456-4070
End Of Irwin Lane (Twr 1) (Lat: 40.490833 Lon: -79.981944), Type: 87.2, Overall height: 86.3 m, Registrant: Sheridan Broadcasting Corp., Pitts-burgh, Phone: (412) 456-4070
End Of Irwin Lane (Twr 3) (Lat: 40.490833 Lon: -79.981944), Type: 87.2, Overall height: 86.3 m, Registrant: Sheridan Broadcasting Corp., Pitts-burgh, Phone: (412) 456-4070
FCC Registered Broadcast Land Mobile Towers:
1
501 Lincoln Avenue (Lat: 40.497917 Lon: -79.973889), Type: Building, Structure height: 12.5 m, Overall height: 13.7 m, Call Sign: WQBT373, Assigned Frequencies: 1427.57 MHz, Grant Date: 09/18/2014, Expiration Date: 12/09/2024, Certifier: R J Green, Registrant: Duquesne Light Company, 2839 New Beaver Avenue Mail Drop N2-Doc, Pittsburgh, PA 15233, Phone: (412) 383-7100
FCC Registered Microwave Towers:
1
224 North Ave (Lat: 40.481444 Lon: -79.974194), Overall height: 8.5 m, Call Sign: WPNK662, Assigned Frequencies: 945.000 MHz, Grant Date: 08/17/1993, Expiration Date: 08/01/2030, Registrant: Cbs, 1725 Desales Street Nw, Suite 501, Washington, DC 20036, Phone: (202) 457-4602, Email:
FCC Registered Amateur Radio Licenses:
1
Call Sign: W3PFX, Grant Date: 09/29/1987, Expiration Date: 09/29/1997, Cancellation Date: 09/30/1999, Registrant: Milford N Flack, 207 Meade St, Millvale, PA 15209
Home Mortgage Disclosure Act Aggregated Statistics For Year 2009 (Based on 1 full tract)
A) FHA, FSA/RHS & VA Home Purchase Loans
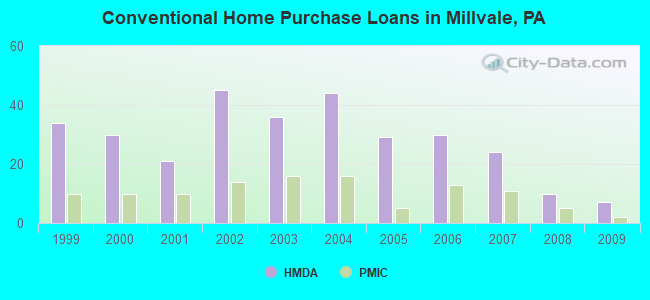
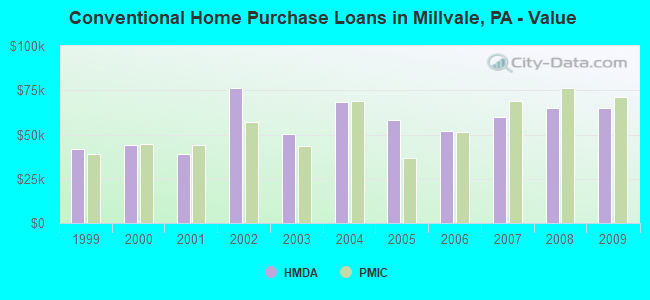
B) Conventional Home Purchase Loans
C) Refinancings
D) Home Improvement Loans
F) Non-occupant Loans on < 5 Family Dwellings (A B C & D)
Number
Average Value
Number
Average Value
Number
Average Value
Number
Average Value
Number
Average Value
LOANS ORIGINATED
15
$61,867
7
$64,857
9
$73,444
8
$19,875
2
$75,500
APPLICATIONS APPROVED, NOT ACCEPTED
2
$61,000
0
$0
1
$55,000
0
$0
0
$0
APPLICATIONS DENIED
2
$47,000
2
$46,500
18
$68,556
7
$28,429
4
$65,500
APPLICATIONS WITHDRAWN
3
$69,333
7
$52,571
13
$76,538
1
$69,000
3
$50,667
FILES CLOSED FOR INCOMPLETENESS
0
$0
0
$0
0
$0
0
$0
0
$0
Aggregated Statistics For Year 2008 (Based on 1 full tract)
A) FHA, FSA/RHS & VA Home Purchase Loans
B) Conventional Home Purchase Loans
C) Refinancings
D) Home Improvement Loans
F) Non-occupant Loans on < 5 Family Dwellings (A B C & D)
Number
Average Value
Number
Average Value
Number
Average Value
Number
Average Value
Number
Average Value
LOANS ORIGINATED
9
$69,444
10
$65,000
24
$63,375
7
$18,143
8
$50,750
APPLICATIONS APPROVED, NOT ACCEPTED
0
$0
2
$58,000
6
$40,833
1
$46,000
0
$0
APPLICATIONS DENIED
1
$68,000
2
$35,000
45
$75,422
12
$24,750
3
$35,667
APPLICATIONS WITHDRAWN
5
$52,200
2
$45,500
11
$67,091
0
$0
1
$70,000
FILES CLOSED FOR INCOMPLETENESS
0
$0
1
$28,000
2
$40,000
2
$17,500
0
$0
Aggregated Statistics For Year 2007 (Based on 1 full tract)
A) FHA, FSA/RHS & VA Home Purchase Loans
B) Conventional Home Purchase Loans
C) Refinancings
D) Home Improvement Loans
F) Non-occupant Loans on < 5 Family Dwellings (A B C & D)
G) Loans On Manufactured Home Dwelling (A B C & D)
Number
Average Value
Number
Average Value
Number
Average Value
Number
Average Value
Number
Average Value
Number
Average Value
LOANS ORIGINATED
11
$63,818
24
$59,708
19
$57,789
24
$22,083
12
$42,917
0
$0
APPLICATIONS APPROVED, NOT ACCEPTED
0
$0
2
$44,500
5
$72,000
2
$29,500
0
$0
1
$17,000
APPLICATIONS DENIED
1
$69,000
11
$49,273
69
$67,348
14
$43,071
7
$51,857
0
$0
APPLICATIONS WITHDRAWN
0
$0
2
$35,000
10
$40,500
4
$36,250
4
$26,250
0
$0
FILES CLOSED FOR INCOMPLETENESS
0
$0
0
$0
4
$68,500
0
$0
0
$0
0
$0
Aggregated Statistics For Year 2006 (Based on 1 full tract)
A) FHA, FSA/RHS & VA Home Purchase Loans
B) Conventional Home Purchase Loans
C) Refinancings
D) Home Improvement Loans
F) Non-occupant Loans on < 5 Family Dwellings (A B C & D)
G) Loans On Manufactured Home Dwelling (A B C & D)
Number
Average Value
Number
Average Value
Number
Average Value
Number
Average Value
Number
Average Value
Number
Average Value
LOANS ORIGINATED
6
$58,167
30
$51,800
44
$50,432
21
$26,571
20
$44,700
0
$0
APPLICATIONS APPROVED, NOT ACCEPTED
0
$0
2
$56,000
18
$45,167
4
$11,250
2
$47,000
0
$0
APPLICATIONS DENIED
0
$0
18
$58,167
76
$61,566
25
$24,920
8
$31,250
1
$8,000
APPLICATIONS WITHDRAWN
0
$0
6
$48,000
27
$70,185
3
$20,000
3
$43,333
0
$0
FILES CLOSED FOR INCOMPLETENESS
0
$0
0
$0
1
$25,000
1
$6,000
1
$6,000
0
$0
Aggregated Statistics For Year 2005 (Based on 1 full tract)
A) FHA, FSA/RHS & VA Home Purchase Loans
B) Conventional Home Purchase Loans
C) Refinancings
D) Home Improvement Loans
F) Non-occupant Loans on < 5 Family Dwellings (A B C & D)
G) Loans On Manufactured Home Dwelling (A B C & D)
Number
Average Value
Number
Average Value
Number
Average Value
Number
Average Value
Number
Average Value
Number
Average Value
LOANS ORIGINATED
1
$32,000
29
$58,000
41
$53,024
13
$28,308
8
$45,625
0
$0
APPLICATIONS APPROVED, NOT ACCEPTED
0
$0
3
$70,000
15
$60,533
3
$51,667
3
$53,333
0
$0
APPLICATIONS DENIED
0
$0
15
$49,333
74
$65,027
21
$14,810
14
$26,643
1
$5,000
APPLICATIONS WITHDRAWN
0
$0
4
$65,250
28
$69,786
5
$80,200
2
$50,500
0
$0
FILES CLOSED FOR INCOMPLETENESS
0
$0
2
$90,000
8
$57,500
0
$0
1
$104,000
0
$0
Aggregated Statistics For Year 2004 (Based on 1 full tract)
A) FHA, FSA/RHS & VA Home Purchase Loans
B) Conventional Home Purchase Loans
C) Refinancings
D) Home Improvement Loans
E) Loans on Dwellings For 5+ Families
F) Non-occupant Loans on < 5 Family Dwellings (A B C & D)
G) Loans On Manufactured Home Dwelling (A B C & D)
Number
Average Value
Number
Average Value
Number
Average Value
Number
Average Value
Number
Average Value
Number
Average Value
Number
Average Value
LOANS ORIGINATED
6
$57,500
44
$68,545
73
$49,918
16
$16,875
3
$265,333
25
$37,160
1
$13,000
APPLICATIONS APPROVED, NOT ACCEPTED
1
$69,000
9
$51,889
15
$53,333
3
$27,333
0
$0
3
$37,000
0
$0
APPLICATIONS DENIED
1
$63,000
15
$57,000
81
$61,160
32
$22,969
0
$0
13
$21,462
2
$37,500
APPLICATIONS WITHDRAWN
0
$0
4
$92,000
25
$53,920
6
$39,167
0
$0
1
$30,000
0
$0
FILES CLOSED FOR INCOMPLETENESS
0
$0
1
$25,000
20
$79,700
3
$15,000
0
$0
5
$40,400
0
$0
Aggregated Statistics For Year 2003 (Based on 1 full tract)
A) FHA, FSA/RHS & VA Home Purchase Loans
B) Conventional Home Purchase Loans
C) Refinancings
D) Home Improvement Loans
F) Non-occupant Loans on < 5 Family Dwellings (A B C & D)
Number
Average Value
Number
Average Value
Number
Average Value
Number
Average Value
Number
Average Value
LOANS ORIGINATED
6
$52,167
36
$50,333
89
$53,180
22
$18,727
19
$43,053
APPLICATIONS APPROVED, NOT ACCEPTED
0
$0
5
$49,600
23
$58,696
3
$37,667
2
$24,000
APPLICATIONS DENIED
1
$76,000
13
$55,846
99
$61,828
21
$22,286
15
$39,267
APPLICATIONS WITHDRAWN
1
$75,000
2
$37,500
32
$64,375
4
$28,250
2
$49,500
FILES CLOSED FOR INCOMPLETENESS
1
$30,000
0
$0
7
$61,429
0
$0
0
$0
Aggregated Statistics For Year 2002 (Based on 1 full tract)
A) FHA, FSA/RHS & VA Home Purchase Loans
B) Conventional Home Purchase Loans
C) Refinancings
D) Home Improvement Loans
F) Non-occupant Loans on < 5 Family Dwellings (A B C & D)
Number
Average Value
Number
Average Value
Number
Average Value
Number
Average Value
Number
Average Value
LOANS ORIGINATED
10
$54,000
45
$76,178
64
$57,984
16
$20,875
16
$43,250
APPLICATIONS APPROVED, NOT ACCEPTED
0
$0
8
$56,250
26
$66,500
7
$15,143
6
$47,667
APPLICATIONS DENIED
0
$0
11
$52,000
69
$47,913
22
$11,227
5
$36,000
APPLICATIONS WITHDRAWN
0
$0
3
$47,000
27
$52,519
4
$13,500
1
$12,000
FILES CLOSED FOR INCOMPLETENESS
0
$0
1
$38,000
21
$57,524
2
$67,000
0
$0
Aggregated Statistics For Year 2001 (Based on 1 full tract)
A) FHA, FSA/RHS & VA Home Purchase Loans
B) Conventional Home Purchase Loans
C) Refinancings
D) Home Improvement Loans
F) Non-occupant Loans on < 5 Family Dwellings (A B C & D)
Number
Average Value
Number
Average Value
Number
Average Value
Number
Average Value
Number
Average Value
LOANS ORIGINATED
8
$51,375
21
$38,762
61
$48,311
23
$14,522
12
$46,083
APPLICATIONS APPROVED, NOT ACCEPTED
1
$45,000
5
$34,600
28
$48,107
7
$20,000
3
$44,333
APPLICATIONS DENIED
0
$0
9
$45,667
81
$49,123
33
$20,455
7
$55,571
APPLICATIONS WITHDRAWN
1
$57,000
5
$43,200
33
$57,242
4
$29,000
0
$0
FILES CLOSED FOR INCOMPLETENESS
0
$0
0
$0
10
$41,900
0
$0
0
$0
Aggregated Statistics For Year 2000 (Based on 1 full tract)
A) FHA, FSA/RHS & VA Home Purchase Loans
B) Conventional Home Purchase Loans
C) Refinancings
D) Home Improvement Loans
F) Non-occupant Loans on < 5 Family Dwellings (A B C & D)
Number
Average Value
Number
Average Value
Number
Average Value
Number
Average Value
Number
Average Value
LOANS ORIGINATED
11
$50,818
30
$44,100
38
$39,553
17
$14,353
8
$40,875
APPLICATIONS APPROVED, NOT ACCEPTED
2
$41,500
6
$25,333
23
$44,391
6
$27,167
6
$50,167
APPLICATIONS DENIED
1
$54,000
10
$32,900
44
$38,773
22
$12,364
3
$28,333
APPLICATIONS WITHDRAWN
1
$69,000
6
$73,500
22
$55,682
4
$26,000
2
$93,500
FILES CLOSED FOR INCOMPLETENESS
0
$0
3
$45,667
12
$44,750
0
$0
1
$27,000
Aggregated Statistics For Year 1999 (Based on 1 partial tract)
A) FHA, FSA/RHS & VA Home Purchase Loans
B) Conventional Home Purchase Loans
C) Refinancings
D) Home Improvement Loans
E) Loans on Dwellings For 5+ Families
F) Non-occupant Loans on < 5 Family Dwellings (A B C & D)
Detailed PMIC statistics for the following Tracts:4270.00
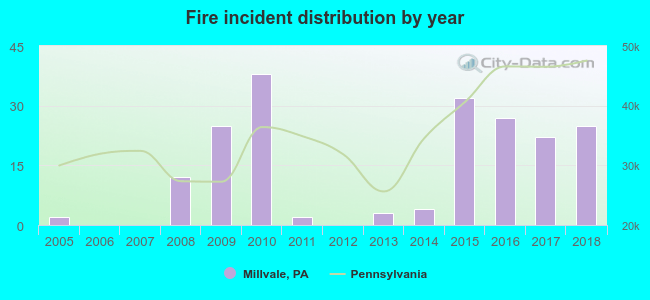
2005 - 2018 National Fire Incident Reporting System (NFIRS) incidents
Based on the data from the years 2005 - 2018 the average number of fire incidents per year is 14. The highest number of reported fires - 38 took place in 2010, and the least - 0 in 2006. The data has a rising trend.
When looking into fire subcategories, the most reports belonged to: Structure Fires (53.1%), and Other (32.8%).
Fire incident types reported to NFIRS in Millvale, PA
#12 on the list of "Top 101 cities with the most residents born in Other Northern Africa (population 500+)"
#25 on the list of "Top 100 high-educated but low-earning cities"
#87 on the list of "Top 101 cities with the largest percentage of people in dormitories (population 1,000+)"
#87 on the list of "Top 101 cities with the largest percentage of people in group homes (population 1,000+)"
#87 on the list of "Top 101 cities with the largest percentage of people in hospitals/wards, hospices, and schools for the handicapped (population 1,000+)"
#87 on the list of "Top 101 cities with the largest percentage of people in long-term care (population 1,000+)"
#87 on the list of "Top 101 cities with the largest percentage of people in military quarters (population 1,000+)"
#87 on the list of "Top 101 cities with the largest percentage of people in noninstitutionalized settings (population 1,000+)"
#87 on the list of "Top 101 cities with the largest percentage of people in on base quarters (population 1,000+)"
#87 on the list of "Top 101 cities with the largest percentage of people in schools, hospitals, or wards for the physically handicapped (population 1,000+)"
#94 on the list of "Top 101 cities with the largest percentage of people in wards in military hospitals for patients who have no usual home elsewhere (population 1,000+)"
#3 on the list of "Top 101 counties with the most Mainline Protestant congregations"
#3 on the list of "Top 101 counties with the most Catholic congregations"
#6 on the list of "Top 101 counties with the most Orthodox congregations"
#8 on the list of "Top 101 counties with the most Mainline Protestant adherents"
#15 on the list of "Top 101 counties with the most Catholic adherents (pop. 50,000+)"


 Recent articles from our blog. Our writers, many of them Ph.D. graduates or candidates, create easy-to-read articles on a wide variety of topics.

 (2.9 miles


 Based on the data from the years 2005 - 2018 the average number of fire incidents per year is 14. The highest number of reported fires - 38 took place in 2010, and the least - 0 in 2006. The data has a rising trend.
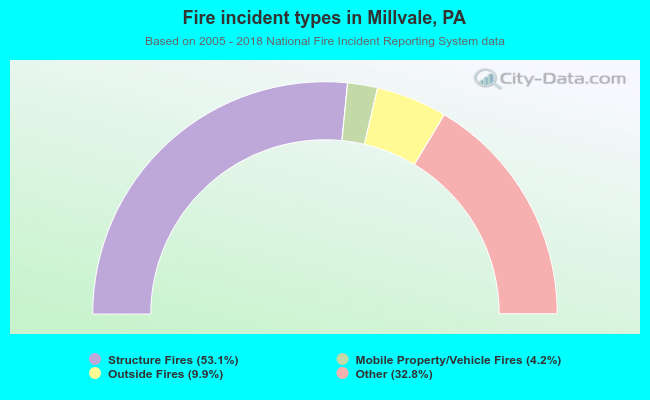 When looking into fire subcategories, the most reports belonged to: Structure Fires (53.1%), and Other (32.8%).