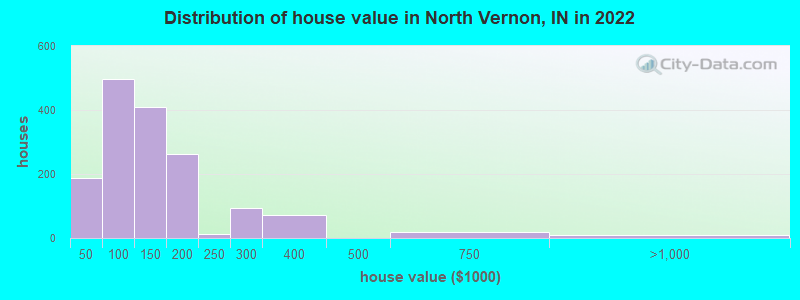
Estimated median house or condo value in 2022: $119,468 (it was $70,300 in 2000)
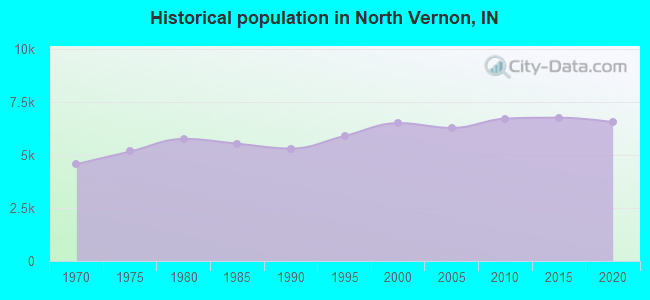
North Vernon:
$119,468
IN:
$208,700
Mean prices in 2022:all housing units: $170,349; detached houses: $194,144; townhouses or other attached units: $162,921; in 2-unit structures: $216,491; mobile homes: $48,621
Median gross rent in 2022: $858.
March 2022 cost of living index in North Vernon: 76.8 (low, U.S. average is 100)
Percentage of residents living in poverty in 2022: 20.0%
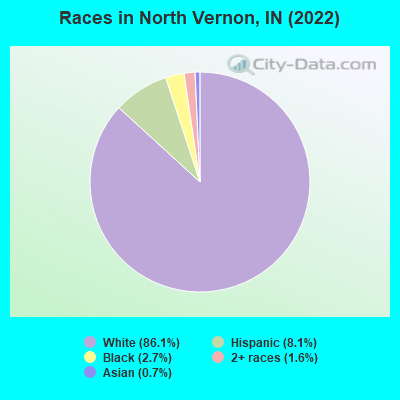
(16.3% for White Non-Hispanic residents, 1.4% for Black residents, 46.2% for Hispanic or Latino residents, 36.6% for two or more races residents)
According to our research of Indiana and other state lists, there was 1 registered sex offender living in North Vernon, Indiana as of April 29, 2024. The ratio of all residents to sex offenders in North Vernon is 7,181 to 1. The ratio of registered sex offenders to all residents in this city is much lower than the state average.
Crime rates in North Vernon by year
Type
2009
2010
2011
2012
2013
2014
2015
2016
2017
2018
2019
2020
2021
2022
Murders (per 100,000)
0 (0.0)
0 (0.0)
1 (14.8)
0 (0.0)
0 (0.0)
0 (0.0)
0 (0.0)
0 (0.0)
0 (0.0)
0 (0.0)
0 (0.0)
0 (0.0)
1 (15.2)
0 (0.0)
Rapes (per 100,000)
8 (127.6)
3 (44.6)
2 (29.6)
3 (45.0)
2 (30.1)
0 (0.0)
2 (30.2)
2 (30.3)
0 (0.0)
5 (74.7)
2 (29.9)
4 (59.9)
4 (60.7)
2 (31.0)
Robberies (per 100,000)
1 (16.0)
0 (0.0)
3 (44.4)
0 (0.0)
0 (0.0)
0 (0.0)
1 (15.1)
1 (15.2)
3 (43.9)
2 (29.9)
2 (29.9)
1 (15.0)
1 (15.2)
0 (0.0)
Assaults (per 100,000)
5 (79.8)
2 (29.7)
2 (29.6)
4 (59.9)
20 (301.2)
3 (44.8)
4 (60.5)
26 (394.0)
15 (219.4)
5 (74.7)
10 (149.7)
7 (104.9)
20 (303.3)
7 (108.4)
Burglaries (per 100,000)
31 (494.5)
43 (639.1)
56 (828.2)
56 (839.1)
38 (572.3)
14 (209.0)
22 (332.5)
36 (545.5)
19 (277.9)
16 (239.0)
11 (164.6)
13 (194.8)
3 (45.5)
14 (216.9)
Thefts (per 100,000)
209 (3,334)
198 (2,943)
217 (3,209)
229 (3,431)
338 (5,090)
85 (1,269)
98 (1,481)
224 (3,394)
158 (2,311)
148 (2,211)
110 (1,646)
117 (1,753)
103 (1,562)
106 (1,642)
Auto thefts (per 100,000)
5 (79.8)
14 (208.1)
7 (103.5)
4 (59.9)
16 (241.0)
3 (44.8)
2 (30.2)
0 (0.0)
0 (0.0)
0 (0.0)
0 (0.0)
0 (0.0)
10 (151.7)
25 (387.3)
Arson (per 100,000)
0 (0.0)
0 (0.0)
0 (0.0)
0 (0.0)
0 (0.0)
0 (0.0)
0 (0.0)
0 (0.0)
0 (0.0)
0 (0.0)
0 (0.0)
0 (0.0)
1 (15.2)
0 (0.0)
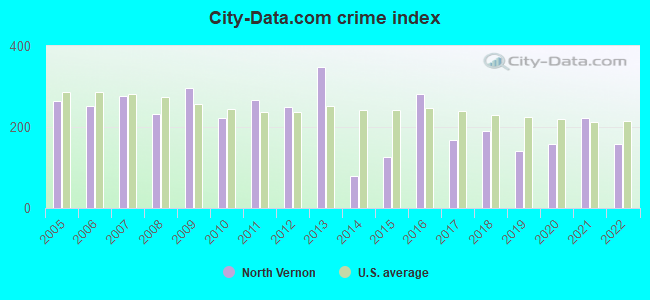
City-Data.com crime index
297.2
220.7
267.1
248.7
347.3
77.9
125.8
281.6
168.9
188.8
140.2
157.2
221.9
158.3
The City-Data.com crime index weighs serious crimes and violent crimes more heavily. Higher means more crime, U.S. average is 246.1. It adjusts for the number of visitors and daily workers commuting into cities.
Latest news from North Vernon, IN collected exclusively by city-data.com from local newspapers, TV, and radio stations
Ancestries: American (29.2%), Irish (14.0%), German (10.4%), English (6.9%), Polish (3.8%), Italian (1.2%).
Current Local Time: EST time zone
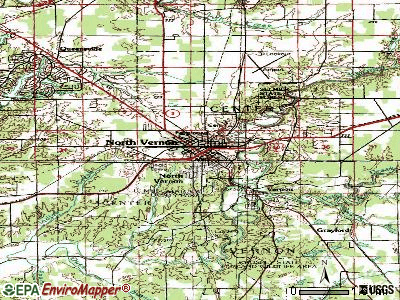
Elevation: 725 feet
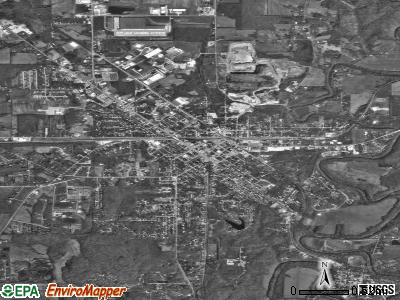
Land area: 4.39 square miles.
Population density: 1,495 people per square mile (low).
165 residents are foreign born (1.8% Latin America, 0.4% Asia).
This city:
2.4%
Indiana:
5.6%
Median real estate property taxes paid for housing units with mortgages in 2022: $698 (0.6%) Median real estate property taxes paid for housing units with no mortgage in 2022: $703 (0.5%)
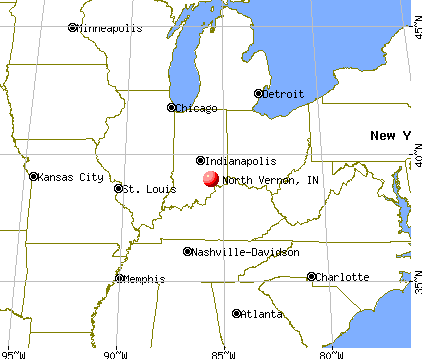
Nearest city with pop. 50,000+: Bloomington, IN (49.6 miles , pop. 69,291).
Nearest city with pop. 200,000+: Louisville, KY (54.1 miles , pop. 256,231).
Nearest city with pop. 1,000,000+: Chicago, IL (223.9 miles , pop. 2,896,016).
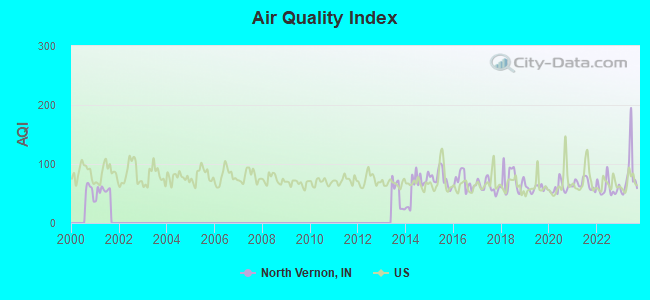
Air Quality Index (AQI) level in 2023 was 82.3. This is about average.
City:
82.3
U.S.:
72.6
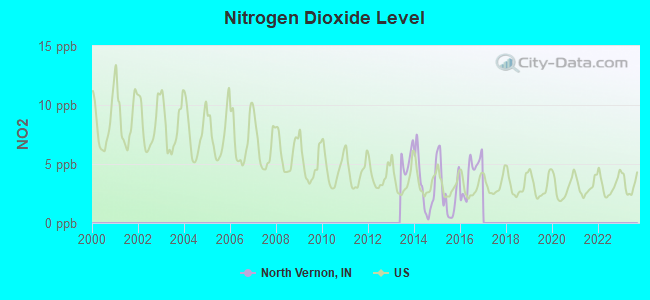
Nitrogen Dioxide (NO2) [ppb] level in 2016 was 4.12. This is better than average.Closest monitor was 20.2 miles away from the city center.
City:
4.12
U.S.:
5.11
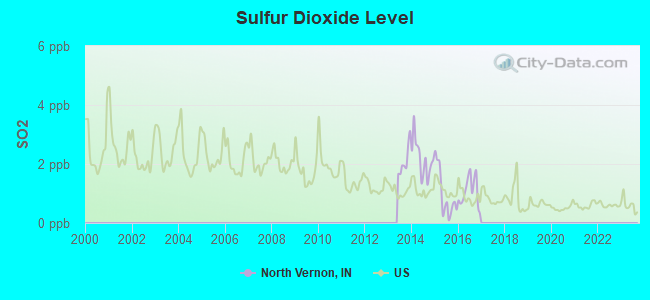
Sulfur Dioxide (SO2) [ppb] level in 2016 was 1.08. This is significantly better than average.Closest monitor was 20.2 miles away from the city center.
City:
1.08
U.S.:
1.51
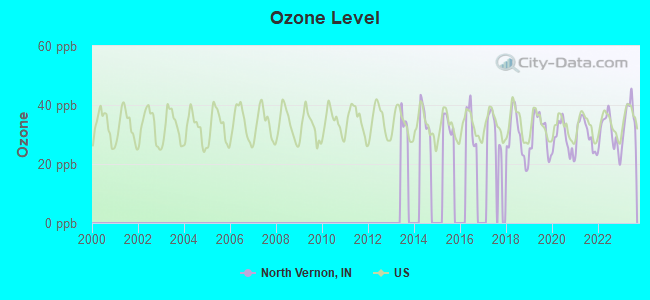
Ozone [ppb] level in 2023 was 35.8. This is about average.Closest monitor was 21.4 miles away from the city center.
City:
35.8
U.S.:
33.3
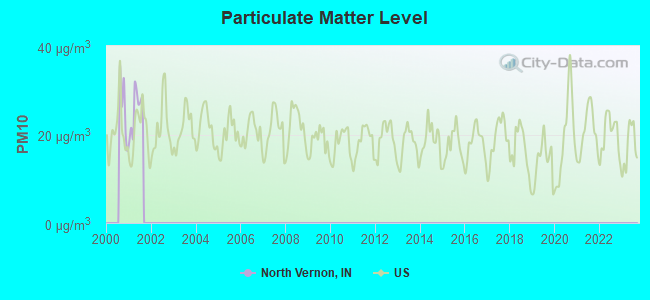
Particulate Matter (PM10) [µg/m3] level in 2001 was 25.4. This is worse than average.Closest monitor was 20.3 miles away from the city center.
City:
25.4
U.S.:
19.2
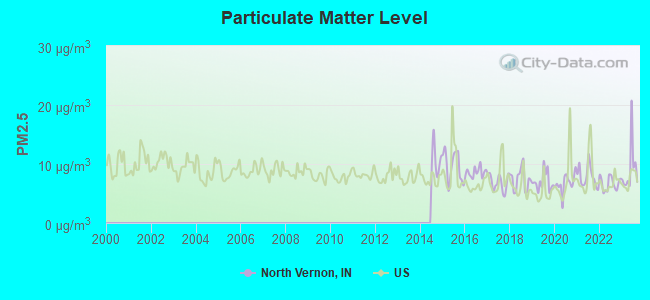
Particulate Matter (PM2.5) [µg/m3] level in 2023 was 9.01. This is about average.Closest monitor was 21.4 miles away from the city center.
City:
9.01
U.S.:
8.11
Tornado activity:
North Vernon-area historical tornado activity is near Indiana state average. It is 101% greater than the overall U.S. average.
On 4/3/1974, a category F5 (max. wind speeds 261-318 mph) tornado 26.2 miles away from the North Vernon city center killed 6 peopleand injured 86 peopleand causedbetween $50,000,000 and $500,000,000 in damages.
On 4/3/1974, a category F4 (max. wind speeds 207-260 mph) tornado 10.0 miles away from the city center killed 4 peopleand injured 17 peopleand causedbetween $5,000,000 and $50,000,000 in damages.
Earthquake activity:
North Vernon-area historical earthquake activity is significantly above Indiana state average. It is 87% greater than the overall U.S. average.
On 4/18/2008 at 09:36:59, a magnitude 5.4 (5.1 MB, 4.8 MS, 5.4 MW, 5.2 MW, Class: Moderate, Intensity: VI - VII) earthquake occurred 127.7 miles away from North Vernon center On 7/27/1980 at 18:52:21, a magnitude 5.2 (5.1 MB, 4.7 MS, 5.0 UK, 5.2 UK) earthquake occurred 106.6 miles away from North Vernon center On 4/18/2008 at 09:36:59, a magnitude 5.2 (5.2 MW, Depth: 8.9 mi) earthquake occurred 127.7 miles away from North Vernon center On 6/10/1987 at 23:48:54, a magnitude 5.1 (4.9 MB, 4.4 MS, 4.6 MS, 5.1 LG) earthquake occurred 122.1 miles away from North Vernon center On 6/18/2002 at 17:37:15, a magnitude 5.0 (4.3 MB, 4.6 MW, 5.0 LG) earthquake occurred 136.1 miles away from North Vernon center On 4/18/2008 at 15:14:16, a magnitude 4.8 (4.5 MB, 4.8 MW, 4.6 MW, Class: Light, Intensity: IV - V) earthquake occurred 125.2 miles away from North Vernon center Magnitude types: regional Lg-wave magnitude (LG), body-wave magnitude (MB), surface-wave magnitude (MS), moment magnitude (MW)
Natural disasters:
The number of natural disasters in Jennings County (15) is near the US average (15). Major Disasters (Presidential) Declared: 11 Emergencies Declared: 3
Causes of natural disasters: Floods: 8, Storms: 6, Tornadoes: 4, Winter Storms: 2, Blizzard: 1, Hurricane: 1, Snow: 1, Snowstorm: 1, Wind: 1, Other: 1 (Note: some incidents may be assigned to more than one category).
Hospitals and medical centers in North Vernon:
AWS (100 S COUNTY ROAD 265 W)
DEVELOPMENTAL SERVICES INC (113 JENNINGS ST)
DEVELOPMENTAL SERVICES INC (3100 W PRIVATE RD 385 N)
ST VINCENT JENNINGS HOSPITAL INC (Voluntary non-profit - Church, 301 HENRY ST)
VOCA CORPORATION OF INDIANA (153 WHITE OAK WAY)
COMMUNITY CARE CENTER OF NORTH VERNON (1200 O & M AVENUE, PO BOX 640)
HICKORY CREEK AT NORTH VERNON (801 NORTH ELM STREET)
JENNINGS HEALTHCARE CENTER (701 HENRY ST)
DAVITA - NORTH VERNON DIALYSIS CENTER (2340 NORTH STATE HWY 7., STE A)
Airports and heliports located in North Vernon:
North Vernon Airport (OVO) (Runways: 2, Air Taxi Ops: 195, Itinerant Ops: 1,417, Local Ops: 3,281, Military Ops: 1,548)
JENNINGS COUNTY PUBLIC LIBRARY (Operating income: $541,043; Location: 2375 NORTH STATE HWY 3; 70,795 books; 2,054 audio materials; 5,448 video materials; 3 local licensed databases; 37 state licensed databases; 186 print serial subscriptions)
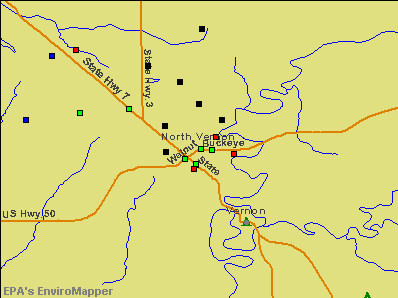
Notable locations in North Vernon: North Vernon Fire Department Station 1 (A), North Vernon Fire Department Station 2 (B). Display/hide their locations on the map
Tourist attractions: Hayden Historical Museum Inc (6715 West County Road 150 North), College Cooperative Southeast (Cultural Attractions- Events- & Facilities; 2375 North State Highway 3), Parks & Recreation Department Of North Vernon (Recreation Areas; 604 N State St), Jennings County Visitor's Center (325 North State Highway 7).
Hotels: Comfort Inn North Vernon (150 Fdr Drive), Comfort Inn (150 Fdr Drive).
Birthplace of: Emil Huhn - Baseball player, Harry Smith (infielder) - Baseball player, Michael Varick - College football player (Middle Tenn. St. Blue Raiders).
Jennings County has a predicted average indoor radon screening level greater than 4 pCi/L (pico curies per liter) - Highest Potential
Drinking water stations with addresses in North Vernon and their reported violations in the past:
JENNINGS WATER, INC. (Population served: 7,169, Groundwater):
Past monitoring violations:
Monitoring and Reporting (DBP) - Between OCT-2007 and DEC-2007, Contaminant: TTHM. Follow-up actions: St Public Notif requested (FEB-04-2008), St Violation/Reminder Notice (FEB-04-2008), St Compliance achieved (FEB-13-2008)
Follow-up Or Routine LCR Tap M/R - In OCT-01-2009, Contaminant: Lead and Copper Rule. Follow-up actions: St Public Notif requested (NOV-09-2009), St Violation/Reminder Notice (NOV-09-2009), St Public Notif received (NOV-17-2009), St Compliance achieved (DEC-30-2010)
HAYDEN WATER ASSOCIATION (Population served: 2,395, Purch surface water):
Past health violations:
MCL, Average - Between JAN-2006 and MAR-2006, Contaminant: Total Haloacetic Acids (HAA5). Follow-up actions: St Violation/Reminder Notice (2 times from JAN-11-2006 to JAN-11-2006), St Public Notif requested (JAN-11-2006), St Public Notif received (JAN-31-2006), St Compliance achieved (JUL-20-2006)
MCL, Average - Between JAN-2006 and MAR-2006, Contaminant: TTHM. Follow-up actions: St Violation/Reminder Notice (2 times from JAN-11-2006 to JAN-11-2006), St Public Notif requested (JAN-11-2006), St Public Notif received (JAN-31-2006), St Compliance achieved (JUL-20-2006)
MCL, Average - Between OCT-2005 and DEC-2005, Contaminant: TTHM. Follow-up actions: St Violation/Reminder Notice (2 times from JAN-11-2006 to JAN-11-2006), St Public Notif requested (JAN-11-2006), St Public Notif received (JAN-31-2006), St Compliance achieved (JUL-20-2006)
MCL, Average - Between OCT-2005 and DEC-2005, Contaminant: Total Haloacetic Acids (HAA5). Follow-up actions: St Violation/Reminder Notice (2 times from JAN-11-2006 to JAN-11-2006), St Public Notif requested (JAN-11-2006), St Public Notif received (JAN-31-2006), St Compliance achieved (JUL-20-2006)
Past monitoring violations:
One routine major monitoring violation
BURNT PINES WATER ASSOCIATION (Population served: 900, Purch surface water):
Past monitoring violations:
Monitoring and Reporting (DBP) - Between JAN-2014 and MAR-2014, Contaminant: Total Haloacetic Acids (HAA5). Follow-up actions: St Violation/Reminder Notice (JUN-04-2014), St Public Notif requested (JUN-04-2014)
Monitoring and Reporting (DBP) - Between JAN-2014 and MAR-2014, Contaminant: TTHM. Follow-up actions: St Violation/Reminder Notice (JUN-04-2014), St Public Notif requested (JUN-04-2014)
Lead Consumer Notice - In JAN-01-2013, Contaminant: Lead and Copper Rule. Follow-up actions: St Violation/Reminder Notice (APR-12-2013), St Intentional no-action (JAN-08-2014), St Compliance achieved (JUN-30-2014)
HICKORY MANOR MOBILE HOME PARK (Population served: 250, Purch surface water):
Past monitoring violations:
4 routine major monitoring violations
Average household size:
This city:
2.4 people
Indiana:
2.5 people
Percentage of family households:
This city:
62.8%
Whole state:
66.9%
Percentage of households with unmarried partners:
This city:
9.3%
Whole state:
6.9%
Likely homosexual households (counted as self-reported same-sex unmarried-partner households)
Lesbian couples: 0.3% of all households
Gay men: 0.2% of all households
People in group quarters in North Vernon in 2010:
130 people in local jails and other municipal confinement facilities
94 people in nursing facilities/skilled-nursing facilities
33 people in group homes intended for adults
7 people in group homes for juveniles (non-correctional)
5 people in emergency and transitional shelters (with sleeping facilities) for people experiencing homelessness
People in group quarters in North Vernon in 2000:
129 people in nursing homes
11 people in other noninstitutional group quarters
7 people in homes for the mentally ill
Banks with branches in North Vernon (2011 data):
Dupont State Bank: North Vernon Branch, Loan & Operations Center Branch, North Vernon Lpo. Info updated 2006/11/03: Bank assets: $80.2 mil, Deposits: $72.1 mil, headquarters in Dupont, IN, positive income, Commercial Lending Specialization, 5 total offices, Holding Company: Lea M. Mcmullan Trust
First Financial Bank, National Association: Union B&T North Vernon Branch at 6 North Madison, branch established on 1932/01/01; North Branch at State Road 3 And 7 North, branch established on 1982/07/16. Info updated 2009/09/21: Bank assets: $6,663.4 mil, Deposits: $5,754.9 mil, headquarters in Hamilton, OH, positive income, Commercial Lending Specialization, 101 total offices, Holding Company: First Financial Bancorp
PNC Bank, National Association: North Vernon Drive-Up Branch at 200 East Walnut Street, branch established on 2007/07/01; North Vernon Main Branch at 200 East Walnut, branch established on 1891/11/21. Info updated 2012/03/20: Bank assets: $263,309.6 mil, Deposits: $197,343.0 mil, headquarters in Wilmington, DE, positive income, Commercial Lending Specialization, 3085 total offices, Holding Company: Pnc Financial Services Group, Inc., The
MainSource Bank: North Vernon Branch at 521 North State Street, branch established on 1998/09/01. Info updated 2009/12/09: Bank assets: $2,729.1 mil, Deposits: $2,167.0 mil, headquarters in Greensburg, IN, positive income, 86 total offices, Holding Company: Mainsource Financial Group, Inc.
Jackson County Bank: North Vernon Branch at 611 A North State Street, branch established on 1994/12/21. Info updated 2006/11/03: Bank assets: $390.0 mil, Deposits: $304.2 mil, headquarters in Seymour, IN, positive income, Commercial Lending Specialization, 10 total offices, Holding Company: Bancorp Of Southern Indiana
Indiana Bank and Trust Company: 1420 N State Street Branch at 1420 North State Street, branch established on 1891/01/01. Info updated 2008/03/03: Bank assets: $983.6 mil, Deposits: $871.7 mil, headquarters in Columbus, IN, negative income in the last year, Commercial Lending Specialization, 19 total offices, Holding Company: Indiana Community Bancorp
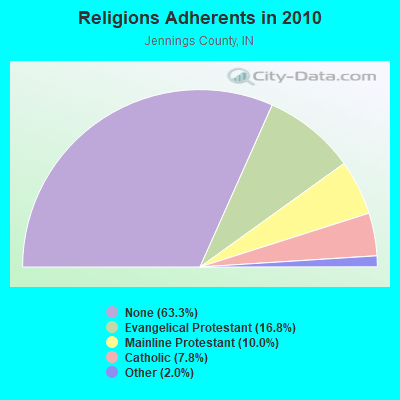
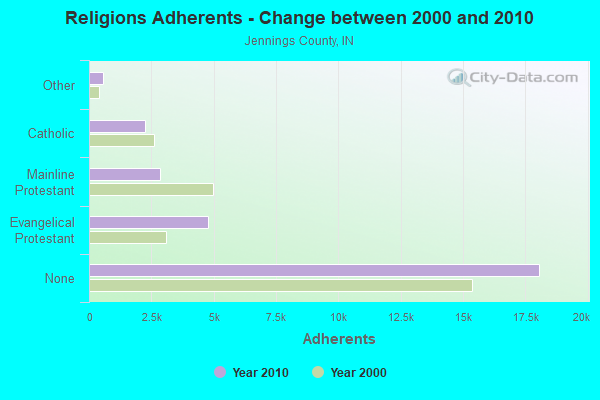
Religion statistics for North Vernon, IN (based on Jennings County data)
Religion
Adherents
Congregations
Evangelical Protestant
4,793
25
Mainline Protestant
2,854
21
Catholic
2,230
4
Other
578
2
None
18,070
-
Source: Clifford Grammich, Kirk Hadaway, Richard Houseal, Dale E.Jones, Alexei Krindatch, Richie Stanley and Richard H.Taylor. 2012. 2010 U.S.Religion Census: Religious Congregations & Membership Study. Association of Statisticians of American Religious Bodies. Jones, Dale E., et al. 2002. Congregations and Membership in the United States 2000. Nashville, TN: Glenmary Research Center. Graphs represent county-level data
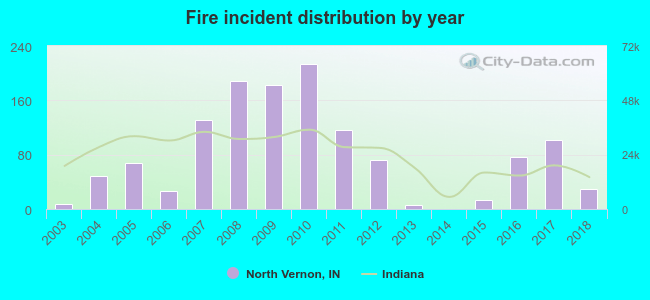
2003 - 2018 National Fire Incident Reporting System (NFIRS) incidents
According to the data from the years 2003 - 2018 the average number of fires per year is 80. The highest number of reported fires - 213 took place in 2010, and the least - 0 in 2014. The data has a growing trend.
When looking into fire subcategories, the most reports belonged to: Structure Fires (51.3%), and Outside Fires (34.8%).
Fire incident types reported to NFIRS in North Vernon, IN
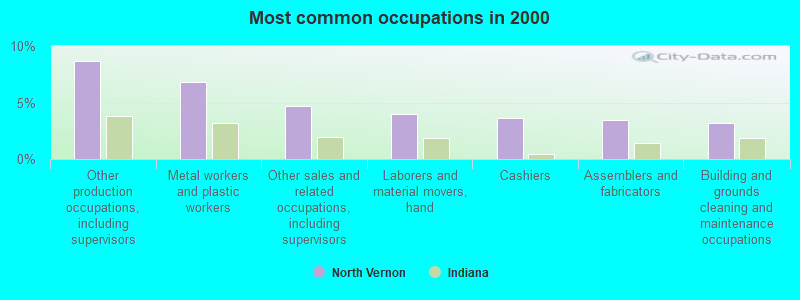
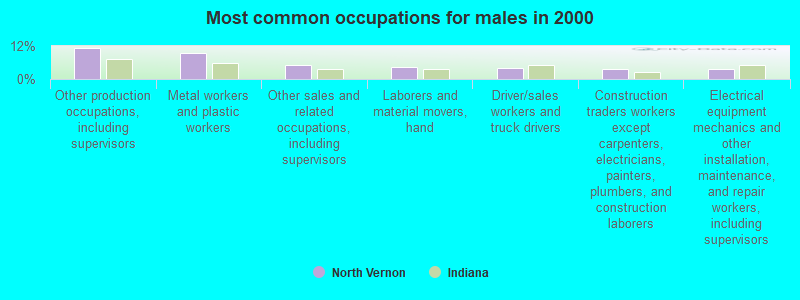
#32 on the list of "Top 101 cities with largest percentage of males in occupations: production occupations (population 5,000+)"
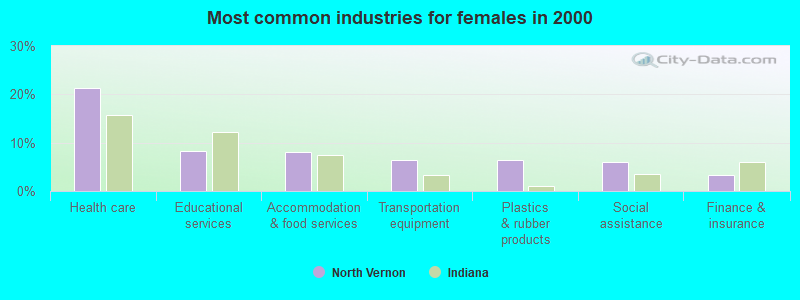
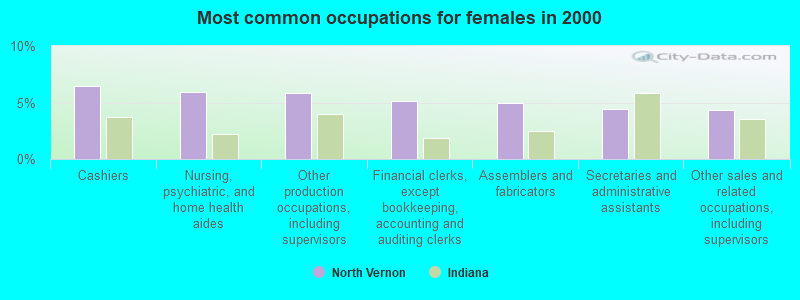
#57 on the list of "Top 101 cities with largest percentage of females in occupations: food preparation and serving related occupations (population 5,000+)"
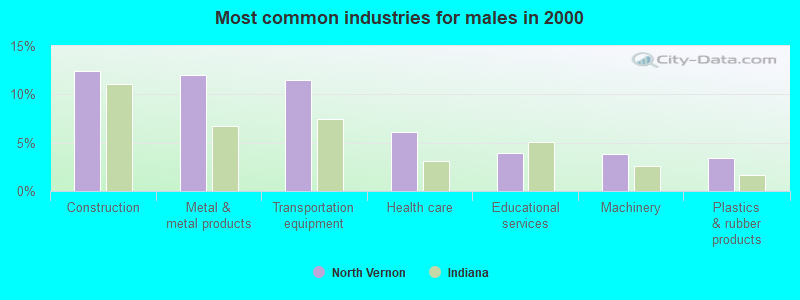
#90 on the list of "Top 101 cities with largest percentage of males in industries: manufacturing (population 5,000+)"
#93 on the list of "Top 101 cities with largest percentage of females in industries: management of companies and enterprises (population 5,000+)"


 Recent articles from our blog. Our writers, many of them Ph.D. graduates or candidates, create easy-to-read articles on a wide variety of topics.

 (49.6 miles
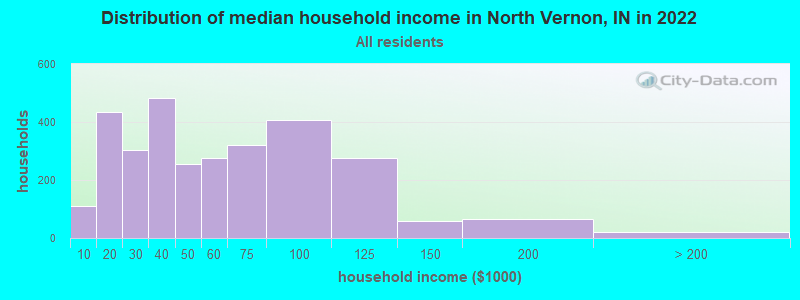

 According to the data from the years 2003 - 2018 the average number of fires per year is 80. The highest number of reported fires - 213 took place in 2010, and the least - 0 in 2014. The data has a growing trend.
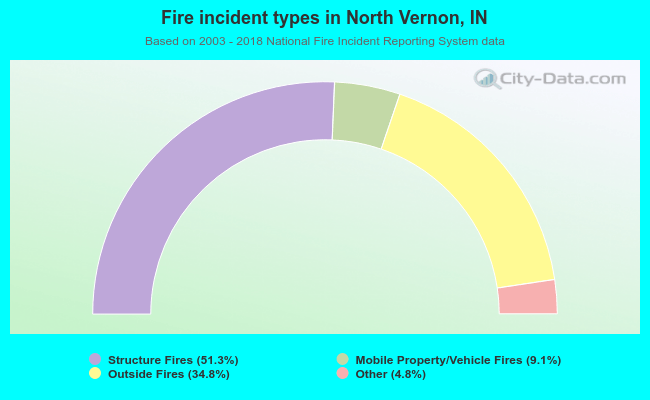 When looking into fire subcategories, the most reports belonged to: Structure Fires (51.3%), and Outside Fires (34.8%).