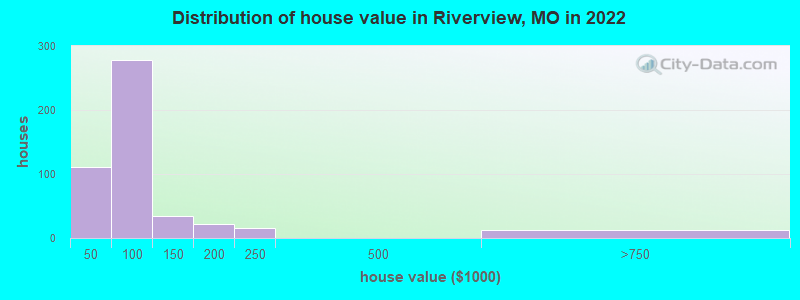
Estimated median house or condo value in 2022: $68,247 (it was $54,400 in 2000)
Riverview:
$68,247
MO:
$221,200
Mean prices in 2022:all housing units: $358,067; detached houses: $366,962; townhouses or other attached units: $296,938; in 2-unit structures: $604,192; in 3-to-4-unit structures: $176,513; in 5-or-more-unit structures: $232,155; mobile homes: $53,172; occupied boats, rvs, vans, etc.: $57,482
Median gross rent in 2022: $840.
March 2022 cost of living index in Riverview: 93.1 (less than average, U.S. average is 100)
Percentage of residents living in poverty in 2022: 20.9%
(17.9% for White Non-Hispanic residents, 22.6% for Black residents, 100.0% for Hispanic or Latino residents, 12.2% for other race residents)
According to our research of Missouri and other state lists, there were 2 registered sex offenders living in Riverview, Missouri as of May 15, 2024. The ratio of all residents to sex offenders in Riverview is 1,415 to 1. The ratio of registered sex offenders to all residents in this city is much lower than the state average.
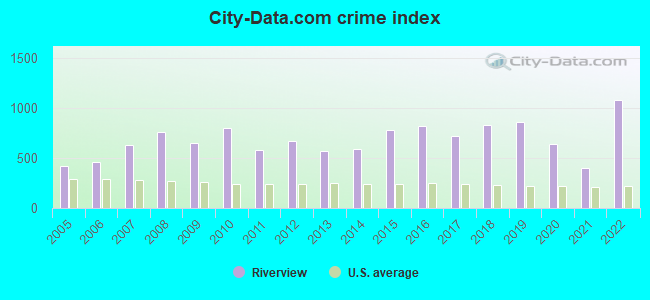
Crime rates in Riverview by year
Type
2009
2010
2011
2012
2013
2014
2015
2016
2017
2018
2019
2020
2021
2022
Murders (per 100,000)
0 (0.0)
0 (0.0)
0 (0.0)
1 (35.0)
0 (0.0)
1 (35.3)
0 (0.0)
3 (106.0)
2 (71.6)
3 (108.2)
4 (141.0)
1 (35.5)
1 (35.6)
2 (85.0)
Rapes (per 100,000)
0 (0.0)
2 (70.0)
0 (0.0)
2 (69.9)
2 (70.4)
0 (0.0)
0 (0.0)
0 (0.0)
0 (0.0)
1 (36.1)
2 (70.5)
1 (35.5)
0 (0.0)
3 (127.6)
Robberies (per 100,000)
11 (380.0)
11 (385.2)
10 (348.9)
6 (209.8)
8 (281.7)
7 (246.8)
19 (670.2)
11 (388.6)
10 (357.8)
9 (324.7)
4 (141.0)
3 (106.4)
1 (35.6)
6 (255.1)
Assaults (per 100,000)
34 (1,174)
24 (840.3)
14 (488.5)
22 (769.2)
20 (704.2)
18 (634.7)
43 (1,517)
23 (812.4)
34 (1,216)
35 (1,263)
40 (1,410)
40 (1,418)
27 (960.9)
55 (2,338)
Burglaries (per 100,000)
52 (1,796)
103 (3,606)
101 (3,524)
50 (1,748)
59 (2,077)
71 (2,504)
53 (1,869)
69 (2,437)
43 (1,538)
33 (1,190)
30 (1,058)
26 (922.0)
10 (355.9)
15 (637.8)
Thefts (per 100,000)
69 (2,383)
64 (2,241)
59 (2,059)
82 (2,867)
73 (2,570)
65 (2,292)
69 (2,434)
64 (2,261)
51 (1,825)
60 (2,165)
42 (1,481)
61 (2,163)
39 (1,388)
23 (977.9)
Auto thefts (per 100,000)
29 (1,002)
43 (1,506)
19 (662.9)
34 (1,189)
16 (563.4)
18 (634.7)
17 (599.6)
23 (812.4)
15 (536.7)
21 (757.6)
24 (846.3)
25 (886.5)
15 (533.8)
53 (2,253)
Arson (per 100,000)
2 (69.1)
1 (35.0)
0 (0.0)
0 (0.0)
3 (105.6)
2 (70.5)
1 (35.3)
1 (35.3)
2 (71.6)
0 (0.0)
7 (246.8)
6 (212.8)
1 (35.6)
0 (0.0)
City-Data.com crime index
650.1
802.2
584.4
674.8
575.0
589.2
780.6
817.0
717.4
825.8
863.9
636.9
397.2
1080.4
The City-Data.com crime index weighs serious crimes and violent crimes more heavily. Higher means more crime, U.S. average is 246.1. It adjusts for the number of visitors and daily workers commuting into cities.
Latest news from Riverview, MO collected exclusively by city-data.com from local newspapers, TV, and radio stations
Ancestries: German (4.6%), Irish (2.7%), French (1.3%).
Current Local Time: CST time zone
Incorporated in 1950
Elevation: 545 feet
Land area: 0.83 square miles.
Population density: 2,833 people per square mile (average).
57 residents are foreign born
This village:
2.0%
Missouri:
4.2%
Median real estate property taxes paid for housing units with mortgages in 2022: $1,553 (2.2%) Median real estate property taxes paid for housing units with no mortgage in 2022: $886 (2.1%)
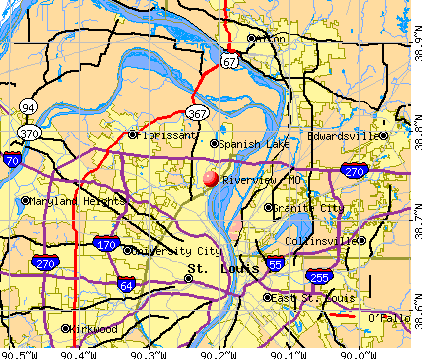
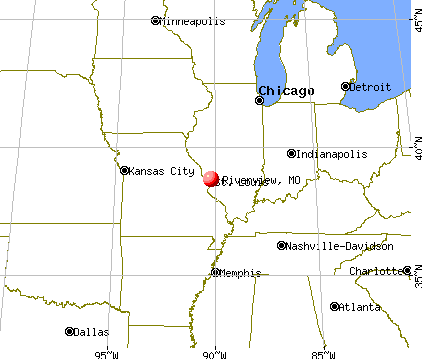
Nearest city with pop. 50,000+: Florissant, MO (7.1 miles , pop. 50,497).
Nearest city with pop. 200,000+: St. Louis, MO (8.4 miles , pop. 348,189).
Nearest city with pop. 1,000,000+: Chicago, IL (252.3 miles , pop. 2,896,016).
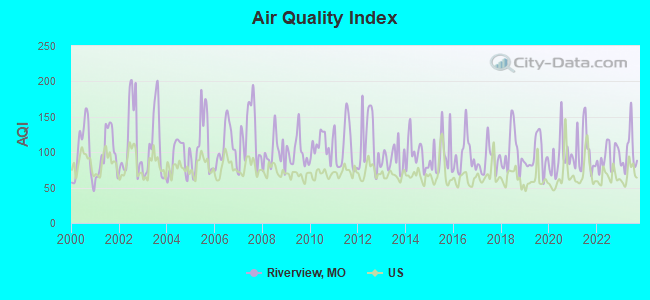
Air Quality Index (AQI) level in 2023 was 99.6. This is worse than average.
City:
99.6
U.S.:
72.6
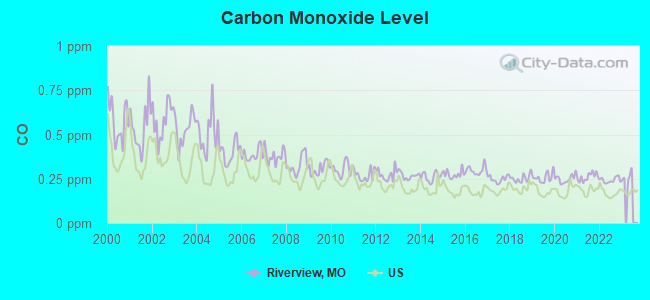
Carbon Monoxide (CO) [ppm] level in 2022 was 0.242. This is about average.Closest monitor was 1.4 miles away from the city center.
City:
0.242
U.S.:
0.251
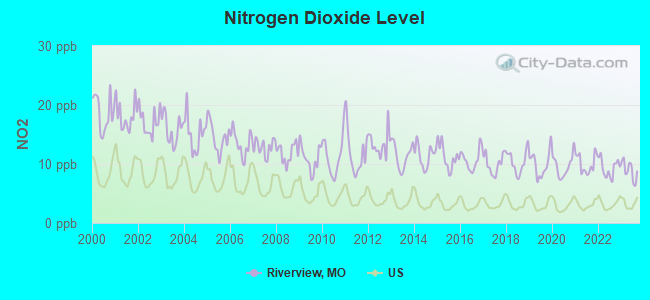
Nitrogen Dioxide (NO2) [ppb] level in 2023 was 8.91. This is significantly worse than average.Closest monitor was 1.4 miles away from the city center.
City:
8.91
U.S.:
5.11
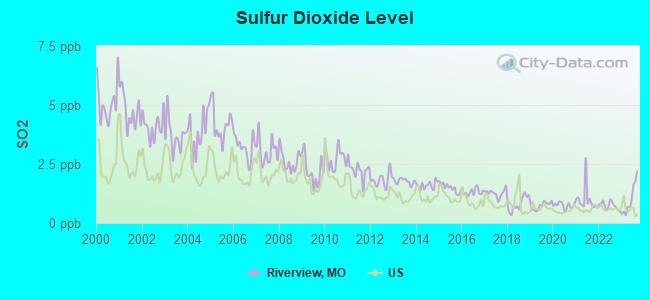
Sulfur Dioxide (SO2) [ppb] level in 2023 was 0.998. This is significantly better than average.Closest monitor was 1.4 miles away from the city center.
City:
0.998
U.S.:
1.515
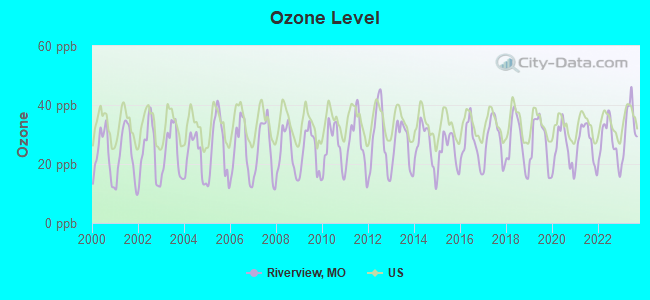
Ozone [ppb] level in 2023 was 33.0. This is about average.Closest monitor was 1.4 miles away from the city center.
City:
33.0
U.S.:
33.3
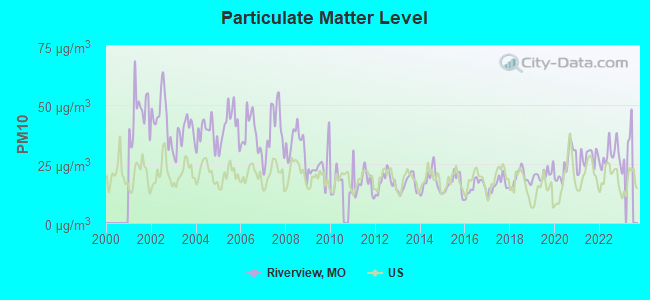
Particulate Matter (PM10) [µg/m3] level in 2022 was 29.0. This is significantly worse than average.Closest monitor was 1.3 miles away from the city center.
City:
29.0
U.S.:
19.2
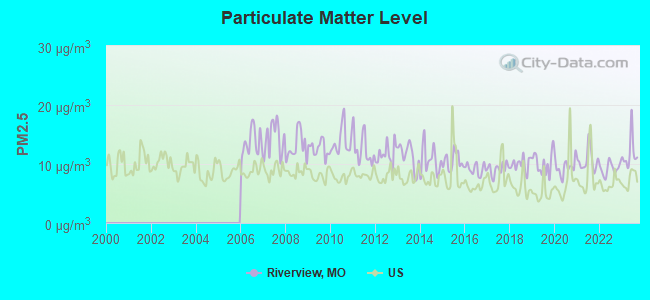
Particulate Matter (PM2.5) [µg/m3] level in 2023 was 11.8. This is significantly worse than average.Closest monitor was 4.2 miles away from the city center.
City:
11.8
U.S.:
8.1
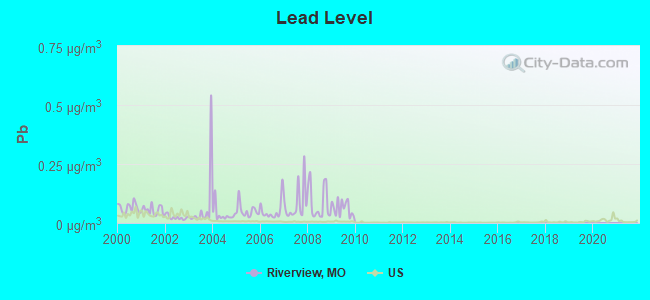
Lead (Pb) [µg/m3] level in 2009 was 0.0630. This is significantly worse than average.Closest monitor was 0.4 miles away from the city center.
City:
0.0630
U.S.:
0.0093
Tornado activity:
Riverview-area historical tornado activity is slightly above Missouri state average. It is 82% greater than the overall U.S. average.
On 4/3/1981, a category F4 (max. wind speeds 207-260 mph) tornado 4.8 miles away from the Riverview village center injured 32 peopleand causedbetween $5,000,000 and $50,000,000 in damages.
On 2/10/1959, a category F4 tornado 6.3 miles away from the village center killed 21 peopleand injured 345 peopleand causedbetween $5,000,000 and $50,000,000 in damages.
Earthquake activity:
Riverview-area historical earthquake activity is significantly above Missouri state average. It is 304% greater than the overall U.S. average.
On 4/18/2008 at 09:36:59, a magnitude 5.4 (5.1 MB, 4.8 MS, 5.4 MW, 5.2 MW, Class: Moderate, Intensity: VI - VII) earthquake occurred 127.4 miles away from the city center On 4/18/2008 at 09:36:59, a magnitude 5.2 (5.2 MW, Depth: 8.9 mi) earthquake occurred 127.4 miles away from Riverview center On 6/10/1987 at 23:48:54, a magnitude 5.1 (4.9 MB, 4.4 MS, 4.6 MS, 5.1 LG) earthquake occurred 125.6 miles away from Riverview center On 9/26/1990 at 13:18:51, a magnitude 5.0 (4.7 MB, 4.8 LG, 5.0 LG, Depth: 7.7 mi) earthquake occurred 115.3 miles away from the city center On 6/18/2002 at 17:37:15, a magnitude 5.0 (4.3 MB, 4.6 MW, 5.0 LG) earthquake occurred 142.0 miles away from Riverview center On 5/4/1991 at 01:18:54, a magnitude 5.0 (4.4 MB, 4.6 LG, 5.0 LG, Depth: 3.1 mi) earthquake occurred 152.4 miles away from Riverview center Magnitude types: regional Lg-wave magnitude (LG), body-wave magnitude (MB), surface-wave magnitude (MS), moment magnitude (MW)
Natural disasters:
The number of natural disasters in St. Louis County (2) is a lot smaller than the US average (15).
Causes of natural disasters: Flood: 1, Storm: 1, Tornado: 1, Wind: 1, Other: 1 (Note: some incidents may be assigned to more than one category).
Hospitals and medical centers near Riverview:
BELLEFONTAINE GARDENS NURSING AND REHAB (Nursing Home, about 2 miles away; SAINT LOUIS, MO)
VILLAGE NORTH WOODS (Nursing Home, about 2 miles away; SAINT LOUIS, MO)
BELLEFONTAINE HABILITATION CTR (Hospital, about 2 miles away; SAINT LOUIS, MO)
CARING HEARTS HOME CARE, INC (Home Health Center, about 2 miles away; SAINT LOUIS, MO)
NORTH VALLEY NURSING AND REHABILITATION CENTER (Nursing Home, about 3 miles away; SAINT LOUIS, MO)
CHRISTIAN HOSPITAL NORTHEAST-NORTHWEST Acute Care Hospitals (about 3 miles away; SAINT LOUIS, MO)
HILLSIDE MANOR HEALTHCARE AND REHAB CENTER (Nursing Home, about 3 miles away; SAINT LOUIS, MO)
Amtrak stations near Riverview:
9 miles: ST. LOUIS (550 S. 16TH ST.) . Services: ticket office, partially wheelchair accessible, enclosed waiting area, public restrooms, public payphones, vending machines, free short-term parking, free long-term parking, call for car rental service, taxi stand.
12 miles: ALTON (3400 COLLEGE AVE.) . Services: ticket office, fully wheelchair accessible, public payphones, vending machines, free short-term parking, free long-term parking, call for taxi service.
16 miles: KIRKWOOD (110 W. ARGONNE RD.) . Services: ticket office, partially wheelchair accessible, enclosed waiting area, public restrooms, public payphones, free short-term parking, free long-term parking, taxi stand, intercity bus service, public transit connection.
Colleges/universities with over 2000 students nearest to Riverview:
University of Missouri-St Louis (about 6 miles; Saint Louis, MO; Full-time enrollment: 10,322)
Ranken Technical College (about 7 miles; Saint Louis, MO; FT enrollment: 2,134)
Saint Louis University (about 8 miles; Saint Louis, MO; FT enrollment: 11,606)
Saint Louis Community College (about 9 miles; Saint Louis, MO; FT enrollment: 18,019)
Washington University in St Louis (about 9 miles; Saint Louis, MO; FT enrollment: 10,823)
Churches in Riverview include: Riverview Gardens Baptist Church (A), Zion Travelers Missionary Baptist Church (B), Berea Lutheran Church (C). Display/hide their locations on the map
St. Louis County has a predicted average indoor radon screening level between 2 and 4 pCi/L (pico curies per liter) - Moderate Potential
Average household size:
This village:
2.5 people
Missouri:
2.5 people
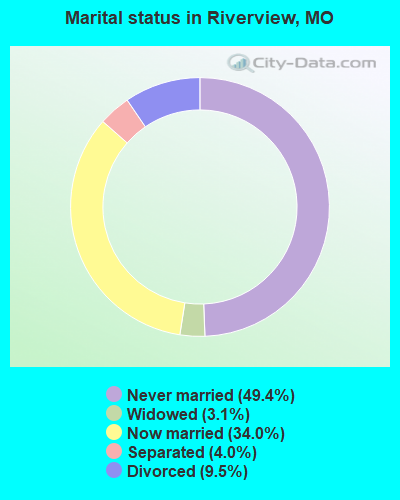
Percentage of family households:
This village:
62.2%
Whole state:
65.3%
Percentage of households with unmarried partners:
This village:
11.0%
Whole state:
6.7%
Likely homosexual households (counted as self-reported same-sex unmarried-partner households)
Lesbian couples: 0.7% of all households
Gay men: 0.3% of all households
15 people in other noninstitutional group quarters in 2000
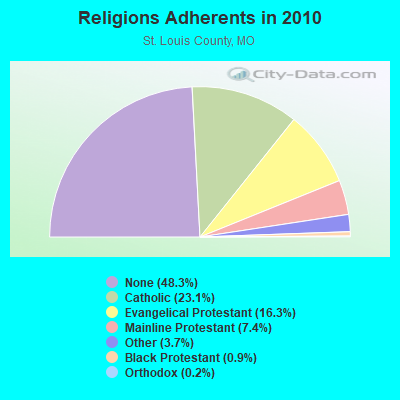
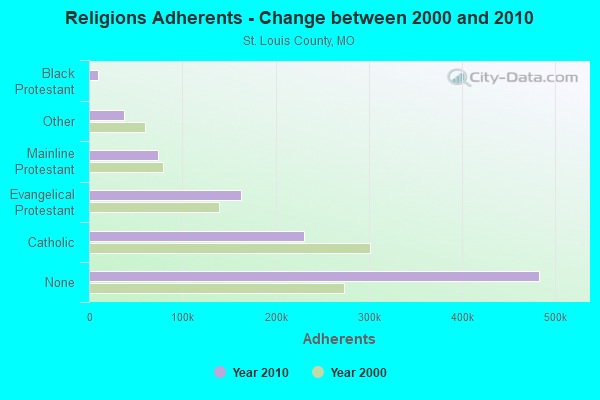
Religion statistics for Riverview, MO (based on St. Louis County data)
Religion
Adherents
Congregations
Catholic
230,488
74
Evangelical Protestant
162,614
384
Mainline Protestant
74,404
130
Other
37,156
87
Black Protestant
9,369
48
Orthodox
2,042
7
None
482,881
-
Source: Clifford Grammich, Kirk Hadaway, Richard Houseal, Dale E.Jones, Alexei Krindatch, Richie Stanley and Richard H.Taylor. 2012. 2010 U.S.Religion Census: Religious Congregations & Membership Study. Association of Statisticians of American Religious Bodies. Jones, Dale E., et al. 2002. Congregations and Membership in the United States 2000. Nashville, TN: Glenmary Research Center. Graphs represent county-level data
Lat: 38.747833 Lon: -90.211500, Call Sign: WPHA670, Assigned Frequencies: 457.562 MHz, 469.637 MHz, 469.662 MHz, 457.612 MHz, 468.487 MHz, 468.837 MHz, 469.462 MHz, 469.887 MHz, 457.512 MHz, 468.762 MHz... (+31 more), Grant Date: 03/18/2015, Expiration Date: 04/24/2025, Certifier: Jerry L Burgess, Registrant: Business Radio Licensing, 30251 Golden Lantern, Suite E #501, Laguna Niguel, CA 92677, Phone: (949) 348-8510, Fax: (949) 348-8514, Email:
FCC Registered Microwave Towers:
1
HILL HOLLOW, Section 5, T-39-N, R-15-W, Miller County (Lat: 38.163611 Lon: -92.601944), Type: Gtower, Structure height: 67 m, Overall height: 71.6 m, Call Sign: WQVB655, Assigned Frequencies: 10875.0 MHz, Grant Date: 12/17/2014, Expiration Date: 12/17/2024, Certifier: Steven T Campbell, Registrant: Wilkinson Barker Knauer, LLP, 1800 M Street Nw, Suite 800n, Washington, DC 20036, Phone: (202) 383-3420, Fax: (202) 783-5851, Email:
Home Mortgage Disclosure Act Aggregated Statistics For Year 2009 (Based on 1 partial tract)
A) FHA, FSA/RHS & VA Home Purchase Loans
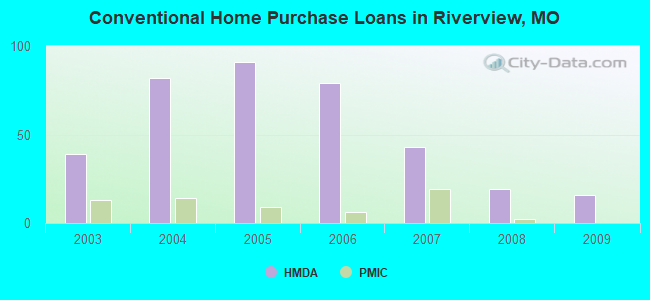
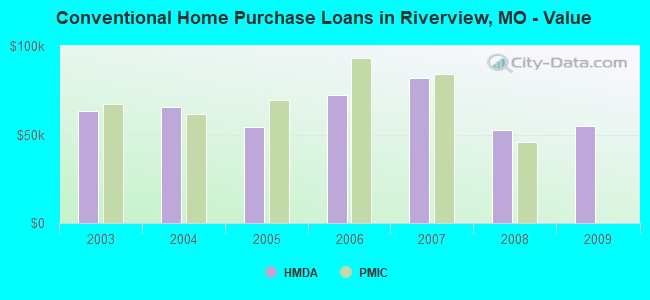
B) Conventional Home Purchase Loans
C) Refinancings
D) Home Improvement Loans
F) Non-occupant Loans on < 5 Family Dwellings (A B C & D)
Number
Average Value
Number
Average Value
Number
Average Value
Number
Average Value
Number
Average Value
LOANS ORIGINATED
6
$71,880
16
$54,942
27
$74,503
1
$15,740
24
$58,500
APPLICATIONS APPROVED, NOT ACCEPTED
1
$36,200
0
$0
5
$78,858
0
$0
1
$42,500
APPLICATIONS DENIED
3
$77,127
1
$3,150
24
$77,880
7
$11,693
2
$91,290
APPLICATIONS WITHDRAWN
0
$0
0
$0
5
$71,774
0
$0
0
$0
FILES CLOSED FOR INCOMPLETENESS
0
$0
0
$0
3
$146,383
2
$56,270
2
$194,785
Aggregated Statistics For Year 2008 (Based on 1 partial tract)
A) FHA, FSA/RHS & VA Home Purchase Loans
B) Conventional Home Purchase Loans
C) Refinancings
D) Home Improvement Loans
E) Loans on Dwellings For 5+ Families
F) Non-occupant Loans on < 5 Family Dwellings (A B C & D)
G) Loans On Manufactured Home Dwelling (A B C & D)
Number
Average Value
Number
Average Value
Number
Average Value
Number
Average Value
Number
Average Value
Number
Average Value
Number
Average Value
LOANS ORIGINATED
5
$68,470
19
$52,356
33
$73,883
4
$22,232
1
$1,735,340
26
$46,766
0
$0
APPLICATIONS APPROVED, NOT ACCEPTED
1
$44,860
1
$43,290
12
$84,143
0
$0
0
$0
6
$76,470
0
$0
APPLICATIONS DENIED
3
$105,197
11
$59,525
42
$84,790
20
$19,084
0
$0
15
$58,343
2
$44,070
APPLICATIONS WITHDRAWN
0
$0
3
$86,047
11
$99,091
0
$0
0
$0
3
$87,093
0
$0
FILES CLOSED FOR INCOMPLETENESS
1
$69,260
2
$90,110
5
$64,062
1
$14,950
0
$0
2
$32,660
0
$0
Aggregated Statistics For Year 2007 (Based on 1 partial tract)
A) FHA, FSA/RHS & VA Home Purchase Loans
B) Conventional Home Purchase Loans
C) Refinancings
D) Home Improvement Loans
E) Loans on Dwellings For 5+ Families
F) Non-occupant Loans on < 5 Family Dwellings (A B C & D)
Number
Average Value
Number
Average Value
Number
Average Value
Number
Average Value
Number
Average Value
Number
Average Value
LOANS ORIGINATED
2
$73,585
43
$81,793
62
$77,913
2
$57,060
1
$203,830
35
$64,961
APPLICATIONS APPROVED, NOT ACCEPTED
0
$0
12
$76,405
14
$73,809
2
$9,050
0
$0
3
$64,010
APPLICATIONS DENIED
2
$114,510
31
$88,829
91
$90,470
13
$46,494
0
$0
17
$91,477
APPLICATIONS WITHDRAWN
0
$0
11
$65,393
31
$90,835
2
$88,145
0
$0
9
$61,386
FILES CLOSED FOR INCOMPLETENESS
0
$0
1
$63,750
9
$73,453
0
$0
0
$0
1
$62,960
Aggregated Statistics For Year 2006 (Based on 1 partial tract)
A) FHA, FSA/RHS & VA Home Purchase Loans
B) Conventional Home Purchase Loans
C) Refinancings
D) Home Improvement Loans
F) Non-occupant Loans on < 5 Family Dwellings (A B C & D)
G) Loans On Manufactured Home Dwelling (A B C & D)
Number
Average Value
Number
Average Value
Number
Average Value
Number
Average Value
Number
Average Value
Number
Average Value
LOANS ORIGINATED
8
$98,080
79
$72,035
67
$72,298
9
$23,698
49
$59,667
1
$67,680
APPLICATIONS APPROVED, NOT ACCEPTED
0
$0
35
$68,424
20
$80,746
1
$790
12
$58,500
0
$0
APPLICATIONS DENIED
1
$52,730
52
$82,302
102
$90,613
13
$19,675
25
$68,343
1
$51,940
APPLICATIONS WITHDRAWN
0
$0
31
$74,994
39
$84,189
3
$67,157
8
$58,534
0
$0
FILES CLOSED FOR INCOMPLETENESS
0
$0
6
$61,648
12
$86,636
0
$0
6
$51,942
0
$0
Aggregated Statistics For Year 2005 (Based on 1 partial tract)
A) FHA, FSA/RHS & VA Home Purchase Loans
B) Conventional Home Purchase Loans
C) Refinancings
D) Home Improvement Loans
E) Loans on Dwellings For 5+ Families
F) Non-occupant Loans on < 5 Family Dwellings (A B C & D)
G) Loans On Manufactured Home Dwelling (A B C & D)
Number
Average Value
Number
Average Value
Number
Average Value
Number
Average Value
Number
Average Value
Number
Average Value
Number
Average Value
LOANS ORIGINATED
3
$86,833
91
$54,018
91
$70,225
9
$24,747
2
$1,915,560
45
$52,589
0
$0
APPLICATIONS APPROVED, NOT ACCEPTED
1
$61,390
19
$60,889
25
$85,594
1
$14,950
0
$0
5
$85,468
0
$0
APPLICATIONS DENIED
1
$75,550
39
$65,402
114
$78,942
27
$24,310
0
$0
19
$60,351
1
$47,220
APPLICATIONS WITHDRAWN
1
$57,450
24
$73,683
74
$83,741
5
$53,988
0
$0
9
$67,158
1
$18,890
FILES CLOSED FOR INCOMPLETENESS
0
$0
6
$59,550
9
$89,806
1
$67,680
0
$0
1
$51,160
0
$0
Aggregated Statistics For Year 2004 (Based on 1 partial tract)
A) FHA, FSA/RHS & VA Home Purchase Loans
B) Conventional Home Purchase Loans
C) Refinancings
D) Home Improvement Loans
E) Loans on Dwellings For 5+ Families
F) Non-occupant Loans on < 5 Family Dwellings (A B C & D)
Number
Average Value
Number
Average Value
Number
Average Value
Number
Average Value
Number
Average Value
Number
Average Value
LOANS ORIGINATED
14
$77,857
82
$65,446
92
$68,418
6
$22,037
1
$1,832,140
28
$59,138
APPLICATIONS APPROVED, NOT ACCEPTED
1
$146,380
23
$61,283
35
$67,255
3
$47,483
0
$0
8
$67,879
APPLICATIONS DENIED
1
$38,560
50
$62,567
95
$72,851
20
$29,946
1
$472,200
16
$63,501
APPLICATIONS WITHDRAWN
0
$0
20
$61,976
34
$75,691
1
$7,870
0
$0
2
$35,810
FILES CLOSED FOR INCOMPLETENESS
1
$78,700
1
$59,810
15
$68,207
0
$0
0
$0
2
$94,440
Aggregated Statistics For Year 2003 (Based on 1 partial tract)
A) FHA, FSA/RHS & VA Home Purchase Loans
B) Conventional Home Purchase Loans
C) Refinancings
D) Home Improvement Loans
E) Loans on Dwellings For 5+ Families
F) Non-occupant Loans on < 5 Family Dwellings (A B C & D)
Detailed PMIC statistics for the following Tracts:2103.00
2002 - 2018 National Fire Incident Reporting System (NFIRS) incidents
Based on the data from the years 2002 - 2018 the average number of fires per year is 30. The highest number of reported fire incidents - 96 took place in 2006, and the least - 5 in 2010. The data has an increasing trend.
When looking into fire subcategories, the most incidents belonged to: Structure Fires (63.0%), and Outside Fires (14.8%).
Fire incident types reported to NFIRS in Riverview, MO


 Recent articles from our blog. Our writers, many of them Ph.D. graduates or candidates, create easy-to-read articles on a wide variety of topics.

 (7.1 miles


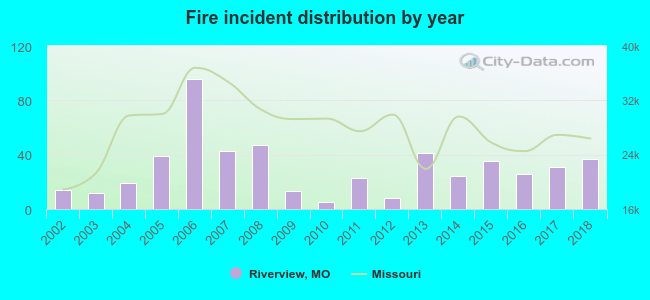 Based on the data from the years 2002 - 2018 the average number of fires per year is 30. The highest number of reported fire incidents - 96 took place in 2006, and the least - 5 in 2010. The data has an increasing trend.
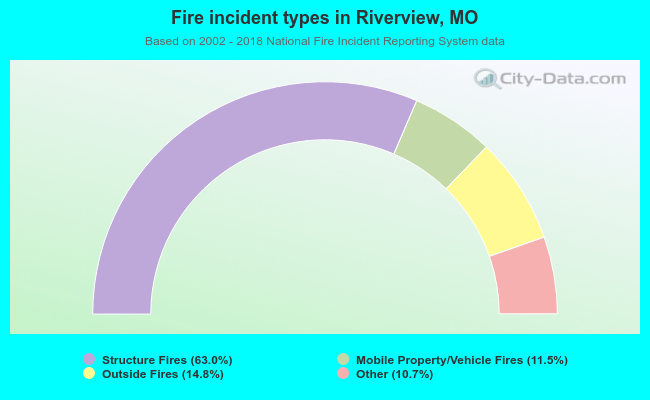 When looking into fire subcategories, the most incidents belonged to: Structure Fires (63.0%), and Outside Fires (14.8%).