Rupert, Vermont
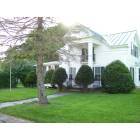
Rupert: Historic Home-Rupert, VT
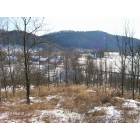
Rupert: Rupert, VT
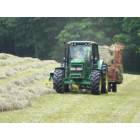
Rupert: Summer 08 Hay Day
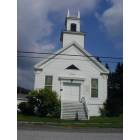
Rupert: Rupert Congregational Church
- add
your
Submit your own pictures of this town and show them to the world
- OSM Map
- General Map
- Google Map
- MSN Map
Population change since 2000: +1.4%
 |
| Males: 369 | |
| Females: 345 |
| Median resident age: | 48.5 years |
| Vermont median age: | 45.8 years |
Zip codes: 05251.
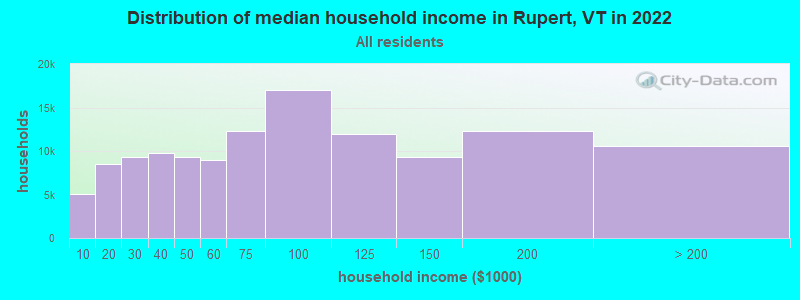
| Rupert: | $62,534 |
| VT: | $73,991 |
Estimated per capita income in 2022: $38,907 (it was $20,480 in 2000)
Rupert town income, earnings, and wages data
Estimated median house or condo value in 2022: $306,360 (it was $127,700 in 2000)
| Rupert: | $306,360 |
| VT: | $304,700 |
Mean prices in 2022: all housing units: $328,619; detached houses: $344,818; townhouses or other attached units: $277,995; in 2-unit structures: $228,670; in 3-to-4-unit structures: $413,467; in 5-or-more-unit structures: $239,659; mobile homes: $88,728
Detailed information about poverty and poor residents in Rupert, VT


- 68796.2%White alone
- 111.5%Hispanic
- 101.4%Two or more races
- 30.4%American Indian alone
- 20.3%Black alone
- 10.1%Asian alone

Races in Rupert detailed stats: ancestries, foreign born residents, place of birth
 Recent articles from our blog. Our writers, many of them Ph.D. graduates or candidates, create easy-to-read articles on a wide variety of topics.

 | kitty litter in school bathroom (37 replies) |
| One Day in VT (9 replies) |
| Anybody in/near Rupert, VT? (2 replies) |
| Colchester Questions (4 replies) |
| Does Vermont want another out-of-stater? (129 replies) |
| What is the "greenest" or most progressive liberal city/town in Vermont? (32 replies) |
Latest news from Rupert, VT collected exclusively by city-data.com from local newspapers, TV, and radio stations
Ancestries: English (14.3%), Irish (12.6%), German (9.7%), United States (9.7%), Scottish (5.8%), Welsh (5.8%).
Current Local Time: EST time zone
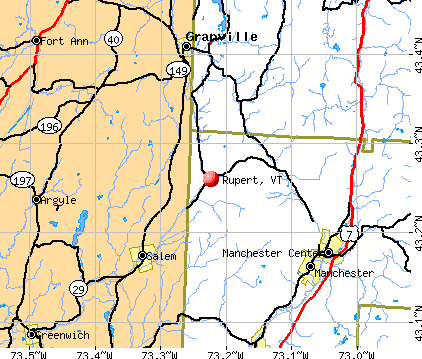
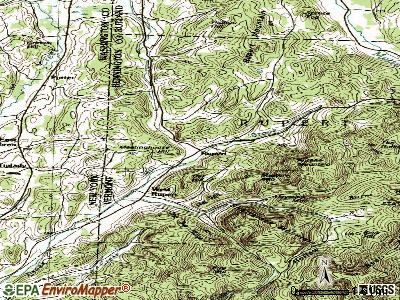
Elevation: 839 feet
Land area: 44.6 square miles.
Population density: 16 people per square mile (very low).
11 residents are foreign born
| This town: | 1.6% |
| Vermont: | 3.8% |
| Rupert town: | 1.6% ($2,014) |
| Vermont: | 2.0% ($2,196) |
Nearest city with pop. 50,000+: Schenectady, NY  (49.6 miles , pop. 61,821).
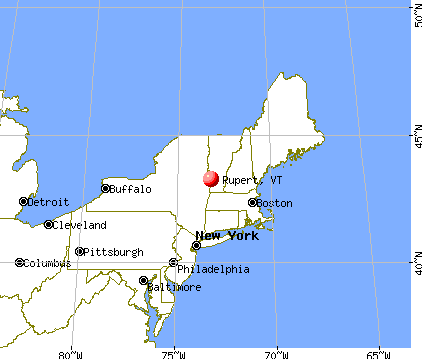
Nearest city with pop. 200,000+: Boston, MA (125.2 miles , pop. 589,141).
Nearest city with pop. 1,000,000+: Bronx, NY (171.5 miles , pop. 1,332,650).
Nearest cities:
), ), Latitude: 43.27 N, Longitude: 73.19 W
Area code: 802

Single-family new house construction building permits:
- 2022: 1 building, cost: $279,200
- 2021: 3 buildings, average cost: $259,200
- 2019: 3 buildings, average cost: $282,200
- 2017: 2 buildings, average cost: $248,100
- 2015: 3 buildings, average cost: $226,800
- 2014: 2 buildings, average cost: $211,200
- 2013: 1 building, cost: $193,300
- 2012: 1 building, cost: $184,000
- 2011: 1 building, cost: $172,800
- 2010: 1 building, cost: $165,900
- 2009: 1 building, cost: $178,900
- 2008: 3 buildings, average cost: $181,200
- 2007: 4 buildings, average cost: $181,200
- 2006: 3 buildings, average cost: $171,000
- 2005: 4 buildings, average cost: $150,200
- 2004: 5 buildings, average cost: $132,800
- 2003: 5 buildings, average cost: $132,800
- 2002: 7 buildings, average cost: $140,000
- 2001: 7 buildings, average cost: $140,000
- 2000: 6 buildings, average cost: $140,000
- 1999: 6 buildings, average cost: $140,000
- 1998: 6 buildings, average cost: $140,000
- 1997: 5 buildings, average cost: $140,000


| Here: | 4.1% |
| Vermont: | 2.0% |


- Accommodation & food services (11.1%)
- Construction (9.6%)
- Health care (6.3%)
- Agriculture, forestry, fishing & hunting (6.0%)
- Professional, scientific, technical services (6.0%)
- Religious, grantmaking, civic, professional, similar organizations (5.7%)
- Electronic shopping & mail-order houses (4.8%)

- Construction (18.9%)
- Accommodation & food services (13.0%)
- Agriculture, forestry, fishing & hunting (10.7%)
- Professional, scientific, technical services (8.9%)
- Motor vehicle & parts dealers (4.7%)
- Miscellaneous manufacturing (4.7%)
- Administrative & support & waste management services (4.1%)

- Health care (10.3%)
- Educational services (9.1%)
- Accommodation & food services (9.1%)
- Religious, grantmaking, civic, professional, similar organizations (7.9%)
- Electronic shopping & mail-order houses (7.3%)
- Publishing, motion picture & sound recording industries (5.5%)
- Finance & insurance (5.5%)

- Building and grounds cleaning and maintenance occupations (5.4%)
- Other management occupations, except farmers and farm managers (5.1%)
- Other sales and related occupations, including supervisors (4.8%)
- Retail sales workers, except cashiers (3.9%)
- Agricultural workers, including supervisors (3.9%)
- Other food preparation and serving workers, including supervisors (3.9%)
- Operations specialties managers, except financial managers (3.0%)

- Other management occupations, except farmers and farm managers (7.7%)
- Farmers and farm managers (5.9%)
- Other food preparation and serving workers, including supervisors (5.3%)
- Other sales and related occupations, including supervisors (4.1%)
- Top executives (3.6%)
- Other production occupations, including supervisors (3.6%)
- Operations specialties managers, except financial managers (3.6%)

- Building and grounds cleaning and maintenance occupations (7.3%)
- Waiters and waitresses (5.5%)
- Other sales and related occupations, including supervisors (5.5%)
- Other office and administrative support workers, including supervisors (5.5%)
- Art and design workers (4.8%)
- Agricultural workers, including supervisors (4.8%)
- Retail sales workers, except cashiers (4.2%)
Average climate in Rupert, Vermont
Based on data reported by over 4,000 weather stations


Tornado activity:
Rupert-area historical tornado activity is above Vermont state average. It is 58% smaller than the overall U.S. average.
On 8/20/1968, a category F3 (max. wind speeds 158-206 mph) tornado 22.9 miles away from the Rupert town center injured one person and caused between $5000 and $50,000 in damages.
On 5/31/1998, a category F3 tornado 23.7 miles away from the town center injured 68 people and caused $71 million in damages.
Earthquake activity:
Rupert-area historical earthquake activity is significantly above Vermont state average. It is 69% smaller than the overall U.S. average.On 10/7/1983 at 10:18:46, a magnitude 5.3 (5.1 MB, 5.3 LG, 5.1 ML, Class: Moderate, Intensity: VI - VII) earthquake occurred 74.5 miles away from the city center
On 4/20/2002 at 10:50:47, a magnitude 5.3 (5.3 ML, Depth: 3.0 mi) earthquake occurred 89.4 miles away from Rupert center
On 4/20/2002 at 10:50:47, a magnitude 5.2 (5.2 MB, 4.2 MS, 5.2 MW, 5.0 MW) earthquake occurred 88.0 miles away from Rupert center
On 1/19/1982 at 00:14:42, a magnitude 4.7 (4.5 MB, 4.7 MD, 4.5 LG, Class: Light, Intensity: IV - V) earthquake occurred 81.4 miles away from the city center
On 10/16/2012 at 23:12:25, a magnitude 4.7 (4.7 ML, Depth: 10.0 mi) earthquake occurred 129.1 miles away from the city center
On 6/17/1991 at 08:53:16, a magnitude 4.1 (4.0 MB, 4.0 LG, Depth: 3.1 mi) earthquake occurred 87.6 miles away from Rupert center
Magnitude types: regional Lg-wave magnitude (LG), body-wave magnitude (MB), duration magnitude (MD), local magnitude (ML), surface-wave magnitude (MS), moment magnitude (MW)
Natural disasters:
The number of natural disasters in Bennington County (15) is near the US average (15).Major Disasters (Presidential) Declared: 10
Emergencies Declared: 2
Causes of natural disasters: Floods: 8, Storms: 8, Tropical Storms: 2, Winter Storms: 2, Hurricane: 1, Landslide: 1, Snowstorm: 1, Wind: 1, Other: 1 (Note: some incidents may be assigned to more than one category).
Hospitals and medical centers near Rupert:
Colleges/universities with over 2000 students nearest to Rupert:
- Castleton State College (about 24 miles; Castleton, VT; Full-time enrollment: 2,079)
- Adirondack Community College (about 25 miles; Queensbury, NY; FT enrollment: 2,826)
- Skidmore College (about 33 miles; Saratoga Springs, NY; FT enrollment: 2,753)
- SUNY Empire State College (about 33 miles; Saratoga Springs, NY; FT enrollment: 9,473)
- Williams College (about 39 miles; Williamstown, MA; FT enrollment: 2,141)
- Rensselaer Polytechnic Institute (about 46 miles; Troy, NY; FT enrollment: 6,940)
- The Sage Colleges (about 46 miles; Troy, NY; FT enrollment: 2,499)
Points of interest:
Notable location: Rupert Volunteer Fire Department (A). Display/hide its location on the map
Church in Rupert: Disciples of Christ Church (A). Display/hide its location on the map
Cemeteries: Kent Hollow Cemetery (1), Graves Family Cemetery (2), West Rupert Cemetery (3), Rupert Street Cemetery (4), North Rupert Cemetery (5). Display/hide their locations on the map
Streams, rivers, and creeks: Sandgate Brook (A), Oven Brook (B), Mill Brook (C). Display/hide their locations on the map
| This town: | 2.3 people |
| Vermont: | 2.3 people |
| This town: | 70.2% |
| Whole state: | 62.5% |
| This town: | 5.2% |
| Whole state: | 9.2% |
No gay or lesbian households reported
| This town: | 6.1% |
| Whole state: | 9.4% |
| This town: | 1.8% |
| Whole state: | 3.6% |
For population 15 years and over in Rupert:

- Never married: 20.0%
- Now married: 59.6%
- Separated: 0.9%
- Widowed: 8.7%
- Divorced: 10.7%
For population 25 years and over in Rupert:
- High school or higher: 86.1%
- Bachelor's degree or higher: 25.9%
- Graduate or professional degree: 12.2%
- Unemployed: 5.1%
- Mean travel time to work (commute): 29.9 minutes


| Here: | 11.7 |
| Vermont average: | 11.7 |
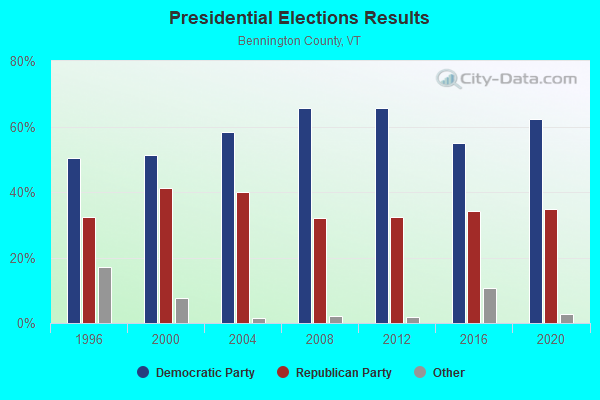
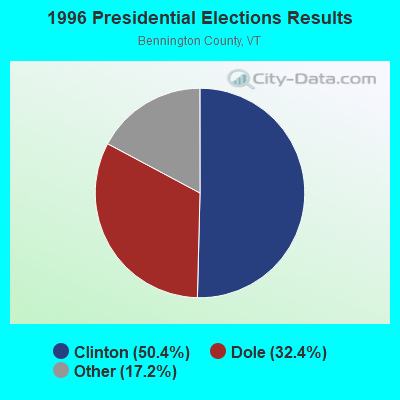
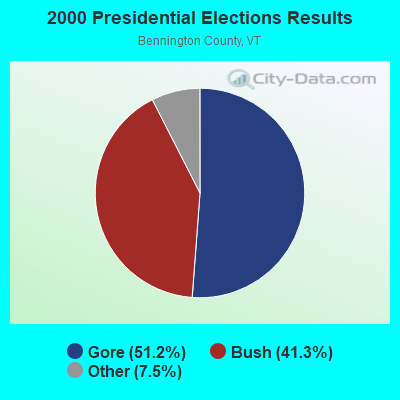
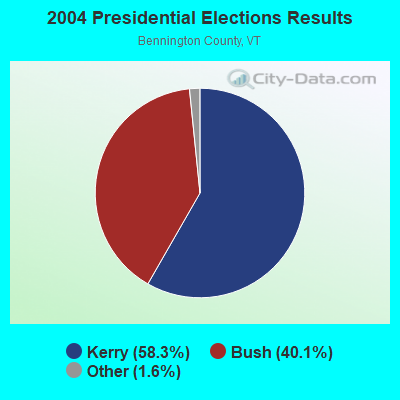
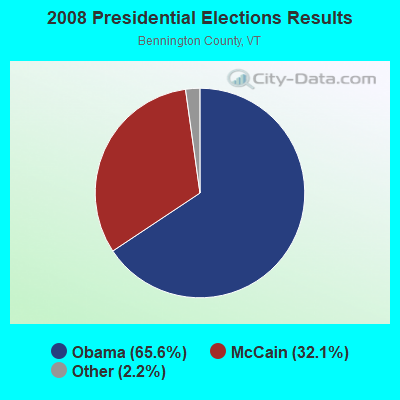
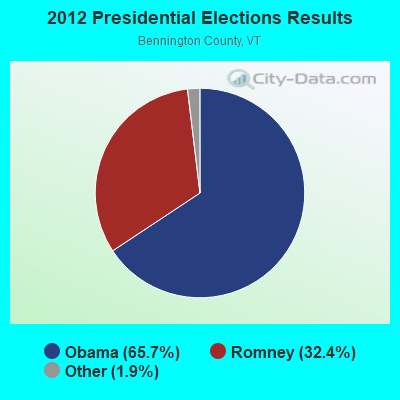
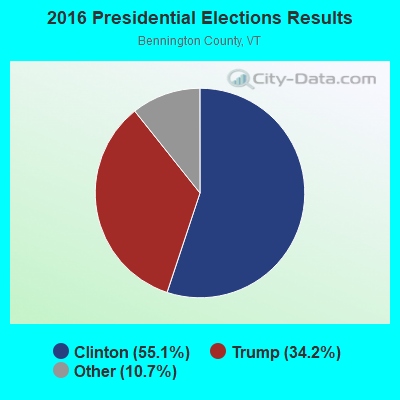
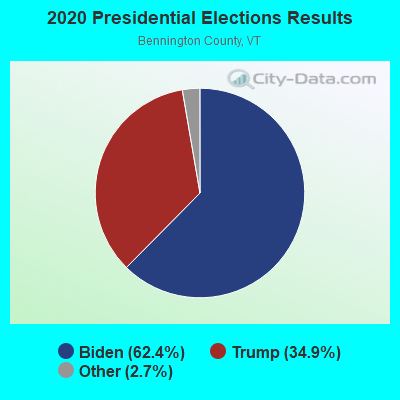
Graphs represent county-level data. Detailed 2008 Election Results
Religion statistics for Rupert, VT (based on Bennington County data)

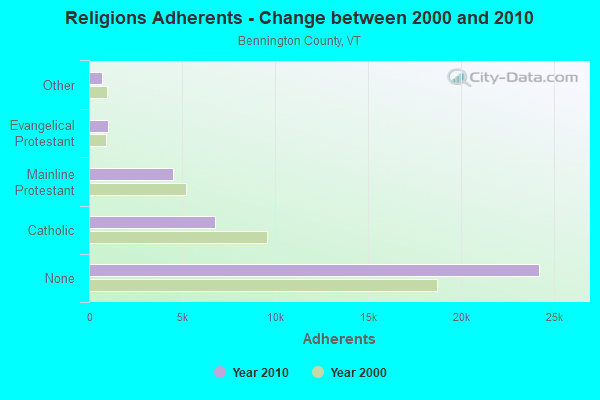
| Religion | Adherents | Congregations |
|---|---|---|
| Catholic | 6,742 | 8 |
| Mainline Protestant | 4,490 | 26 |
| Evangelical Protestant | 1,005 | 12 |
| Other | 693 | 5 |
| None | 24,195 | - |
Food Environment Statistics:
| This county: | 3.85 / 10,000 pop. |
| Vermont: | 3.84 / 10,000 pop. |
| Bennington County: | 3.30 / 10,000 pop. |
| Vermont: | 1.95 / 10,000 pop. |
| Here: | 5.77 / 10,000 pop. |
| Vermont: | 6.40 / 10,000 pop. |
| Bennington County: | 16.48 / 10,000 pop. |
| Vermont: | 11.52 / 10,000 pop. |
| Here: | 8.4% |
| State: | 6.8% |
| This county: | 22.9% |
| Vermont: | 22.3% |
| Bennington County: | 11.6% |
| State: | 13.3% |
Strongest AM radio stations in Rupert:
- WGY (810 AM; 50 kW; SCHENECTADY, NY; Owner: CLEAR CHANNEL BROADCASTING LICENSES, INC.)
- WPTR (1540 AM; 50 kW; ALBANY, NY; Owner: KIMTRON, INC.)
- WNNZ (640 AM; 50 kW; WESTFIELD, MA; Owner: CLEAR CHANNEL BROADCASTING LICENSES, INC.)
- WCRN (830 AM; 50 kW; WORCESTER, MA; Owner: CARTER BROADCASTING CORPORATION)
- WSYB (1380 AM; 5 kW; RUTLAND, VT; Owner: CAPSTAR TX LIMITED PARTNERSHIP)
- WRKO (680 AM; 50 kW; BOSTON, MA; Owner: ENTERCOM BOSTON LICENSE, LLC)
- WTIC (1080 AM; 50 kW; HARTFORD, CT; Owner: INFINITY RADIO OPERATIONS INC.)
- WEEI (850 AM; 50 kW; BOSTON, MA; Owner: ENTERCOM BOSTON LICENSE, LLC)
- WVNE (760 AM; daytime; 25 kW; LEICESTER, MA; Owner: BLOUNT MASSCOM, INC.)
- WNTK (1020 AM; 10 kW; NEWPORT, NH; Owner: KOOR COMMUNICATIONS, INC.)
- WABY (1160 AM; 5 kW; MECHANICVILLE, NY; Owner: ANASTOS MEDIA GROUP, INC.)
- WALE (990 AM; 50 kW; GREENVILLE, RI; Owner: NORTH AMERICAN BROADCASTING CO., INC.)
- WKOX (1200 AM; 50 kW; FRAMINGHAM, MA; Owner: CAPSTAR TX LIMITED PARTNERSHIP)
Strongest FM radio stations in Rupert:
- WEQX (102.7 FM; MANCHESTER, VT; Owner: NORTHSHIRE COMMUNICATIONS, INC.)
- WJAN (95.1 FM; SUNDERLAND, VT; Owner: 6 JOHNSON ROAD LICENSES, INC.)
- WMNV (104.1 FM; RUPERT, VT; Owner: CAPITAL MEDIA CORPORATION)
- WNGN (91.9 FM; ARGYLE, NY; Owner: NORTHEAST GOSPEL BROADCASTING INC)
- WLJH (90.9 FM; GLENS FALLS, NY; Owner: SOUND OF LIFE INC)
- WJJR (98.1 FM; RUTLAND, VT; Owner: 6 JOHNSON ROAD LICENSES, INC.)
- WZRT (97.1 FM; RUTLAND, VT; Owner: CAPSTAR TX LIMITED PARTNERSHIP)
- WEBK (105.3 FM; KILLINGTON, VT; Owner: 6 JOHNSON ROAD LICENSES, INC.)
- WGLV (91.7 FM; WOODSTOCK, VT; Owner: CHRISTIAN MINISTRIES INC)
- WHDQ-FM1 (106.1 FM; RUTLAND, VT; Owner: GREAT NORTHERN RADIO, L.L.C.)
- WVAY (100.7 FM; WILMINGTON, VT; Owner: GREAT NORTHERN RADIO, L.L.C.)
- WVPR (89.5 FM; WINDSOR, VT; Owner: VERMONT PUBLIC RADIO)
- WHDQ (106.1 FM; CLAREMONT, NH; Owner: GREAT NORTHERN RADIO, L.L.C.)
- WKBE (100.3 FM; WARRENSBURG, NY; Owner: 6 JOHNSON ROAD LICENSES, INC.)
- WCKM-FM (99.1 FM; LAKE GEORGE, NY; Owner: ENTERTRONICS, INC.)
- WNYQ (105.7 FM; QUEENSBURY, NY; Owner: VOX NEW YORK, L.L.C.)
- WAMC-FM (90.3 FM; ALBANY, NY; Owner: WAMC)
- WEXP (101.5 FM; BRANDON, VT; Owner: VOX VERMONT, L.L.C.)
- WJEN (94.5 FM; RUTLAND, VT; Owner: 6 JOHNSON ROAD LICENSES, INC.)
- WXLG (89.9 FM; NORTH CREEK, NY; Owner: THE ST. LAWRENCE UNIVERSITY)
TV broadcast stations around Rupert:
- W36AX (Channel 36; MANCHESTER, ETC., VT; Owner: VERMONT ETV, INC.)
- W69AD (Channel 69; BENNINGTON, ETC., VT; Owner: MT. MANSFIELD TELEVISION, INC.)
- Rupert, Vermont
- Fatal accident count14
- Vehicles involved in fatal accidents15
- Fatal accidents involving drunk persons:5
- Fatalities14
- Persons involved in fatal accidents25
- Pedestrians involved in fatal accidents0
- Vermont average
- Fatal accident count976
- Vehicles involved in fatal accidents1395
- Fatal accidents involving drunk persons413
- Fatalities1101
- Persons involved in fatal accidents2459
- Pedestrians involved in fatal accidents77
- National Bridge Inventory (NBI) Statistics
- 14Number of bridges
- 49ft / 15.2mTotal length
- $2,439,000Total costs
- 8,527Total average daily traffic
- 685Total average daily truck traffic
- 8,957Total future (year 2027) average daily traffic
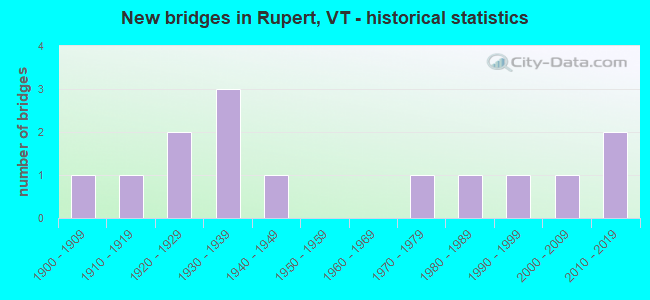
- New bridges - historical statistics
- 11900-1909
- 11910-1919
- 21920-1929
- 31930-1939
- 11940-1949
- 11970-1979
- 11980-1989
- 11990-1999
- 12000-2009
- 22010-2019
FCC Registered Broadcast Land Mobile Towers:
1- Rupert Peak (Lat: 43.299806 Lon: -73.190944), Type: Bant, Structure height: 6 m, Call Sign: WQHC786,
Assigned Frequencies: 451.912 MHz, 461.662 MHz, 462.037 MHz, Grant Date: 04/08/2017, Expiration Date: 06/28/2027, Certifier: Todd W Goad, Registrant: Fleetwave Partners, LLP, 4735 Williston Rd, Ste 30, Williston, VT 05495, Phone: (802) 862-7092, Email:

- 77.8%Fuel oil, kerosene, etc.
- 13.6%Wood
- 7.8%Bottled, tank, or LP gas
- 0.8%Electricity

- 68.9%Fuel oil, kerosene, etc.
- 22.2%Wood
- 8.9%Bottled, tank, or LP gas
Rupert compared to Vermont state average:
- Unemployed percentage below state average.
- Black race population percentage significantly below state average.
- Foreign-born population percentage significantly below state average.
- Renting percentage below state average.
- Length of stay since moving in significantly above state average.
- Number of rooms per house significantly below state average.
- House age significantly below state average.
- Number of college students below state average.

|
Total of 1 patent application in 2008-2024.