Safety Harbor, Florida Submit your own pictures of this city and show them to the world
OSM Map
General Map
Google Map
MSN Map
OSM Map
General Map
Google Map
MSN Map
OSM Map
General Map
Google Map
MSN Map
OSM Map
General Map
Google Map
MSN Map
Please wait while loading the map...
Population in 2022: 17,021 (100% urban, 0% rural). Population change since 2000: -1.1%Males: 8,003 Females: 9,018
March 2022 cost of living index in Safety Harbor: 99.9 (near average, U.S. average is 100) Percentage of residents living in poverty in 2022: 6.5%for White Non-Hispanic residents , 0.6% for Black residents , 2.0% for Hispanic or Latino residents , 35.8% for American Indian residents , 24.3% for other race residents )
Profiles of local businesses
Business Search - 14 Million verified businesses
Data:
Median household income ($)
Median household income (% change since 2000)
Household income diversity
Ratio of average income to average house value (%)
Ratio of average income to average rent
Median household income ($) - White
Median household income ($) - Black or African American
Median household income ($) - Asian
Median household income ($) - Hispanic or Latino
Median household income ($) - American Indian and Alaska Native
Median household income ($) - Multirace
Median household income ($) - Other Race
Median household income for houses/condos with a mortgage ($)
Median household income for apartments without a mortgage ($)
Races - White alone (%)
Races - White alone (% change since 2000)
Races - Black alone (%)
Races - Black alone (% change since 2000)
Races - American Indian alone (%)
Races - American Indian alone (% change since 2000)
Races - Asian alone (%)
Races - Asian alone (% change since 2000)
Races - Hispanic (%)
Races - Hispanic (% change since 2000)
Races - Native Hawaiian and Other Pacific Islander alone (%)
Races - Native Hawaiian and Other Pacific Islander alone (% change since 2000)
Races - Two or more races (%)
Races - Two or more races (% change since 2000)
Races - Other race alone (%)
Races - Other race alone (% change since 2000)
Racial diversity
Unemployment (%)
Unemployment (% change since 2000)
Unemployment (%) - White
Unemployment (%) - Black or African American
Unemployment (%) - Asian
Unemployment (%) - Hispanic or Latino
Unemployment (%) - American Indian and Alaska Native
Unemployment (%) - Multirace
Unemployment (%) - Other Race
Population density (people per square mile)
Population - Males (%)
Population - Females (%)
Population - Males (%) - White
Population - Males (%) - Black or African American
Population - Males (%) - Asian
Population - Males (%) - Hispanic or Latino
Population - Males (%) - American Indian and Alaska Native
Population - Males (%) - Multirace
Population - Males (%) - Other Race
Population - Females (%) - White
Population - Females (%) - Black or African American
Population - Females (%) - Asian
Population - Females (%) - Hispanic or Latino
Population - Females (%) - American Indian and Alaska Native
Population - Females (%) - Multirace
Population - Females (%) - Other Race
Coronavirus confirmed cases (May 01, 2024)
Deaths caused by coronavirus (May 01, 2024)
Coronavirus confirmed cases (per 100k population) (May 01, 2024)
Deaths caused by coronavirus (per 100k population) (May 01, 2024)
Daily increase in number of cases (May 01, 2024)
Weekly increase in number of cases (May 01, 2024)
Cases doubled (in days) (May 01, 2024)
Hospitalized patients (Apr 18, 2022)
Negative test results (Apr 18, 2022)
Total test results (Apr 18, 2022)
COVID Vaccine doses distributed (per 100k population) (Sep 19, 2023)
COVID Vaccine doses administered (per 100k population) (Sep 19, 2023)
COVID Vaccine doses distributed (Sep 19, 2023)
COVID Vaccine doses administered (Sep 19, 2023)
Likely homosexual households (%)
Likely homosexual households (% change since 2000)
Likely homosexual households - Lesbian couples (%)
Likely homosexual households - Lesbian couples (% change since 2000)
Likely homosexual households - Gay men (%)
Likely homosexual households - Gay men (% change since 2000)
Cost of living index
Median gross rent ($)
Median contract rent ($)
Median monthly housing costs ($)
Median house or condo value ($)
Median house or condo value ($ change since 2000)
Mean house or condo value by units in structure - 1, detached ($)
Mean house or condo value by units in structure - 1, attached ($)
Mean house or condo value by units in structure - 2 ($)
Mean house or condo value by units in structure by units in structure - 3 or 4 ($)
Mean house or condo value by units in structure - 5 or more ($)
Mean house or condo value by units in structure - Boat, RV, van, etc. ($)
Mean house or condo value by units in structure - Mobile home ($)
Median house or condo value ($) - White
Median house or condo value ($) - Black or African American
Median house or condo value ($) - Asian
Median house or condo value ($) - Hispanic or Latino
Median house or condo value ($) - American Indian and Alaska Native
Median house or condo value ($) - Multirace
Median house or condo value ($) - Other Race
Median resident age
Resident age diversity
Median resident age - Males
Median resident age - Females
Median resident age - White
Median resident age - Black or African American
Median resident age - Asian
Median resident age - Hispanic or Latino
Median resident age - American Indian and Alaska Native
Median resident age - Multirace
Median resident age - Other Race
Median resident age - Males - White
Median resident age - Males - Black or African American
Median resident age - Males - Asian
Median resident age - Males - Hispanic or Latino
Median resident age - Males - American Indian and Alaska Native
Median resident age - Males - Multirace
Median resident age - Males - Other Race
Median resident age - Females - White
Median resident age - Females - Black or African American
Median resident age - Females - Asian
Median resident age - Females - Hispanic or Latino
Median resident age - Females - American Indian and Alaska Native
Median resident age - Females - Multirace
Median resident age - Females - Other Race
Commute - mean travel time to work (minutes)
Travel time to work - Less than 5 minutes (%)
Travel time to work - Less than 5 minutes (% change since 2000)
Travel time to work - 5 to 9 minutes (%)
Travel time to work - 5 to 9 minutes (% change since 2000)
Travel time to work - 10 to 19 minutes (%)
Travel time to work - 10 to 19 minutes (% change since 2000)
Travel time to work - 20 to 29 minutes (%)
Travel time to work - 20 to 29 minutes (% change since 2000)
Travel time to work - 30 to 39 minutes (%)
Travel time to work - 30 to 39 minutes (% change since 2000)
Travel time to work - 40 to 59 minutes (%)
Travel time to work - 40 to 59 minutes (% change since 2000)
Travel time to work - 60 to 89 minutes (%)
Travel time to work - 60 to 89 minutes (% change since 2000)
Travel time to work - 90 or more minutes (%)
Travel time to work - 90 or more minutes (% change since 2000)
Marital status - Never married (%)
Marital status - Now married (%)
Marital status - Separated (%)
Marital status - Widowed (%)
Marital status - Divorced (%)
Median family income ($)
Median family income (% change since 2000)
Median non-family income ($)
Median non-family income (% change since 2000)
Median per capita income ($)
Median per capita income (% change since 2000)
Median family income ($) - White
Median family income ($) - Black or African American
Median family income ($) - Asian
Median family income ($) - Hispanic or Latino
Median family income ($) - American Indian and Alaska Native
Median family income ($) - Multirace
Median family income ($) - Other Race
Median year house/condo built
Median year apartment built
Year house built - Built 2005 or later (%)
Year house built - Built 2000 to 2004 (%)
Year house built - Built 1990 to 1999 (%)
Year house built - Built 1980 to 1989 (%)
Year house built - Built 1970 to 1979 (%)
Year house built - Built 1960 to 1969 (%)
Year house built - Built 1950 to 1959 (%)
Year house built - Built 1940 to 1949 (%)
Year house built - Built 1939 or earlier (%)
Average household size
Household density (households per square mile)
Average household size - White
Average household size - Black or African American
Average household size - Asian
Average household size - Hispanic or Latino
Average household size - American Indian and Alaska Native
Average household size - Multirace
Average household size - Other Race
Occupied housing units (%)
Vacant housing units (%)
Owner occupied housing units (%)
Renter occupied housing units (%)
Vacancy status - For rent (%)
Vacancy status - For sale only (%)
Vacancy status - Rented or sold, not occupied (%)
Vacancy status - For seasonal, recreational, or occasional use (%)
Vacancy status - For migrant workers (%)
Vacancy status - Other vacant (%)
Residents with income below the poverty level (%)
Residents with income below 50% of the poverty level (%)
Children below poverty level (%)
Poor families by family type - Married-couple family (%)
Poor families by family type - Male, no wife present (%)
Poor families by family type - Female, no husband present (%)
Poverty status for native-born residents (%)
Poverty status for foreign-born residents (%)
Poverty among high school graduates not in families (%)
Poverty among people who did not graduate high school not in families (%)
Residents with income below the poverty level (%) - White
Residents with income below the poverty level (%) - Black or African American
Residents with income below the poverty level (%) - Asian
Residents with income below the poverty level (%) - Hispanic or Latino
Residents with income below the poverty level (%) - American Indian and Alaska Native
Residents with income below the poverty level (%) - Multirace
Residents with income below the poverty level (%) - Other Race
Air pollution - Air Quality Index (AQI)
Air pollution - CO
Air pollution - NO2
Air pollution - SO2
Air pollution - Ozone
Air pollution - PM10
Air pollution - PM25
Air pollution - Pb
Crime - Murders per 100,000 population
Crime - Rapes per 100,000 population
Crime - Robberies per 100,000 population
Crime - Assaults per 100,000 population
Crime - Burglaries per 100,000 population
Crime - Thefts per 100,000 population
Crime - Auto thefts per 100,000 population
Crime - Arson per 100,000 population
Crime - City-data.com crime index
Crime - Violent crime index
Crime - Property crime index
Crime - Murders per 100,000 population (5 year average)
Crime - Rapes per 100,000 population (5 year average)
Crime - Robberies per 100,000 population (5 year average)
Crime - Assaults per 100,000 population (5 year average)
Crime - Burglaries per 100,000 population (5 year average)
Crime - Thefts per 100,000 population (5 year average)
Crime - Auto thefts per 100,000 population (5 year average)
Crime - Arson per 100,000 population (5 year average)
Crime - City-data.com crime index (5 year average)
Crime - Violent crime index (5 year average)
Crime - Property crime index (5 year average)
1996 Presidential Elections Results (%) - Democratic Party (Clinton)
1996 Presidential Elections Results (%) - Republican Party (Dole)
1996 Presidential Elections Results (%) - Other
2000 Presidential Elections Results (%) - Democratic Party (Gore)
2000 Presidential Elections Results (%) - Republican Party (Bush)
2000 Presidential Elections Results (%) - Other
2004 Presidential Elections Results (%) - Democratic Party (Kerry)
2004 Presidential Elections Results (%) - Republican Party (Bush)
2004 Presidential Elections Results (%) - Other
2008 Presidential Elections Results (%) - Democratic Party (Obama)
2008 Presidential Elections Results (%) - Republican Party (McCain)
2008 Presidential Elections Results (%) - Other
2012 Presidential Elections Results (%) - Democratic Party (Obama)
2012 Presidential Elections Results (%) - Republican Party (Romney)
2012 Presidential Elections Results (%) - Other
2016 Presidential Elections Results (%) - Democratic Party (Clinton)
2016 Presidential Elections Results (%) - Republican Party (Trump)
2016 Presidential Elections Results (%) - Other
2020 Presidential Elections Results (%) - Democratic Party (Biden)
2020 Presidential Elections Results (%) - Republican Party (Trump)
2020 Presidential Elections Results (%) - Other
Ancestries Reported - Arab (%)
Ancestries Reported - Czech (%)
Ancestries Reported - Danish (%)
Ancestries Reported - Dutch (%)
Ancestries Reported - English (%)
Ancestries Reported - French (%)
Ancestries Reported - French Canadian (%)
Ancestries Reported - German (%)
Ancestries Reported - Greek (%)
Ancestries Reported - Hungarian (%)
Ancestries Reported - Irish (%)
Ancestries Reported - Italian (%)
Ancestries Reported - Lithuanian (%)
Ancestries Reported - Norwegian (%)
Ancestries Reported - Polish (%)
Ancestries Reported - Portuguese (%)
Ancestries Reported - Russian (%)
Ancestries Reported - Scotch-Irish (%)
Ancestries Reported - Scottish (%)
Ancestries Reported - Slovak (%)
Ancestries Reported - Subsaharan African (%)
Ancestries Reported - Swedish (%)
Ancestries Reported - Swiss (%)
Ancestries Reported - Ukrainian (%)
Ancestries Reported - United States (%)
Ancestries Reported - Welsh (%)
Ancestries Reported - West Indian (%)
Ancestries Reported - Other (%)
Educational Attainment - No schooling completed (%)
Educational Attainment - Less than high school (%)
Educational Attainment - High school or equivalent (%)
Educational Attainment - Less than 1 year of college (%)
Educational Attainment - 1 or more years of college (%)
Educational Attainment - Associate degree (%)
Educational Attainment - Bachelor's degree (%)
Educational Attainment - Master's degree (%)
Educational Attainment - Professional school degree (%)
Educational Attainment - Doctorate degree (%)
School Enrollment - Nursery, preschool (%)
School Enrollment - Kindergarten (%)
School Enrollment - Grade 1 to 4 (%)
School Enrollment - Grade 5 to 8 (%)
School Enrollment - Grade 9 to 12 (%)
School Enrollment - College undergrad (%)
School Enrollment - Graduate or professional (%)
School Enrollment - Not enrolled in school (%)
School enrollment - Public schools (%)
School enrollment - Private schools (%)
School enrollment - Not enrolled (%)
Median number of rooms in houses and condos
Median number of rooms in apartments
Housing units lacking complete plumbing facilities (%)
Housing units lacking complete kitchen facilities (%)
Density of houses
Urban houses (%)
Rural houses (%)
Households with people 60 years and over (%)
Households with people 65 years and over (%)
Households with people 75 years and over (%)
Households with one or more nonrelatives (%)
Households with no nonrelatives (%)
Population in households (%)
Family households (%)
Nonfamily households (%)
Population in families (%)
Family households with own children (%)
Median number of bedrooms in owner occupied houses
Mean number of bedrooms in owner occupied houses
Median number of bedrooms in renter occupied houses
Mean number of bedrooms in renter occupied houses
Median number of vehichles in owner occupied houses
Mean number of vehichles in owner occupied houses
Median number of vehichles in renter occupied houses
Mean number of vehichles in renter occupied houses
Mortgage status - with mortgage (%)
Mortgage status - with second mortgage (%)
Mortgage status - with home equity loan (%)
Mortgage status - with both second mortgage and home equity loan (%)
Mortgage status - without a mortgage (%)
Average family size
Average family size - White
Average family size - Black or African American
Average family size - Asian
Average family size - Hispanic or Latino
Average family size - American Indian and Alaska Native
Average family size - Multirace
Average family size - Other Race
Geographical mobility - Same house 1 year ago (%)
Geographical mobility - Moved within same county (%)
Geographical mobility - Moved from different county within same state (%)
Geographical mobility - Moved from different state (%)
Geographical mobility - Moved from abroad (%)
Place of birth - Born in state of residence (%)
Place of birth - Born in other state (%)
Place of birth - Native, outside of US (%)
Place of birth - Foreign born (%)
Housing units in structures - 1, detached (%)
Housing units in structures - 1, attached (%)
Housing units in structures - 2 (%)
Housing units in structures - 3 or 4 (%)
Housing units in structures - 5 to 9 (%)
Housing units in structures - 10 to 19 (%)
Housing units in structures - 20 to 49 (%)
Housing units in structures - 50 or more (%)
Housing units in structures - Mobile home (%)
Housing units in structures - Boat, RV, van, etc. (%)
House/condo owner moved in on average (years ago)
Renter moved in on average (years ago)
Year householder moved into unit - Moved in 1999 to March 2000 (%)
Year householder moved into unit - Moved in 1995 to 1998 (%)
Year householder moved into unit - Moved in 1990 to 1994 (%)
Year householder moved into unit - Moved in 1980 to 1989 (%)
Year householder moved into unit - Moved in 1970 to 1979 (%)
Year householder moved into unit - Moved in 1969 or earlier (%)
Means of transportation to work - Drove car alone (%)
Means of transportation to work - Carpooled (%)
Means of transportation to work - Public transportation (%)
Means of transportation to work - Bus or trolley bus (%)
Means of transportation to work - Streetcar or trolley car (%)
Means of transportation to work - Subway or elevated (%)
Means of transportation to work - Railroad (%)
Means of transportation to work - Ferryboat (%)
Means of transportation to work - Taxicab (%)
Means of transportation to work - Motorcycle (%)
Means of transportation to work - Bicycle (%)
Means of transportation to work - Walked (%)
Means of transportation to work - Other means (%)
Working at home (%)
Industry diversity
Most Common Industries - Agriculture, forestry, fishing and hunting, and mining (%)
Most Common Industries - Agriculture, forestry, fishing and hunting (%)
Most Common Industries - Mining, quarrying, and oil and gas extraction (%)
Most Common Industries - Construction (%)
Most Common Industries - Manufacturing (%)
Most Common Industries - Wholesale trade (%)
Most Common Industries - Retail trade (%)
Most Common Industries - Transportation and warehousing, and utilities (%)
Most Common Industries - Transportation and warehousing (%)
Most Common Industries - Utilities (%)
Most Common Industries - Information (%)
Most Common Industries - Finance and insurance, and real estate and rental and leasing (%)
Most Common Industries - Finance and insurance (%)
Most Common Industries - Real estate and rental and leasing (%)
Most Common Industries - Professional, scientific, and management, and administrative and waste management services (%)
Most Common Industries - Professional, scientific, and technical services (%)
Most Common Industries - Management of companies and enterprises (%)
Most Common Industries - Administrative and support and waste management services (%)
Most Common Industries - Educational services, and health care and social assistance (%)
Most Common Industries - Educational services (%)
Most Common Industries - Health care and social assistance (%)
Most Common Industries - Arts, entertainment, and recreation, and accommodation and food services (%)
Most Common Industries - Arts, entertainment, and recreation (%)
Most Common Industries - Accommodation and food services (%)
Most Common Industries - Other services, except public administration (%)
Most Common Industries - Public administration (%)
Occupation diversity
Most Common Occupations - Management, business, science, and arts occupations (%)
Most Common Occupations - Management, business, and financial occupations (%)
Most Common Occupations - Management occupations (%)
Most Common Occupations - Business and financial operations occupations (%)
Most Common Occupations - Computer, engineering, and science occupations (%)
Most Common Occupations - Computer and mathematical occupations (%)
Most Common Occupations - Architecture and engineering occupations (%)
Most Common Occupations - Life, physical, and social science occupations (%)
Most Common Occupations - Education, legal, community service, arts, and media occupations (%)
Most Common Occupations - Community and social service occupations (%)
Most Common Occupations - Legal occupations (%)
Most Common Occupations - Education, training, and library occupations (%)
Most Common Occupations - Arts, design, entertainment, sports, and media occupations (%)
Most Common Occupations - Healthcare practitioners and technical occupations (%)
Most Common Occupations - Health diagnosing and treating practitioners and other technical occupations (%)
Most Common Occupations - Health technologists and technicians (%)
Most Common Occupations - Service occupations (%)
Most Common Occupations - Healthcare support occupations (%)
Most Common Occupations - Protective service occupations (%)
Most Common Occupations - Fire fighting and prevention, and other protective service workers including supervisors (%)
Most Common Occupations - Law enforcement workers including supervisors (%)
Most Common Occupations - Food preparation and serving related occupations (%)
Most Common Occupations - Building and grounds cleaning and maintenance occupations (%)
Most Common Occupations - Personal care and service occupations (%)
Most Common Occupations - Sales and office occupations (%)
Most Common Occupations - Sales and related occupations (%)
Most Common Occupations - Office and administrative support occupations (%)
Most Common Occupations - Natural resources, construction, and maintenance occupations (%)
Most Common Occupations - Farming, fishing, and forestry occupations (%)
Most Common Occupations - Construction and extraction occupations (%)
Most Common Occupations - Installation, maintenance, and repair occupations (%)
Most Common Occupations - Production, transportation, and material moving occupations (%)
Most Common Occupations - Production occupations (%)
Most Common Occupations - Transportation occupations (%)
Most Common Occupations - Material moving occupations (%)
People in Group quarters - Institutionalized population (%)
People in Group quarters - Correctional institutions (%)
People in Group quarters - Federal prisons and detention centers (%)
People in Group quarters - Halfway houses (%)
People in Group quarters - Local jails and other confinement facilities (including police lockups) (%)
People in Group quarters - Military disciplinary barracks (%)
People in Group quarters - State prisons (%)
People in Group quarters - Other types of correctional institutions (%)
People in Group quarters - Nursing homes (%)
People in Group quarters - Hospitals/wards, hospices, and schools for the handicapped (%)
People in Group quarters - Hospitals/wards and hospices for chronically ill (%)
People in Group quarters - Hospices or homes for chronically ill (%)
People in Group quarters - Military hospitals or wards for chronically ill (%)
People in Group quarters - Other hospitals or wards for chronically ill (%)
People in Group quarters - Hospitals or wards for drug/alcohol abuse (%)
People in Group quarters - Mental (Psychiatric) hospitals or wards (%)
People in Group quarters - Schools, hospitals, or wards for the mentally retarded (%)
People in Group quarters - Schools, hospitals, or wards for the physically handicapped (%)
People in Group quarters - Institutions for the deaf (%)
People in Group quarters - Institutions for the blind (%)
People in Group quarters - Orthopedic wards and institutions for the physically handicapped (%)
People in Group quarters - Wards in general hospitals for patients who have no usual home elsewhere (%)
People in Group quarters - Wards in military hospitals for patients who have no usual home elsewhere (%)
People in Group quarters - Juvenile institutions (%)
People in Group quarters - Long-term care (%)
People in Group quarters - Homes for abused, dependent, and neglected children (%)
People in Group quarters - Residential treatment centers for emotionally disturbed children (%)
People in Group quarters - Training schools for juvenile delinquents (%)
People in Group quarters - Short-term care, detention or diagnostic centers for delinquent children (%)
People in Group quarters - Type of juvenile institution unknown (%)
People in Group quarters - Noninstitutionalized population (%)
People in Group quarters - College dormitories (includes college quarters off campus) (%)
People in Group quarters - Military quarters (%)
People in Group quarters - On base (%)
People in Group quarters - Barracks, unaccompanied personnel housing (UPH), (Enlisted/Officer), ;and similar group living quarters for military personnel (%)
People in Group quarters - Transient quarters for temporary residents (%)
People in Group quarters - Military ships (%)
People in Group quarters - Group homes (%)
People in Group quarters - Homes or halfway houses for drug/alcohol abuse (%)
People in Group quarters - Homes for the mentally ill (%)
People in Group quarters - Homes for the mentally retarded (%)
People in Group quarters - Homes for the physically handicapped (%)
People in Group quarters - Other group homes (%)
People in Group quarters - Religious group quarters (%)
People in Group quarters - Dormitories (%)
People in Group quarters - Agriculture workers' dormitories on farms (%)
People in Group quarters - Job Corps and vocational training facilities (%)
People in Group quarters - Other workers' dormitories (%)
People in Group quarters - Crews of maritime vessels (%)
People in Group quarters - Other nonhousehold living situations (%)
People in Group quarters - Other noninstitutional group quarters (%)
Residents speaking English at home (%)
Residents speaking English at home - Born in the United States (%)
Residents speaking English at home - Native, born elsewhere (%)
Residents speaking English at home - Foreign born (%)
Residents speaking Spanish at home (%)
Residents speaking Spanish at home - Born in the United States (%)
Residents speaking Spanish at home - Native, born elsewhere (%)
Residents speaking Spanish at home - Foreign born (%)
Residents speaking other language at home (%)
Residents speaking other language at home - Born in the United States (%)
Residents speaking other language at home - Native, born elsewhere (%)
Residents speaking other language at home - Foreign born (%)
Class of Workers - Employee of private company (%)
Class of Workers - Self-employed in own incorporated business (%)
Class of Workers - Private not-for-profit wage and salary workers (%)
Class of Workers - Local government workers (%)
Class of Workers - State government workers (%)
Class of Workers - Federal government workers (%)
Class of Workers - Self-employed workers in own not incorporated business and Unpaid family workers (%)
House heating fuel used in houses and condos - Utility gas (%)
House heating fuel used in houses and condos - Bottled, tank, or LP gas (%)
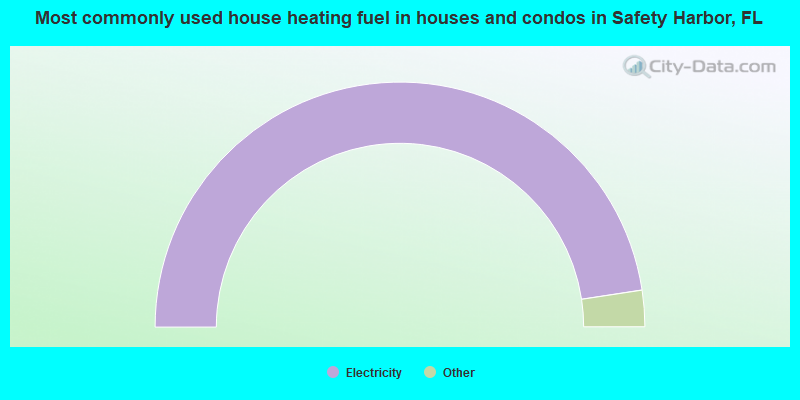
House heating fuel used in houses and condos - Electricity (%)
House heating fuel used in houses and condos - Fuel oil, kerosene, etc. (%)
House heating fuel used in houses and condos - Coal or coke (%)
House heating fuel used in houses and condos - Wood (%)
House heating fuel used in houses and condos - Solar energy (%)
House heating fuel used in houses and condos - Other fuel (%)
House heating fuel used in houses and condos - No fuel used (%)
House heating fuel used in apartments - Utility gas (%)
House heating fuel used in apartments - Bottled, tank, or LP gas (%)
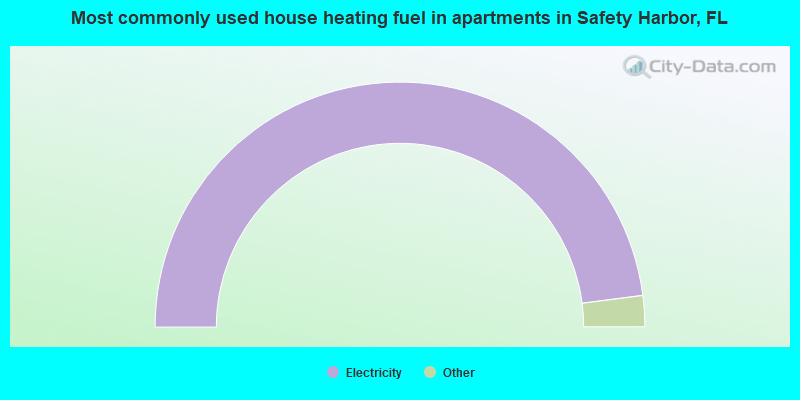
House heating fuel used in apartments - Electricity (%)
House heating fuel used in apartments - Fuel oil, kerosene, etc. (%)
House heating fuel used in apartments - Coal or coke (%)
House heating fuel used in apartments - Wood (%)
House heating fuel used in apartments - Solar energy (%)
House heating fuel used in apartments - Other fuel (%)
House heating fuel used in apartments - No fuel used (%)
Armed forces status - In Armed Forces (%)
Armed forces status - Civilian (%)
Armed forces status - Civilian - Veteran (%)
Armed forces status - Civilian - Nonveteran (%)
Fatal accidents locations in years 2005-2021
Fatal accidents locations in 2005
Fatal accidents locations in 2006
Fatal accidents locations in 2007
Fatal accidents locations in 2008
Fatal accidents locations in 2009
Fatal accidents locations in 2010
Fatal accidents locations in 2011
Fatal accidents locations in 2012
Fatal accidents locations in 2013
Fatal accidents locations in 2014
Fatal accidents locations in 2015
Fatal accidents locations in 2016
Fatal accidents locations in 2017
Fatal accidents locations in 2018
Fatal accidents locations in 2019
Fatal accidents locations in 2020
Fatal accidents locations in 2021
Alcohol use - People drinking some alcohol every month (%)
Alcohol use - People not drinking at all (%)
Alcohol use - Average days/month drinking alcohol
Alcohol use - Average drinks/week
Alcohol use - Average days/year people drink much
Audiometry - Average condition of hearing (%)
Audiometry - People that can hear a whisper from across a quiet room (%)
Audiometry - People that can hear normal voice from across a quiet room (%)
Audiometry - Ears ringing, roaring, buzzing (%)
Audiometry - Had a job exposure to loud noise (%)
Audiometry - Had off-work exposure to loud noise (%)
Blood Pressure & Cholesterol - Has high blood pressure (%)
Blood Pressure & Cholesterol - Checking blood pressure at home (%)
Blood Pressure & Cholesterol - Frequently checking blood cholesterol (%)
Blood Pressure & Cholesterol - Has high cholesterol level (%)
Consumer Behavior - Money monthly spent on food at supermarket/grocery store
Consumer Behavior - Money monthly spent on food at other stores
Consumer Behavior - Money monthly spent on eating out
Consumer Behavior - Money monthly spent on carryout/delivered foods
Consumer Behavior - Income spent on food at supermarket/grocery store (%)
Consumer Behavior - Income spent on food at other stores (%)
Consumer Behavior - Income spent on eating out (%)
Consumer Behavior - Income spent on carryout/delivered foods (%)
Current Health Status - General health condition (%)
Current Health Status - Blood donors (%)
Current Health Status - Has blood ever tested for HIV virus (%)
Current Health Status - Left-handed people (%)
Dermatology - People using sunscreen (%)
Diabetes - Diabetics (%)
Diabetes - Had a blood test for high blood sugar (%)
Diabetes - People taking insulin (%)
Diet Behavior & Nutrition - Diet health (%)
Diet Behavior & Nutrition - Milk product consumption (# of products/month)
Diet Behavior & Nutrition - Meals not home prepared (#/week)
Diet Behavior & Nutrition - Meals from fast food or pizza place (#/week)
Diet Behavior & Nutrition - Ready-to-eat foods (#/month)
Diet Behavior & Nutrition - Frozen meals/pizza (#/month)
Drug Use - People that ever used marijuana or hashish (%)
Drug Use - Ever used hard drugs (%)
Drug Use - Ever used any form of cocaine (%)
Drug Use - Ever used heroin (%)
Drug Use - Ever used methamphetamine (%)
Health Insurance - People covered by health insurance (%)
Kidney Conditions-Urology - Avg. # of times urinating at night
Medical Conditions - People with asthma (%)
Medical Conditions - People with anemia (%)
Medical Conditions - People with psoriasis (%)
Medical Conditions - People with overweight (%)
Medical Conditions - Elderly people having difficulties in thinking or remembering (%)
Medical Conditions - People who ever received blood transfusion (%)
Medical Conditions - People having trouble seeing even with glass/contacts (%)
Medical Conditions - People with arthritis (%)
Medical Conditions - People with gout (%)
Medical Conditions - People with congestive heart failure (%)
Medical Conditions - People with coronary heart disease (%)
Medical Conditions - People with angina pectoris (%)
Medical Conditions - People who ever had heart attack (%)
Medical Conditions - People who ever had stroke (%)
Medical Conditions - People with emphysema (%)
Medical Conditions - People with thyroid problem (%)
Medical Conditions - People with chronic bronchitis (%)
Medical Conditions - People with any liver condition (%)
Medical Conditions - People who ever had cancer or malignancy (%)
Mental Health - People who have little interest in doing things (%)
Mental Health - People feeling down, depressed, or hopeless (%)
Mental Health - People who have trouble sleeping or sleeping too much (%)
Mental Health - People feeling tired or having little energy (%)
Mental Health - People with poor appetite or overeating (%)
Mental Health - People feeling bad about themself (%)
Mental Health - People who have trouble concentrating on things (%)
Mental Health - People moving or speaking slowly or too fast (%)
Mental Health - People having thoughts they would be better off dead (%)
Oral Health - Average years since last visit a dentist
Oral Health - People embarrassed because of mouth (%)
Oral Health - People with gum disease (%)
Oral Health - General health of teeth and gums (%)
Oral Health - Average days a week using dental floss/device
Oral Health - Average days a week using mouthwash for dental problem
Oral Health - Average number of teeth
Pesticide Use - Households using pesticides to control insects (%)
Pesticide Use - Households using pesticides to kill weeds (%)
Physical Activity - People doing vigorous-intensity work activities (%)
Physical Activity - People doing moderate-intensity work activities (%)
Physical Activity - People walking or bicycling (%)
Physical Activity - People doing vigorous-intensity recreational activities (%)
Physical Activity - People doing moderate-intensity recreational activities (%)
Physical Activity - Average hours a day doing sedentary activities
Physical Activity - Average hours a day watching TV or videos
Physical Activity - Average hours a day using computer
Physical Functioning - People having limitations keeping them from working (%)
Physical Functioning - People limited in amount of work they can do (%)
Physical Functioning - People that need special equipment to walk (%)
Physical Functioning - People experiencing confusion/memory problems (%)
Physical Functioning - People requiring special healthcare equipment (%)
Prescription Medications - Average number of prescription medicines taking
Preventive Aspirin Use - Adults 40+ taking low-dose aspirin (%)
Reproductive Health - Vaginal deliveries (%)
Reproductive Health - Cesarean deliveries (%)
Reproductive Health - Deliveries resulted in a live birth (%)
Reproductive Health - Pregnancies resulted in a delivery (%)
Reproductive Health - Women breastfeeding newborns (%)
Reproductive Health - Women that had a hysterectomy (%)
Reproductive Health - Women that had both ovaries removed (%)
Reproductive Health - Women that have ever taken birth control pills (%)
Reproductive Health - Women taking birth control pills (%)
Reproductive Health - Women that have ever used Depo-Provera or injectables (%)
Reproductive Health - Women that have ever used female hormones (%)
Sexual Behavior - People 18+ that ever had sex (vaginal, anal, or oral) (%)
Sexual Behavior - Males 18+ that ever had vaginal sex with a woman (%)
Sexual Behavior - Males 18+ that ever performed oral sex on a woman (%)
Sexual Behavior - Males 18+ that ever had anal sex with a woman (%)
Sexual Behavior - Males 18+ that ever had any sex with a man (%)
Sexual Behavior - Females 18+ that ever had vaginal sex with a man (%)
Sexual Behavior - Females 18+ that ever performed oral sex on a man (%)
Sexual Behavior - Females 18+ that ever had anal sex with a man (%)
Sexual Behavior - Females 18+ that ever had any kind of sex with a woman (%)
Sexual Behavior - Average age people first had sex
Sexual Behavior - Average number of female sex partners in lifetime (males 18+)
Sexual Behavior - Average number of female vaginal sex partners in lifetime (males 18+)
Sexual Behavior - Average age people first performed oral sex on a woman (18+)
Sexual Behavior - Average number of woman performed oral sex on in lifetime (18+)
Sexual Behavior - Average number of male sex partners in lifetime (males 18+)
Sexual Behavior - Average number of male anal sex partners in lifetime (males 18+)
Sexual Behavior - Average age people first performed oral sex on a man (18+)
Sexual Behavior - Average number of male oral sex partners in lifetime (18+)
Sexual Behavior - People using protection when performing oral sex (%)
Sexual Behavior - Average number of times people have vaginal or anal sex a year
Sexual Behavior - People having sex without condom (%)
Sexual Behavior - Average number of male sex partners in lifetime (females 18+)
Sexual Behavior - Average number of male vaginal sex partners in lifetime (females 18+)
Sexual Behavior - Average number of female sex partners in lifetime (females 18+)
Sexual Behavior - Circumcised males 18+ (%)
Sleep Disorders - Average hours sleeping at night
Sleep Disorders - People that has trouble sleeping (%)
Smoking-Cigarette Use - People smoking cigarettes (%)
Taste & Smell - People 40+ having problems with smell (%)
Taste & Smell - People 40+ having problems with taste (%)
Taste & Smell - People 40+ that ever had wisdom teeth removed (%)
Taste & Smell - People 40+ that ever had tonsils teeth removed (%)
Taste & Smell - People 40+ that ever had a loss of consciousness because of a head injury (%)
Taste & Smell - People 40+ that ever had a broken nose or other serious injury to face or skull (%)
Taste & Smell - People 40+ that ever had two or more sinus infections (%)
Weight - Average height (inches)
Weight - Average weight (pounds)
Weight - Average BMI
Weight - People that are obese (%)
Weight - People that ever were obese (%)
Weight - People trying to lose weight (%)
According to our research of Florida and other state lists, there were 13 registered sex offenders living in Safety Harbor, Florida as of May 01, 2024 . The ratio of all residents to sex offenders in Safety Harbor is 1,358 to 1.The ratio of registered sex offenders to all residents in this city is lower than the state average.
Officers per 1,000 residents here:
0.06Florida average:
2.35
Latest news from Safety Harbor, FL collected exclusively by city-data.com from local newspapers, TV, and radio stations
Ancestries: American (18.5%), German (11.5%), Irish (9.9%), Italian (8.7%), English (4.8%), Jamaican (4.3%).
Current Local Time:
Land area: 4.92 square miles.
Population density: 3,461 people per square mile (average).
1,594 residents are foreign born (4.6% Latin America , 2.3% Asia ).
This city:
9.3%Florida:
21.1%
Median real estate property taxes paid for housing units with mortgages in 2022: $3,266 (0.7%)Median real estate property taxes paid for housing units with no mortgage in 2022: $2,467 (0.6%)
Nearest city with pop. 50,000+: Clearwater, FL
Nearest city with pop. 200,000+: Tampa, FL
Nearest city with pop. 1,000,000+: Houston, TX
Nearest cities:
Latitude: 28.00 N, Longitude: 82.70 W
Daytime population change due to commuting: +891 (+5.2%)Workers who live and work in this city: 2,883 (35.1%)
Area code commonly used in this area: 727
Property values in Safety Harbor, FL
Safety Harbor tourist attractions:
Single-family new house construction building permits:
2021: 3 buildings , average cost: $364,3002020: 10 buildings , average cost: $237,8002019: 16 buildings , average cost: $247,1002018: 20 buildings , average cost: $406,2002017: 24 buildings , average cost: $287,6002016: 31 buildings , average cost: $254,9002015: 25 buildings , average cost: $237,3002014: 25 buildings , average cost: $272,7002013: 11 buildings , average cost: $239,6002012: 34 buildings , average cost: $189,2002011: 8 buildings , average cost: $248,3002010: 4 buildings , average cost: $186,3002009: 6 buildings , average cost: $243,2002008: 2 buildings , average cost: $232,3002007: 12 buildings , average cost: $173,0002006: 22 buildings , average cost: $142,3002005: 15 buildings , average cost: $147,5002004: 27 buildings , average cost: $165,7002003: 88 buildings , average cost: $159,9002002: 47 buildings , average cost: $170,1002001: 32 buildings , average cost: $185,7002000: 64 buildings , average cost: $194,1001999: 53 buildings , average cost: $172,6001998: 41 buildings , average cost: $132,7001997: 49 buildings , average cost: $140,100Unemployment in December 2023:
Population change in the 1990s: +697 (+4.2%).
Most common occupations in Safety Harbor, FL (%)
Both Males Females
Retail sales workers, except cashiers (5.5%)
Sales representatives, services, wholesale and manufacturing (5.4%)
Other management occupations, except farmers and farm managers (5.1%)
Computer specialists (5.0%)
Other sales and related occupations, including supervisors (5.0%)
Other office and administrative support workers, including supervisors (4.1%)
Preschool, kindergarten, elementary, and middle school teachers (3.1%)
Other management occupations, except farmers and farm managers (6.9%)
Computer specialists (6.9%)
Sales representatives, services, wholesale and manufacturing (6.6%)
Other sales and related occupations, including supervisors (5.9%)
Retail sales workers, except cashiers (4.9%)
Material recording, scheduling, dispatching, and distributing workers (3.8%)
Building and grounds cleaning and maintenance occupations (3.2%)
Other office and administrative support workers, including supervisors (6.4%)
Retail sales workers, except cashiers (6.1%)
Registered nurses (4.9%)
Preschool, kindergarten, elementary, and middle school teachers (4.2%)
Sales representatives, services, wholesale and manufacturing (4.2%)
Information and record clerks, except customer service representatives (4.2%)
Other sales and related occupations, including supervisors (4.0%)
Tornado activity:
Safety Harbor-area historical tornado activity is slightly above Florida state average. It is 35% greater than the overall U.S. average.
On 4/4/1966, a category F4 (max. wind speeds 207-260 mph) tornado 8.7 miles away from the Safety Harbor city center killed 11 people and injured 530 people and caused between $5,000,000 and $50,000,000 in damages.
On 5/4/1978, a category F3 (max. wind speeds 158-206 mph) tornado 5.9 miles away from the city center killed 3 people and injured 94 people and caused between $500,000 and $5,000,000 in damages.
Earthquake activity:
Safety Harbor-area historical earthquake activity is significantly above Florida state average. It is 89% smaller than the overall U.S. average. On 9/10/2006 at 14:56:08, a magnitude 5.9 (5.9 MB, 5.5 MS, 5.8 MW, Class: Moderate, Intensity: VI - VII) earthquake occurred 270.9 miles away from Safety Harbor center On 10/24/1997 at 08:35:17, a magnitude 4.9 (4.8 MB, 4.2 MS, 4.9 LG, Depth: 6.2 mi, Class: Light, Intensity: IV - V) earthquake occurred 349.7 miles away from Safety Harbor center On 11/22/1974 at 05:25:55, a magnitude 4.7 (4.7 MB) earthquake occurred 371.1 miles away from Safety Harbor center On 8/2/1974 at 08:52:09, a magnitude 4.9 (4.3 MB, 4.9 LG) earthquake occurred 406.0 miles away from the city center On 5/6/2018 at 16:47:09, a magnitude 4.6 (4.6 MB, Depth: 6.2 mi) earthquake occurred 365.6 miles away from Safety Harbor center On 3/31/1992 at 14:59:39, a magnitude 3.8 (3.8 MB, Depth: 3.1 mi, Class: Light, Intensity: II - III) earthquake occurred 232.1 miles away from the city center Magnitude types: regional Lg-wave magnitude (LG), body-wave magnitude (MB), surface-wave magnitude (MS), moment magnitude (MW) Natural disasters: The number of natural disasters in Pinellas County (24) is greater than the US average (15).Major Disasters (Presidential) Declared: 14Emergencies Declared: 5Hurricanes: 10, Fires: 5, Floods: 4, Tornadoes: 4, Tropical Storms: 4, Storms: 3, Freeze: 1, Wind: 1, Other: 1 (Note: some incidents may be assigned to more than one category). Hospitals and medical centers in Safety Harbor: BAYVIEW COMMUNITY HOME (3438 SR 580) MEASE COUNTRYSIDE HOSPITAL (Voluntary non-profit - Private, provides emergency services, 3231 MCMULLEN BOOTH RD) MEASE COUNTRYSIDE SURGERY CENTER (1880 MEASE DR) TAMPA BAY HOME HEALTH CARE INC (3135 STATE RD 580, SUITE 14)
CONSULATE HEALTH CARE OF SAFETY HARBOR (1410 DR MARTIN LUTHER KING JR ST N)
SAFETY HARBOR HEALTH CENTER (1410 4TH ST)
Heliports located in Safety Harbor: Amtrak stations near Safety Harbor: 3 miles: CLEARWATER (20967 U.S. 19) - Bus Station 10 miles: TARPON SPRINGS (2337 U.S. 19) - Bus Station 12 miles: PINELLAS PARK (PARK BLVD. AT U.S. 19) - Bus Station Services: ticket office, enclosed waiting area, public restrooms, public payphones, full-service food facilities, free short-term parking, call for car rental service, call for taxi service, public transit connection.
Colleges/universities with over 2000 students nearest to Safety Harbor:
St Petersburg College (about 8 miles; Clearwater, FL ; Full-time enrollment: 21,467)
Strayer University-Florida (about 10 miles; Tampa, FL ; FT enrollment: 2,723)
The University of Tampa (about 15 miles; Tampa, FL ; FT enrollment: 7,216)
Ultimate Medical Academy-Tampa (about 15 miles; Tampa, FL ; FT enrollment: 16,672)
Hillsborough Community College (about 16 miles; Tampa, FL ; FT enrollment: 19,838)
University of South Florida-St Petersburg (about 18 miles; St. Petersburg, FL ; FT enrollment: 4,459)
University of South Florida-Main Campus (about 18 miles; Tampa, FL ; FT enrollment: 35,920)
Public elementary/middle schools in Safety Harbor:
Private elementary/middle schools in Safety Harbor: ESPIRITU SANTO CATHOLIC SCHOOL Students: 463, Location: 2405A PHILLIPPE PKWY, Grades: PK-8)
NORTHBAY CHRISTIAN ACADEMY Students: 97, Location: 2200 MARSHALL ST, Grades: PK-8)
See full list of schools located in Safety Harbor
Notable locations in Safety Harbor: (A) , Safety Harbor Fire Department Station 53 (B) . Display/hide their locations on the map
Churches in Safety Harbor include: (A) , First Presbyterian Church of Safety Harbor (B) , Buddhist Meditation Center (C) , Espiritu Santo Church (D) . Display/hide their locations on the map
Lake: (A) . Display/hide its location on the map
Creeks: (A) , Alligator Creek (B) . Display/hide their locations on the map
Parks in Safety Harbor include: (1) , Ian Tilmann Skatepark (2) , Philippe Park (3) , Safety Harbor Site (4) , Art Park (5) , Baranoff Park (6) , Daisy Douglas Park (7) , John Wilson Park (8) , Marina Park (9) . Display/hide their locations on the map
Birthplace of: Jeff Bronson - College basketball player (Western Michigan Broncos).
Pinellas County has a predicted average indoor radon screening level less than 2 pCi/L (pico curies per liter) - Low Potential Average household size: This city:
2.3 peopleFlorida:
2.5 people
Percentage of family households: This city:
63.7%Whole state:
65.2%
Percentage of households with unmarried partners: This city:
5.4%Whole state:
7.3%
Likely homosexual households (counted as self-reported same-sex unmarried-partner households)
Lesbian couples: 0.6% of all households Gay men: 0.4% of all households
People in group quarters in Safety Harbor in 2010:
112 people in nursing facilities/skilled-nursing facilities
35 people in group homes for juveniles (non-correctional)
6 people in group homes intended for adults
6 people in residential treatment centers for adults
5 people in workers' group living quarters and job corps centers
People in group quarters in Safety Harbor in 2000:
347 people in nursing homes
56 people in other noninstitutional group quarters
26 people in other nonhousehold living situations
18 people in homes for abused, dependent, and neglected children
Banks with branches in Safety Harbor (2011 data):
Regions Bank: Safety Harbor Branch at 601 Main Street, branch established on 1934/08/01. Info updated 2011/02/24: Bank assets: $123,368.2 mil, Deposits: $98,301.3 mil, headquarters in Birmingham, AL, positive income , Commercial Lending Specialization, 1778 total offices , Holding Company: Regions Financial Corporation
For population 15 years and over in Safety Harbor:
Never married: 28.9%Now married: 50.2%Separated: 0.4%Widowed: 8.1%Divorced: 12.4% For population 25 years and over in Safety Harbor:
High school or higher: 97.2%Bachelor's degree or higher: 44.7%Graduate or professional degree: 14.4%Unemployed: 3.1%Mean travel time to work (commute): 19.6 minutes
Education Gini index (Inequality in education) Here:
9.1Florida average:
12.2
Religion statistics for Safety Harbor, FL (based on Pinellas County data)
Religion Adherents Congregations Catholic 112,948 33 Evangelical Protestant 93,022 324 Mainline Protestant 65,326 122 Other 30,563 85 Orthodox 18,285 14 Black Protestant 9,955 40 None 586,443 -
Source: Clifford Grammich, Kirk Hadaway, Richard Houseal, Dale E.Jones, Alexei Krindatch, Richie Stanley and Richard H.Taylor. 2012. 2010 U.S.Religion Census: Religious Congregations & Membership Study. Association of Statisticians of American Religious Bodies. Jones, Dale E., et al. 2002. Congregations and Membership in the United States 2000. Nashville, TN: Glenmary Research Center. Graphs represent county-level data
Food Environment Statistics: Number of grocery stores : 200Pinellas County :
2.19 / 10,000 pop.State :
2.04 / 10,000 pop.
Number of supercenters and club stores : 6Pinellas County :
0.07 / 10,000 pop.Florida :
0.11 / 10,000 pop.
Number of convenience stores (no gas) : 166Pinellas County :
1.82 / 10,000 pop.State :
1.28 / 10,000 pop.
Number of convenience stores (with gas) : 243Pinellas County :
2.66 / 10,000 pop.State :
3.04 / 10,000 pop.
Number of full-service restaurants : 818This county :
8.95 / 10,000 pop.Florida :
7.45 / 10,000 pop.
Adult diabetes rate : Pinellas County :
9.0%Florida :
9.2%
Adult obesity rate : Pinellas County :
26.3%Florida :
23.7%
Low-income preschool obesity rate : This county :
14.0%Florida :
14.0%
Health and Nutrition:
Average overall health of teeth and gums : This city:
50.9%State:
49.4%
Average BMI : This city:
28.6Florida:
28.6
People feeling badly about themselves : This city:
20.8%Florida:
19.5%
People not drinking alcohol at all : Average hours sleeping at night : Overweight people : Safety Harbor:
36.2%Florida:
34.7%
General health condition : This city:
58.0%Florida:
57.0%
Average condition of hearing : Safety Harbor:
78.4%Florida:
79.2%
More about Health and Nutrition of Safety Harbor, FL Residents
Local government employment and payroll (March 2022)
Function
Full-time employees
Monthly full-time payroll
Average yearly full-time wage
Part-time employees
Monthly part-time payroll
Firefighters
30 $186,239 $74,496 0 $0 Parks and Recreation
23 $97,037 $50,628 28 $23,669 Other and Unallocable
22 $92,079 $50,225 1 $2,520 Solid Waste Management
15 $59,338 $47,470 0 $0 Financial Administration
13 $109,970 $101,511 0 $0 Local Libraries
11 $47,209 $51,501 9 $13,715 Sewerage
10 $38,644 $46,373 0 $0 Streets and Highways
8 $35,553 $53,330 0 $0 Water Supply
8 $41,126 $61,689 0 $0 Other Government Administration
3 $15,504 $62,016 5 $7,190
Totals for Government
143 $722,699 $60,646 43 $47,094
Safety Harbor government finances - Expenditure in 2017 (per resident):
Construction - Regular Highways: $504,000 ($29.61)
General - Other: $56,000 ($3.29)Current Operations - Local Fire Protection: $3,741,000 ($219.79)
Water Utilities: $3,233,000 ($189.94)Parks and Recreation: $2,851,000 ($167.50)Sewerage: $2,393,000 ($140.59)Solid Waste Management: $2,008,000 ($117.97)Financial Administration: $1,866,000 ($109.63)General - Other: $1,369,000 ($80.43)Police Protection: $1,260,000 ($74.03)Libraries: $1,204,000 ($70.74)Natural Resources - Other: $1,163,000 ($68.33)Regular Highways: $1,097,000 ($64.45)Central Staff Services: $918,000 ($53.93)Protective Inspection and Regulation - Other: $386,000 ($22.68)Judicial and Legal Services: $133,000 ($7.81)General - Interest on Debt: $177,000 ($10.40)
Other Capital Outlay - Parks and Recreation: $1,233,000 ($72.44)
Sewerage: $731,000 ($42.95)Solid Waste Management: $562,000 ($33.02)Natural Resources - Other: $274,000 ($16.10)Water Utilities: $246,000 ($14.45)Local Fire Protection: $104,000 ($6.11)Libraries: $84,000 ($4.94)Central Staff Services: $46,000 ($2.70)Water Utilities - Interest on Debt: $158,000 ($9.28)
Safety Harbor government finances - Revenue in 2017 (per resident):
Charges - Sewerage: $4,035,000 ($237.06)
Solid Waste Management: $2,875,000 ($168.91)Other: $1,175,000 ($69.03)Parks and Recreation: $829,000 ($48.70)Federal Intergovernmental - Other: $73,000 ($4.29)
Local Intergovernmental - General Local Government Support: $1,056,000 ($62.04)
Other: $236,000 ($13.87)Miscellaneous - General Revenue - Other: $1,668,000 ($98.00)
Interest Earnings: $1,058,000 ($62.16)Special Assessments: $313,000 ($18.39)Sale of Property: $51,000 ($3.00)Donations From Private Sources: $21,000 ($1.23)Rents: $21,000 ($1.23)Fines and Forfeits: $16,000 ($0.94)Revenue - Water Utilities: $3,427,000 ($201.34)
State Intergovernmental - General Local Government Support: $1,720,000 ($101.05)
Other: $42,000 ($2.47)Tax - Property: $4,390,000 ($257.92)
Public Utilities Sales: $2,322,000 ($136.42)Other Selective Sales: $2,083,000 ($122.38)Occupation and Business License - Other: $1,538,000 ($90.36)Other License: $244,000 ($14.34)Insurance Premiums Sales: $129,000 ($7.58)
Safety Harbor government finances - Debt in 2017 (per resident):
Long Term Debt - Beginning Outstanding - Unspecified Public Purpose: $11,589,000 ($680.86)
Outstanding Unspecified Public Purpose: $10,545,000 ($619.53)Retired Unspecified Public Purpose: $958,000 ($56.28)
Safety Harbor government finances - Cash and Securities in 2017 (per resident):
Other Funds - Cash and Securities: $28,293,000 ($1662.24)
Sinking Funds - Cash and Securities: $1,286,000 ($75.55)
8.11% of this county's 2021 resident taxpayers lived in other counties in 2020 ($93,200 average adjusted gross income )
Here:
8.11%Florida average:
8.80%
0.03% of residents moved from foreign countries ($207 average AGI )Pinellas County:
0.03%Florida average:
0.05%
Top counties from which taxpayers relocated into this county between 2020 and 2021:
7.13% of this county's 2020 resident taxpayers moved to other counties in 2021 ($67,596 average adjusted gross income )
Here:
7.13%Florida average:
7.45%
0.03% of residents moved to foreign countries ($306 average AGI )Pinellas County:
0.03%Florida average:
0.04%
Top counties to which taxpayers relocated from this county between 2020 and 2021:
Businesses in Safety Harbor, FL
Name Count Name Count
Circle K 1 Jones New York 1 Cold Stone Creamery 1 Nike 1 Curves 1 Starbucks 1 Dunkin Donuts 1 UPS 2 FedEx 5
Strongest AM radio stations in Safety Harbor:
WGUL (860 AM; 5 kW; DUNEDIN, FL; Owner: WGUL-FM, INC.)
WFLA (970 AM; 25 kW; TAMPA, FL; Owner: CITICASTERS LICENSES, L.P.)
WMGG (820 AM; 50 kW; LARGO, FL; Owner: MEGA COMMUNICATIONS OF ST. PETERSBURG LICENSEE)
WHNZ (1250 AM; 25 kW; TAMPA, FL; Owner: CITICASTERS LICENSES, L.P.)
WLVU (1470 AM; 5 kW; DUNEDIN, FL; Owner: GENESIS COMMUNICATIONS OF TAMPA BAY, INC.)
WTIS (1110 AM; daytime; 10 kW; TAMPA, FL; Owner: WTIS-AM, INC.)
WQYK (1010 AM; 50 kW; SEFFNER, FL; Owner: INFINITY BROADCASTING CORPORATION OF TAMPA)
WDAE (620 AM; 5 kW; ST. PETERSBURG, FL; Owner: CLEAR CHANNEL BROADCASTING LICENSES, INC.)
WTMP (1150 AM; 10 kW; EGYPT LAKE, FL; Owner: TAMPA BROADCASTING, LTD.)
WWMI (1380 AM; 5 kW; ST. PETERSBURG, FL; Owner: ABC, INC.)
WTBN (570 AM; 5 kW; PINELLAS PARK, FL; Owner: COMMON GROUND BROADCASTING, INC.)
WWBA (1040 AM; 4 kW; PINELLAS PARK, FL; Owner: GENESIS COMMUNICATIONS OF TAMPA BAY, INC.)
WFLF (540 AM; 50 kW; PINE HILLS, FL; Owner: CLEAR CHANNEL BROADCASTING LICENSES, INC.)
Strongest FM radio stations in Safety Harbor:
WBBY (107.3 FM; ST. PETERSBURG, FL; Owner: COX RADIO, INC.)
WXTB (97.9 FM; CLEARWATER, FL; Owner: CITICASTERS LICENSES, L.P.)
WRBQ-FM (104.7 FM; TAMPA, FL; Owner: INFINITY RADIO OPERATIONS INC.)
WDUV (105.5 FM; NEW PORT RICHEY, FL; Owner: CXR HOLDINGS, INC.)
WSSR (95.7 FM; CLEARWATER, FL; Owner: CLEAR CHANNEL BROADCASTING LICENSES, INC.)
WSUN-FM (97.1 FM; HOLIDAY, FL; Owner: COX RADIO, INC)
WPOI (101.5 FM; ST. PETERSBURG, FL; Owner: CXR HOLDINGS, INC.)
WWRM (94.9 FM; TAMPA, FL; Owner: COX RADIO, INC.)
WFLZ-FM (93.3 FM; TAMPA, FL; Owner: CITICASTERS LICENSES, L.P.)
WMTX (100.7 FM; TAMPA, FL; Owner: CITICASTERS LICENSES, L.P.)
WQYK-FM (99.5 FM; ST. PETERSBURG, FL; Owner: INFINITY BROADCASTING CORPORATION OF FLORIDA)
WTBT (103.5 FM; BRADENTON, FL; Owner: CITICASTERS LICENSES, L.P.)
WYUU (92.5 FM; SAFETY HARBOR, FL; Owner: INFINITY RADIO OPERATIONS INC.)
WUSF (89.7 FM; TAMPA, FL; Owner: UNIVERSITY OF S. FLORIDA)
WBVM (90.5 FM; TAMPA, FL; Owner: BISHOP OF THE DIOCESE/ST. PETERSBURG)
WYFE (88.9 FM; TARPON SPRINGS, FL; Owner: BIBLE BROADCASTING NETWORK, INC.)
WSJT (94.1 FM; LAKELAND, FL; Owner: INFINITY RADIO OPERATIONS INC.)
WLLD (98.7 FM; HOLMES BEACH, FL; Owner: INFINITY RADIO OPERATIONS INC.)
WHPT (102.5 FM; SARASOTA, FL; Owner: CXR HOLDINGS, INC.)
WLPJ (91.5 FM; NEW PORT RICHEY, FL; Owner: RADIO TRAINING NETWORK)
TV broadcast stations around Safety Harbor:
W36CO (Channel 36; ST. PETERSBURG, FL; Owner: TRINITY BROADCASTING NETWORK)
W48AY (Channel 48; OLDSMAR, FL; Owner: AMKA BROADCAST NETWORK, INC.)
WTSP (Channel 10; ST. PETERSBURG, FL; Owner: PACIFIC AND SOUTHERN COMPANY, INC.)
W33CC (Channel 33; ST. PETERSBURG, FL; Owner: VENTANA TELEVISION, INC.)
WEDU (Channel 3; TAMPA, FL; Owner: FLORIDA WEST COAST PUBLIC BROADCASTING, INC.)
WARP-CA (Channel 20; TAMPA-ST. PETERSBURG, FL; Owner: SUNSHINE BROADCASTING COMPANY, INC.)
WXAX-LP (Channel 26; CLEARWATER, FL; Owner: TIGER EYE BROADCASTING CORP.)
WFLA-TV (Channel 8; TAMPA, FL; Owner: MEDIA GENERAL COMMUNICATIONS, INC.)
WFTS-TV (Channel 28; TAMPA, FL; Owner: TAMPA BAY TELEVISION, INC.)
WTOG (Channel 44; ST. PETERSBURG, FL; Owner: VIACOM INTERNATIONAL INC.)
WXPX (Channel 66; BRADENTON, FL; Owner: PAXSON COMMUNICATION LICENSE COMPANY, LLC)
WUSF-TV (Channel 16; TAMPA, FL; Owner: UNIVERSITY OF SOUTH FLORIDA)
WRMD-LP (Channel 57; TAMPA, FL; Owner: ZGS TELEVISION OF TAMPA, INC.)
W61AI (Channel 61; ROCK HARBOR, FL; Owner: MAKO COMMUNICATIONS, LLC)
WTTA (Channel 38; ST. PETERSBURG, FL; Owner: BAY TELEVISION, INC.)
WFTT (Channel 50; TAMPA, FL; Owner: TELEFUTURA TAMPA LLC)
WTVT (Channel 13; TAMPA, FL; Owner: TVT LICENSE, INC.)
WCLF (Channel 22; CLEARWATER, FL; Owner: CHRISTIAN TELEVISION CORPORATION, INC.)
WTAM-LP (Channel 6; TAMPA, FL; Owner: U.S. INTERACTIVE, L.L.C.)
WVEA-LP (Channel 61; TAMPA, FL; Owner: ENTRAVISION HOLDINGS, LLC)
WMOR-LP (Channel 63; ST. PETERSBURG, FL; Owner: WMOR-TV COMPANY)
WMOR-TV (Channel 32; LAKELAND, FL; Owner: WMOR-TV COMPANY)
WSPF-CA (Channel 35; ST. PETERSBURG, FL; Owner: CITY OF ST. PETERSBURG)
W56EB (Channel 56; TAMPA, FL; Owner: TRINITY BROADCASTING NETWORK)
WSVT-LP (Channel 18; BRADENTON, FL; Owner: WORD OF GOD FELLOWSHIP, INC.)
National Bridge Inventory (NBI) Statistics 9 Number of bridges443ft / 135m Total length114,994 Total average daily traffic4,500 Total average daily truck traffic
FCC Registered Antenna Towers: 85 (
See the full list of FCC Registered Antenna Towers in Safety Harbor )
FCC Registered Commercial Land Mobile Towers: 1
Lat: 27.866667 Lon: -82.624167, Call Sign: KPL520, Assigned Frequencies: 455.550 MHz, Grant Date: 01/03/1991, Expiration Date: 02/01/2028, Registrant: Lerman Senter Pllc, 2000 K Street, Nw, Suite 600, Washington, DC 20006, Phone: (202) 429-8970, Email:
FCC Registered Broadcast Land Mobile Towers: 6
700 Main St (Lat: 27.991694 Lon: -82.701222), Call Sign: KNFP392, Assigned Frequencies: 154.995 MHz, Grant Date: 02/05/1997, Expiration Date: 04/22/2002, Cancellation Date: 08/25/2002, Registrant: Safety Harbor Fire Department, 700 Main St, Safety Harbor, FL 33572, Phone: (813) 726-2686 3231 Mcmullen Booth Rd (Lat: 28.039750 Lon: -82.707611), Call Sign: KNJM237, Assigned Frequencies: 463.000 MHz, 463.025 MHz, 463.050 MHz, 463.075 MHz, 463.100 MHz, 463.125 MHz, 463.150 MHz, 463.175 MHz, Grant Date: 03/03/1999, Expiration Date: 06/14/2004, Cancellation Date: 08/15/2004, Registrant: Mease Hospital Countryside, 3231 Mcmullen Booth Rd, Safety Harbor, FL 33572, Phone: (813) 733-1111 870 2nd Street North (Lat: 27.991417 Lon: -82.696222), Type: Tower, Structure height: 11 m, Overall height: 14 m, Call Sign: KEL816, Assigned Frequencies: 49.2000 MHz, Grant Date: 12/05/2013, Expiration Date: 02/08/2024, Cancellation Date: 12/13/2023, Certifier: Kevin Dumas, Registrant: Crenshaw Communications, Harvey Mitchell Parkway, College Station, TX 77842, Phone: (832) 617-0217, Email:
870 2nd Street North (Lat: 27.991417 Lon: -82.696222), Type: Tower, Structure height: 11 m, Overall height: 14 m, Call Sign: WCT357, Assigned Frequencies: 72.6200 MHz, Grant Date: 09/03/1997, Expiration Date: 09/03/2002, Cancellation Date: 02/07/2002, Certifier: Wayne Conrad, Registrant: Florida Gas Transmission, 245 N. Maylen Ave, Lecanto, FL 34461, Phone: (407) 838-7610, Fax: (407) 838-7610, Email:
3231 Mcmullen Booth Rd (Lat: 28.035000 Lon: -82.709167), Type: Bant, Structure height: 48 m, Overall height: 50 m, Call Sign: WQGD276, Licensee ID: L01422065, Assigned Frequencies: 152.007 MHz, Grant Date: 12/14/2006, Expiration Date: 12/14/2016, Cancellation Date: 02/10/2014, Certifier: Shawn E Endsley, Registrant: Usa Mobility Wireless, Inc., 3000 Technology Dr. #400, Plano, TX 75074, Phone: (972) 801-0000, Fax: (972) 801-1699, Email:
Railroad Ave (Lat: 27.998167 Lon: -82.696389), Type: Building, Structure height: 3 m, Overall height: 4.3 m, Call Sign: WRAJ997, Assigned Frequencies: 160.785 MHz, Grant Date: 12/11/2017, Expiration Date: 12/11/2027, Certifier: Shantrice Cruse-Scott, Registrant: Csx Transportation Inc, 6735 Southpoint Dr S, 4th Flr J958, Jacksonville, FL 32216, Phone: (904) 332-5925, Fax: (904) 332-6013, Email:
FCC Registered Microwave Towers: 4
STATION, 3231 Mc Mullen Booth Rd Mease Countryside Hospital (Lat: 28.039167 Lon: -82.707861), Structure height: 24.4 m, Overall height: 26.8 m, Call Sign: WNEW947, Assigned Frequencies: 6004.50 MHz, 6004.50 MHz, 6004.50 MHz, 6004.50 MHz, 6004.50 MHz, 6004.50 MHz, 11285.0 MHz, Grant Date: 11/27/2018, Expiration Date: 02/03/2029, Registrant: Pinellas County, Radio & Technology, 10750 Ulmerton Rd Suite 343, Largo, FL 33778, Phone: (727) 464-3879, Fax: (727) 464-5012, Email:
TAM0407, 3095 Mcmullen Booth Rd (Lat: 28.033944 Lon: -82.708250), Type: Tower, Structure height: 44.5 m, Overall height: 47.2 m, Call Sign: WQFV748, Licensee ID: L01728370, Assigned Frequencies: 21875.0 MHz, 10835.0 MHz, Grant Date: 10/17/2006, Expiration Date: 10/17/2016, Cancellation Date: 09/06/2013, Certifier: Joseph M Sandri Jr., Registrant: Fibertower Network Services, Corp., Debtor-In-Possession, 1875 Eye Street, Nw, 5th Floor, Room 505, Washington, DC 20006, Phone: (202) 223-1028, Email:
FL-TPA0182A, 1201 9th Avenue, South (Lat: 28.000278 Lon: -82.697111), Type: Pole, Structure height: 45.7 m, Call Sign: WQMJ249, Assigned Frequencies: 19525.0 MHz, 19625.0 MHz, Grant Date: 08/20/2010, Expiration Date: 08/20/2020, Cancellation Date: 08/10/2020, Certifier: Nadja S Sodos-Wallace, Registrant: Sprint Corporation, 12502 Sunrise Valley Drive, M/S: Varesa0209, Reston, VA 20196, Phone: (800) 572-8256, Fax: (703) 433-4483, Email:
A2H2294A, 250 - 9th Avenue North (Lat: 27.991694 Lon: -82.697361), Type: Mtower, Structure height: 36.6 m, Overall height: 39.6 m, Call Sign: WRZG873, Assigned Frequencies: 11245.0 MHz, 11245.0 MHz, 11245.0 MHz, 11245.0 MHz, 11245.0 MHz, 11245.0 MHz, 11245.0 MHz, 11245.0 MHz, 11245.0 MHz, 11245.0 MHz, 11245.0 MHz, Grant Date: 10/31/2023, Expiration Date: 10/31/2033, Certifier: Jenny Knopf, Registrant: T-Mobile Usa, Inc., 12920 Se 38th Street, Bellevue, WA 98006, Phone: (425) 383-8401, Fax: (425) 383-4040, Email:
FCC Registered Paging Towers: 1
Mease Hospital, 3231 Mcmullen Booth Rd. (Lat: 28.038611 Lon: -82.707861), Overall height: 1.8 m, Call Sign: KPA425, Assigned Frequencies: 931.837 MHz, Grant Date: 04/23/2019, Expiration Date: 04/01/2029, Certifier: J. Roy Pottle, Registrant: Wilkinson Barker Knauer, LLP, 1800 M Street, N.W., Suite 800n, Washington, DC 20036, Phone: (202) 783-4141, Fax: (202) 783-5851, Email:
FCC Registered Amateur Radio Licenses: 107 (
See the full list of FCC Registered Amateur Radio Licenses in Safety Harbor )
FAA Registered Aircraft Manufacturers and Dealers: 1 (
See the full list of FAA Registered Manufacturers and Dealers in Safety Harbor )
FAA Registered Aircraft: 16 (
See the full list of FAA Registered Aircraft )
Home Mortgage Disclosure Act Aggregated Statistics For Year 2009(Based on 4 partial tracts) A) FHA, FSA/RHS & VA B) Conventional C) Refinancings D) Home Improvement Loans F) Non-occupant Loans on G) Loans On Manufactured Number Average Value Number Average Value Number Average Value Number Average Value Number Average Value Number Average Value
LOANS ORIGINATED 31 $203,461 58 $217,884 189 $210,272 10 $62,188 16 $174,665 2 $46,170 APPLICATIONS APPROVED, NOT ACCEPTED 4 $264,202 3 $225,577 22 $214,304 0 $0 1 $394,800 0 $0 APPLICATIONS DENIED 2 $123,845 12 $183,596 81 $226,177 8 $71,066 8 $182,171 4 $42,005 APPLICATIONS WITHDRAWN 1 $202,190 9 $206,853 44 $198,217 2 $135,085 0 $0 1 $32,090 FILES CLOSED FOR INCOMPLETENESS 3 $158,287 3 $217,440 11 $203,441 0 $0 1 $235,050 1 $44,050
Aggregated Statistics For Year 2008(Based on 4 partial tracts) A) FHA, FSA/RHS & VA B) Conventional C) Refinancings D) Home Improvement Loans F) Non-occupant Loans on G) Loans On Manufactured Number Average Value Number Average Value Number Average Value Number Average Value Number Average Value Number Average Value
LOANS ORIGINATED 16 $208,216 93 $236,042 137 $195,826 17 $55,456 27 $157,254 9 $44,741 APPLICATIONS APPROVED, NOT ACCEPTED 1 $200,640 14 $219,933 31 $196,739 5 $83,486 4 $190,540 2 $38,120 APPLICATIONS DENIED 1 $213,260 28 $266,336 93 $223,295 18 $54,008 14 $178,204 6 $55,013 APPLICATIONS WITHDRAWN 4 $220,552 9 $299,848 36 $182,849 3 $174,850 3 $101,287 1 $37,760 FILES CLOSED FOR INCOMPLETENESS 0 $0 2 $185,680 15 $189,493 2 $201,875 4 $193,030 0 $0
Aggregated Statistics For Year 2007(Based on 4 partial tracts) A) FHA, FSA/RHS & VA B) Conventional C) Refinancings D) Home Improvement Loans F) Non-occupant Loans on G) Loans On Manufactured Number Average Value Number Average Value Number Average Value Number Average Value Number Average Value Number Average Value
LOANS ORIGINATED 5 $220,354 133 $209,745 237 $201,667 41 $112,249 35 $159,053 12 $55,939 APPLICATIONS APPROVED, NOT ACCEPTED 0 $0 23 $251,009 70 $192,608 6 $178,547 8 $148,978 3 $48,150 APPLICATIONS DENIED 2 $169,030 39 $191,313 129 $213,511 24 $89,242 11 $131,759 7 $68,170 APPLICATIONS WITHDRAWN 0 $0 16 $212,982 72 $216,920 8 $105,101 8 $147,016 1 $94,330 FILES CLOSED FOR INCOMPLETENESS 0 $0 10 $331,665 22 $241,858 1 $199,400 2 $149,330 0 $0
Aggregated Statistics For Year 2006(Based on 4 partial tracts) A) FHA, FSA/RHS & VA B) Conventional C) Refinancings D) Home Improvement Loans F) Non-occupant Loans on G) Loans On Manufactured Number Average Value Number Average Value Number Average Value Number Average Value Number Average Value Number Average Value
LOANS ORIGINATED 3 $288,913 239 $209,178 370 $195,042 38 $83,174 57 $186,158 14 $55,826 APPLICATIONS APPROVED, NOT ACCEPTED 0 $0 30 $203,603 72 $168,870 11 $83,268 11 $218,745 5 $59,022 APPLICATIONS DENIED 0 $0 48 $228,939 127 $321,433 26 $93,299 17 $958,405 7 $57,659 APPLICATIONS WITHDRAWN 0 $0 9 $268,390 97 $199,893 8 $130,971 4 $195,238 1 $69,220 FILES CLOSED FOR INCOMPLETENESS 0 $0 9 $224,246 28 $192,491 1 $47,010 4 $328,380 0 $0
Aggregated Statistics For Year 2005(Based on 4 partial tracts) A) FHA, FSA/RHS & VA B) Conventional C) Refinancings D) Home Improvement Loans F) Non-occupant Loans on G) Loans On Manufactured Number Average Value Number Average Value Number Average Value Number Average Value Number Average Value Number Average Value
LOANS ORIGINATED 4 $213,915 323 $196,298 389 $183,072 55 $148,697 71 $170,062 13 $55,008 APPLICATIONS APPROVED, NOT ACCEPTED 1 $84,250 31 $156,132 66 $208,253 16 $76,349 6 $153,607 8 $61,081 APPLICATIONS DENIED 1 $112,020 61 $198,940 139 $177,249 24 $66,850 19 $159,489 11 $57,552 APPLICATIONS WITHDRAWN 0 $0 32 $202,727 150 $170,972 15 $175,035 8 $151,345 5 $131,562 FILES CLOSED FOR INCOMPLETENESS 0 $0 13 $168,443 58 $191,607 2 $54,895 3 $115,170 1 $38,390
Aggregated Statistics For Year 2004(Based on 4 partial tracts) A) FHA, FSA/RHS & VA B) Conventional C) Refinancings D) Home Improvement Loans E) Loans on Dwellings For 5+ Families F) Non-occupant Loans on G) Loans On Manufactured Number Average Value Number Average Value Number Average Value Number Average Value Number Average Value Number Average Value Number Average Value
LOANS ORIGINATED 6 $144,397 339 $174,067 375 $145,958 45 $75,378 1 $342,170 90 $123,375 9 $48,456 APPLICATIONS APPROVED, NOT ACCEPTED 1 $98,800 50 $172,952 72 $117,817 5 $120,794 0 $0 12 $120,681 4 $48,992 APPLICATIONS DENIED 1 $223,010 40 $155,260 120 $126,514 28 $61,808 0 $0 14 $147,990 14 $56,859 APPLICATIONS WITHDRAWN 0 $0 34 $206,731 92 $146,312 19 $68,691 0 $0 7 $147,281 1 $33,940 FILES CLOSED FOR INCOMPLETENESS 0 $0 7 $171,687 55 $158,743 2 $51,880 0 $0 2 $149,685 1 $79,060
Aggregated Statistics For Year 2003(Based on 4 partial tracts) A) FHA, FSA/RHS & VA B) Conventional C) Refinancings D) Home Improvement Loans F) Non-occupant Loans on Number Average Value Number Average Value Number Average Value Number Average Value Number Average Value
LOANS ORIGINATED 14 $152,476 343 $162,147 896 $138,807 31 $54,269 81 $104,852 APPLICATIONS APPROVED, NOT ACCEPTED 1 $125,050 29 $154,384 110 $125,553 10 $47,340 10 $136,561 APPLICATIONS DENIED 2 $134,125 35 $133,791 191 $125,757 19 $52,173 13 $94,619 APPLICATIONS WITHDRAWN 3 $164,877 45 $202,204 98 $136,807 2 $11,750 10 $155,014 FILES CLOSED FOR INCOMPLETENESS 1 $118,430 7 $203,470 29 $168,191 1 $15,980 2 $149,465
Aggregated Statistics For Year 1999(Based on 2 partial tracts) A) FHA, FSA/RHS & VA B) Conventional C) Refinancings D) Home Improvement Loans E) Loans on Dwellings For 5+ Families F) Non-occupant Loans on Number Average Value Number Average Value Number Average Value Number Average Value Number Average Value Number Average Value
LOANS ORIGINATED 26 $90,153 276 $124,036 230 $90,614 34 $24,095 1 $174,590 42 $71,328 APPLICATIONS APPROVED, NOT ACCEPTED 2 $56,405 26 $91,577 45 $68,028 11 $14,310 0 $0 7 $59,710 APPLICATIONS DENIED 2 $77,090 51 $80,056 80 $81,199 25 $21,488 0 $0 10 $58,803 APPLICATIONS WITHDRAWN 2 $107,340 24 $111,330 74 $88,431 13 $43,516 0 $0 7 $71,051 FILES CLOSED FOR INCOMPLETENESS 1 $37,600 11 $142,023 19 $93,261 1 $1,610 0 $0 5 $102,512
Detailed HMDA statistics for the following Tracts:
0268.14
, 0268.15 , 0268.16 , 0268.17
Private Mortgage Insurance Companies Aggregated Statistics For Year 2009(Based on 4 partial tracts) A) Conventional B) Refinancings Number Average Value Number Average Value
LOANS ORIGINATED 7 $201,356 2 $235,745 APPLICATIONS APPROVED, NOT ACCEPTED 1 $306,380 1 $230,780 APPLICATIONS DENIED 1 $319,670 2 $128,425 APPLICATIONS WITHDRAWN 0 $0 0 $0 FILES CLOSED FOR INCOMPLETENESS 0 $0 0 $0
Aggregated Statistics For Year 2008(Based on 4 partial tracts) A) Conventional B) Refinancings C) Non-occupant Loans on Number Average Value Number Average Value Number Average Value
LOANS ORIGINATED 28 $244,550 5 $233,698 1 $210,450 APPLICATIONS APPROVED, NOT ACCEPTED 11 $289,107 6 $187,778 2 $200,645 APPLICATIONS DENIED 2 $121,935 1 $240,620 0 $0 APPLICATIONS WITHDRAWN 1 $140,090 1 $240,620 0 $0 FILES CLOSED FOR INCOMPLETENESS 0 $0 0 $0 0 $0
Aggregated Statistics For Year 2007(Based on 4 partial tracts) A) Conventional B) Refinancings C) Non-occupant Loans on Number Average Value Number Average Value Number Average Value
LOANS ORIGINATED 29 $241,458 5 $202,374 2 $231,340 APPLICATIONS APPROVED, NOT ACCEPTED 2 $200,860 6 $266,672 1 $274,900 APPLICATIONS DENIED 0 $0 5 $310,382 1 $155,440 APPLICATIONS WITHDRAWN 2 $219,965 2 $199,505 0 $0 FILES CLOSED FOR INCOMPLETENESS 0 $0 0 $0 0 $0
Aggregated Statistics For Year 2006(Based on 4 partial tracts) A) Conventional B) Refinancings C) Non-occupant Loans on D) Loans On Manufactured Number Average Value Number Average Value Number Average Value Number Average Value
LOANS ORIGINATED 21 $204,261 11 $253,531 3 $185,480 2 $74,570 APPLICATIONS APPROVED, NOT ACCEPTED 8 $286,561 5 $209,240 0 $0 0 $0 APPLICATIONS DENIED 0 $0 0 $0 0 $0 0 $0 APPLICATIONS WITHDRAWN 4 $412,695 0 $0 2 $267,830 0 $0 FILES CLOSED FOR INCOMPLETENESS 0 $0 1 $144,740 0 $0 0 $0
Aggregated Statistics For Year 2005(Based on 4 partial tracts) A) Conventional B) Refinancings C) Non-occupant Loans on D) Loans On Manufactured Number Average Value Number Average Value Number Average Value Number Average Value
LOANS ORIGINATED 52 $200,470 10 $204,280 6 $158,353 1 $101,320 APPLICATIONS APPROVED, NOT ACCEPTED 5 $217,246 6 $283,278 2 $184,430 0 $0 APPLICATIONS DENIED 0 $0 0 $0 0 $0 0 $0 APPLICATIONS WITHDRAWN 3 $313,703 1 $275,480 0 $0 0 $0 FILES CLOSED FOR INCOMPLETENESS 0 $0 0 $0 0 $0 0 $0
Aggregated Statistics For Year 2004(Based on 4 partial tracts) A) Conventional B) Refinancings C) Non-occupant Loans on D) Loans On Manufactured Number Average Value Number Average Value Number Average Value Number Average Value
LOANS ORIGINATED 39 $187,201 10 $133,420 9 $145,288 1 $38,390 APPLICATIONS APPROVED, NOT ACCEPTED 7 $272,763 6 $118,637 2 $178,405 0 $0 APPLICATIONS DENIED 1 $348,810 0 $0 0 $0 0 $0 APPLICATIONS WITHDRAWN 4 $148,475 0 $0 0 $0 0 $0 FILES CLOSED FOR INCOMPLETENESS 1 $127,870 0 $0 0 $0 0 $0
Aggregated Statistics For Year 2003(Based on 4 partial tracts) A) Conventional B) Refinancings C) Non-occupant Loans on Number Average Value Number Average Value Number Average Value
LOANS ORIGINATED 75 $164,592 56 $150,227 13 $113,898 APPLICATIONS APPROVED, NOT ACCEPTED 9 $169,723 6 $152,282 3 $155,700 APPLICATIONS DENIED 1 $263,030 0 $0 0 $0 APPLICATIONS WITHDRAWN 3 $298,180 2 $105,770 1 $91,200 FILES CLOSED FOR INCOMPLETENESS 0 $0 0 $0 0 $0
Aggregated Statistics For Year 1999(Based on 2 partial tracts) A) Conventional B) Refinancings C) Non-occupant Loans on Number Average Value Number Average Value Number Average Value
LOANS ORIGINATED 94 $127,693 29 $115,537 4 $72,995 APPLICATIONS APPROVED, NOT ACCEPTED 7 $94,163 3 $110,740 1 $46,200 APPLICATIONS DENIED 2 $93,475 1 $104,220 0 $0 APPLICATIONS WITHDRAWN 2 $91,690 1 $95,080 1 $68,220 FILES CLOSED FOR INCOMPLETENESS 0 $0 1 $70,820 0 $0
Detailed PMIC statistics for the following Tracts:
0268.14
, 0268.15 , 0268.16 , 0268.17 Fire-safe hotels and motels in Safety Harbor, Florida:
Safety Harbor Resort & Spa, 105 N Bayshore Dr, Safety Harbor, Florida 34695 Phone: (727) 726-1161, Fax: (727) 724-7749
Safety Harbor Motel, 1106 Main St, Safety Harbor, Florida 34695 Phone: (727) 726-1563
All 2 fire-safe hotels and motels in Safety Harbor, Florida
Most common first names in Safety Harbor, FL among deceased individuals Name Count Lived (average)
John 91 78.1 years William 78 78.6 years Mary 68 81.3 years Robert 65 72.7 years James 57 76.0 years Margaret 40 82.7 years Joseph 39 78.0 years Thomas 39 71.3 years Helen 37 83.1 years George 33 78.2 years
Most common last names in Safety Harbor, FL among deceased individuals Last name Count Lived (average)
Johnson 22 81.8 years Smith 21 80.1 years Miller 19 73.7 years Brown 14 79.7 years Williams 11 76.8 years White 10 85.5 years Davis 10 83.6 years Moore 10 82.6 years Adams 9 73.9 years Robinson 9 77.6 years
Safety Harbor compared to Florida state average:
Unemployed percentage significantly below state average. Black race population percentage below state average. Hispanic race population percentage significantly below state average. Median age above state average. Foreign-born population percentage below state average. Renting percentage below state average. Length of stay since moving in significantly above state average. Percentage of population with a bachelor's degree or higher above state average. Safety Harbor on our top lists :
#4 on the list of "Top 101 cities with the lowest number of police officers per 1000 residents (population 5,000+)"
#4 on the list of "Top 101 cities with the largest city-data.com crime index per police officer (population 5,000+)"
#3 on the list of "Top 101 counties with the highest percentage of residents that smoked 100+ cigarettes in their lives"
#6 on the list of "Top 101 counties with the most Orthodox adherents"
#26 on the list of "Top 101 counties with the lowest number of births per 1000 residents 2007-2013"
#31 on the list of "Top 101 counties with the lowest Sulfur Oxides Annual air pollution readings in 2012 (µg/m3 )"
#31 on the list of "Top 101 counties with the most Orthodox congregations"
Top Patent Applicants
David Howell Wright (18)
Kevin Keqiang Deng (17)
Anping Yu (16)
Paul M. Mears (15)
David H. Wright (9)
Vladimir Volochine (8)
Steven Tartaglia (7)
Roc Hatfield (5)
David Grootwassink (5)
Kevin Deng (5)
Total of 199 patent applications in 2008-2024.

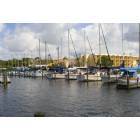
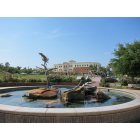
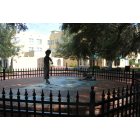
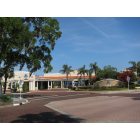
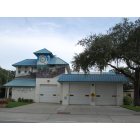
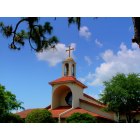
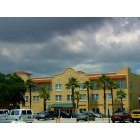
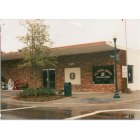
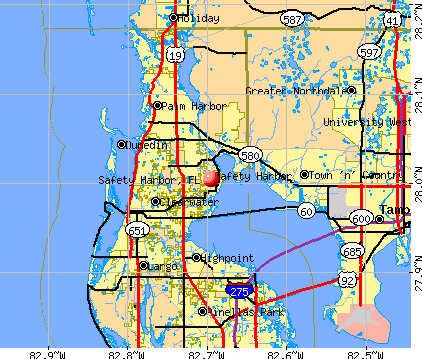


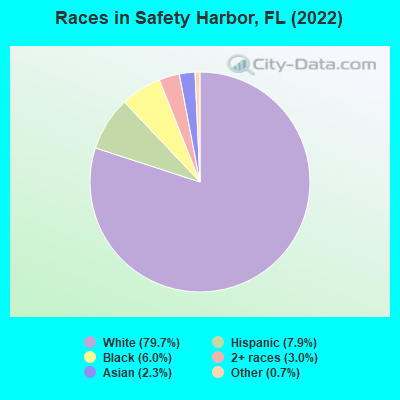
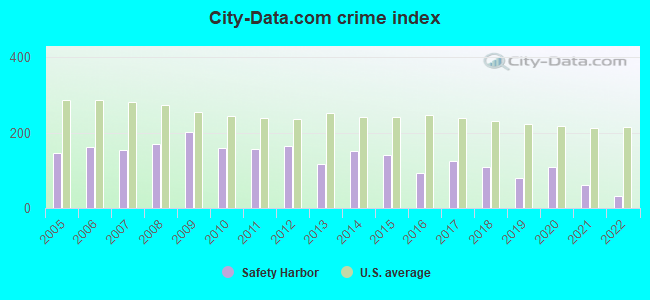
 Recent articles from our blog. Our writers, many of them Ph.D. graduates or candidates, create easy-to-read articles on a wide variety of topics.

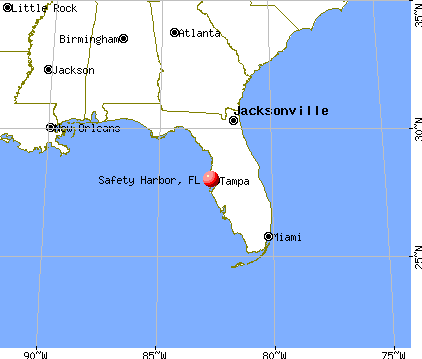
 (4.7 miles
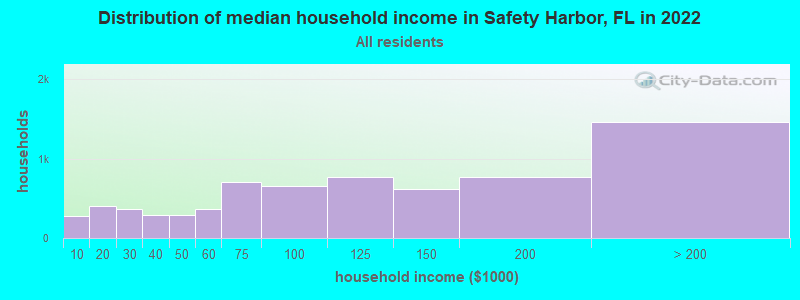
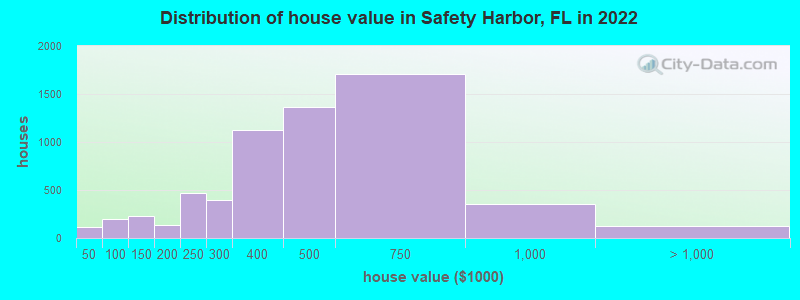
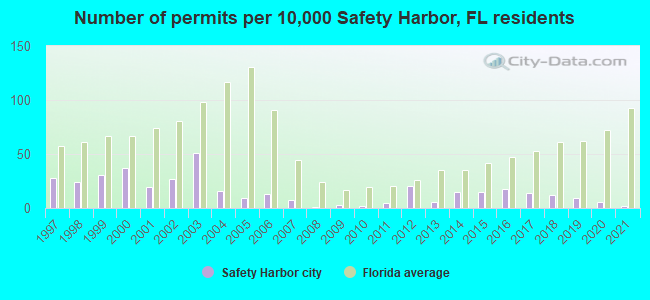
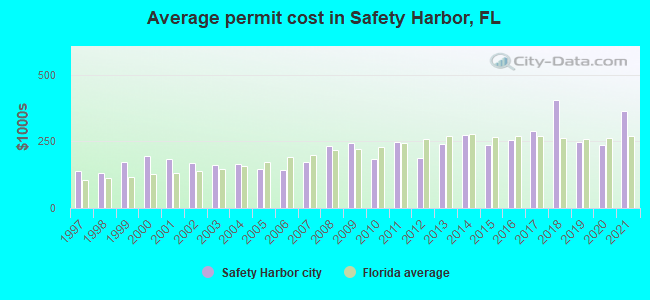
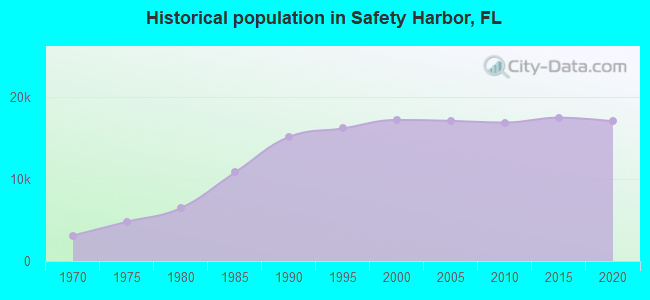
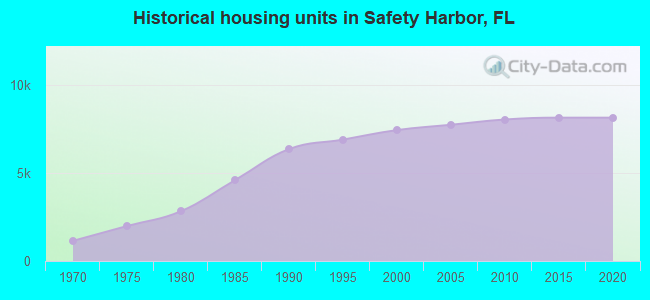
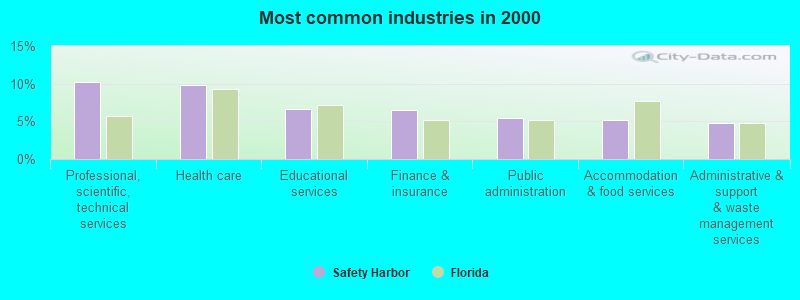
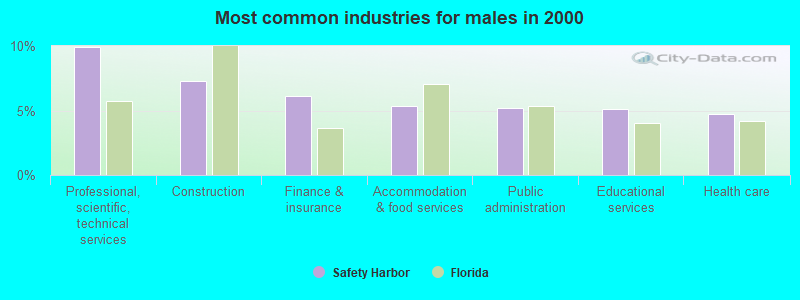
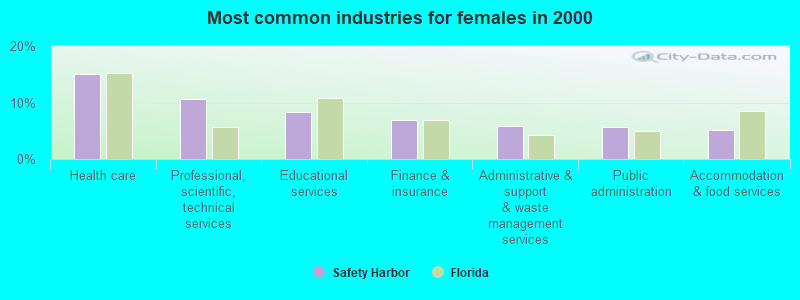
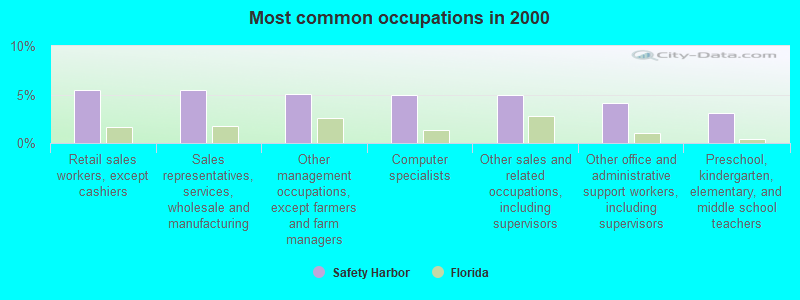
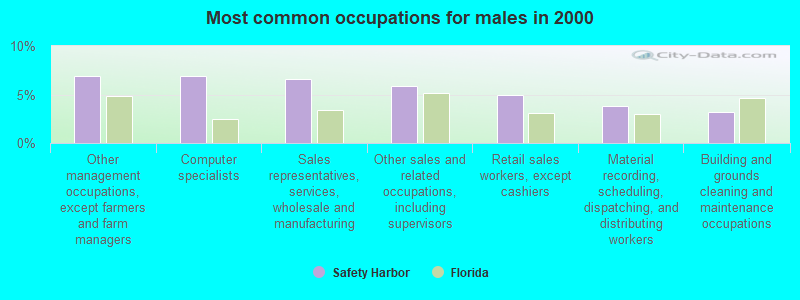
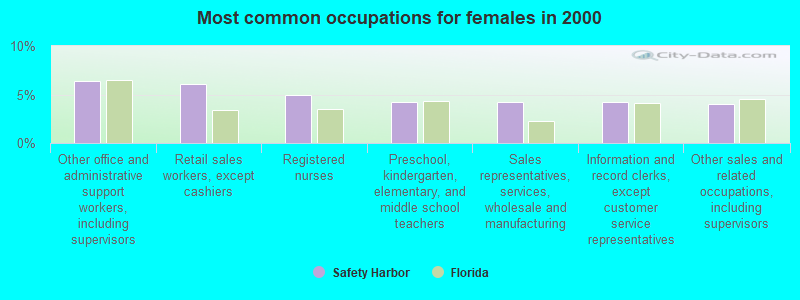
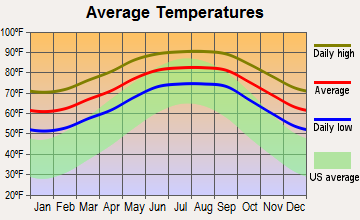
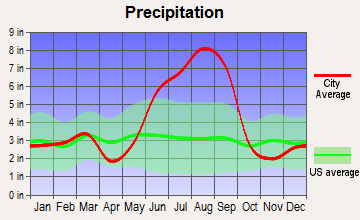
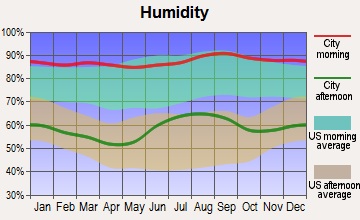
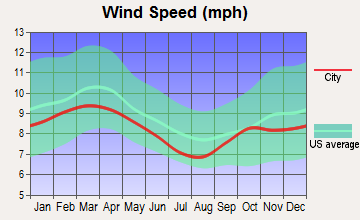
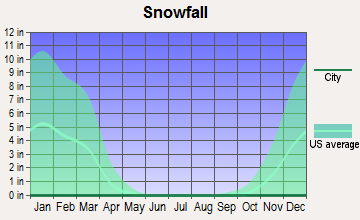
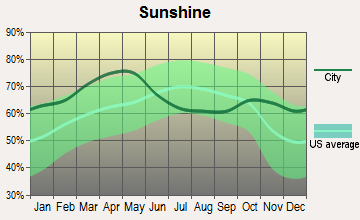
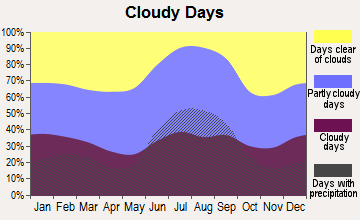


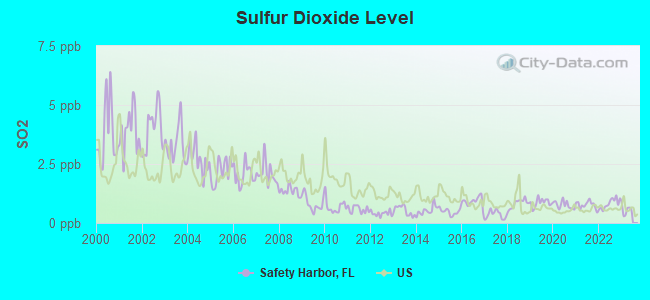
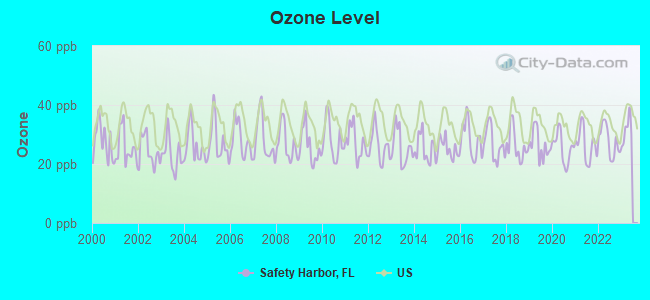
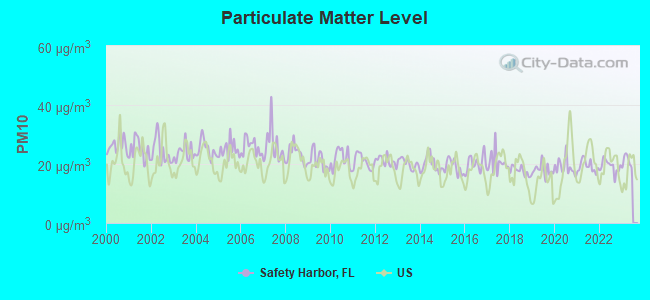
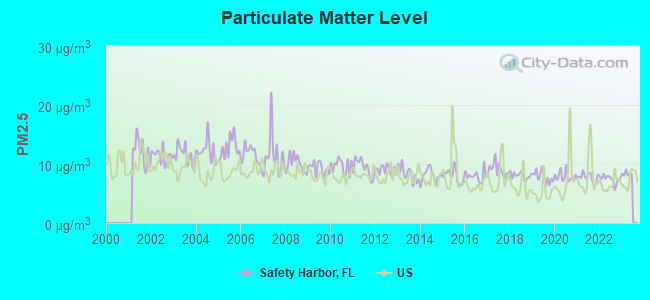
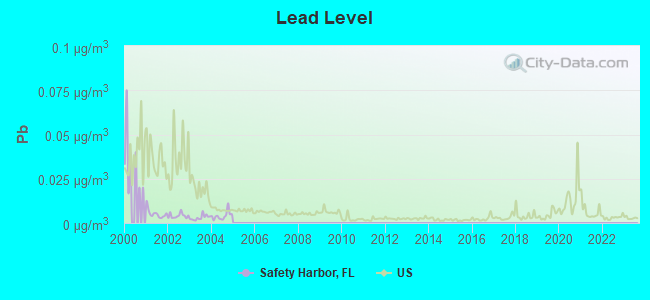
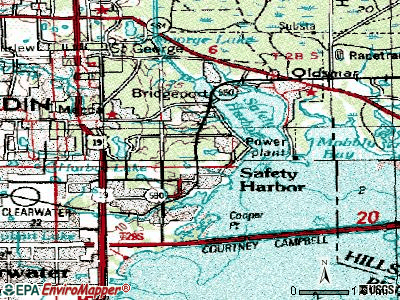
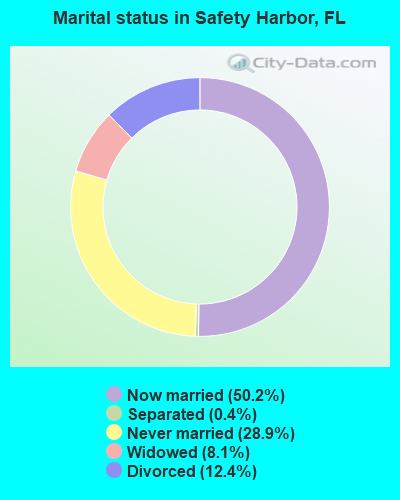
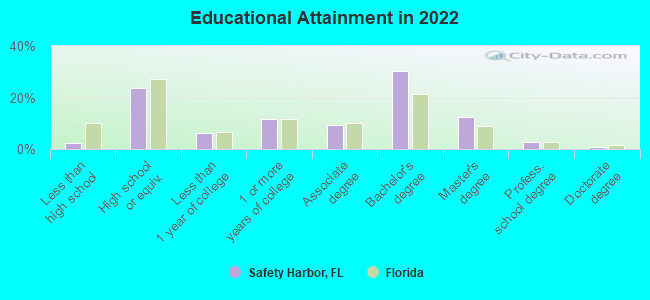
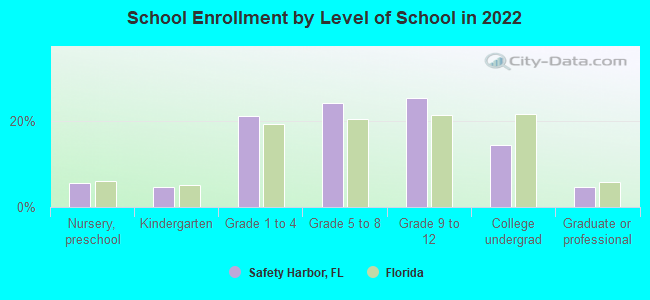
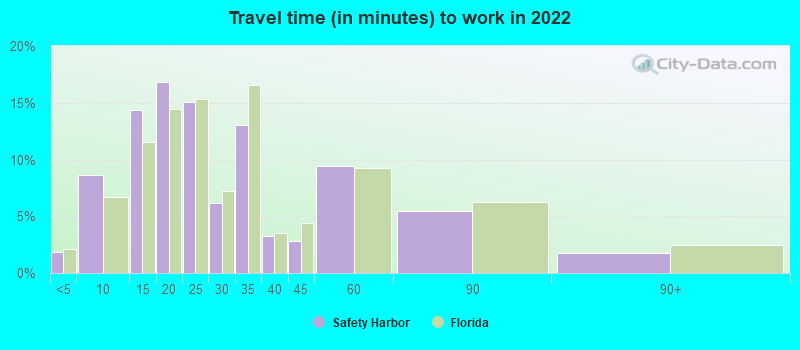
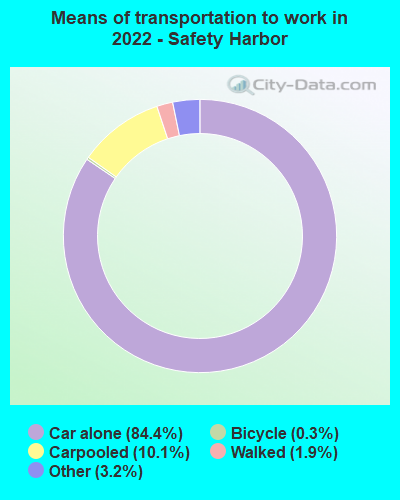
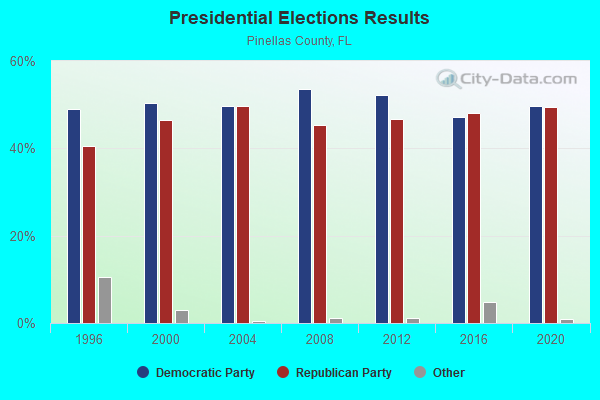

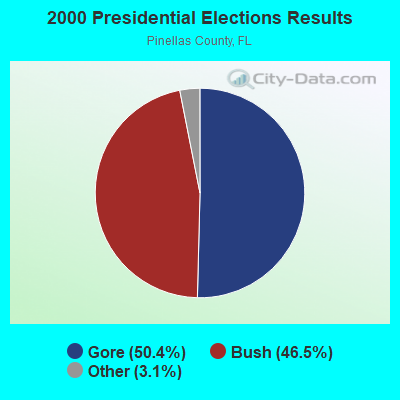
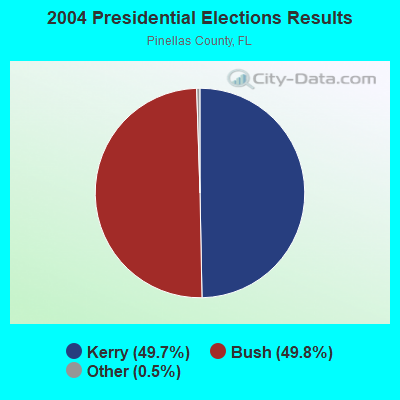
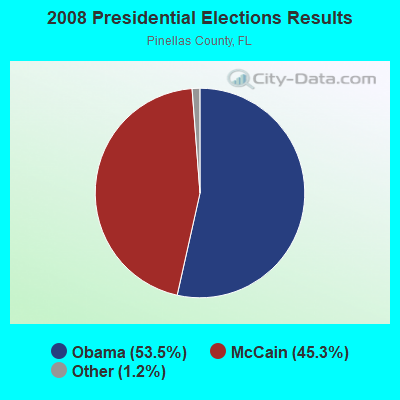
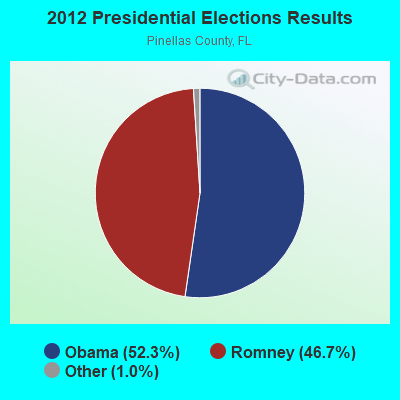
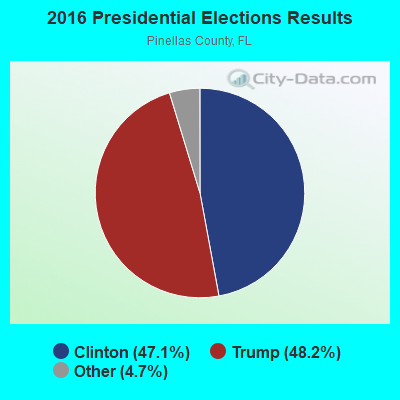
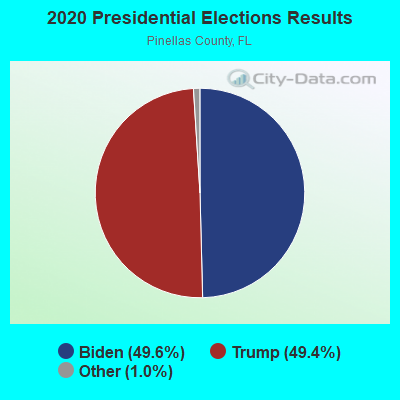
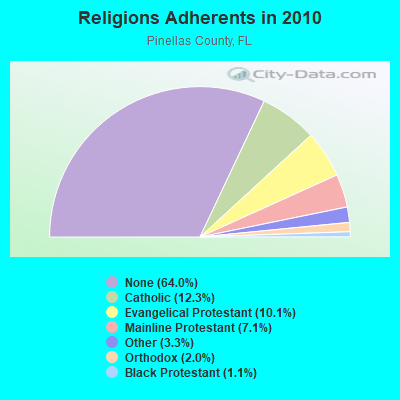
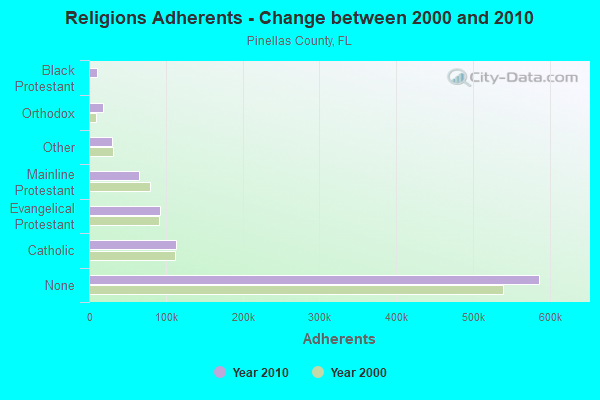
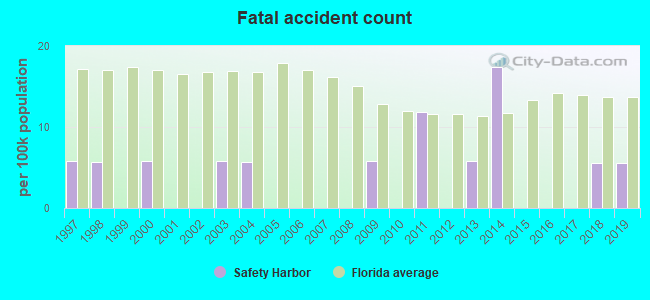
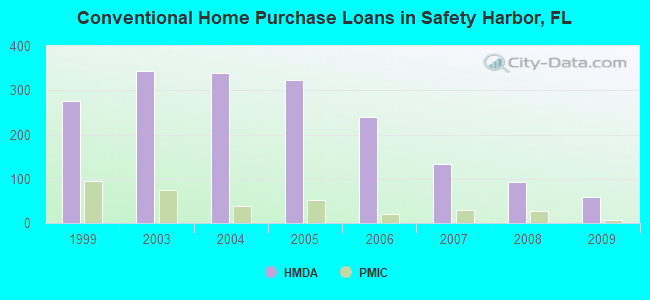
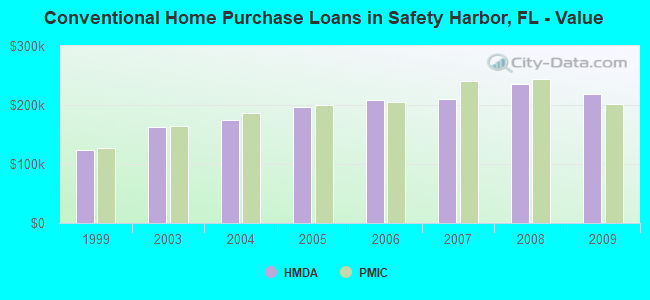
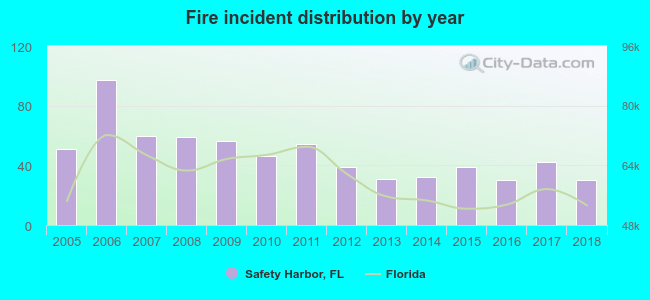 According to the data from the years 2005 - 2018 the average number of fires per year is 48. The highest number of reported fire incidents - 97 took place in 2006, and the least - 30 in 2016. The data has a decreasing trend.
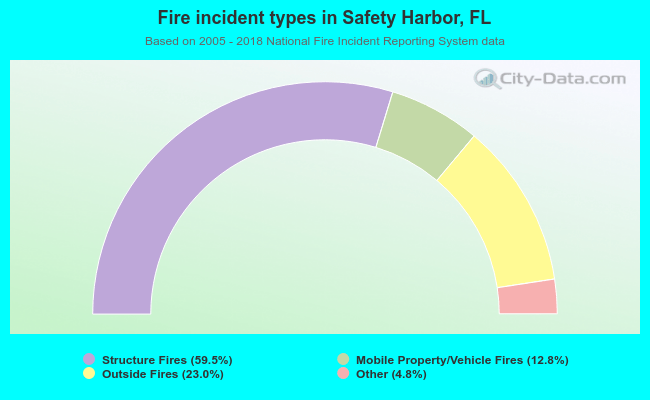 When looking into fire subcategories, the most incidents belonged to: Structure Fires (59.5%), and Outside Fires (23.0%).