South Williamsport, Pennsylvania Submit your own pictures of this borough and show them to the world
OSM Map
General Map
Google Map
MSN Map
OSM Map
General Map
Google Map
MSN Map
OSM Map
General Map
Google Map
MSN Map
OSM Map
General Map
Google Map
MSN Map
Please wait while loading the map...
Population in 2022: 6,205 (100% urban, 0% rural). Population change since 2000: -3.2%Males: 3,108 Females: 3,097
March 2022 cost of living index in South Williamsport: 91.8 (less than average, U.S. average is 100) Percentage of residents living in poverty in 2022: 11.9%for White Non-Hispanic residents , 9.0% for Black residents , 6.8% for Hispanic or Latino residents , 7.5% for two or more races residents )
Profiles of local businesses
Business Search - 14 Million verified businesses
Data:
Median household income ($)
Median household income (% change since 2000)
Household income diversity
Ratio of average income to average house value (%)
Ratio of average income to average rent
Median household income ($) - White
Median household income ($) - Black or African American
Median household income ($) - Asian
Median household income ($) - Hispanic or Latino
Median household income ($) - American Indian and Alaska Native
Median household income ($) - Multirace
Median household income ($) - Other Race
Median household income for houses/condos with a mortgage ($)
Median household income for apartments without a mortgage ($)
Races - White alone (%)
Races - White alone (% change since 2000)
Races - Black alone (%)
Races - Black alone (% change since 2000)
Races - American Indian alone (%)
Races - American Indian alone (% change since 2000)
Races - Asian alone (%)
Races - Asian alone (% change since 2000)
Races - Hispanic (%)
Races - Hispanic (% change since 2000)
Races - Native Hawaiian and Other Pacific Islander alone (%)
Races - Native Hawaiian and Other Pacific Islander alone (% change since 2000)
Races - Two or more races (%)
Races - Two or more races (% change since 2000)
Races - Other race alone (%)
Races - Other race alone (% change since 2000)
Racial diversity
Unemployment (%)
Unemployment (% change since 2000)
Unemployment (%) - White
Unemployment (%) - Black or African American
Unemployment (%) - Asian
Unemployment (%) - Hispanic or Latino
Unemployment (%) - American Indian and Alaska Native
Unemployment (%) - Multirace
Unemployment (%) - Other Race
Population density (people per square mile)
Population - Males (%)
Population - Females (%)
Population - Males (%) - White
Population - Males (%) - Black or African American
Population - Males (%) - Asian
Population - Males (%) - Hispanic or Latino
Population - Males (%) - American Indian and Alaska Native
Population - Males (%) - Multirace
Population - Males (%) - Other Race
Population - Females (%) - White
Population - Females (%) - Black or African American
Population - Females (%) - Asian
Population - Females (%) - Hispanic or Latino
Population - Females (%) - American Indian and Alaska Native
Population - Females (%) - Multirace
Population - Females (%) - Other Race
Coronavirus confirmed cases (May 01, 2024)
Deaths caused by coronavirus (May 01, 2024)
Coronavirus confirmed cases (per 100k population) (May 01, 2024)
Deaths caused by coronavirus (per 100k population) (May 01, 2024)
Daily increase in number of cases (May 01, 2024)
Weekly increase in number of cases (May 01, 2024)
Cases doubled (in days) (May 01, 2024)
Hospitalized patients (Apr 18, 2022)
Negative test results (Apr 18, 2022)
Total test results (Apr 18, 2022)
COVID Vaccine doses distributed (per 100k population) (Sep 19, 2023)
COVID Vaccine doses administered (per 100k population) (Sep 19, 2023)
COVID Vaccine doses distributed (Sep 19, 2023)
COVID Vaccine doses administered (Sep 19, 2023)
Likely homosexual households (%)
Likely homosexual households (% change since 2000)
Likely homosexual households - Lesbian couples (%)
Likely homosexual households - Lesbian couples (% change since 2000)
Likely homosexual households - Gay men (%)
Likely homosexual households - Gay men (% change since 2000)
Cost of living index
Median gross rent ($)
Median contract rent ($)
Median monthly housing costs ($)
Median house or condo value ($)
Median house or condo value ($ change since 2000)
Mean house or condo value by units in structure - 1, detached ($)
Mean house or condo value by units in structure - 1, attached ($)
Mean house or condo value by units in structure - 2 ($)
Mean house or condo value by units in structure by units in structure - 3 or 4 ($)
Mean house or condo value by units in structure - 5 or more ($)
Mean house or condo value by units in structure - Boat, RV, van, etc. ($)
Mean house or condo value by units in structure - Mobile home ($)
Median house or condo value ($) - White
Median house or condo value ($) - Black or African American
Median house or condo value ($) - Asian
Median house or condo value ($) - Hispanic or Latino
Median house or condo value ($) - American Indian and Alaska Native
Median house or condo value ($) - Multirace
Median house or condo value ($) - Other Race
Median resident age
Resident age diversity
Median resident age - Males
Median resident age - Females
Median resident age - White
Median resident age - Black or African American
Median resident age - Asian
Median resident age - Hispanic or Latino
Median resident age - American Indian and Alaska Native
Median resident age - Multirace
Median resident age - Other Race
Median resident age - Males - White
Median resident age - Males - Black or African American
Median resident age - Males - Asian
Median resident age - Males - Hispanic or Latino
Median resident age - Males - American Indian and Alaska Native
Median resident age - Males - Multirace
Median resident age - Males - Other Race
Median resident age - Females - White
Median resident age - Females - Black or African American
Median resident age - Females - Asian
Median resident age - Females - Hispanic or Latino
Median resident age - Females - American Indian and Alaska Native
Median resident age - Females - Multirace
Median resident age - Females - Other Race
Commute - mean travel time to work (minutes)
Travel time to work - Less than 5 minutes (%)
Travel time to work - Less than 5 minutes (% change since 2000)
Travel time to work - 5 to 9 minutes (%)
Travel time to work - 5 to 9 minutes (% change since 2000)
Travel time to work - 10 to 19 minutes (%)
Travel time to work - 10 to 19 minutes (% change since 2000)
Travel time to work - 20 to 29 minutes (%)
Travel time to work - 20 to 29 minutes (% change since 2000)
Travel time to work - 30 to 39 minutes (%)
Travel time to work - 30 to 39 minutes (% change since 2000)
Travel time to work - 40 to 59 minutes (%)
Travel time to work - 40 to 59 minutes (% change since 2000)
Travel time to work - 60 to 89 minutes (%)
Travel time to work - 60 to 89 minutes (% change since 2000)
Travel time to work - 90 or more minutes (%)
Travel time to work - 90 or more minutes (% change since 2000)
Marital status - Never married (%)
Marital status - Now married (%)
Marital status - Separated (%)
Marital status - Widowed (%)
Marital status - Divorced (%)
Median family income ($)
Median family income (% change since 2000)
Median non-family income ($)
Median non-family income (% change since 2000)
Median per capita income ($)
Median per capita income (% change since 2000)
Median family income ($) - White
Median family income ($) - Black or African American
Median family income ($) - Asian
Median family income ($) - Hispanic or Latino
Median family income ($) - American Indian and Alaska Native
Median family income ($) - Multirace
Median family income ($) - Other Race
Median year house/condo built
Median year apartment built
Year house built - Built 2005 or later (%)
Year house built - Built 2000 to 2004 (%)
Year house built - Built 1990 to 1999 (%)
Year house built - Built 1980 to 1989 (%)
Year house built - Built 1970 to 1979 (%)
Year house built - Built 1960 to 1969 (%)
Year house built - Built 1950 to 1959 (%)
Year house built - Built 1940 to 1949 (%)
Year house built - Built 1939 or earlier (%)
Average household size
Household density (households per square mile)
Average household size - White
Average household size - Black or African American
Average household size - Asian
Average household size - Hispanic or Latino
Average household size - American Indian and Alaska Native
Average household size - Multirace
Average household size - Other Race
Occupied housing units (%)
Vacant housing units (%)
Owner occupied housing units (%)
Renter occupied housing units (%)
Vacancy status - For rent (%)
Vacancy status - For sale only (%)
Vacancy status - Rented or sold, not occupied (%)
Vacancy status - For seasonal, recreational, or occasional use (%)
Vacancy status - For migrant workers (%)
Vacancy status - Other vacant (%)
Residents with income below the poverty level (%)
Residents with income below 50% of the poverty level (%)
Children below poverty level (%)
Poor families by family type - Married-couple family (%)
Poor families by family type - Male, no wife present (%)
Poor families by family type - Female, no husband present (%)
Poverty status for native-born residents (%)
Poverty status for foreign-born residents (%)
Poverty among high school graduates not in families (%)
Poverty among people who did not graduate high school not in families (%)
Residents with income below the poverty level (%) - White
Residents with income below the poverty level (%) - Black or African American
Residents with income below the poverty level (%) - Asian
Residents with income below the poverty level (%) - Hispanic or Latino
Residents with income below the poverty level (%) - American Indian and Alaska Native
Residents with income below the poverty level (%) - Multirace
Residents with income below the poverty level (%) - Other Race
Air pollution - Air Quality Index (AQI)
Air pollution - CO
Air pollution - NO2
Air pollution - SO2
Air pollution - Ozone
Air pollution - PM10
Air pollution - PM25
Air pollution - Pb
Crime - Murders per 100,000 population
Crime - Rapes per 100,000 population
Crime - Robberies per 100,000 population
Crime - Assaults per 100,000 population
Crime - Burglaries per 100,000 population
Crime - Thefts per 100,000 population
Crime - Auto thefts per 100,000 population
Crime - Arson per 100,000 population
Crime - City-data.com crime index
Crime - Violent crime index
Crime - Property crime index
Crime - Murders per 100,000 population (5 year average)
Crime - Rapes per 100,000 population (5 year average)
Crime - Robberies per 100,000 population (5 year average)
Crime - Assaults per 100,000 population (5 year average)
Crime - Burglaries per 100,000 population (5 year average)
Crime - Thefts per 100,000 population (5 year average)
Crime - Auto thefts per 100,000 population (5 year average)
Crime - Arson per 100,000 population (5 year average)
Crime - City-data.com crime index (5 year average)
Crime - Violent crime index (5 year average)
Crime - Property crime index (5 year average)
1996 Presidential Elections Results (%) - Democratic Party (Clinton)
1996 Presidential Elections Results (%) - Republican Party (Dole)
1996 Presidential Elections Results (%) - Other
2000 Presidential Elections Results (%) - Democratic Party (Gore)
2000 Presidential Elections Results (%) - Republican Party (Bush)
2000 Presidential Elections Results (%) - Other
2004 Presidential Elections Results (%) - Democratic Party (Kerry)
2004 Presidential Elections Results (%) - Republican Party (Bush)
2004 Presidential Elections Results (%) - Other
2008 Presidential Elections Results (%) - Democratic Party (Obama)
2008 Presidential Elections Results (%) - Republican Party (McCain)
2008 Presidential Elections Results (%) - Other
2012 Presidential Elections Results (%) - Democratic Party (Obama)
2012 Presidential Elections Results (%) - Republican Party (Romney)
2012 Presidential Elections Results (%) - Other
2016 Presidential Elections Results (%) - Democratic Party (Clinton)
2016 Presidential Elections Results (%) - Republican Party (Trump)
2016 Presidential Elections Results (%) - Other
2020 Presidential Elections Results (%) - Democratic Party (Biden)
2020 Presidential Elections Results (%) - Republican Party (Trump)
2020 Presidential Elections Results (%) - Other
Ancestries Reported - Arab (%)
Ancestries Reported - Czech (%)
Ancestries Reported - Danish (%)
Ancestries Reported - Dutch (%)
Ancestries Reported - English (%)
Ancestries Reported - French (%)
Ancestries Reported - French Canadian (%)
Ancestries Reported - German (%)
Ancestries Reported - Greek (%)
Ancestries Reported - Hungarian (%)
Ancestries Reported - Irish (%)
Ancestries Reported - Italian (%)
Ancestries Reported - Lithuanian (%)
Ancestries Reported - Norwegian (%)
Ancestries Reported - Polish (%)
Ancestries Reported - Portuguese (%)
Ancestries Reported - Russian (%)
Ancestries Reported - Scotch-Irish (%)
Ancestries Reported - Scottish (%)
Ancestries Reported - Slovak (%)
Ancestries Reported - Subsaharan African (%)
Ancestries Reported - Swedish (%)
Ancestries Reported - Swiss (%)
Ancestries Reported - Ukrainian (%)
Ancestries Reported - United States (%)
Ancestries Reported - Welsh (%)
Ancestries Reported - West Indian (%)
Ancestries Reported - Other (%)
Educational Attainment - No schooling completed (%)
Educational Attainment - Less than high school (%)
Educational Attainment - High school or equivalent (%)
Educational Attainment - Less than 1 year of college (%)
Educational Attainment - 1 or more years of college (%)
Educational Attainment - Associate degree (%)
Educational Attainment - Bachelor's degree (%)
Educational Attainment - Master's degree (%)
Educational Attainment - Professional school degree (%)
Educational Attainment - Doctorate degree (%)
School Enrollment - Nursery, preschool (%)
School Enrollment - Kindergarten (%)
School Enrollment - Grade 1 to 4 (%)
School Enrollment - Grade 5 to 8 (%)
School Enrollment - Grade 9 to 12 (%)
School Enrollment - College undergrad (%)
School Enrollment - Graduate or professional (%)
School Enrollment - Not enrolled in school (%)
School enrollment - Public schools (%)
School enrollment - Private schools (%)
School enrollment - Not enrolled (%)
Median number of rooms in houses and condos
Median number of rooms in apartments
Housing units lacking complete plumbing facilities (%)
Housing units lacking complete kitchen facilities (%)
Density of houses
Urban houses (%)
Rural houses (%)
Households with people 60 years and over (%)
Households with people 65 years and over (%)
Households with people 75 years and over (%)
Households with one or more nonrelatives (%)
Households with no nonrelatives (%)
Population in households (%)
Family households (%)
Nonfamily households (%)
Population in families (%)
Family households with own children (%)
Median number of bedrooms in owner occupied houses
Mean number of bedrooms in owner occupied houses
Median number of bedrooms in renter occupied houses
Mean number of bedrooms in renter occupied houses
Median number of vehichles in owner occupied houses
Mean number of vehichles in owner occupied houses
Median number of vehichles in renter occupied houses
Mean number of vehichles in renter occupied houses
Mortgage status - with mortgage (%)
Mortgage status - with second mortgage (%)
Mortgage status - with home equity loan (%)
Mortgage status - with both second mortgage and home equity loan (%)
Mortgage status - without a mortgage (%)
Average family size
Average family size - White
Average family size - Black or African American
Average family size - Asian
Average family size - Hispanic or Latino
Average family size - American Indian and Alaska Native
Average family size - Multirace
Average family size - Other Race
Geographical mobility - Same house 1 year ago (%)
Geographical mobility - Moved within same county (%)
Geographical mobility - Moved from different county within same state (%)
Geographical mobility - Moved from different state (%)
Geographical mobility - Moved from abroad (%)
Place of birth - Born in state of residence (%)
Place of birth - Born in other state (%)
Place of birth - Native, outside of US (%)
Place of birth - Foreign born (%)
Housing units in structures - 1, detached (%)
Housing units in structures - 1, attached (%)
Housing units in structures - 2 (%)
Housing units in structures - 3 or 4 (%)
Housing units in structures - 5 to 9 (%)
Housing units in structures - 10 to 19 (%)
Housing units in structures - 20 to 49 (%)
Housing units in structures - 50 or more (%)
Housing units in structures - Mobile home (%)
Housing units in structures - Boat, RV, van, etc. (%)
House/condo owner moved in on average (years ago)
Renter moved in on average (years ago)
Year householder moved into unit - Moved in 1999 to March 2000 (%)
Year householder moved into unit - Moved in 1995 to 1998 (%)
Year householder moved into unit - Moved in 1990 to 1994 (%)
Year householder moved into unit - Moved in 1980 to 1989 (%)
Year householder moved into unit - Moved in 1970 to 1979 (%)
Year householder moved into unit - Moved in 1969 or earlier (%)
Means of transportation to work - Drove car alone (%)
Means of transportation to work - Carpooled (%)
Means of transportation to work - Public transportation (%)
Means of transportation to work - Bus or trolley bus (%)
Means of transportation to work - Streetcar or trolley car (%)
Means of transportation to work - Subway or elevated (%)
Means of transportation to work - Railroad (%)
Means of transportation to work - Ferryboat (%)
Means of transportation to work - Taxicab (%)
Means of transportation to work - Motorcycle (%)
Means of transportation to work - Bicycle (%)
Means of transportation to work - Walked (%)
Means of transportation to work - Other means (%)
Working at home (%)
Industry diversity
Most Common Industries - Agriculture, forestry, fishing and hunting, and mining (%)
Most Common Industries - Agriculture, forestry, fishing and hunting (%)
Most Common Industries - Mining, quarrying, and oil and gas extraction (%)
Most Common Industries - Construction (%)
Most Common Industries - Manufacturing (%)
Most Common Industries - Wholesale trade (%)
Most Common Industries - Retail trade (%)
Most Common Industries - Transportation and warehousing, and utilities (%)
Most Common Industries - Transportation and warehousing (%)
Most Common Industries - Utilities (%)
Most Common Industries - Information (%)
Most Common Industries - Finance and insurance, and real estate and rental and leasing (%)
Most Common Industries - Finance and insurance (%)
Most Common Industries - Real estate and rental and leasing (%)
Most Common Industries - Professional, scientific, and management, and administrative and waste management services (%)
Most Common Industries - Professional, scientific, and technical services (%)
Most Common Industries - Management of companies and enterprises (%)
Most Common Industries - Administrative and support and waste management services (%)
Most Common Industries - Educational services, and health care and social assistance (%)
Most Common Industries - Educational services (%)
Most Common Industries - Health care and social assistance (%)
Most Common Industries - Arts, entertainment, and recreation, and accommodation and food services (%)
Most Common Industries - Arts, entertainment, and recreation (%)
Most Common Industries - Accommodation and food services (%)
Most Common Industries - Other services, except public administration (%)
Most Common Industries - Public administration (%)
Occupation diversity
Most Common Occupations - Management, business, science, and arts occupations (%)
Most Common Occupations - Management, business, and financial occupations (%)
Most Common Occupations - Management occupations (%)
Most Common Occupations - Business and financial operations occupations (%)
Most Common Occupations - Computer, engineering, and science occupations (%)
Most Common Occupations - Computer and mathematical occupations (%)
Most Common Occupations - Architecture and engineering occupations (%)
Most Common Occupations - Life, physical, and social science occupations (%)
Most Common Occupations - Education, legal, community service, arts, and media occupations (%)
Most Common Occupations - Community and social service occupations (%)
Most Common Occupations - Legal occupations (%)
Most Common Occupations - Education, training, and library occupations (%)
Most Common Occupations - Arts, design, entertainment, sports, and media occupations (%)
Most Common Occupations - Healthcare practitioners and technical occupations (%)
Most Common Occupations - Health diagnosing and treating practitioners and other technical occupations (%)
Most Common Occupations - Health technologists and technicians (%)
Most Common Occupations - Service occupations (%)
Most Common Occupations - Healthcare support occupations (%)
Most Common Occupations - Protective service occupations (%)
Most Common Occupations - Fire fighting and prevention, and other protective service workers including supervisors (%)
Most Common Occupations - Law enforcement workers including supervisors (%)
Most Common Occupations - Food preparation and serving related occupations (%)
Most Common Occupations - Building and grounds cleaning and maintenance occupations (%)
Most Common Occupations - Personal care and service occupations (%)
Most Common Occupations - Sales and office occupations (%)
Most Common Occupations - Sales and related occupations (%)
Most Common Occupations - Office and administrative support occupations (%)
Most Common Occupations - Natural resources, construction, and maintenance occupations (%)
Most Common Occupations - Farming, fishing, and forestry occupations (%)
Most Common Occupations - Construction and extraction occupations (%)
Most Common Occupations - Installation, maintenance, and repair occupations (%)
Most Common Occupations - Production, transportation, and material moving occupations (%)
Most Common Occupations - Production occupations (%)
Most Common Occupations - Transportation occupations (%)
Most Common Occupations - Material moving occupations (%)
People in Group quarters - Institutionalized population (%)
People in Group quarters - Correctional institutions (%)
People in Group quarters - Federal prisons and detention centers (%)
People in Group quarters - Halfway houses (%)
People in Group quarters - Local jails and other confinement facilities (including police lockups) (%)
People in Group quarters - Military disciplinary barracks (%)
People in Group quarters - State prisons (%)
People in Group quarters - Other types of correctional institutions (%)
People in Group quarters - Nursing homes (%)
People in Group quarters - Hospitals/wards, hospices, and schools for the handicapped (%)
People in Group quarters - Hospitals/wards and hospices for chronically ill (%)
People in Group quarters - Hospices or homes for chronically ill (%)
People in Group quarters - Military hospitals or wards for chronically ill (%)
People in Group quarters - Other hospitals or wards for chronically ill (%)
People in Group quarters - Hospitals or wards for drug/alcohol abuse (%)
People in Group quarters - Mental (Psychiatric) hospitals or wards (%)
People in Group quarters - Schools, hospitals, or wards for the mentally retarded (%)
People in Group quarters - Schools, hospitals, or wards for the physically handicapped (%)
People in Group quarters - Institutions for the deaf (%)
People in Group quarters - Institutions for the blind (%)
People in Group quarters - Orthopedic wards and institutions for the physically handicapped (%)
People in Group quarters - Wards in general hospitals for patients who have no usual home elsewhere (%)
People in Group quarters - Wards in military hospitals for patients who have no usual home elsewhere (%)
People in Group quarters - Juvenile institutions (%)
People in Group quarters - Long-term care (%)
People in Group quarters - Homes for abused, dependent, and neglected children (%)
People in Group quarters - Residential treatment centers for emotionally disturbed children (%)
People in Group quarters - Training schools for juvenile delinquents (%)
People in Group quarters - Short-term care, detention or diagnostic centers for delinquent children (%)
People in Group quarters - Type of juvenile institution unknown (%)
People in Group quarters - Noninstitutionalized population (%)
People in Group quarters - College dormitories (includes college quarters off campus) (%)
People in Group quarters - Military quarters (%)
People in Group quarters - On base (%)
People in Group quarters - Barracks, unaccompanied personnel housing (UPH), (Enlisted/Officer), ;and similar group living quarters for military personnel (%)
People in Group quarters - Transient quarters for temporary residents (%)
People in Group quarters - Military ships (%)
People in Group quarters - Group homes (%)
People in Group quarters - Homes or halfway houses for drug/alcohol abuse (%)
People in Group quarters - Homes for the mentally ill (%)
People in Group quarters - Homes for the mentally retarded (%)
People in Group quarters - Homes for the physically handicapped (%)
People in Group quarters - Other group homes (%)
People in Group quarters - Religious group quarters (%)
People in Group quarters - Dormitories (%)
People in Group quarters - Agriculture workers' dormitories on farms (%)
People in Group quarters - Job Corps and vocational training facilities (%)
People in Group quarters - Other workers' dormitories (%)
People in Group quarters - Crews of maritime vessels (%)
People in Group quarters - Other nonhousehold living situations (%)
People in Group quarters - Other noninstitutional group quarters (%)
Residents speaking English at home (%)
Residents speaking English at home - Born in the United States (%)
Residents speaking English at home - Native, born elsewhere (%)
Residents speaking English at home - Foreign born (%)
Residents speaking Spanish at home (%)
Residents speaking Spanish at home - Born in the United States (%)
Residents speaking Spanish at home - Native, born elsewhere (%)
Residents speaking Spanish at home - Foreign born (%)
Residents speaking other language at home (%)
Residents speaking other language at home - Born in the United States (%)
Residents speaking other language at home - Native, born elsewhere (%)
Residents speaking other language at home - Foreign born (%)
Class of Workers - Employee of private company (%)
Class of Workers - Self-employed in own incorporated business (%)
Class of Workers - Private not-for-profit wage and salary workers (%)
Class of Workers - Local government workers (%)
Class of Workers - State government workers (%)
Class of Workers - Federal government workers (%)
Class of Workers - Self-employed workers in own not incorporated business and Unpaid family workers (%)
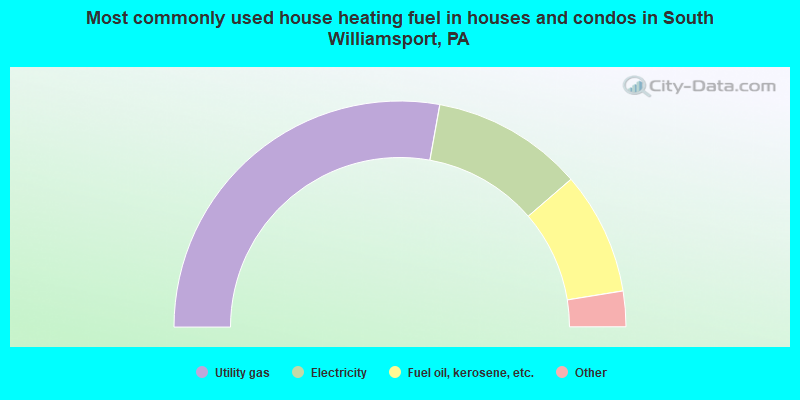
House heating fuel used in houses and condos - Utility gas (%)
House heating fuel used in houses and condos - Bottled, tank, or LP gas (%)
House heating fuel used in houses and condos - Electricity (%)
House heating fuel used in houses and condos - Fuel oil, kerosene, etc. (%)
House heating fuel used in houses and condos - Coal or coke (%)
House heating fuel used in houses and condos - Wood (%)
House heating fuel used in houses and condos - Solar energy (%)
House heating fuel used in houses and condos - Other fuel (%)
House heating fuel used in houses and condos - No fuel used (%)
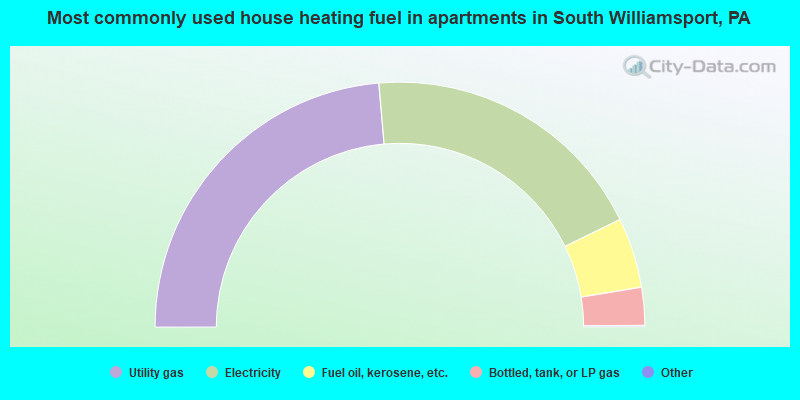
House heating fuel used in apartments - Utility gas (%)
House heating fuel used in apartments - Bottled, tank, or LP gas (%)
House heating fuel used in apartments - Electricity (%)
House heating fuel used in apartments - Fuel oil, kerosene, etc. (%)
House heating fuel used in apartments - Coal or coke (%)
House heating fuel used in apartments - Wood (%)
House heating fuel used in apartments - Solar energy (%)
House heating fuel used in apartments - Other fuel (%)
House heating fuel used in apartments - No fuel used (%)
Armed forces status - In Armed Forces (%)
Armed forces status - Civilian (%)
Armed forces status - Civilian - Veteran (%)
Armed forces status - Civilian - Nonveteran (%)
Fatal accidents locations in years 2005-2021
Fatal accidents locations in 2005
Fatal accidents locations in 2006
Fatal accidents locations in 2007
Fatal accidents locations in 2008
Fatal accidents locations in 2009
Fatal accidents locations in 2010
Fatal accidents locations in 2011
Fatal accidents locations in 2012
Fatal accidents locations in 2013
Fatal accidents locations in 2014
Fatal accidents locations in 2015
Fatal accidents locations in 2016
Fatal accidents locations in 2017
Fatal accidents locations in 2018
Fatal accidents locations in 2019
Fatal accidents locations in 2020
Fatal accidents locations in 2021
Alcohol use - People drinking some alcohol every month (%)
Alcohol use - People not drinking at all (%)
Alcohol use - Average days/month drinking alcohol
Alcohol use - Average drinks/week
Alcohol use - Average days/year people drink much
Audiometry - Average condition of hearing (%)
Audiometry - People that can hear a whisper from across a quiet room (%)
Audiometry - People that can hear normal voice from across a quiet room (%)
Audiometry - Ears ringing, roaring, buzzing (%)
Audiometry - Had a job exposure to loud noise (%)
Audiometry - Had off-work exposure to loud noise (%)
Blood Pressure & Cholesterol - Has high blood pressure (%)
Blood Pressure & Cholesterol - Checking blood pressure at home (%)
Blood Pressure & Cholesterol - Frequently checking blood cholesterol (%)
Blood Pressure & Cholesterol - Has high cholesterol level (%)
Consumer Behavior - Money monthly spent on food at supermarket/grocery store
Consumer Behavior - Money monthly spent on food at other stores
Consumer Behavior - Money monthly spent on eating out
Consumer Behavior - Money monthly spent on carryout/delivered foods
Consumer Behavior - Income spent on food at supermarket/grocery store (%)
Consumer Behavior - Income spent on food at other stores (%)
Consumer Behavior - Income spent on eating out (%)
Consumer Behavior - Income spent on carryout/delivered foods (%)
Current Health Status - General health condition (%)
Current Health Status - Blood donors (%)
Current Health Status - Has blood ever tested for HIV virus (%)
Current Health Status - Left-handed people (%)
Dermatology - People using sunscreen (%)
Diabetes - Diabetics (%)
Diabetes - Had a blood test for high blood sugar (%)
Diabetes - People taking insulin (%)
Diet Behavior & Nutrition - Diet health (%)
Diet Behavior & Nutrition - Milk product consumption (# of products/month)
Diet Behavior & Nutrition - Meals not home prepared (#/week)
Diet Behavior & Nutrition - Meals from fast food or pizza place (#/week)
Diet Behavior & Nutrition - Ready-to-eat foods (#/month)
Diet Behavior & Nutrition - Frozen meals/pizza (#/month)
Drug Use - People that ever used marijuana or hashish (%)
Drug Use - Ever used hard drugs (%)
Drug Use - Ever used any form of cocaine (%)
Drug Use - Ever used heroin (%)
Drug Use - Ever used methamphetamine (%)
Health Insurance - People covered by health insurance (%)
Kidney Conditions-Urology - Avg. # of times urinating at night
Medical Conditions - People with asthma (%)
Medical Conditions - People with anemia (%)
Medical Conditions - People with psoriasis (%)
Medical Conditions - People with overweight (%)
Medical Conditions - Elderly people having difficulties in thinking or remembering (%)
Medical Conditions - People who ever received blood transfusion (%)
Medical Conditions - People having trouble seeing even with glass/contacts (%)
Medical Conditions - People with arthritis (%)
Medical Conditions - People with gout (%)
Medical Conditions - People with congestive heart failure (%)
Medical Conditions - People with coronary heart disease (%)
Medical Conditions - People with angina pectoris (%)
Medical Conditions - People who ever had heart attack (%)
Medical Conditions - People who ever had stroke (%)
Medical Conditions - People with emphysema (%)
Medical Conditions - People with thyroid problem (%)
Medical Conditions - People with chronic bronchitis (%)
Medical Conditions - People with any liver condition (%)
Medical Conditions - People who ever had cancer or malignancy (%)
Mental Health - People who have little interest in doing things (%)
Mental Health - People feeling down, depressed, or hopeless (%)
Mental Health - People who have trouble sleeping or sleeping too much (%)
Mental Health - People feeling tired or having little energy (%)
Mental Health - People with poor appetite or overeating (%)
Mental Health - People feeling bad about themself (%)
Mental Health - People who have trouble concentrating on things (%)
Mental Health - People moving or speaking slowly or too fast (%)
Mental Health - People having thoughts they would be better off dead (%)
Oral Health - Average years since last visit a dentist
Oral Health - People embarrassed because of mouth (%)
Oral Health - People with gum disease (%)
Oral Health - General health of teeth and gums (%)
Oral Health - Average days a week using dental floss/device
Oral Health - Average days a week using mouthwash for dental problem
Oral Health - Average number of teeth
Pesticide Use - Households using pesticides to control insects (%)
Pesticide Use - Households using pesticides to kill weeds (%)
Physical Activity - People doing vigorous-intensity work activities (%)
Physical Activity - People doing moderate-intensity work activities (%)
Physical Activity - People walking or bicycling (%)
Physical Activity - People doing vigorous-intensity recreational activities (%)
Physical Activity - People doing moderate-intensity recreational activities (%)
Physical Activity - Average hours a day doing sedentary activities
Physical Activity - Average hours a day watching TV or videos
Physical Activity - Average hours a day using computer
Physical Functioning - People having limitations keeping them from working (%)
Physical Functioning - People limited in amount of work they can do (%)
Physical Functioning - People that need special equipment to walk (%)
Physical Functioning - People experiencing confusion/memory problems (%)
Physical Functioning - People requiring special healthcare equipment (%)
Prescription Medications - Average number of prescription medicines taking
Preventive Aspirin Use - Adults 40+ taking low-dose aspirin (%)
Reproductive Health - Vaginal deliveries (%)
Reproductive Health - Cesarean deliveries (%)
Reproductive Health - Deliveries resulted in a live birth (%)
Reproductive Health - Pregnancies resulted in a delivery (%)
Reproductive Health - Women breastfeeding newborns (%)
Reproductive Health - Women that had a hysterectomy (%)
Reproductive Health - Women that had both ovaries removed (%)
Reproductive Health - Women that have ever taken birth control pills (%)
Reproductive Health - Women taking birth control pills (%)
Reproductive Health - Women that have ever used Depo-Provera or injectables (%)
Reproductive Health - Women that have ever used female hormones (%)
Sexual Behavior - People 18+ that ever had sex (vaginal, anal, or oral) (%)
Sexual Behavior - Males 18+ that ever had vaginal sex with a woman (%)
Sexual Behavior - Males 18+ that ever performed oral sex on a woman (%)
Sexual Behavior - Males 18+ that ever had anal sex with a woman (%)
Sexual Behavior - Males 18+ that ever had any sex with a man (%)
Sexual Behavior - Females 18+ that ever had vaginal sex with a man (%)
Sexual Behavior - Females 18+ that ever performed oral sex on a man (%)
Sexual Behavior - Females 18+ that ever had anal sex with a man (%)
Sexual Behavior - Females 18+ that ever had any kind of sex with a woman (%)
Sexual Behavior - Average age people first had sex
Sexual Behavior - Average number of female sex partners in lifetime (males 18+)
Sexual Behavior - Average number of female vaginal sex partners in lifetime (males 18+)
Sexual Behavior - Average age people first performed oral sex on a woman (18+)
Sexual Behavior - Average number of woman performed oral sex on in lifetime (18+)
Sexual Behavior - Average number of male sex partners in lifetime (males 18+)
Sexual Behavior - Average number of male anal sex partners in lifetime (males 18+)
Sexual Behavior - Average age people first performed oral sex on a man (18+)
Sexual Behavior - Average number of male oral sex partners in lifetime (18+)
Sexual Behavior - People using protection when performing oral sex (%)
Sexual Behavior - Average number of times people have vaginal or anal sex a year
Sexual Behavior - People having sex without condom (%)
Sexual Behavior - Average number of male sex partners in lifetime (females 18+)
Sexual Behavior - Average number of male vaginal sex partners in lifetime (females 18+)
Sexual Behavior - Average number of female sex partners in lifetime (females 18+)
Sexual Behavior - Circumcised males 18+ (%)
Sleep Disorders - Average hours sleeping at night
Sleep Disorders - People that has trouble sleeping (%)
Smoking-Cigarette Use - People smoking cigarettes (%)
Taste & Smell - People 40+ having problems with smell (%)
Taste & Smell - People 40+ having problems with taste (%)
Taste & Smell - People 40+ that ever had wisdom teeth removed (%)
Taste & Smell - People 40+ that ever had tonsils teeth removed (%)
Taste & Smell - People 40+ that ever had a loss of consciousness because of a head injury (%)
Taste & Smell - People 40+ that ever had a broken nose or other serious injury to face or skull (%)
Taste & Smell - People 40+ that ever had two or more sinus infections (%)
Weight - Average height (inches)
Weight - Average weight (pounds)
Weight - Average BMI
Weight - People that are obese (%)
Weight - People that ever were obese (%)
Weight - People trying to lose weight (%)
Officers per 1,000 residents here:
1.25Pennsylvania average:
2.55
Latest news from South Williamsport, PA collected exclusively by city-data.com from local newspapers, TV, and radio stations
Ancestries: German (24.8%), American (15.1%), English (9.3%), Italian (7.9%), Irish (7.6%), French (4.9%).
Current Local Time:
Incorporated on 11/29/1886
Land area: 1.88 square miles.
Population density: 3,304 people per square mile (average).
385 residents are foreign born (3.5% Asia , 1.5% North America , 0.7% Europe ).
This borough:
6.2%Pennsylvania:
7.3%
Median real estate property taxes paid for housing units with mortgages in 2022: $2,271 (1.2%)Median real estate property taxes paid for housing units with no mortgage in 2022: $2,238 (1.3%)
Nearest city with pop. 50,000+: Scranton, PA
Nearest city with pop. 200,000+: Philadelphia, PA
Nearest cities:
Latitude: 41.23 N, Longitude: 77.00 W
Daytime population change due to commuting: -1,617 (-26.1%)Workers who live and work in this borough: 270 (9.0%)
Area code commonly used in this area: 570
Property values in South Williamsport, PA
Unemployment in December 2023: Here:
3.2%Pennsylvania:
2.9%
Population change in the 1990s: +79 (+1.2%).
Most common occupations in South Williamsport, PA (%)
Both Males Females
Other office and administrative support workers, including supervisors (7.1%)
Other production occupations, including supervisors (6.5%)
Information and record clerks, except customer service representatives (3.7%)
Secretaries and administrative assistants (3.7%)
Building and grounds cleaning and maintenance occupations (3.6%)
Metal workers and plastic workers (3.6%)
Counselors, social workers, and other community and social service specialists (3.3%)
Other production occupations, including supervisors (8.5%)
Metal workers and plastic workers (6.2%)
Electrical equipment mechanics and other installation, maintenance, and repair workers, including supervisors (5.1%)
Building and grounds cleaning and maintenance occupations (4.3%)
Other office and administrative support workers, including supervisors (4.0%)
Material recording, scheduling, dispatching, and distributing workers (4.0%)
Other sales and related occupations, including supervisors (3.8%)
Other office and administrative support workers, including supervisors (10.7%)
Secretaries and administrative assistants (8.0%)
Information and record clerks, except customer service representatives (7.5%)
Cashiers (4.9%)
Waiters and waitresses (4.6%)
Counselors, social workers, and other community and social service specialists (4.5%)
Personal appearance workers (4.2%)
Tornado activity:
South Williamsport-area historical tornado activity is slightly below Pennsylvania state average. It is 38% smaller than the overall U.S. average.
On 5/31/1985, a category F4 (max. wind speeds 207-260 mph) tornado 16.6 miles away from the South Williamsport borough center caused between $5,000,000 and $50,000,000 in damages.
On 5/31/1985, a category F3 (max. wind speeds 158-206 mph) tornado 8.5 miles away from the borough center killed 6 people and injured 60 people and caused between $5,000,000 and $50,000,000 in damages.
Earthquake activity:
South Williamsport-area historical earthquake activity is significantly above Pennsylvania state average. It is 64% smaller than the overall U.S. average. On 8/23/2011 at 17:51:04, a magnitude 5.8 (5.8 MW, Depth: 3.7 mi, Class: Moderate, Intensity: VI - VII) earthquake occurred 235.0 miles away from the city center On 9/25/1998 at 19:52:52, a magnitude 5.2 (4.8 MB, 4.3 MS, 5.2 LG, 4.5 MW, Depth: 3.1 mi) earthquake occurred 177.2 miles away from South Williamsport center On 1/16/1994 at 01:49:16, a magnitude 4.6 (4.6 MB, 4.6 LG, Depth: 3.1 mi, Class: Light, Intensity: IV - V) earthquake occurred 80.1 miles away from the city center On 10/7/1983 at 10:18:46, a magnitude 5.3 (5.1 MB, 5.3 LG, 5.1 ML) earthquake occurred 232.0 miles away from South Williamsport center On 1/31/1986 at 16:46:43, a magnitude 5.0 (5.0 MB) earthquake occurred 217.3 miles away from the city center On 4/20/2002 at 10:50:47, a magnitude 5.3 (5.3 ML, Depth: 3.0 mi) earthquake occurred 282.1 miles away from South Williamsport center Magnitude types: regional Lg-wave magnitude (LG), body-wave magnitude (MB), local magnitude (ML), surface-wave magnitude (MS), moment magnitude (MW) Natural disasters: The number of natural disasters in Lycoming County (18) is near the US average (15).Major Disasters (Presidential) Declared: 13Emergencies Declared: 4Storms: 6, Floods: 5, Tropical Storms: 3, Hurricanes: 2, Tropical Depressions: 2, Winter Storms: 2, Blizzard: 1, Flash Flood: 1, Heavy Rain: 1, Snowfall: 1, Snowstorm: 1, Tornado: 1, Wind: 1, Other: 1 (Note: some incidents may be assigned to more than one category). Hospitals and medical centers in South Williamsport: PAULINE HOME (6 EAST CENTRAL AVE)
Other hospitals and medical centers near South Williamsport: AMEDISYS HOME HEALTH (Home Health Center, about 2 miles away; WILLIAMSPORT, PA)
WILLIAMSPORT REGIONAL MEDICAL CENTER (about 2 miles away; WILLIAMSPORT, PA)
MAXIM HEALTHCARE SERVICES, INC (Home Health Center, about 2 miles away; WILLIAMSPORT, PA)
ROSE VIEW CENTER (Nursing Home, about 2 miles away; WILLIAMSPORT, PA)
BAYADA HOME HEALTH CARE INC (Home Health Center, about 3 miles away; WILLIAMSPORT, PA)
DIVINE PROVIDENCE HOSPITAL (Hospital, about 3 miles away; WILLIAMSPORT, PA)
WILLIAMSPORT HOME, THE (Nursing Home, about 3 miles away; WILLIAMSPORT, PA)
Colleges/universities with over 2000 students nearest to South Williamsport:
Pennsylvania College of Technology (about 2 miles; Williamsport, PA ; Full-time enrollment: 5,291)
Bucknell University (about 20 miles; Lewisburg, PA ; FT enrollment: 3,418)
Lock Haven University (about 25 miles; Lock Haven, PA ; FT enrollment: 5,184)
Susquehanna University (about 31 miles; Selinsgrove, PA ; FT enrollment: 2,495)
Bloomsburg University of Pennsylvania (about 33 miles; Bloomsburg, PA ; FT enrollment: 9,452)
Mansfield University of Pennsylvania (about 40 miles; Mansfield, PA ; FT enrollment: 2,826)
Pennsylvania State University-World Campus (about 52 miles; University Park, PA ; FT enrollment: 4,893)
Public high school in South Williamsport:
Public elementary/middle schools in South Williamsport: ROMMELT EL SCH Students: 204, Location: 515 WEST CENTRAL AVENUE, Grades: 5-6)CENTRAL EL SCH Location: 555 W MOUNTAIN AVE, Grades: KG-4)
Private elementary/middle school in South Williamsport: MOUNTAIN VIEW CHRISTIAN SCHOOL Students: 20, Location: 305 FLEMING ST, Grades: PK-8)
See full list of schools located in South Williamsport User-submitted facts and corrections:
Additional College/University: Lycoming College, Williamsport, PA 17701 (approx. number of students = 1500) added by Michael
Notable locations in South Williamsport: (A) , National Center for Little League Baseball (B) , Little League Baseball Headquarters and Museum (C) , First Ward Fire Company (D) , Independent Fire Company 1 of South Williamsport (E) , Citizens Fire Company 2 (F) . Display/hide their locations on the map
Streams, rivers, and creeks: (A) . Display/hide its location on the map
Lycoming County has a predicted average indoor radon screening level greater than 4 pCi/L (pico curies per liter) - Highest Potential Average household size: This borough:
2.3 peoplePennsylvania:
2.5 people
Percentage of family households: This borough:
62.1%Whole state:
65.0%
Percentage of households with unmarried partners: This borough:
8.3%Whole state:
6.6%
Likely homosexual households (counted as self-reported same-sex unmarried-partner households)
Lesbian couples: 0.3% of all households Gay men: 0.3% of all households
30 people in nursing facilities/skilled-nursing facilities in 2010people in nursing homes in 2000people in other noninstitutional group quarters in 2000
Banks with branches in South Williamsport (2011 data):
Citizens & Northern Bank: South Williamsport Branch at 2 East Mountain Avenue, branch established on 2004/09/07. Info updated 2012/02/14: Bank assets: $1,312.5 mil, Deposits: $1,019.9 mil, headquarters in Wellsboro, PA, positive income , Mortgage Lending Specialization, 26 total offices , Holding Company: Citizens And Northern Corporation
For population 15 years and over in South Williamsport:
Never married: 30.9%Now married: 49.4%Separated: 1.2%Widowed: 5.6%Divorced: 12.9% For population 25 years and over in South Williamsport:
High school or higher: 93.8%Bachelor's degree or higher: 26.2%Graduate or professional degree: 11.1%Unemployed: 1.5%Mean travel time to work (commute): 20.6 minutes
Education Gini index (Inequality in education) Here:
9.6Pennsylvania average:
11.4
Religion statistics for South Williamsport, PA (based on Lycoming County data)
Religion Adherents Congregations Mainline Protestant 25,272 114 Catholic 18,500 11 Evangelical Protestant 10,967 69 Other 1,591 7 Black Protestant 416 3 Orthodox 121 1 None 59,244 -
Source: Clifford Grammich, Kirk Hadaway, Richard Houseal, Dale E.Jones, Alexei Krindatch, Richie Stanley and Richard H.Taylor. 2012. 2010 U.S.Religion Census: Religious Congregations & Membership Study. Association of Statisticians of American Religious Bodies. Jones, Dale E., et al. 2002. Congregations and Membership in the United States 2000. Nashville, TN: Glenmary Research Center. Graphs represent county-level data
Food Environment Statistics: Number of grocery stores : 20Here :
1.71 / 10,000 pop.State :
2.04 / 10,000 pop.
Number of supercenters and club stores : 1This county :
0.09 / 10,000 pop.Pennsylvania :
0.09 / 10,000 pop.
Number of convenience stores (no gas) : 10This county :
0.86 / 10,000 pop.State :
0.88 / 10,000 pop.
Number of convenience stores (with gas) : 40This county :
3.42 / 10,000 pop.State :
2.52 / 10,000 pop.
Number of full-service restaurants : 95Here :
8.13 / 10,000 pop.Pennsylvania :
7.12 / 10,000 pop.
Adult diabetes rate : Lycoming County :
9.3%Pennsylvania :
9.1%
Adult obesity rate : Lycoming County :
25.7%Pennsylvania :
27.2%
Low-income preschool obesity rate : Lycoming County :
11.5%Pennsylvania :
11.5%
Health and Nutrition: Healthy diet rate : Here:
48.7%Pennsylvania:
50.2%
Average overall health of teeth and gums : South Williamsport:
48.7%Pennsylvania:
47.1%
Average BMI : South Williamsport:
27.7Pennsylvania:
28.7
People feeling badly about themselves : South Williamsport:
26.7%State:
20.8%
People not drinking alcohol at all : This city:
11.7%State:
10.9%
Average hours sleeping at night : Overweight people : South Williamsport:
32.1%Pennsylvania:
34.3%
General health condition : Here:
53.1%Pennsylvania:
56.2%
Average condition of hearing : South Williamsport:
81.1%Pennsylvania:
78.3%
More about Health and Nutrition of South Williamsport, PA Residents
Local government employment and payroll (March 2022)
Function
Full-time employees
Monthly full-time payroll
Average yearly full-time wage
Part-time employees
Monthly part-time payroll
Police Protection - Officers
10 $56,234 $67,481 0 $0 Other Government Administration
9 $5,038 $6,717 0 $0 Streets and Highways
4 $39,923 $119,769 0 $0 Sewerage
2 $11,110 $66,660 0 $0 Police - Other
1 $1,916 $22,992 9 $2,631 Firefighters
1 $1,000 $12,000 0 $0 Financial Administration
1 $2,692 $32,304 1 $1,165
Totals for Government
28 $117,914 $50,535 10 $3,796
South Williamsport government finances - Expenditure in 2017 (per resident):
Construction - Regular Highways: $681,000 ($109.75)
Sewerage: $163,000 ($26.27)Current Operations - Sewerage: $1,845,000 ($297.34)
Regular Highways: $738,000 ($118.94)Police Protection: $694,000 ($111.85)Housing and Community Development: $340,000 ($54.79)General - Other: $193,000 ($31.10)Central Staff Services: $169,000 ($27.24)Local Fire Protection: $118,000 ($19.02)Financial Administration: $100,000 ($16.12)General Public Buildings: $38,000 ($6.12)Protective Inspection and Regulation - Other: $35,000 ($5.64)Parks and Recreation: $34,000 ($5.48)Transit Utilities: $15,000 ($2.42)Judicial and Legal Services: $15,000 ($2.42)Natural Resources - Other: $13,000 ($2.10)Solid Waste Management: $10,000 ($1.61)Health - Other: $2,000 ($0.32)General - Interest on Debt: $227,000 ($36.58)
Other Capital Outlay - Police Protection: $30,000 ($4.83)
Sewerage: $19,000 ($3.06)Regular Highways: $18,000 ($2.90)Central Staff Services: $11,000 ($1.77)Total Salaries and Wages: $965,000 ($155.52)
South Williamsport government finances - Revenue in 2017 (per resident):
Charges - Sewerage: $2,136,000 ($344.24)
Solid Waste Management: $136,000 ($21.92)Other: $44,000 ($7.09)Regular Highways: $6,000 ($0.97)Parks and Recreation: $4,000 ($0.64)Federal Intergovernmental - Housing and Community Development: $340,000 ($54.79)
Local Intergovernmental - Other: $89,000 ($14.34)
General Local Government Support: $25,000 ($4.03)Highways: $5,000 ($0.81)Miscellaneous - Donations From Private Sources: $42,000 ($6.77)
Interest Earnings: $41,000 ($6.61)Fines and Forfeits: $34,000 ($5.48)General Revenue - Other: $11,000 ($1.77)Rents: $2,000 ($0.32)State Intergovernmental - Other: $355,000 ($57.21)
Highways: $184,000 ($29.65)General Local Government Support: $2,000 ($0.32)Tax - Property: $1,070,000 ($172.44)
Individual Income: $592,000 ($95.41)Public Utility License: $98,000 ($15.79)Occupation and Business License - Other: $77,000 ($12.41)Documentary and Stock Transfer: $63,000 ($10.15)
South Williamsport government finances - Debt in 2017 (per resident):
Long Term Debt - Outstanding Unspecified Public Purpose: $11,164,000 ($1799.19)
Beginning Outstanding - Unspecified Public Purpose: $9,301,000 ($1498.95)Issue, Unspecified Public Purpose: $6,282,000 ($1012.41)Retired Unspecified Public Purpose: $4,419,000 ($712.17)
South Williamsport government finances - Cash and Securities in 2017 (per resident):
Bond Funds - Cash and Securities: $2,031,000 ($327.32)
Other Funds - Cash and Securities: $6,510,000 ($1049.15)
Businesses in South Williamsport, PA
Name Count Name Count
CVS 1 Penske 1 Dairy Queen 1 Subway 1 McDonald's 1 True Value 1
Strongest AM radio stations in South Williamsport:
WWPA (1340 AM; 1 kW; WILLIAMSPORT, PA; Owner: SOUTH WILLIAMSPORT SABRECOM, INC.)
WRAK (1400 AM; 1 kW; WILLIAMSPORT, PA; Owner: CLEAR CHANNEL BROADCASTING LICENSES, INC.)
WLYC (1050 AM; 1 kW; WILLIAMSPORT, PA; Owner: WILLIAMSPORT COMMUNICATIONS, INC.)
WRKK (1200 AM; 10 kW; HUGHESVILLE, PA; Owner: CLEAR CHANNEL BROADCASTING LICENSES, INC.)
WKOK (1070 AM; 10 kW; SUNBURY, PA; Owner: SUNBURY BROADCASTING CORPORATION)
WWJZ (640 AM; 50 kW; MOUNT HOLLY, NJ; Owner: ABC, INC.)
WCBM (680 AM; 50 kW; BALTIMORE, MD; Owner: WCBM MARYLAND, INC.)
WVCH (740 AM; 50 kW; CHESTER, PA; Owner: WVCH COMMUNICATIONS, INC.)
WEEU (830 AM; 20 kW; READING, PA; Owner: WEEU BROADCASTING COMPANY)
WZZD (990 AM; 50 kW; PHILADELPHIA, PA; Owner: PENNSYLVANIA MEDIA ASSOCIATES, INC.)
WMCA (570 AM; 50 kW; NEW YORK, NY; Owner: SALEM MEDIA OF NEW YORK, LLC)
WJSA (1600 AM; 1 kW; JERSEY SHORE, PA; Owner: COVENANT BROADCASTING COMPANY)
WPEN (950 AM; 50 kW; PHILADELPHIA, PA; Owner: GREATER PHILADELPHIA RADIO, INC.)
Strongest FM radio stations in South Williamsport:
WRVH (107.9 FM; WILLIAMSPORT, PA; Owner: SOUTH WILLIAMSPORT SABRECOM, INC.)
W263AG (100.5 FM; SOUTH WILLIAMSPORT, PA; Owner: DBA COVENANT BROADCASTING COMPANY)
WZXR (99.3 FM; SOUTH WILLIAMSPORT, PA; Owner: SOUTH WILLIAMSPORT SABRECOM, INC.)
WBZD-FM (93.3 FM; MUNCY, PA; Owner: SOUTH WILLIAMSPORT SABRECOM, INC.)
WILQ (105.1 FM; WILLIAMSPORT, PA; Owner: SOUTH WILLIAMSPORT SABRECOM, INC.)
WRLC (91.7 FM; WILLIAMSPORT, PA; Owner: LYCOMING COLLEGE)
WPTC (88.1 FM; WILLIAMSPORT, PA; Owner: PENNSYLVANIA COLLEGE OF TECHNOLOGY)
WQBR (99.9 FM; AVIS, PA; Owner: MAXIMUM IMPACT COMMUNICATIONS, INC.)
WCXR (103.7 FM; LEWISBURG, PA; Owner: SOUTH WILLIAMSPORT SABRECOM, INC.)
WJSA-FM (96.3 FM; JERSEY SHORE, PA; Owner: CONVENANT BROADCASTING COMPANY)
WVYA (89.7 FM; WILLIAMSPORT, PA; Owner: NORTHEASTERN PA. EDUCATIONAL TV ASSOC.)
WLGL (92.3 FM; RIVERSIDE, PA; Owner: SUNAIR COMMUNICATIONS, INC.)
W207AA (89.3 FM; WILLIAMSPORT, PA; Owner: NORTHEASTERN PENNSYLVANIA EDUCATIONAL TV ASSOCIATION)
WVLY-FM (100.9 FM; MILTON, PA; Owner: MILTON-LEWISBURG BROADCASTING, INC.)
W224AI (92.7 FM; LOYALSOCK, PA; Owner: FREDERIC M. PLANKENHORN)
WBYL (95.5 FM; SALLADASBURG, PA; Owner: CLEAR CHANNEL BROADCASTING LICENSES, INC.)
W296AP (107.1 FM; WILLIAMSPORT, PA; Owner: SALT AND LIGHT MEDIA MINISTRIES)
WLZS (106.1 FM; BEAVER SPRINGS, PA; Owner: STARVIEW MEDIA, INC)
WQSU (88.9 FM; SELINSGROVE, PA; Owner: SUSQUEHANNA UNIVERSITY)
W212BJ (90.3 FM; WILLIAMSPORT, PA; Owner: FAMILY LIFE MINISTRIES, INC.)
TV broadcast stations around South Williamsport:
W05BG (Channel 5; WILLIAMSPORT, PA; Owner: TRIPLE J COMMUNITY BROADCASTING., L.L.C.)
W09BL (Channel 9; WILLIAMSPORT, PA; Owner: PENN CENTRAL BROADCASTING, INC.)
W20AD (Channel 20; WILLIAMSPORT, PA; Owner: NEW YORK TIMES MANAGEMENT SERVICES)
W26AT (Channel 26; WILLIAMSPORT, PA; Owner: MISSION BROADCASTING, INC.)
W30AN (Channel 30; WILLIAMSPORT, PA; Owner: NEXSTAR BROADCASTING OF NORTHEASTERN PENNSYLVANIA, L.L.C.)
W62CS (Channel 62; WILLIAMSPORT, PA; Owner: TRIPLE J COMMUNITY BROADCASTING., L.L.C.)
WILF (Channel 53; WILLIAMSPORT, PA; Owner: PEGASUS BROADCAST ASSOCIATES, L.P.)
W55AG (Channel 55; WILLIAMSPORT, PA; Owner: MISSION BROADCASTING, INC.)
W39BT (Channel 39; WILLIAMSPORT, PA; Owner: TRINITY BROADCASTING NETWORK)
National Bridge Inventory (NBI) Statistics 10 Number of bridges62ft / 18.6m Total length $1,220,000 Total costs50,745 Total average daily traffic3,811 Total average daily truck traffic74,856 Total future (year 2030) average daily traffic
New bridges - historical statistics
3 1920-1929 1 1940-1949 1 1950-1959 2 1970-1979 2 2000-2009 1 2010-2019
See full National Bridge Inventory statistics for South Williamsport, PA
FCC Registered Cell Phone Towers: 1 (
See the full list of FCC Registered Cell Phone Towers in South Williamsport )
FCC Registered Antenna Towers: 66 (
See the full list of FCC Registered Antenna Towers )
FCC Registered Broadcast Land Mobile Towers: 5
573 Hastings St (Lat: 41.230361 Lon: -76.989694), Type: Bant, Structure height: 197 m, Overall height: 207 m, Call Sign: KTI710, Assigned Frequencies: 154.430 MHz, Grant Date: 07/20/2022, Expiration Date: 07/14/2032, Certifier: Donna L Brink, Registrant: South Williamsport Fire Department, 573 Hastings St, South Williamsport, PA 17702, Phone: (570) 326-4167, Email:
4 Mi Se (Lat: 41.207028 Lon: -76.956361), Call Sign: KNJG560, Licensee ID: L00084546, Assigned Frequencies: 460.200 MHz, Grant Date: 02/18/2004, Expiration Date: 05/16/2014, Cancellation Date: 04/16/2014, Registrant: Pennsylvania, Commonwealth Of, 106 Lowther Street, Lemoyne, PA 17043, Phone: (717) 712-1300, Fax: (717) 712-1257, Email:
Lat: 41.229389 Lon: -76.990611, Call Sign: WQBS468, Assigned Frequencies: 464.037 MHz, 464.062 MHz, 464.087 MHz, 464.112 MHz, 464.137 MHz, 464.162 MHz, 464.187 MHz, 464.212 MHz, 464.237 MHz, 464.262 MHz... (+21 more), Grant Date: 10/15/2014, Expiration Date: 12/06/2024, Certifier: Brian T Winn, Registrant: Universal Licensing Service, 4401-A Connecticut Ave Nw #232, Washington, DC 20008, Phone: (877) 677-3639, Fax: (949) 209-3097, Email:
30 East Southern Avenue (Lat: 41.233861 Lon: -76.994000), Call Sign: WQIV779, Assigned Frequencies: 464.362 MHz, 464.187 MHz, 464.012 MHz, 464.212 MHz, 464.037 MHz, 464.237 MHz, 464.062 MHz, 464.262 MHz, 464.087 MHz, 464.287 MHz, 464.112 MHz, 464.312 MHz, Grant Date: 05/29/2008, Expiration Date: 05/29/2018, Cancellation Date: 08/04/2018, Certifier: Monica Enight, Registrant: Erc Parts, Inc, 4001 Cobb International Blvd, Kennesaw, GA 30152, Phone: (770) 984-0276, Fax: (770) 951-1875, Email:
Lat: 41.229000 Lon: -76.980611, Call Sign: WRDC515, Assigned Frequencies: 451.737 MHz, 452.687 MHz, 456.737 MHz, 457.687 MHz, Grant Date: 03/26/2019, Expiration Date: 03/26/2029, Certifier: Robert Guthrie, Registrant: Scott Communications, Inc., 2888 Bethlehem Pike, Hatfield, PA 19440, Phone: (215) 997-9500, Fax: (215) 822-8713, Email:
FCC Registered Microwave Towers: 7
BALD EAGLE, 4 Miles North Of Int. Of Rt. 554 & Skyline D (Lat: 41.213028 Lon: -76.953250), Type: Tower, Structure height: 36.6 m, Overall height: 39.6 m, Call Sign: WMJ532, Assigned Frequencies: 17800.0 MHz, 6123.10 MHz, Grant Date: 01/25/2011, Expiration Date: 02/01/2021, Cancellation Date: 04/03/2021, Certifier: John T Scott Iii, Registrant: Verizon Wireless, 5055 North Point Pkwy, Np2ne Network Engineering, Alpharetta, GA 30022, Phone: (770) 797-1070, Fax: (678) 259-1319, Email:
BALD EAGLE MOUNTAIN, Skyline Drive (Lat: 41.218611 Lon: -76.957778), Type: Tower, Structure height: 48.8 m, Call Sign: WQEX372, Assigned Frequencies: 23375.0 MHz, Grant Date: 05/09/2006, Expiration Date: 05/09/2016, Cancellation Date: 07/09/2016, Certifier: Andrew Sauers, Registrant: Radio Dynamics Corporation, 6701 Democracy Blvd, Suite 300, Bethesda, MD 20817, Phone: (301) 493-5171, Fax: (301) 576-4553, Email:
B1010, Summit Trail (Lat: 41.162417 Lon: -77.050806), Type: Ltower, Structure height: 45.7 m, Call Sign: WQVI671, Licensee ID: L01663150, Assigned Frequencies: 6063.80 MHz, 6815.00 MHz, 6815.00 MHz, 6815.00 MHz, 6815.00 MHz, 6815.00 MHz, Grant Date: 02/24/2015, Expiration Date: 02/24/2025, Certifier: Scott Tollefsen, Registrant: Webline Holdings LLC South Williamsport, Lat: 41.230833 Lon: -76.980556, Call Sign: WQWG897, Assigned Frequencies: 2365.00 MHz, Grant Date: 08/19/2015, Expiration Date: 08/31/2015, Cancellation Date: 10/31/2015, Certifier: Argyle Nelson, Registrant: Aerial Video Systems, 712 South Main Street, Burbank, CA 91506, Phone: (818) 954-8842, Fax: (818) 954-9122, Email:
WQBR, Skyline Drive (Lat: 41.218611 Lon: -76.957778), Type: Ltower, Structure height: 48.8 m, Call Sign: WQYP294, Assigned Frequencies: 11645.0 MHz, 11645.0 MHz, 11645.0 MHz, 11645.0 MHz, 11645.0 MHz, 11645.0 MHz, 11155.0 MHz, 11155.0 MHz, 11155.0 MHz, 11155.0 MHz, 11155.0 MHz, 11155.0 MHz, Grant Date: 11/28/2016, Expiration Date: 11/28/2026, Certifier: Matthew S Hoppes, Registrant: Intelpath, 111 Fuller Rd, Hisndale, IL 60521, Phone: (312) 841-9188, Email:
WQBR, Skyline Drive (Lat: 41.218611 Lon: -76.957778), Type: Ltower, Structure height: 48.8 m, Call Sign: WRAN497, Assigned Frequencies: 11485.0 MHz, 11485.0 MHz, 11405.0 MHz, 11405.0 MHz, 11405.0 MHz, 11405.0 MHz, 11405.0 MHz, 11405.0 MHz, 11405.0 MHz, 11405.0 MHz... (+26 more), Grant Date: 01/13/2018, Expiration Date: 01/13/2028, Certifier: Matthew Hoppes, Registrant: Micronet Communications, Inc., 812 Lexington Dr, Plano, TX 75075, Phone: (972) 422-7200, Email:
2PCCLT2A, 530 Route 15 Highway (Lat: 41.227639 Lon: -76.981306), Type: Pole, Structure height: 18.9 m, Call Sign: WRDV896, Assigned Frequencies: 19520.0 MHz, 19520.0 MHz, 19520.0 MHz, 19520.0 MHz, 19520.0 MHz, 19520.0 MHz, 19520.0 MHz, 19520.0 MHz, Grant Date: 08/01/2019, Expiration Date: 08/27/2019, Cancellation Date: 11/02/2019, Certifier: David Werblow, Registrant: T-Mobile Usa, Inc., 12920 Se 38th Street, Bellevue, WA 98006, Phone: (425) 383-8401, Fax: (425) 383-4040, Email:
FCC Registered Amateur Radio Licenses: 25 (
See the full list of FCC Registered Amateur Radio Licenses in South Williamsport )
FAA Registered Aircraft: 1
Aircraft: DART GK (Category: Land, Seats: 2, Weight: Up to 12,499 Pounds, Speed: 90 mph), Engine: LEBLOND 85 SERIES (85 HP) (Reciprocating)N-Number: 20999, N20999, N-20999, Serial Number: GK-18, Year manufactured: 1938, Airworthiness Date: 06/06/1956, Certificate Issue Date: 03/15/2019Registrant (Individual): Robert L Norton, 350 Forrest St, South Williamsport, PA 17702
Home Mortgage Disclosure Act Aggregated Statistics For Year 2009(Based on 1 partial tract) A) FHA, FSA/RHS & VA B) Conventional C) Refinancings D) Home Improvement Loans F) Non-occupant Loans on G) Loans On Manufactured Number Average Value Number Average Value Number Average Value Number Average Value Number Average Value Number Average Value
LOANS ORIGINATED 24 $111,418 39 $104,424 79 $94,367 44 $26,632 21 $77,316 1 $63,780 APPLICATIONS APPROVED, NOT ACCEPTED 1 $61,470 2 $89,905 7 $79,474 4 $23,820 2 $46,490 0 $0 APPLICATIONS DENIED 4 $126,785 8 $83,755 35 $113,240 15 $22,745 4 $191,715 0 $0 APPLICATIONS WITHDRAWN 1 $129,090 3 $89,903 22 $110,824 2 $63,010 1 $36,110 0 $0 FILES CLOSED FOR INCOMPLETENESS 0 $0 0 $0 4 $97,202 0 $0 0 $0 0 $0
Aggregated Statistics For Year 2008(Based on 1 partial tract) A) FHA, FSA/RHS & VA B) Conventional C) Refinancings D) Home Improvement Loans E) Loans on Dwellings For 5+ Families F) Non-occupant Loans on G) Loans On Manufactured Number Average Value Number Average Value Number Average Value Number Average Value Number Average Value Number Average Value Number Average Value
LOANS ORIGINATED 19 $94,796 61 $102,310 68 $81,767 41 $20,653 1 $19,980 22 $96,609 2 $29,585 APPLICATIONS APPROVED, NOT ACCEPTED 0 $0 2 $105,270 6 $56,862 2 $15,370 1 $115,260 0 $0 0 $0 APPLICATIONS DENIED 2 $145,995 11 $85,991 47 $92,290 15 $22,079 0 $0 5 $81,296 0 $0 APPLICATIONS WITHDRAWN 2 $99,890 4 $76,455 25 $113,262 2 $24,205 0 $0 2 $52,250 0 $0 FILES CLOSED FOR INCOMPLETENESS 0 $0 2 $105,655 5 $92,670 0 $0 0 $0 0 $0 0 $0
Aggregated Statistics For Year 2007(Based on 1 partial tract) A) FHA, FSA/RHS & VA B) Conventional C) Refinancings D) Home Improvement Loans E) Loans on Dwellings For 5+ Families F) Non-occupant Loans on Number Average Value Number Average Value Number Average Value Number Average Value Number Average Value Number Average Value
LOANS ORIGINATED 10 $114,568 72 $95,506 80 $75,610 41 $21,384 2 $343,860 28 $72,257 APPLICATIONS APPROVED, NOT ACCEPTED 1 $66,850 8 $96,339 12 $86,061 4 $16,328 0 $0 1 $30,740 APPLICATIONS DENIED 1 $60,700 15 $105,834 94 $90,393 18 $35,261 0 $0 7 $112,186 APPLICATIONS WITHDRAWN 1 $64,550 9 $88,110 28 $91,824 2 $48,795 0 $0 2 $71,460 FILES CLOSED FOR INCOMPLETENESS 0 $0 8 $92,689 7 $91,330 1 $8,450 0 $0 2 $80,300
Aggregated Statistics For Year 2006(Based on 1 partial tract) A) FHA, FSA/RHS & VA B) Conventional C) Refinancings D) Home Improvement Loans F) Non-occupant Loans on G) Loans On Manufactured Number Average Value Number Average Value Number Average Value Number Average Value Number Average Value Number Average Value
LOANS ORIGINATED 7 $80,681 83 $83,737 85 $68,975 35 $32,492 24 $87,277 0 $0 APPLICATIONS APPROVED, NOT ACCEPTED 0 $0 9 $108,003 15 $82,321 5 $29,814 3 $70,180 0 $0 APPLICATIONS DENIED 1 $55,320 18 $105,228 89 $75,484 15 $27,765 8 $85,100 2 $39,190 APPLICATIONS WITHDRAWN 0 $0 8 $72,518 53 $99,747 3 $37,650 4 $74,535 0 $0 FILES CLOSED FOR INCOMPLETENESS 0 $0 2 $44,950 11 $108,624 2 $27,660 0 $0 0 $0
Aggregated Statistics For Year 2005(Based on 1 partial tract) A) FHA, FSA/RHS & VA B) Conventional C) Refinancings D) Home Improvement Loans E) Loans on Dwellings For 5+ Families F) Non-occupant Loans on G) Loans On Manufactured Number Average Value Number Average Value Number Average Value Number Average Value Number Average Value Number Average Value Number Average Value
LOANS ORIGINATED 2 $113,340 93 $74,584 115 $71,227 34 $29,041 2 $227,830 28 $77,252 0 $0 APPLICATIONS APPROVED, NOT ACCEPTED 0 $0 4 $59,168 22 $72,509 6 $20,747 0 $0 2 $74,535 1 $31,500 APPLICATIONS DENIED 2 $66,850 14 $73,218 104 $86,578 30 $28,405 0 $0 5 $43,492 1 $80,680 APPLICATIONS WITHDRAWN 1 $66,080 9 $75,901 55 $93,312 5 $109,266 0 $0 0 $0 0 $0 FILES CLOSED FOR INCOMPLETENESS 0 $0 2 $99,510 8 $96,819 1 $24,590 0 $0 0 $0 0 $0
Aggregated Statistics For Year 2004(Based on 1 partial tract) A) FHA, FSA/RHS & VA B) Conventional C) Refinancings D) Home Improvement Loans E) Loans on Dwellings For 5+ Families F) Non-occupant Loans on G) Loans On Manufactured Number Average Value Number Average Value Number Average Value Number Average Value Number Average Value Number Average Value Number Average Value
LOANS ORIGINATED 3 $112,187 88 $81,293 142 $68,258 44 $29,898 1 $184,420 39 $70,594 2 $60,320 APPLICATIONS APPROVED, NOT ACCEPTED 0 $0 5 $143,538 32 $65,890 10 $33,041 0 $0 3 $52,763 0 $0 APPLICATIONS DENIED 1 $82,990 13 $58,989 101 $77,487 28 $32,904 2 $81,835 5 $44,414 2 $15,370 APPLICATIONS WITHDRAWN 1 $118,330 4 $79,338 52 $83,829 4 $37,075 0 $0 0 $0 0 $0 FILES CLOSED FOR INCOMPLETENESS 0 $0 1 $24,590 13 $101,725 0 $0 0 $0 2 $41,495 0 $0
Aggregated Statistics For Year 2003(Based on 1 partial tract) A) FHA, FSA/RHS & VA B) Conventional C) Refinancings D) Home Improvement Loans E) Loans on Dwellings For 5+ Families F) Non-occupant Loans on Number Average Value Number Average Value Number Average Value Number Average Value Number Average Value Number Average Value
LOANS ORIGINATED 8 $83,179 70 $74,678 212 $72,918 35 $23,469 1 $1,313,960 27 $82,560 APPLICATIONS APPROVED, NOT ACCEPTED 1 $45,340 8 $62,240 32 $78,761 4 $16,138 0 $0 0 $0 APPLICATIONS DENIED 1 $65,310 12 $70,308 75 $77,947 9 $18,527 0 $0 4 $60,895 APPLICATIONS WITHDRAWN 1 $19,210 8 $96,915 45 $80,255 2 $6,915 0 $0 2 $73,765 FILES CLOSED FOR INCOMPLETENESS 0 $0 0 $0 5 $92,516 0 $0 0 $0 0 $0
Aggregated Statistics For Year 2002(Based on 1 partial tract) A) FHA, FSA/RHS & VA B) Conventional C) Refinancings D) Home Improvement Loans E) Loans on Dwellings For 5+ Families F) Non-occupant Loans on Number Average Value Number Average Value Number Average Value Number Average Value Number Average Value Number Average Value
LOANS ORIGINATED 7 $78,706 65 $77,206 118 $69,456 42 $18,039 2 $151,375 21 $65,424 APPLICATIONS APPROVED, NOT ACCEPTED 2 $52,250 7 $79,364 25 $59,966 2 $21,130 0 $0 2 $26,895 APPLICATIONS DENIED 2 $70,695 10 $68,925 41 $68,819 8 $23,532 0 $0 2 $73,000 APPLICATIONS WITHDRAWN 0 $0 5 $68,388 28 $88,695 2 $11,910 0 $0 2 $55,325 FILES CLOSED FOR INCOMPLETENESS 0 $0 0 $0 5 $70,846 0 $0 0 $0 0 $0
Aggregated Statistics For Year 2001(Based on 1 partial tract) A) FHA, FSA/RHS & VA B) Conventional C) Refinancings D) Home Improvement Loans E) Loans on Dwellings For 5+ Families F) Non-occupant Loans on Number Average Value Number Average Value Number Average Value Number Average Value Number Average Value Number Average Value
LOANS ORIGINATED 12 $79,978 63 $69,741 137 $60,659 46 $19,678 1 $76,840 18 $62,454 APPLICATIONS APPROVED, NOT ACCEPTED 1 $46,100 4 $45,912 33 $68,364 2 $39,575 0 $0 0 $0 APPLICATIONS DENIED 1 $75,300 12 $58,207 53 $45,437 12 $19,466 0 $0 0 $0 APPLICATIONS WITHDRAWN 0 $0 3 $63,263 17 $51,076 2 $16,520 0 $0 0 $0 FILES CLOSED FOR INCOMPLETENESS 0 $0 1 $63,780 5 $83,448 0 $0 0 $0 1 $56,860
Aggregated Statistics For Year 2000(Based on 1 partial tract) A) FHA, FSA/RHS & VA B) Conventional C) Refinancings D) Home Improvement Loans F) Non-occupant Loans on Number Average Value Number Average Value Number Average Value Number Average Value Number Average Value
LOANS ORIGINATED 11 $69,225 76 $69,075 65 $49,603 71 $18,831 25 $53,327 APPLICATIONS APPROVED, NOT ACCEPTED 3 $84,013 4 $58,782 14 $53,184 10 $20,363 2 $43,030 APPLICATIONS DENIED 1 $51,480 16 $52,731 53 $65,459 15 $11,475 2 $26,510 APPLICATIONS WITHDRAWN 1 $59,170 6 $68,003 23 $70,860 3 $48,920 4 $61,665 FILES CLOSED FOR INCOMPLETENESS 1 $46,870 3 $57,373 8 $77,992 2 $19,210 0 $0
Aggregated Statistics For Year 1999(Based on 1 full tract) A) FHA, FSA/RHS & VA B) Conventional C) Refinancings D) Home Improvement Loans E) Loans on Dwellings For 5+ Families F) Non-occupant Loans on Number Average Value Number Average Value Number Average Value Number Average Value Number Average Value Number Average Value
LOANS ORIGINATED 14 $70,439 83 $67,618 111 $52,876 97 $17,786 1 $1,587,360 28 $49,818 APPLICATIONS APPROVED, NOT ACCEPTED 2 $74,410 1 $10,910 27 $62,355 7 $31,039 0 $0 0 $0 APPLICATIONS DENIED 2 $86,810 16 $32,119 60 $54,466 28 $26,539 0 $0 3 $26,457 APPLICATIONS WITHDRAWN 0 $0 7 $68,739 41 $62,914 10 $36,509 1 $69,450 1 $43,650 FILES CLOSED FOR INCOMPLETENESS 0 $0 1 $128,970 3 $60,517 0 $0 0 $0 0 $0
Detailed HMDA statistics for the following Tracts:
0116.00
Private Mortgage Insurance Companies Aggregated Statistics For Year 2009(Based on 1 partial tract) A) Conventional B) Refinancings Number Average Value Number Average Value
LOANS ORIGINATED 10 $104,426 4 $121,408 APPLICATIONS APPROVED, NOT ACCEPTED 1 $99,890 0 $0 APPLICATIONS DENIED 2 $145,230 1 $69,160 APPLICATIONS WITHDRAWN 0 $0 1 $74,530 FILES CLOSED FOR INCOMPLETENESS 0 $0 0 $0
Aggregated Statistics For Year 2008(Based on 1 partial tract) A) Conventional B) Refinancings C) Non-occupant Loans on Number Average Value Number Average Value Number Average Value
LOANS ORIGINATED 22 $108,694 5 $130,320 2 $114,105 APPLICATIONS APPROVED, NOT ACCEPTED 2 $64,930 3 $104,760 0 $0 APPLICATIONS DENIED 0 $0 0 $0 0 $0 APPLICATIONS WITHDRAWN 0 $0 0 $0 0 $0 FILES CLOSED FOR INCOMPLETENESS 0 $0 0 $0 0 $0
Aggregated Statistics For Year 2007(Based on 1 partial tract) A) Conventional B) Refinancings C) Non-occupant Loans on Number Average Value Number Average Value Number Average Value
LOANS ORIGINATED 28 $95,748 7 $100,550 2 $122,560 APPLICATIONS APPROVED, NOT ACCEPTED 2 $92,210 3 $99,637 1 $53,790 APPLICATIONS DENIED 1 $120,640 0 $0 0 $0 APPLICATIONS WITHDRAWN 1 $53,790 1 $80,680 0 $0 FILES CLOSED FOR INCOMPLETENESS 0 $0 0 $0 0 $0
Aggregated Statistics For Year 2006(Based on 1 partial tract) A) Conventional B) Refinancings C) Non-occupant Loans on Number Average Value Number Average Value Number Average Value
LOANS ORIGINATED 22 $88,995 10 $115,183 2 $58,400 APPLICATIONS APPROVED, NOT ACCEPTED 3 $103,990 1 $108,340 0 $0 APPLICATIONS DENIED 1 $46,100 0 $0 0 $0 APPLICATIONS WITHDRAWN 0 $0 0 $0 0 $0 FILES CLOSED FOR INCOMPLETENESS 0 $0 0 $0 0 $0
Aggregated Statistics For Year 2005(Based on 1 partial tract) A) Conventional B) Refinancings C) Non-occupant Loans on Number Average Value Number Average Value Number Average Value
LOANS ORIGINATED 22 $80,018 12 $101,877 2 $73,765 APPLICATIONS APPROVED, NOT ACCEPTED 1 $48,410 5 $86,060 1 $60,700 APPLICATIONS DENIED 0 $0 0 $0 0 $0 APPLICATIONS WITHDRAWN 1 $30,740 1 $60,700 1 $60,700 FILES CLOSED FOR INCOMPLETENESS 0 $0 0 $0 0 $0
Aggregated Statistics For Year 2004(Based on 1 partial tract) A) Conventional B) Refinancings C) Non-occupant Loans on Number Average Value Number Average Value Number Average Value
LOANS ORIGINATED 25 $85,815 12 $78,761 0 $0 APPLICATIONS APPROVED, NOT ACCEPTED 5 $59,320 5 $67,926 2 $48,025 APPLICATIONS DENIED 0 $0 0 $0 0 $0 APPLICATIONS WITHDRAWN 1 $51,480 2 $61,090 0 $0 FILES CLOSED FOR INCOMPLETENESS 0 $0 0 $0 0 $0
Aggregated Statistics For Year 2003(Based on 1 partial tract) A) Conventional B) Refinancings Number Average Value Number Average Value
LOANS ORIGINATED 25 $79,299 27 $96,477 APPLICATIONS APPROVED, NOT ACCEPTED 3 $88,110 2 $118,335 APPLICATIONS DENIED 0 $0 0 $0 APPLICATIONS WITHDRAWN 0 $0 1 $50,710 FILES CLOSED FOR INCOMPLETENESS 0 $0 0 $0
Aggregated Statistics For Year 2002(Based on 1 partial tract) A) Conventional B) Refinancings C) Non-occupant Loans on Number Average Value Number Average Value Number Average Value
LOANS ORIGINATED 22 $80,158 14 $89,738 2 $60,320 APPLICATIONS APPROVED, NOT ACCEPTED 3 $70,950 5 $98,508 1 $25,360 APPLICATIONS DENIED 0 $0 1 $67,620 0 $0 APPLICATIONS WITHDRAWN 1 $50,710 1 $50,710 0 $0 FILES CLOSED FOR INCOMPLETENESS 0 $0 0 $0 0 $0
Aggregated Statistics For Year 2001(Based on 1 partial tract) A) Conventional B) Refinancings Number Average Value Number Average Value
LOANS ORIGINATED 28 $79,392 12 $76,520 APPLICATIONS APPROVED, NOT ACCEPTED 2 $82,985 1 $51,480 APPLICATIONS DENIED 0 $0 0 $0 APPLICATIONS WITHDRAWN 1 $46,100 0 $0 FILES CLOSED FOR INCOMPLETENESS 0 $0 0 $0
Aggregated Statistics For Year 2000(Based on 1 partial tract) A) Conventional B) Refinancings Number Average Value Number Average Value
LOANS ORIGINATED 18 $76,669 2 $157,140 APPLICATIONS APPROVED, NOT ACCEPTED 2 $47,640 1 $56,860 APPLICATIONS DENIED 0 $0 0 $0 APPLICATIONS WITHDRAWN 1 $62,240 0 $0 FILES CLOSED FOR INCOMPLETENESS 0 $0 0 $0
Aggregated Statistics For Year 1999(Based on 1 full tract) A) Conventional B) Refinancings Number Average Value Number Average Value
LOANS ORIGINATED 20 $83,287 6 $95,077 APPLICATIONS APPROVED, NOT ACCEPTED 1 $71,430 0 $0 APPLICATIONS DENIED 1 $62,500 1 $26,790 APPLICATIONS WITHDRAWN 1 $73,420 0 $0 FILES CLOSED FOR INCOMPLETENESS 1 $64,490 0 $0
Detailed PMIC statistics for the following Tracts:
0116.00
South Williamsport compared to Pennsylvania state average:
Unemployed percentage significantly below state average. Black race population percentage significantly below state average. Hispanic race population percentage significantly below state average. Length of stay since moving in above state average. South Williamsport on our top lists :
#64 on the list of "Top 101 cities with the largest city-data.com crime index decrease from 2011 to 2012 (population 5,000+)"
#84 on the list of "Top 101 cities with largest percentage of females in occupations: arts, design, entertainment, sports, and media occupations (population 5,000+)"
#21 on the list of "Top 101 counties with the lowest percentage of residents relocating to foreign countries in 2011"
#44 on the list of "Top 101 counties with the lowest percentage of residents relocating to other counties in 2011"
#67 on the list of "Top 101 counties with the lowest Ozone (1-hour) air pollution readings in 2012 (ppm)"
#83 on the list of "Top 101 counties with the lowest Particulate Matter (PM10 ) Annual air pollution readings in 2012 (µg/m3 )"
#88 on the list of "Top 101 counties with the lowest percentage of residents relocating from foreign countries between 2010 and 2011"
Top Patent Applicants
Li H. Liu (4)
Jason Gottschall (3)
Kevin D. Fry (3)
Travis Griffin Bevan (1)
Total of 11 patent applications in 2008-2024.


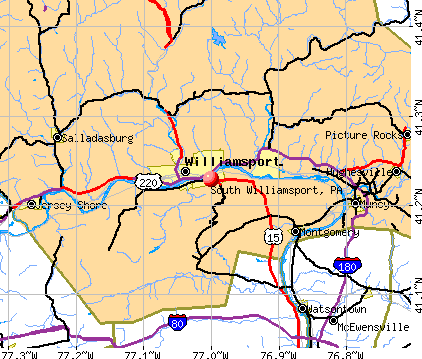


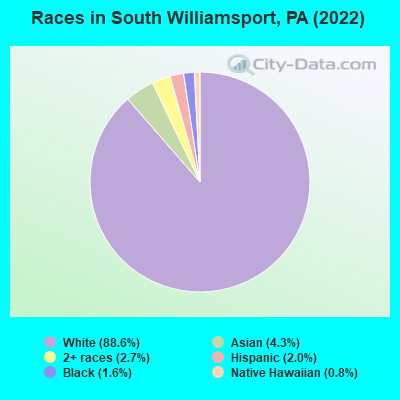
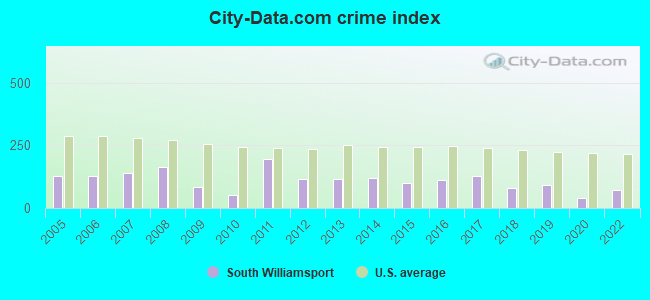
 Recent articles from our blog. Our writers, many of them Ph.D. graduates or candidates, create easy-to-read articles on a wide variety of topics.

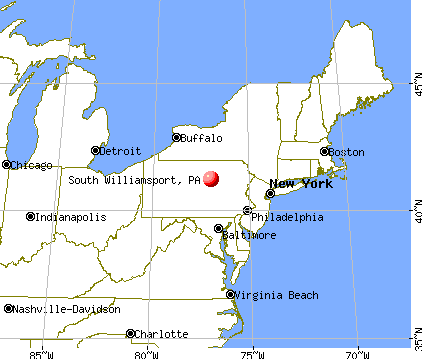
 (70.4 miles
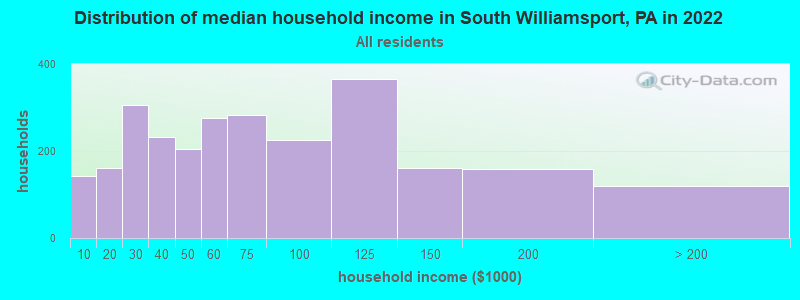
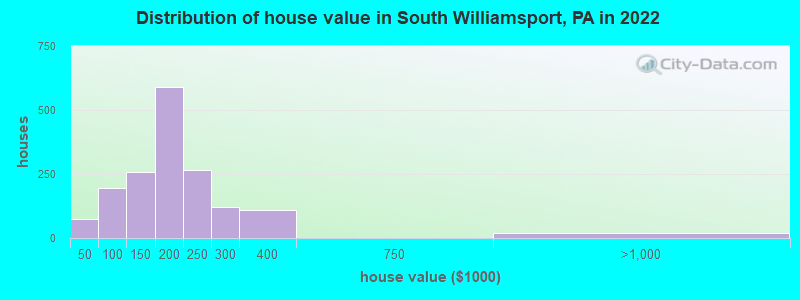
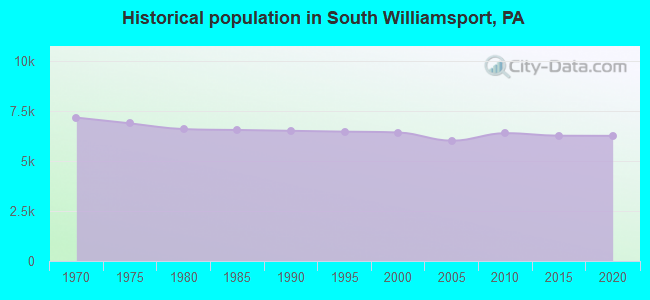
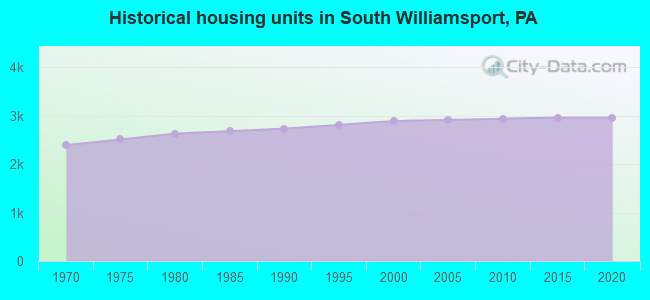
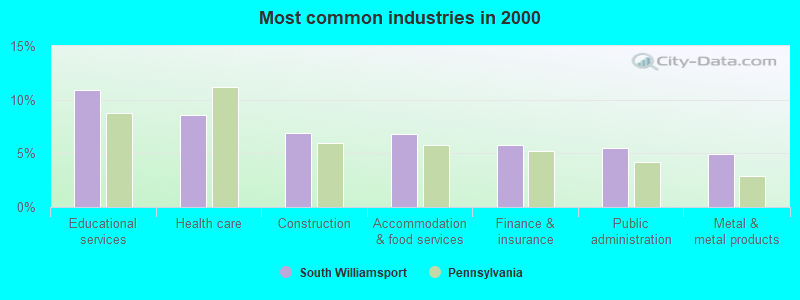
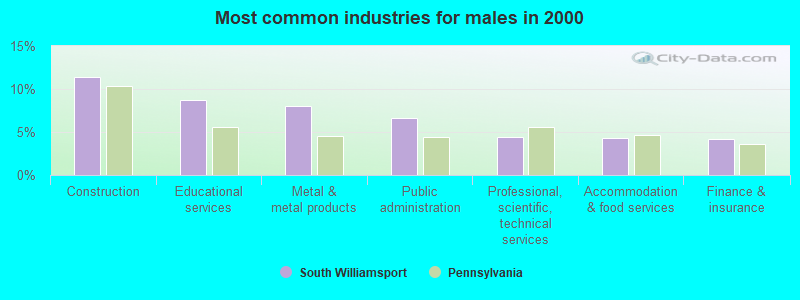
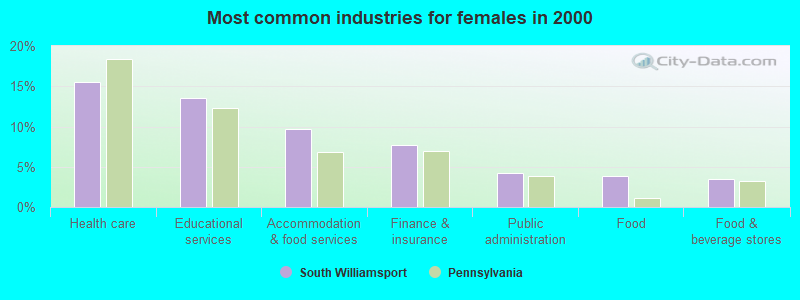
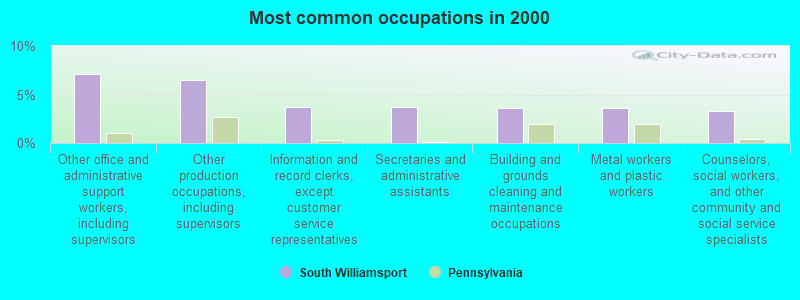
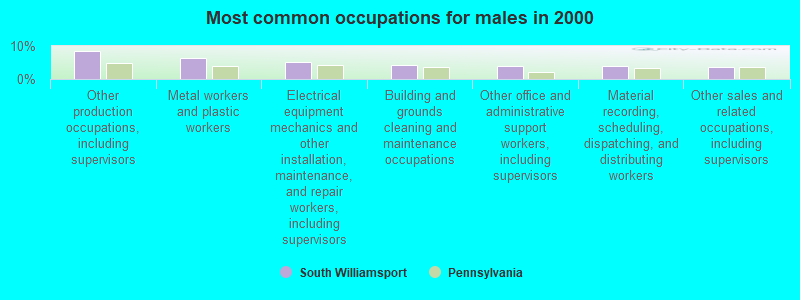
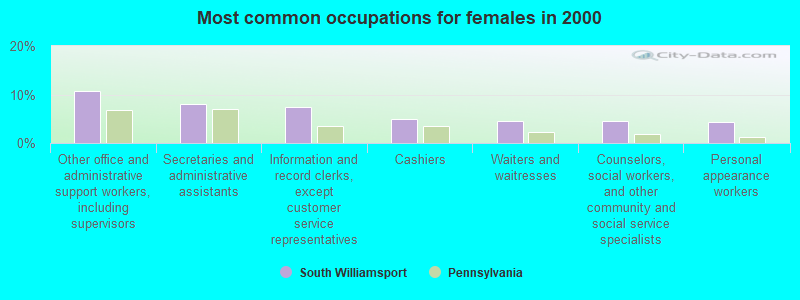
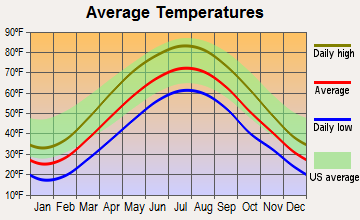


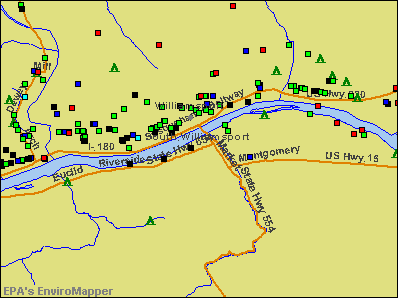

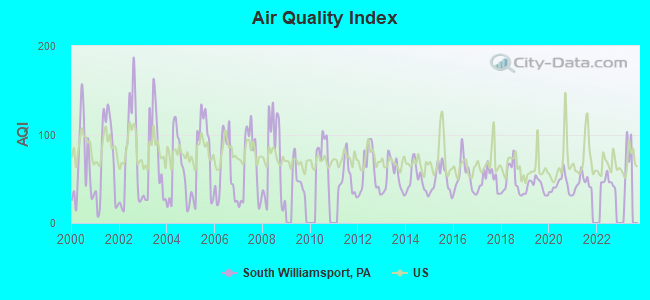
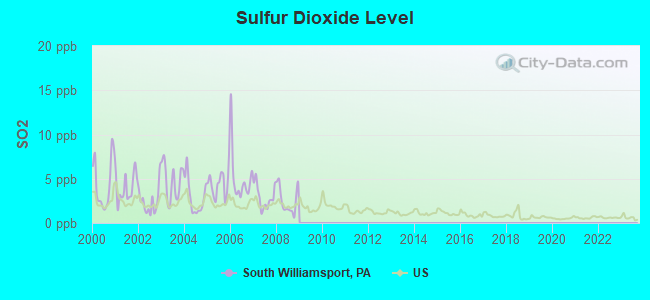
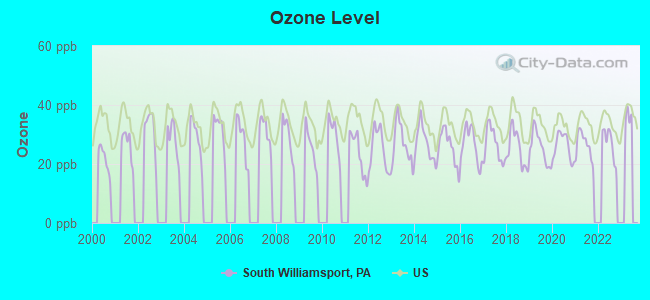
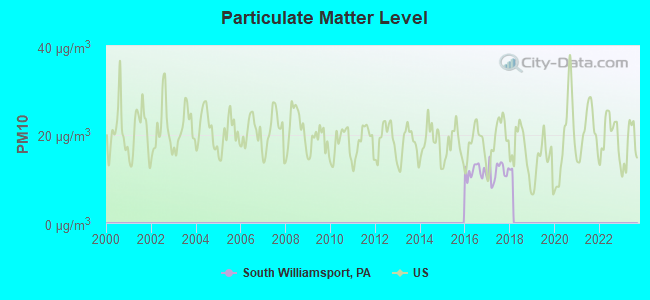
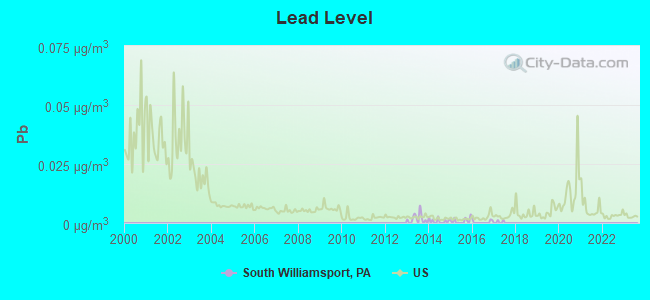

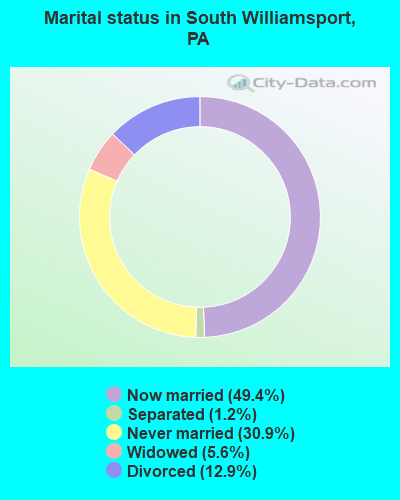
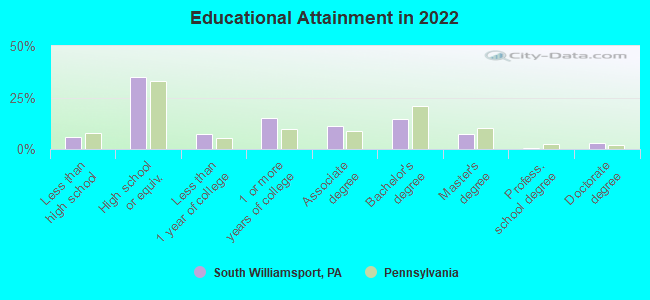
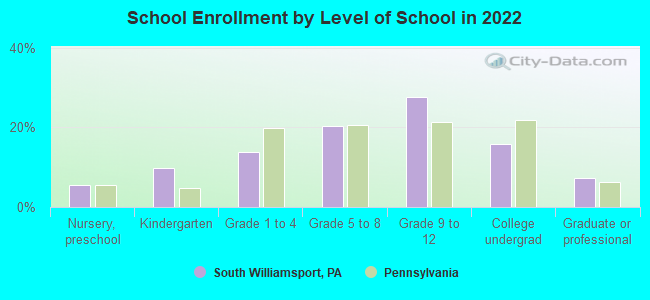
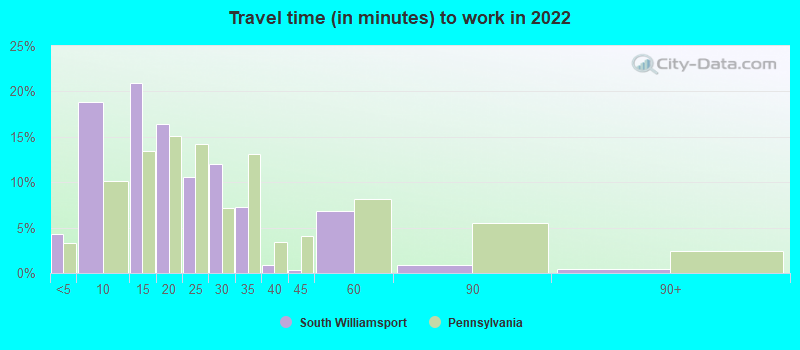
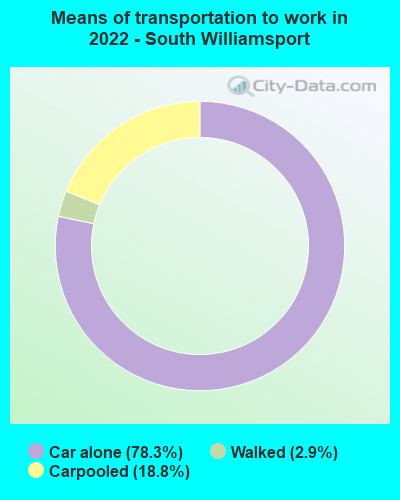
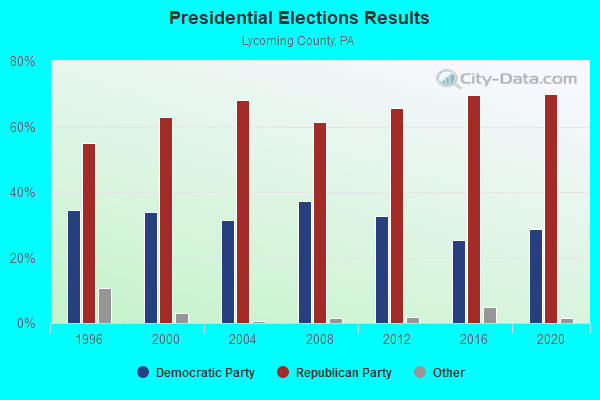
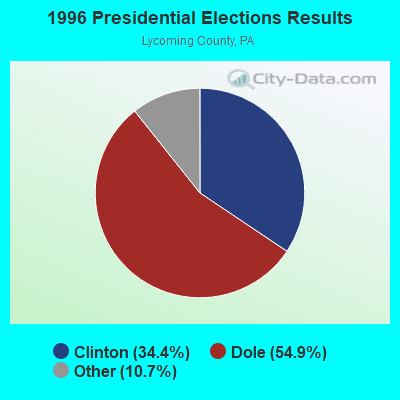
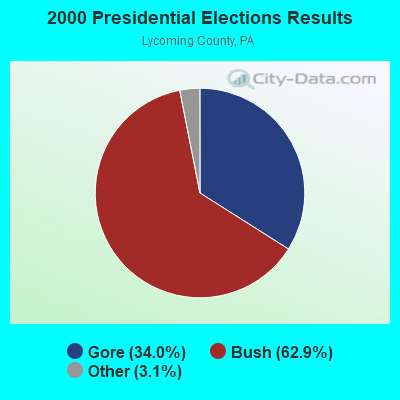

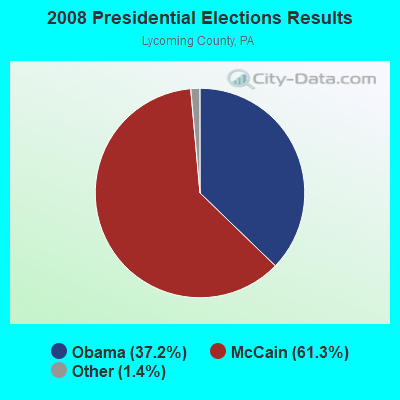
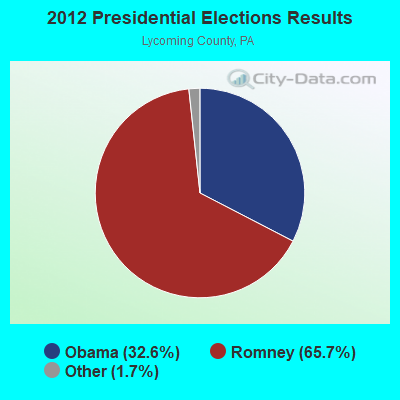
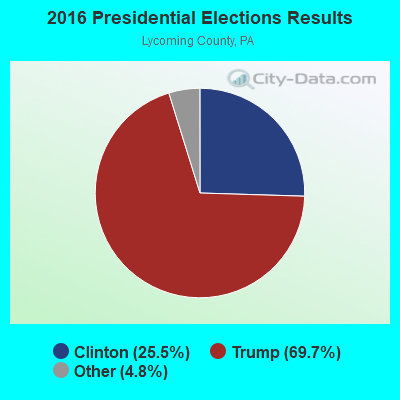
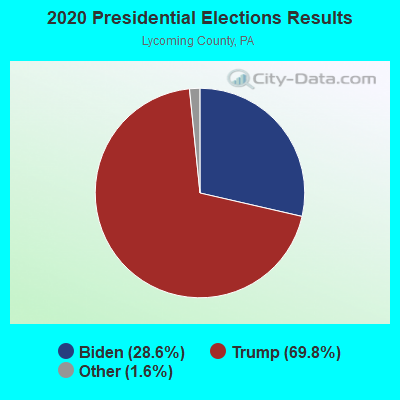
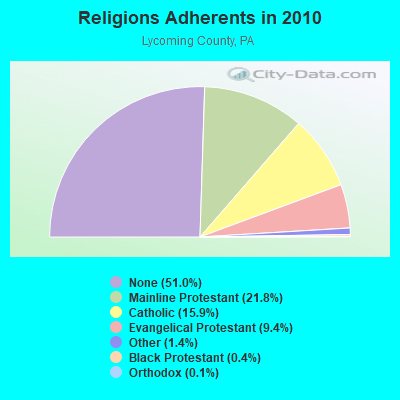
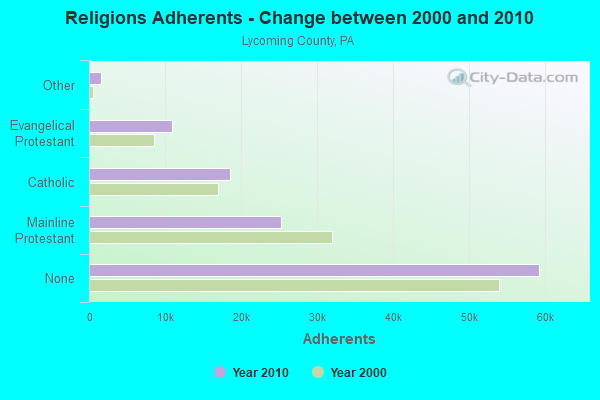
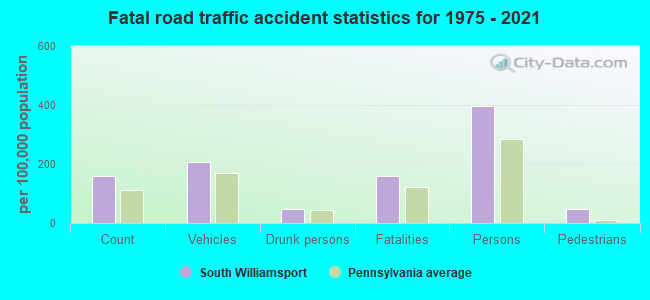
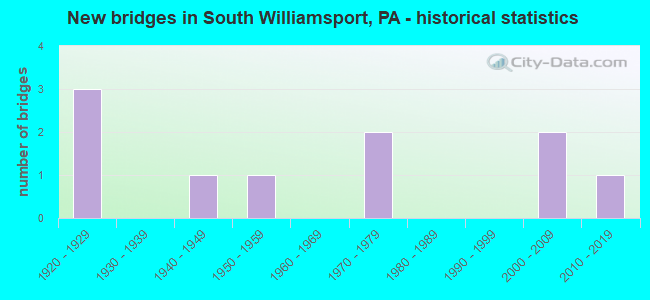
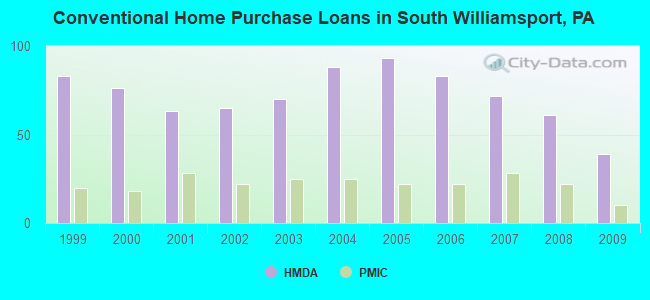
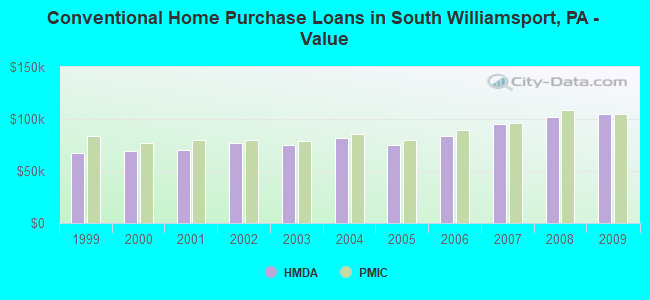
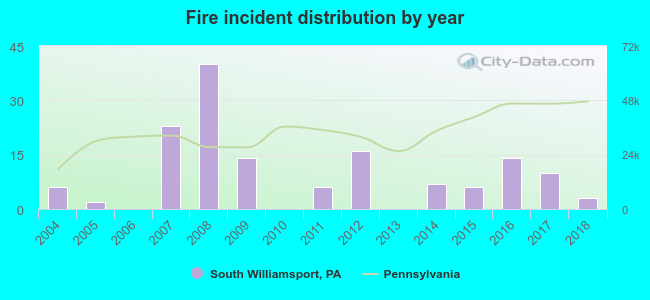 Based on the data from the years 2004 - 2018 the average number of fires per year is 10. The highest number of reported fire incidents - 40 took place in 2008, and the least - 0 in 2006. The data has a declining trend.
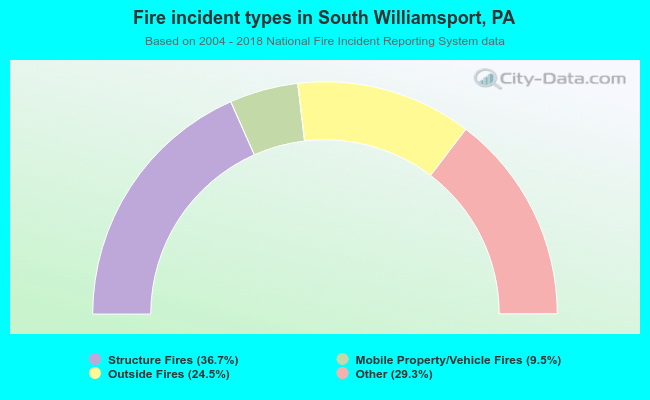 When looking into fire subcategories, the most reports belonged to: Structure Fires (36.7%), and Other (29.3%).