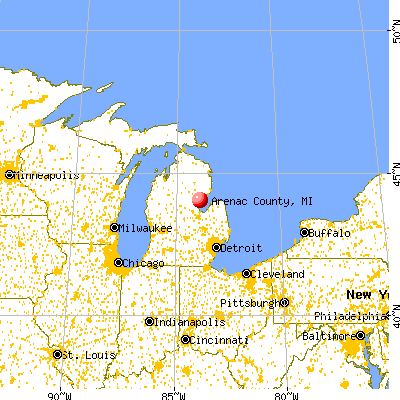
Arenac County, Michigan (MI)
County owner-occupied free and clear houses and condos in 2010: 2,436
County owner-occupied houses and condos in 2000: 5,656
Renter-occupied apartments: 1,096 (it was 1,054 in 2000)
| % of renters here: | 16% |
| State: | 28% |
Land area: 367 sq. mi.
Water area: 314.0 sq. mi.
Population density: 41 people per square mile (average).
Industries providing employment: Educational, health and social services (19.5%), Manufacturing (18.7%), Retail trade (12.7%).
Type of workers:
- Private wage or salary: 80%
- Government: 12%
- Self-employed, not incorporated: 8%
- Unpaid family work: 0%
- OSM Map
- General Map
- Google Map
- MSN Map

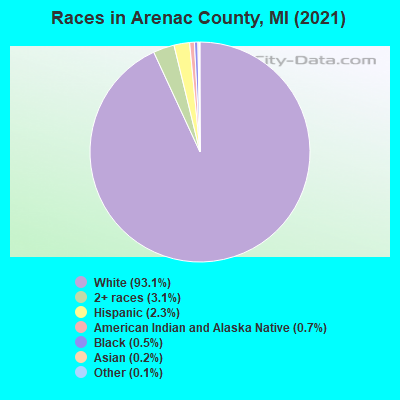
- 13,84692.8%White Non-Hispanic Alone
- 5183.5%Two or more races
- 3512.4%Hispanic or Latino
- 810.5%Black Non-Hispanic Alone
- 800.5%American Indian and Alaska Native alone
- 280.2%Some other race alone
- 190.1%Asian alone
| Median resident age: | 50.5 years |
| Michigan median age: | 40.3 years |
| Males: 7,661 | |
| Females: 7,334 |

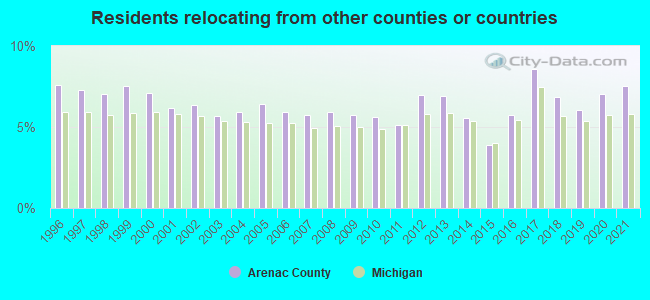
 | Moving to Arenac County (2 replies) |
| Arenac County: | 2.0 people |
| Michigan: | 2 people |
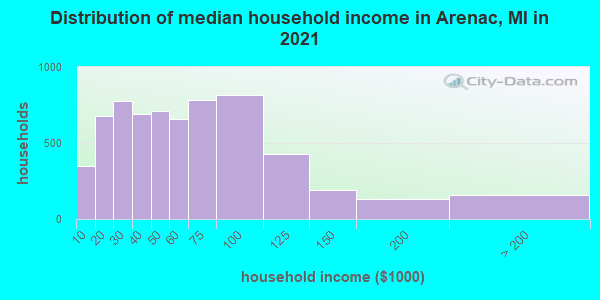
Estimated median household income in 2022: $52,301 ($32,805 in 1999)
| This county: | $52,301 |
| Michigan: | $66,986 |
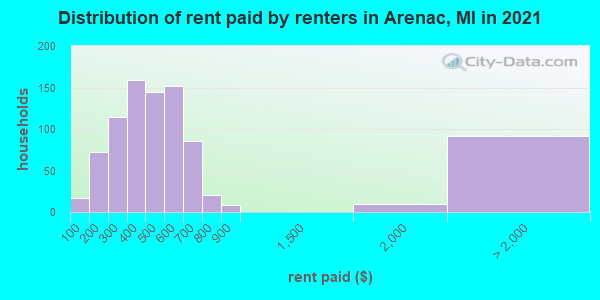
Median contract rent in 2022 for apartments: $490 (lower quartile is $324, upper quartile is $622)
| This county: | $490 |
| State: | $865 |
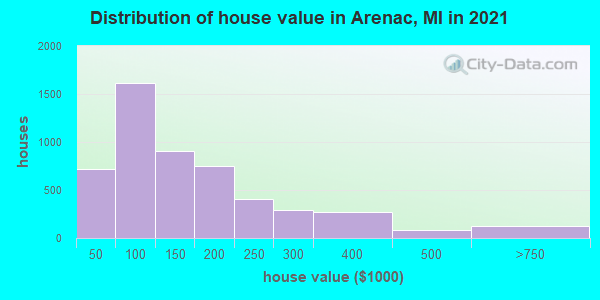
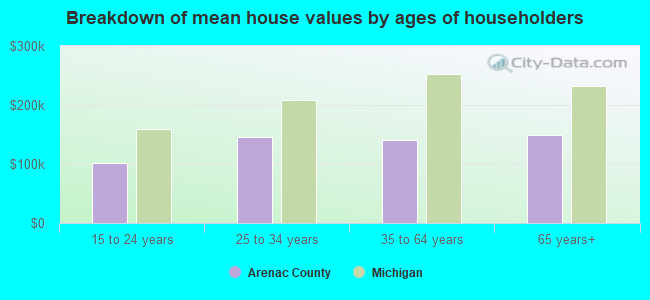
Estimated median house or condo value in 2022: $131,895 (it was $75,400 in 2000)
| Arenac: | $131,895 |
| Michigan: | $224,400 |
Median monthly housing costs for homes and condos with a mortgage: $1,076
Median monthly housing costs for units without a mortgage: $448
Institutionalized population: 155
Crime in 2021 (reported by the sheriff's office or county police, not the county total):
- Murders: 1
- Rapes: 3
- Robberies: 0
- Assaults: 28
- Burglaries: 31
- Thefts: 43
- Auto thefts: 6
Crime in 2020 (reported by the sheriff's office or county police, not the county total):
- Murders: 0
- Rapes: 5
- Robberies: 0
- Assaults: 41
- Burglaries: 30
- Thefts: 59
- Auto thefts: 8
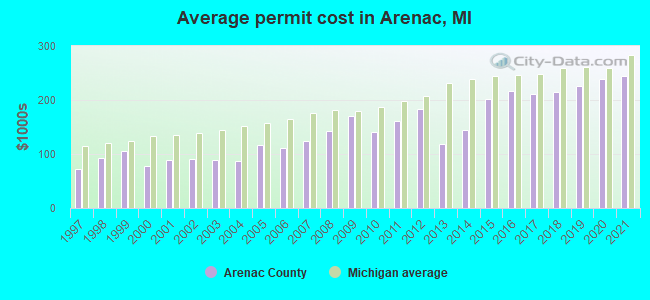
Single-family new house construction building permits:
- 2022: 13 buildings, average cost: $260,000
- 2021: 21 buildings, average cost: $244,400
- 2020: 12 buildings, average cost: $237,700
- 2019: 8 buildings, average cost: $226,000
- 2018: 10 buildings, average cost: $214,500
- 2017: 5 buildings, average cost: $211,600
- 2016: 3 buildings, average cost: $215,900
- 2015: 18 buildings, average cost: $201,500
- 2014: 12 buildings, average cost: $144,500
- 2013: 17 buildings, average cost: $118,000
- 2012: 17 buildings, average cost: $183,100
- 2011: 7 buildings, average cost: $161,600
- 2010: 10 buildings, average cost: $140,700
- 2009: 14 buildings, average cost: $169,500
- 2008: 18 buildings, average cost: $143,100
- 2007: 31 buildings, average cost: $125,100
- 2006: 56 buildings, average cost: $111,200
- 2005: 62 buildings, average cost: $116,000
- 2004: 97 buildings, average cost: $87,200
- 2003: 86 buildings, average cost: $88,600
- 2002: 89 buildings, average cost: $90,400
- 2001: 68 buildings, average cost: $89,100
- 2000: 81 buildings, average cost: $78,300
- 1999: 28 buildings, average cost: $104,900
- 1998: 35 buildings, average cost: $92,300
- 1997: 33 buildings, average cost: $73,400

Median real estate property taxes paid for housing units with mortgages in 2022: $1,703 (1.2%)
Median real estate property taxes paid for housing units with no mortgage in 2022: $1,458 (1.2%)
| Arenac County: | 13.8% |
| Michigan: | 13.4% |
Median age of residents in 2022: 50.5 years old
(Males: 50.2 years old, Females: 50.9 years old)
(Median age for: White residents: 51.4 years old, Black residents: 29.0 years old, American Indian residents: 31.6 years old, Asian residents: 62.2 years old, Hispanic or Latino residents: 36.0 years old, Other race residents: 56.9 years old)
Fair market rent in 2006 for a 1-bedroom apartment in Arenac County is $422 a month.
Fair market rent for a 2-bedroom apartment is $503 a month.
Fair market rent for a 3-bedroom apartment is $673 a month.
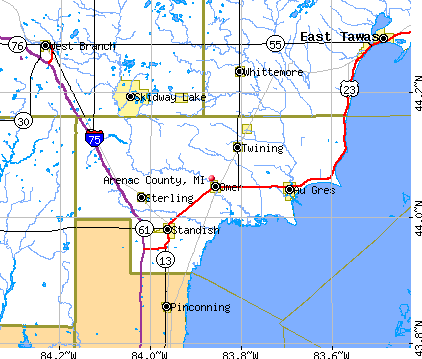
Cities in this county include: Standish, Au Gres, Sterling, Omer, Twining, Turner.
Notable locations in this county outside city limits:
Notable locations in Arenac County: House Lake State Forest Campground (A), Trout Lake State Forest Campground (B), Watersedge Golf Course (C), Tobacco River Campground (D), Calhoun Campground (E), Gladwin Heights Golf Course (F), Lost Haven Campground (G), All Bright Shores (H), Sugar Springs Country Club (I), Sugar Springs Campground (J), Wildwood Campground (K), Secord Lake Campground (L), Wildwood Fire Department (M), Clement Township Fire Department (N), Billings Township Hall (O), Hays Township Hall (P), Gladwin Township Hall (Q), Gladwin County Historical Society Museum (R), Butman Township Fire Rescue (S), Billings Township Fire Department (T). Display/hide their locations on the map
Churches in Arenac County include: Church of the Brethren (A), Beaverton Baptist Church (B), Daniels Band Church (C), Church of Daniels Band (D), Living Hope Fellowship Church (E), Beaverton Church of God (F), Good Shepherd Lutheran Church (G), Dale United Methodist Church (H), Cedar River Chapel (I). Display/hide their locations on the map
Cemeteries: Butman Cemetery (1), Skeel Cemetery (2), Grout Cemetery (3), McClure Cemetery (4), Ridge Cemetery (5), Arbutus Cemetery (6), Rhodes Cemetery (7). Display/hide their locations on the map
Lakes, reservoirs, and swamps: Trout Lake (A), Puro Lake (B), Pratt Lake (C), Lake Lochbrae (D), Wallic Lake (E), Perch Lake (F), Little Lake Twenty (G), Peach Lake (H). Display/hide their locations on the map
Streams, rivers, and creeks: Elk Lake Creek (A), West Branch Tittabawassee River (B), Avery Creek (C), Venison Creek (D), Bear Creek (E), Guernsey Creek (F), Tea Creek (G), Payne Creek (H), Fish Creek (I). Display/hide their locations on the map
Parks in Arenac County include: Gladwin County Recreation Area (1), Gladwin State Park (2). Display/hide their locations on the map
Neighboring counties: Fremont County, Wyoming  , Clare County , Houston County, Minnesota , Iosco County
  , Pennington County, South Dakota , Mecosta County
  , Osceola County .
| Here: | 7.1% |
| Michigan: | 3.5% |

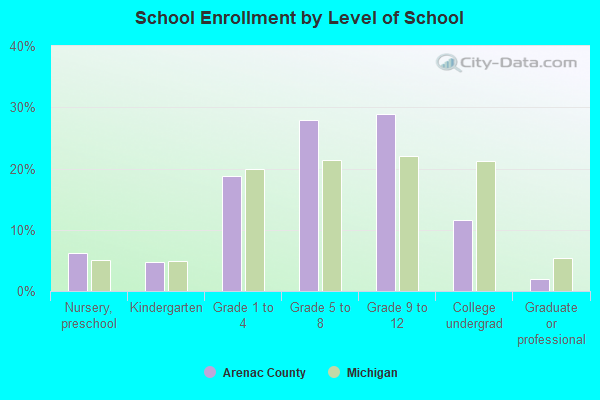
Current college students: 567
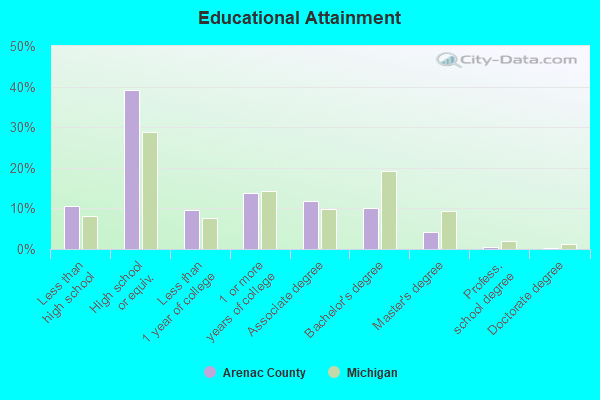
People 25 years of age or older with a high school degree or higher: 89.4%
People 25 years of age or older with a bachelor's degree or higher: 14.6%
Number of foreign born residents: 128 (58.3% naturalized citizens)
| Arenac County: | 0.9% |
| Whole state: | 6.9% |
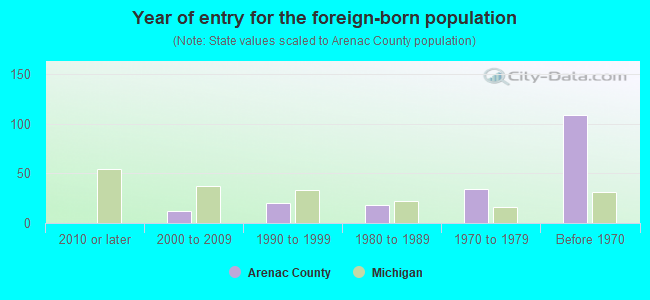
- Year of entry for the foreign-born population
- 82010 or later
- 12000 to 2009
- 251990 to 1999
- 181980 to 1989
- 341970 to 1979
- 109Before 1970
Mean travel time to work (commute): minutes
Percentage of county residents living and working in this county: 98.9%


Housing units in structures:
- One, detached: 7,596
- One, attached: 88
- Two: 55
- 3 or 4: 123
- 5 to 9: 126
- 10 to 19: 115
- 20 to 49: 149
- 50 or more: 4
- Mobile homes: 1,322
- Boats, RVs, vans, etc.: 7
Housing units in Arenac County with a mortgage: 2,604 (198 second mortgage, 10 home equity loan, 153 both second mortgage and home equity loan)
Houses without a mortgage: 62
| Here: | 3.1% with mortgage |
| State: | 96.7% with mortgage |
Religion statistics for Arenac County
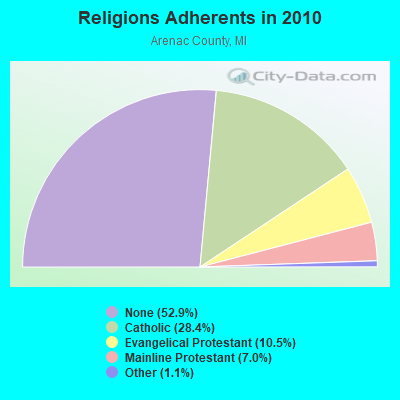
| Religion | Adherents | Congregations |
|---|---|---|
| Catholic | 4,520 | 4 |
| Evangelical Protestant | 1,677 | 20 |
| Mainline Protestant | 1,116 | 9 |
| Other | 169 | 2 |
| None | 8,417 | - |
Source: Clifford Grammich, Kirk Hadaway, Richard Houseal, Dale E.Jones, Alexei Krindatch, Richie Stanley and Richard H.Taylor. 2012. 2010 U.S.Religion Census: Religious Congregations & Membership Study. Association of Statisticians of American Religious Bodies. Jones, Dale E., et al. 2002. Congregations and Membership in the United States 2000. Nashville, TN: Glenmary Research Center.
Food Environment Statistics:
| Arenac County: | 3.02 / 10,000 pop. |
| State: | 2.34 / 10,000 pop. |
| This county: | 1.81 / 10,000 pop. |
| Michigan: | 1.52 / 10,000 pop. |
| Arenac County: | 5.44 / 10,000 pop. |
| Michigan: | 2.99 / 10,000 pop. |
| This county: | 9.67 / 10,000 pop. |
| State: | 6.80 / 10,000 pop. |
| Arenac County: | 10.1% |
| Michigan: | 9.7% |
| Arenac County: | 29.7% |
| State: | 29.7% |
| Here: | 18.3% |
| State: | 13.4% |
Agriculture in Arenac County:
Average size of farms: 220 acresAverage value of agricultural products sold per farm: $59,137
Average value of crops sold per acre for harvested cropland: $297.46
The value of livestock, poultry, and their products as a percentage of the total market value of agricultural products sold: 27.36%
Average total farm production expenses per farm: $43,589
Harvested cropland as a percentage of land in farms: 65.72%
Irrigated harvested cropland as a percentage of land in farms: 0.10%
Average market value of all machinery and equipment per farm: $61,832
The percentage of farms operated by a family or individual: 92.13%
Average age of principal farm operators: 56 years
Average number of cattle and calves per 100 acres of all land in farms: 6.95
Milk cows as a percentage of all cattle and calves: 40.62%
Corn for grain: 11113 harvested acres
All wheat for grain: 5491 harvested acres
Soybeans for beans: 12505 harvested acres
Vegetables: 3,279 harvested acres
Land in orchards: 32 acres
Tornado activity:
Arenac County historical area-adjusted tornado activity is significantly below Michigan state average. It is 5618797.2 times below overall U.S. average.Tornadoes in this county have caused 10 injuries recorded between 1950 and 2004.
On 3/30/1976, a category 3 (max. wind speeds 158-206 mph) tornado injured 10 people
Earthquake activity:
Arenac County-area historical earthquake activity is significantly above Michigan state average. It is 61% smaller than the overall U.S. average.On 9/25/1998 at 19:52:52, a magnitude 5.2 (4.8 MB, 4.3 MS, 5.2 LG, 4.5 MW, Depth: 3.1 mi, Class: Moderate, Intensity: VI - VII) earthquake occurred 250.3 miles away from Arenac County center
On 1/31/1986 at 16:46:43, a magnitude 5.0 (5.0 MB) earthquake occurred 218.6 miles away from the county center
On 5/2/2015 at 16:23:07, a magnitude 4.2 (4.2 MW, Depth: 2.8 mi, Class: Light, Intensity: IV - V) earthquake occurred 148.8 miles away from the county center
On 7/12/1986 at 08:19:37, a magnitude 4.5 (4.5 MB) earthquake occurred 245.1 miles away from the county center
On 9/2/1994 at 21:23:06, a magnitude 3.5 (3.4 LG, 3.5 LG, Depth: 3.1 mi, Class: Light, Intensity: II - III) earthquake occurred 94.9 miles away from Arenac County center
On 7/27/1980 at 18:52:21, a magnitude 5.2 (5.1 MB, 4.7 MS, 5.0 UK, 5.2 UK) earthquake occurred 405.1 miles away from the county center
Magnitude types: regional Lg-wave magnitude (LG), body-wave magnitude (MB), surface-wave magnitude (MS), moment magnitude (MW)
Most recent natural disasters:
- Michigan Severe Storms And Flooding, Incident Period: May 16, 2020 - May 22, 2020, FEMA Id: 4547, Natural disaster type: Storm, Flood
- Michigan Covid-19 Pandemic, Incident Period: January 20, 2020, FEMA Id: 4494, Natural disaster type: Other
- Michigan Hurricane Katrina Evacuation, Incident Period: August 29, 2005 to October 01, 2005, Emergency Declared EM-3225: September 07, 2005, FEMA Id: 3225, Natural disaster type: Hurricane
- Michigan Winter Storm, Incident Period: January 02, 1999 to January 15, 1999, Emergency Declared EM-3137: January 27, 1999, FEMA Id: 3137, Natural disaster type: Winter Storm
- Michigan SEVERE STORMS, FLOODING, Incident Period: September 10, 1986 to October 10, 1986, Major Disaster (Presidential) Declared DR-774: September 18, 1986, FEMA Id: 774, Natural disaster type: Storm, Flood
- Michigan Blizzards and Snowstorms, Incident Period: January 27, 1978, Emergency Declared EM-3057: January 27, 1978, FEMA Id: 3057, Natural disaster type: Snowstorm, Blizzard
- Michigan Drought, Incident Period: March 02, 1977, Emergency Declared EM-3035: March 02, 1977, FEMA Id: 3035, Natural disaster type: Drought
- Michigan SEVERE STORMS, FLOODING, Incident Period: April 12, 1973, Major Disaster (Presidential) Declared DR-371: April 12, 1973, FEMA Id: 371, Natural disaster type: Storm, Flood
- Michigan SEVERE STORMS, FLOODING, Incident Period: December 01, 1972, Major Disaster (Presidential) Declared DR-363: December 01, 1972, FEMA Id: 363, Natural disaster type: Storm, Flood
The number of natural disasters in Arenac County (9) is smaller than the US average (15).
Major Disasters (Presidential) Declared: 3
Emergencies Declared: 4
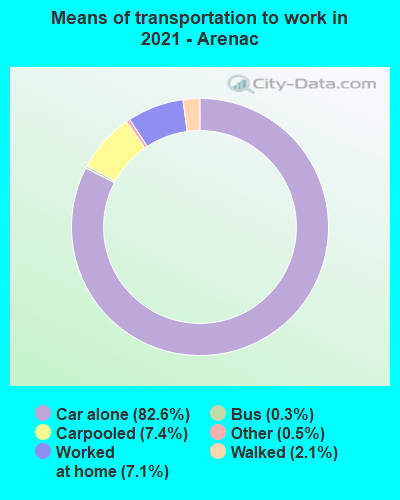
Means of transportation to work:
- Drove a car alone: 3,884 (75.6%)
- Carpooled: 432 (8.4%)
- Bus: 16 (0.3%)
- Taxicab, motorcycle, or other means: 101 (2.0%)
- Walked: 104 (2.0%)
- Worked at home: 569 (11.1%)

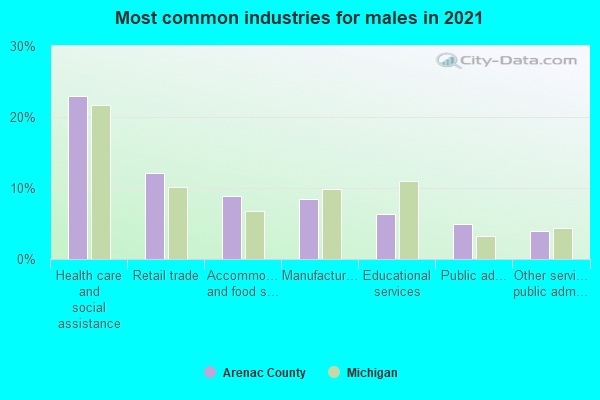
- Health care and social assistance (23%)
- Retail trade (13%)
- Accommodation and food services (9%)
- Manufacturing (7%)
- Educational services (7%)
- Other services, except public administration (5%)
- Public administration (4%)
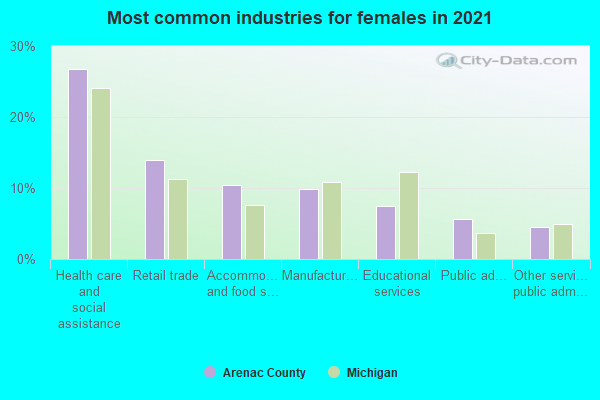
- Health care and social assistance (27%)
- Retail trade (15%)
- Accommodation and food services (10%)
- Manufacturing (9%)
- Educational services (8%)
- Other services, except public administration (5%)
- Public administration (5%)
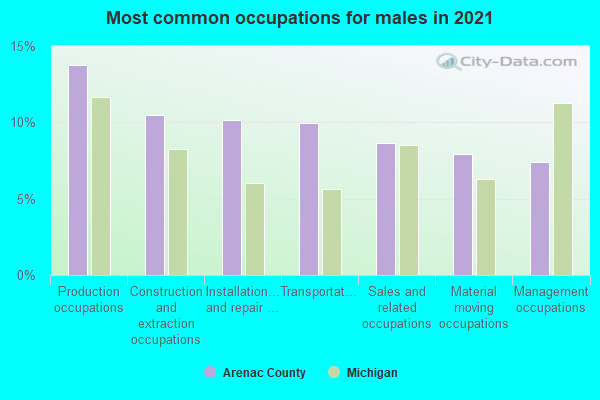
- Production occupations (16%)
- Transportation occupations (11%)
- Construction and extraction occupations (11%)
- Installation, maintenance, and repair occupations (9%)
- Management occupations (8%)
- Sales and related occupations (8%)
- Material moving occupations (6%)
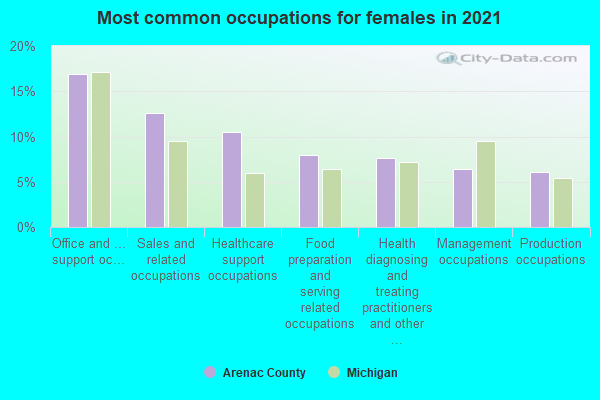
- Office and administrative support occupations (17%)
- Sales and related occupations (13%)
- Healthcare support occupations (11%)
- Food preparation and serving related occupations (8%)
- Health diagnosing and treating practitioners and other technical occupations (8%)
- Management occupations (7%)
- Educational instruction, and library occupations (6%)
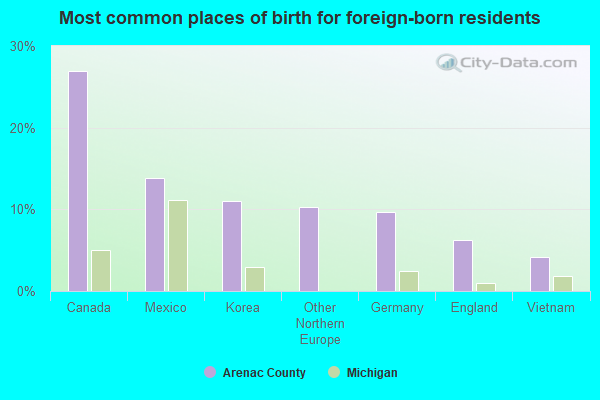
- Canada (28%)
- Mexico (17%)
- Korea (12%)
- Other Northern Europe (9%)
- Germany (9%)
- England (4%)
- United Kingdom, excluding England and Scotland (3%)
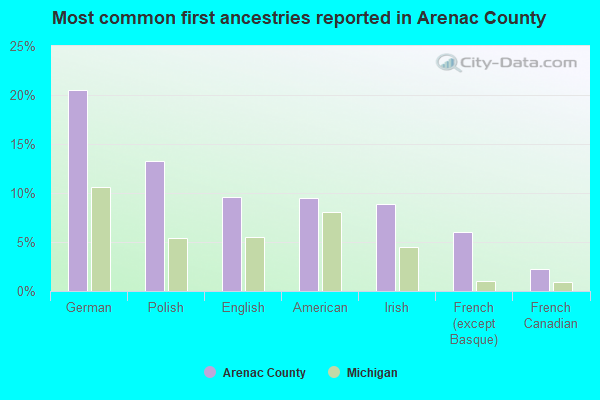
- German (19%)
- Polish (13%)
- American (12%)
- English (10%)
- Irish (8%)
- French (except Basque) (6%)
- French Canadian (3%)
People in group quarters in Arenac County, Michigan in 2010:
- 112 people in nursing facilities/skilled-nursing facilities
- 43 people in local jails and other municipal confinement facilities
- 42 people in group homes intended for adults
- 6 people in residential treatment centers for adults
- 4 people in other noninstitutional facilities
People in group quarters in Arenac County, Michigan in 2000:
- 515 people in state prisons
- 113 people in nursing homes
- 52 people in local jails and other confinement facilities (including police lockups)
- 39 people in agriculture workers' dormitories on farms
- 37 people in homes for the mentally retarded
- 36 people in other group homes
- 11 people in other noninstitutional group quarters
7.55% of this county's 2021 resident taxpayers lived in other counties in 2020 ($49,019 average adjusted gross income)
| Here: | 7.55% |
| Michigan average: | 5.83% |
10 or fewer of this county's residents moved from foreign countries.
6.07% relocated from other counties in Michigan ($39,236 average AGI)
1.48% relocated from other states ($9,783 average AGI)
Arenac County: 1.48% Michigan average: 1.78%
Top counties from which taxpayers relocated into this county between 2020 and 2021:
| from Bay County, MI | |
| from Ogemaw County, MI | |
| from Iosco County, MI | |
| from Genesee County, MI | |
| from Saginaw County, MI | |
| from Macomb County, MI | |
| from Wayne County, MI |
6.51% of this county's 2020 resident taxpayers moved to other counties in 2021 ($44,626 average adjusted gross income)
| Here: | 6.51% |
| Michigan average: | 5.95% |
10 or fewer of this county's residents moved to foreign countries.
5.83% relocated to other counties in Michigan ($40,074 average AGI)
0.68% relocated to other states ($4,552 average AGI)
Arenac County: 0.68% Michigan average: 1.91%

Top counties to which taxpayers relocated from this county between 2020 and 2021:
| to Bay County, MI | |
| to Saginaw County, MI | |
| to Iosco County, MI | |
| to Ogemaw County, MI | |
| to Gladwin County, MI |
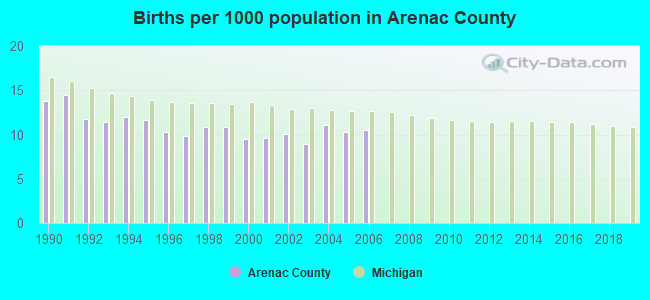
Births per 1000 population from 1990 to 1999: 11.7
Births per 1000 population from 2000 to 2006: 10.0
Deaths per 1000 population from 1990 to 1999: 11.4
Deaths per 1000 population from 2000 to 2009: 11.5
Deaths per 1000 population from 2010 to 2020: 13.6

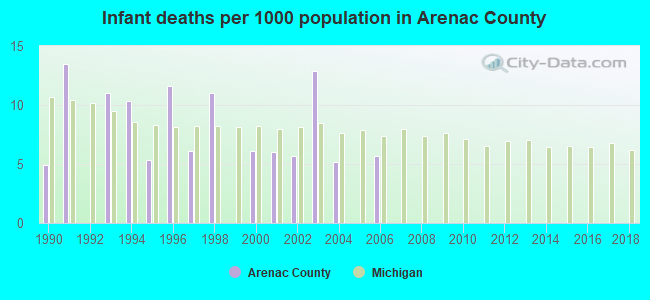
Infant deaths per 1000 live births from 1990 to 1999: 7.4
Infant deaths per 1000 live births from 2000 to 2006: 5.9
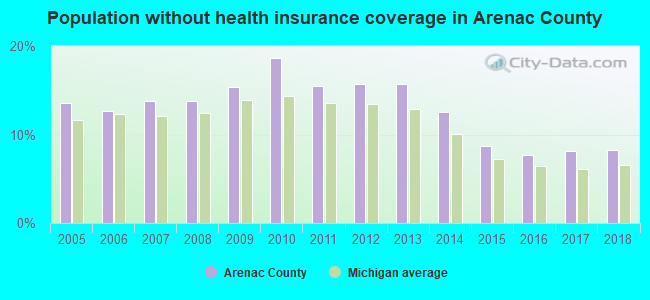
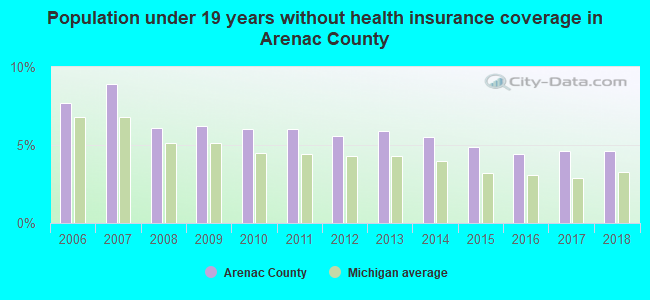
Persons under 19 years old without health insurance coverage in 2018: 4.6%
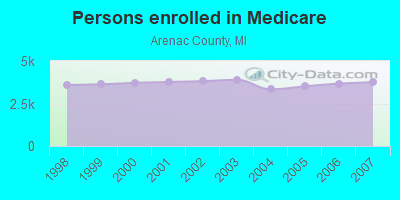
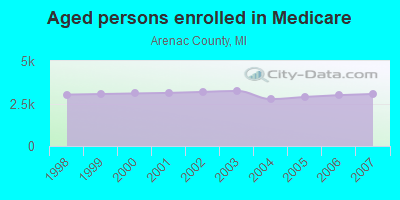
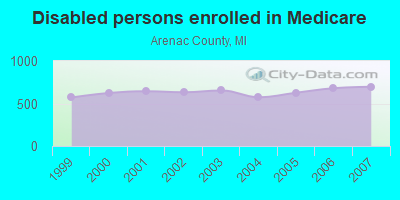
Persons enrolled in hospital insurance and/or supplemental medical insurance (Medicare) in July 1, 2007: 3,757 (3,060 aged, 697 disabled)
Children under 18 without health insurance coverage in 2007: 231 (7%)
Most common underlying causes of death in Arenac County, Michigan in 1999 - 2019:
- Acute myocardial infarction, unspecified (445)
- Atherosclerotic heart disease (430)
- Bronchus or lung, unspecified - Malignant neoplasms (325)
- Chronic obstructive pulmonary disease, unspecified (160)
- Alzheimer disease, unspecified (25)
- Unspecified dementia (13)
- Congestive heart failure (11)
- Stroke, not specified as haemorrhage or infarction (10)
Population without health insurance coverage in 2000: 13%
Children under 18 without health insurance coverage in 2000: 10%
Short term general hospital admissions per 100,000 population in 2004: 8,735
Short term general hospital beds per 100,000 population in 2004: 393
Emergency room visits per 100,000 population in 2004: 38,958
General practice office based MDs per 100,000 population in 2005: 1,061
Medical specialist MDs per 100,000 population in 2005: 1,329
Dentists per 100,000 population in 1998: 6
Total births per 100,000 population, July 2005 - July 2006 : 43
Total deaths per 100,000 population, July 2005 - July 2006: 76
Limited-service eating places per 100,000 population in 2005 : 17
Household type by relationship:
Households: 14,995- Male householders: 3,220 (1,165 living alone), Female householders: 3,260 (898 living alone)
3,136 spouses (3,114 opposite-sex spouses), 526 unmarried partners, (519 opposite-sex unmarried partners), 3,725 children (3,304 natural, 100 adopted, 319 stepchildren), 325 grandchildren, 76 brothers or sisters, 109 parents, 11 foster children, 166 other relatives, 294 non-relatives
- In group quarters: 178
Size of family households: 2,346 2-persons, 737 3-persons, 539 4-persons, 257 5-persons, 69 6-persons, 42 7-or-more-persons.
Size of nonfamily households: 2,061 1-person, 425 2-persons, 17 3-persons, 7 4-persons.
1,676 married couples with children.
770 single-parent households (242 men, 528 women).
98.6% of residents of Arenac speak English at home.
0.9% of residents speak Spanish at home (50% speak English very well, 7% speak English well, 43% speak English not well).
0.4% of residents speak other Indo-European language at home (90% speak English very well, 4% speak English well, 6% speak English not well).
0.1% of residents speak Asian or Pacific Island language at home (12% speak English very well, 47% speak English well, 41% speak English not well).
0.2% of residents speak other language at home (100% speak English very well).
In fiscal year 2004:
Federal Government expenditure: $119,915,000 ($6,923 per capita)
Department of Defense expenditure: $6,821,000
Federal direct payments to individuals for retirement and disability: $57,397,000
Federal other direct payments to individuals: $27,144,000
Federal direct payments not to individuals: $2,501,000
Federal grants: $23,425,000
Federal procurement contracts: $5,406,000 ($4,501,000 Department of Defense)
Federal salaries and wages: $4,043,000 ($1,037,000 Department of Defense)
Federal Government direct loans: $525,000
Federal guaranteed/insured loans: $4,227,000
Federal Government insurance: $26,298,000
Population change from April 1, 2000 to July 1, 2005:
Births: 831| Here: | 48 per 1000 residents |
| State: | 68 per 1000 residents |
Deaths: 1,005
| Here: | 59 per 1000 residents |
| State: | 45 per 1000 residents |
Net international migration: +9
| Here: | +1 per 1000 residents |
| State: | +12 per 1000 residents |
Net internal migration: +90
| Here: | |
| State: |
Total withdrawal of fresh water for public supply: 36.47 millions of gallons per day (0% from ground, 100% from surface)
| Here: | 6.2 |
| State: | 6.5 |
| Here: | 4.2 |
| State: | 4.3 |
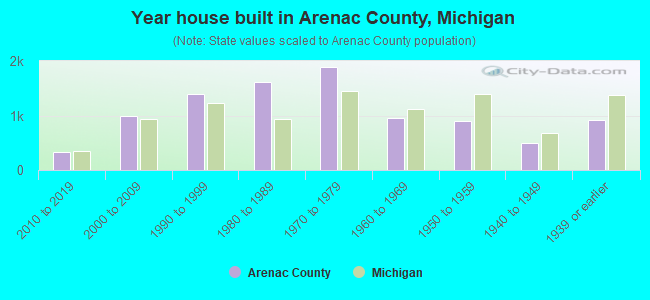
- Year house built in Arenac County, Michigan
- 102020 or later
- 3122010 to 2019
- 1,0472000 to 2009
- 1,3191990 to 1999
- 1,6631980 to 1989
- 1,8481970 to 1979
- 9101960 to 1969
- 9651950 to 1959
- 4791940 to 1949
- 9491939 or earlier
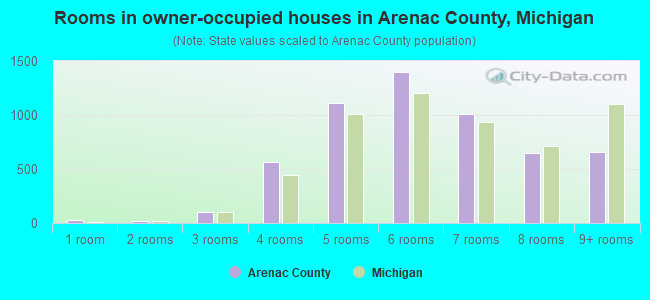
- Rooms in owner-occupied houses in Arenac County, Michigan
- 171 room
- 132 rooms
- 1273 rooms
- 5564 rooms
- 1,1255 rooms
- 1,3666 rooms
- 9937 rooms
- 6938 rooms
- 6629+ rooms
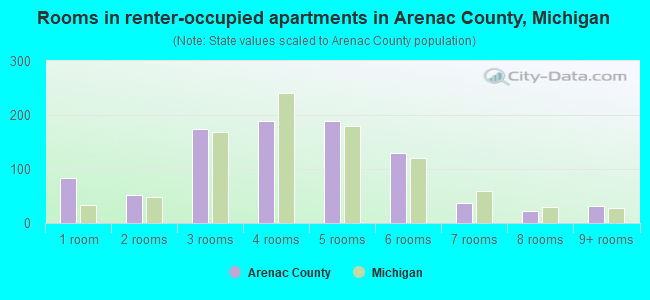
- Rooms in renter-occupied apartments in Arenac County, Michigan
- 681 room
- 982 rooms
- 1333 rooms
- 2154 rooms
- 2105 rooms
- 1166 rooms
- 467 rooms
- 298 rooms
- 239+ rooms
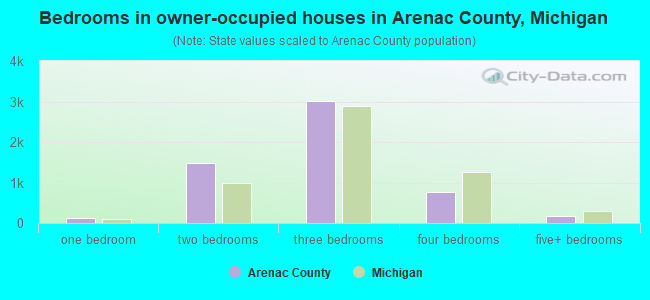
- Bedrooms in owner-occupied houses in Arenac County, Michigan
- 18no bedroom
- 1411 bedroom
- 1,4722 bedrooms
- 3,0433 bedrooms
- 7134 bedrooms
- 1715+ bedrooms
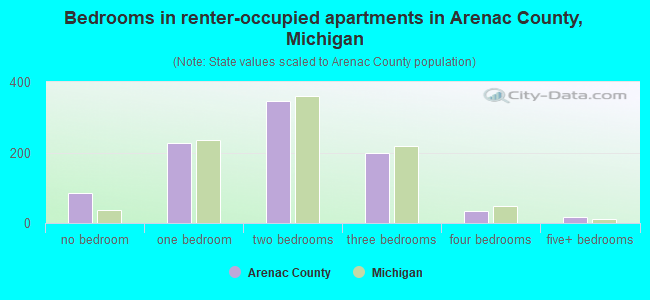
- Bedrooms in renter-occupied apartments in Arenac County, Michigan
- 71no bedroom
- 2581 bedroom
- 3672 bedrooms
- 1943 bedrooms
- 264 bedrooms
- 215+ bedrooms

- Cars and other vehicles available in Arenac County in owner-occupied houses/condos
- 229no vehicle
- 1,6231 vehicle
- 2,3362 vehicles
- 1,0193 vehicles
- 2444 vehicles
- 1145+ vehicles
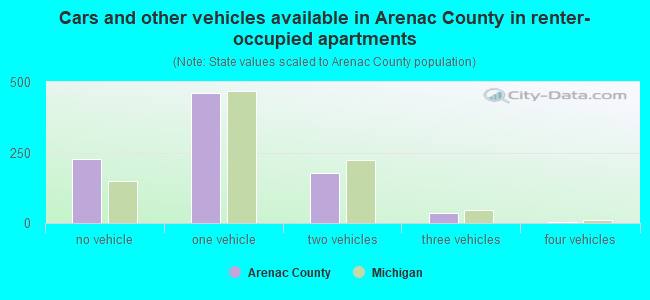
- Cars and other vehicles available in Arenac County in renter-occupied apartments
- 228no vehicle
- 4641 vehicle
- 2012 vehicles
- 423 vehicles
- 44 vehicles
- 45+ vehicles
91.4% of Arenac County residents lived in the same house 1 years ago.
Out of people who lived in different houses, 25% lived in this county.
Out of people who lived in different counties, 75% lived in Michigan.
| Arenac County: | 91.4% |
| State average: | 88.4% |
Place of birth for U.S.-born residents:
- This state: 13,416
- Other state: 1,378
- Northeast: 131
- Midwest: 537
- South: 461
- West: 247
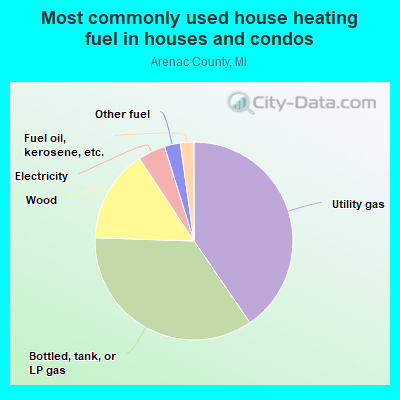
- 41.6%Utility gas
- 35.3%Bottled, tank, or LP gas
- 14.1%Wood
- 4.5%Electricity
- 2.2%Fuel oil, kerosene, etc.
- 2.2%Other fuel
- 0.1%No fuel used
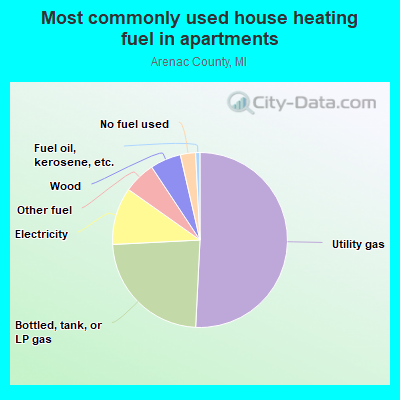
- 51.3%Utility gas
- 25.8%Bottled, tank, or LP gas
- 9.9%Electricity
- 5.7%Wood
- 4.6%Other fuel
- 2.2%No fuel used
- 0.4%Fuel oil, kerosene, etc.
Private vs. public school enrollment:
| Here: | 5.0% |
| Michigan: | 12.4% |
| Here: | 4.4% |
| Michigan: | 9.8% |
| Here: | 13.6% |
| Michigan: | 14.9% |
Arenac County government finances - Expenditure in 2017:
- Charges - Regular Highways: $1,689,000
Other: $1,680,000
Parks and Recreation: $57,000
- Current Operations - Regular Highways: $5,019,000
General - Other: $3,082,000
Judicial and Legal Services: $1,043,000
Police Protection: $991,000
Correctional Institutions: $767,000
Health - Other: $765,000
Financial Administration: $626,000
Central Staff Services: $322,000
Housing and Community Development: $283,000
Parks and Recreation: $246,000
General Public Buildings: $187,000
Public Welfare Institutions: $2,000
- Federal Intergovernmental - Housing and Community Development: $219,000
Other: $192,000
- General - Interest on Debt: $27,000
- Intergovernmental to State - Correctional Institutions: $133,000
- Local Intergovernmental - Other: $647,000
Highways: $542,000
Housing and Community Development: $6,000
- Long Term Debt - Beginning Outstanding - Unspecified Public Purpose: $1,436,000
Outstanding Unspecified Public Purpose: $1,381,000
Retired Unspecified Public Purpose: $147,000
Issue, Unspecified Public Purpose: $92,000
- Miscellaneous - General Revenue - Other: $180,000
Sale of Property: $32,000
Fines and Forfeits: $13,000
Interest Earnings: $11,000
- Other Capital Outlay - General - Other: $650,000
Police Protection: $86,000
Parks and Recreation: $5,000
- Other Funds - Cash and Securities: $4,963,000
- State Intergovernmental - Highways: $2,646,000
Other: $825,000
General Local Government Support: $375,000
- Tax - Property: $5,388,000
Other License: $81,000
- Total Salaries and Wages: $3,409,000
Arenac County government finances - Revenue in 2017:
- Charges - Regular Highways: $1,689,000
Other: $1,680,000
Parks and Recreation: $57,000
- Current Operations - Regular Highways: $5,019,000
General - Other: $3,082,000
Judicial and Legal Services: $1,043,000
Police Protection: $991,000
Correctional Institutions: $767,000
Health - Other: $765,000
Financial Administration: $626,000
Central Staff Services: $322,000
Housing and Community Development: $283,000
Parks and Recreation: $246,000
General Public Buildings: $187,000
Public Welfare Institutions: $2,000
- Federal Intergovernmental - Housing and Community Development: $219,000
Other: $192,000
- General - Interest on Debt: $27,000
- Intergovernmental to State - Correctional Institutions: $133,000
- Local Intergovernmental - Other: $647,000
Highways: $542,000
Housing and Community Development: $6,000
- Long Term Debt - Beginning Outstanding - Unspecified Public Purpose: $1,436,000
Outstanding Unspecified Public Purpose: $1,381,000
Retired Unspecified Public Purpose: $147,000
Issue, Unspecified Public Purpose: $92,000
- Miscellaneous - General Revenue - Other: $180,000
Sale of Property: $32,000
Fines and Forfeits: $13,000
Interest Earnings: $11,000
- Other Capital Outlay - General - Other: $650,000
Police Protection: $86,000
Parks and Recreation: $5,000
- Other Funds - Cash and Securities: $4,963,000
- State Intergovernmental - Highways: $2,646,000
Other: $825,000
General Local Government Support: $375,000
- Tax - Property: $5,388,000
Other License: $81,000
- Total Salaries and Wages: $3,409,000
Arenac County government finances - Debt in 2017:
- Charges - Regular Highways: $1,689,000
Other: $1,680,000
Parks and Recreation: $57,000
- Current Operations - Regular Highways: $5,019,000
General - Other: $3,082,000
Judicial and Legal Services: $1,043,000
Police Protection: $991,000
Correctional Institutions: $767,000
Health - Other: $765,000
Financial Administration: $626,000
Central Staff Services: $322,000
Housing and Community Development: $283,000
Parks and Recreation: $246,000
General Public Buildings: $187,000
Public Welfare Institutions: $2,000
- Federal Intergovernmental - Housing and Community Development: $219,000
Other: $192,000
- General - Interest on Debt: $27,000
- Intergovernmental to State - Correctional Institutions: $133,000
- Local Intergovernmental - Other: $647,000
Highways: $542,000
Housing and Community Development: $6,000
- Long Term Debt - Beginning Outstanding - Unspecified Public Purpose: $1,436,000
Outstanding Unspecified Public Purpose: $1,381,000
Retired Unspecified Public Purpose: $147,000
Issue, Unspecified Public Purpose: $92,000
- Miscellaneous - General Revenue - Other: $180,000
Sale of Property: $32,000
Fines and Forfeits: $13,000
Interest Earnings: $11,000
- Other Capital Outlay - General - Other: $650,000
Police Protection: $86,000
Parks and Recreation: $5,000
- Other Funds - Cash and Securities: $4,963,000
- State Intergovernmental - Highways: $2,646,000
Other: $825,000
General Local Government Support: $375,000
- Tax - Property: $5,388,000
Other License: $81,000
- Total Salaries and Wages: $3,409,000
Arenac County government finances - Cash and Securities in 2017:
- Charges - Regular Highways: $1,689,000
Other: $1,680,000
Parks and Recreation: $57,000
- Current Operations - Regular Highways: $5,019,000
General - Other: $3,082,000
Judicial and Legal Services: $1,043,000
Police Protection: $991,000
Correctional Institutions: $767,000
Health - Other: $765,000
Financial Administration: $626,000
Central Staff Services: $322,000
Housing and Community Development: $283,000
Parks and Recreation: $246,000
General Public Buildings: $187,000
Public Welfare Institutions: $2,000
- Federal Intergovernmental - Housing and Community Development: $219,000
Other: $192,000
- General - Interest on Debt: $27,000
- Intergovernmental to State - Correctional Institutions: $133,000
- Local Intergovernmental - Other: $647,000
Highways: $542,000
Housing and Community Development: $6,000
- Long Term Debt - Beginning Outstanding - Unspecified Public Purpose: $1,436,000
Outstanding Unspecified Public Purpose: $1,381,000
Retired Unspecified Public Purpose: $147,000
Issue, Unspecified Public Purpose: $92,000
- Miscellaneous - General Revenue - Other: $180,000
Sale of Property: $32,000
Fines and Forfeits: $13,000
Interest Earnings: $11,000
- Other Capital Outlay - General - Other: $650,000
Police Protection: $86,000
Parks and Recreation: $5,000
- Other Funds - Cash and Securities: $4,963,000
- State Intergovernmental - Highways: $2,646,000
Other: $825,000
General Local Government Support: $375,000
- Tax - Property: $5,388,000
Other License: $81,000
- Total Salaries and Wages: $3,409,000
Supplemental Security Income (SSI) in 2006:
- Total number of recipients: 525
- Number of aged recipients: 27
- Number of blind and disabled recipients: 498
- Number of recipients under 18: 70
- Number of recipients between 18 and 64: 378
- Number of recipients older than 64: 77
- Number of recipients also receiving OASDI: 197
- Amount of payments (thousands of dollars): 240
| Most common first names in Arenac County, MI among deceased individuals | ||
| Name | Count | Lived (average) |
|---|---|---|
| John | 125 | 72.7 years |
| William | 117 | 75.4 years |
| Mary | 103 | 78.5 years |
| Joseph | 92 | 75.4 years |
| Robert | 75 | 71.2 years |
| James | 62 | 70.7 years |
| George | 59 | 76.4 years |
| Edward | 54 | 75.6 years |
| Frank | 50 | 77.1 years |
| Charles | 49 | 76.2 years |
| Most common last names in Arenac County, MI among deceased individuals | ||
| Last name | Count | Lived (average) |
|---|---|---|
| Smith | 36 | 75.9 years |
| Johnson | 28 | 75.8 years |
| Brown | 24 | 76.5 years |
| Miller | 21 | 74.3 years |
| Daniels | 20 | 78.6 years |
| Moore | 18 | 75.7 years |
| Heinrich | 17 | 75.5 years |
| Davis | 17 | 78.9 years |
| Allen | 16 | 69.9 years |
| Dittenber | 15 | 74.9 years |
| Businesses in Arenac County, MI | ||||
| Name | Count | Name | Count | |
|---|---|---|---|---|
| Ace Hardware | 1 | MasterBrand Cabinets | 4 | |
| Arby's | 1 | McDonald's | 2 | |
| Burger King | 1 | RadioShack | 1 | |
| Chevrolet | 1 | Rite Aid | 1 | |
| Econo Lodge | 1 | Subway | 3 | |
| FedEx | 1 | Taco Bell | 1 | |
| Ford | 1 | True Value | 1 | |
| GNC | 1 | U-Haul | 2 | |
| H&R Block | 1 | UPS | 1 | |
| Little Caesars Pizza | 1 | |||
Arenac County on our top lists:
- #46 on the list of "Top 101 counties with the lowest ground withdrawal of fresh water for public supply"