Benton County, Indiana (IN)
County owner-occupied free and clear houses and condos in 2010: 904
County owner-occupied houses and condos in 2000: 2,696
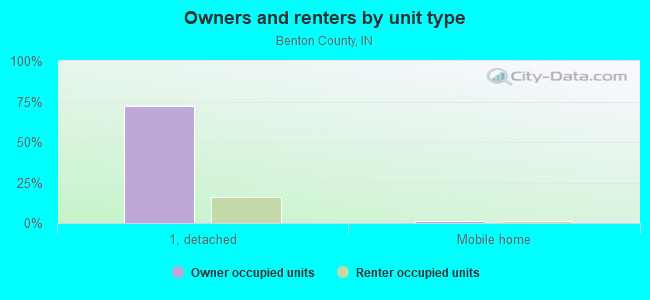
Renter-occupied apartments: 884 (it was 862 in 2000)
| % of renters here: | 24% |
| State: | 30% |
Land area: 406 sq. mi.
Water area: 0.1 sq. mi.
Population density: 22 people per square mile (low).
Industries providing employment: Manufacturing (20.6%), Educational, health and social services (19.1%), Agriculture,forestry,fishing and hunting, and mining (10.9%).
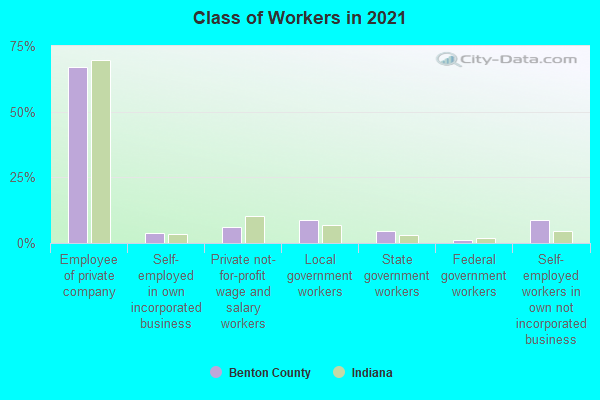
Type of workers:
- Private wage or salary: 77%
- Government: 14%
- Self-employed, not incorporated: 8%
- Unpaid family work: 0%
- OSM Map
- General Map
- Google Map
- MSN Map

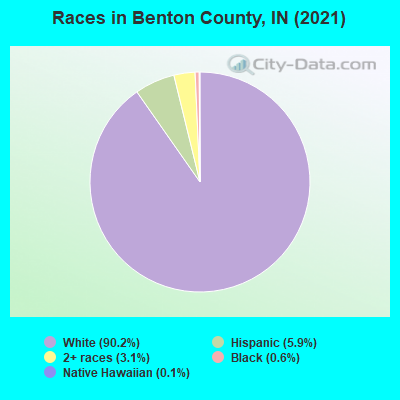
- 7,83690.0%White Non-Hispanic Alone
- 5396.2%Hispanic or Latino
- 1932.2%Two or more races
- 1031.2%Black Non-Hispanic Alone
- 180.2%Native Hawaiian and Other
Pacific Islander alone - 160.2%Some other race alone
- 50.06%Asian alone
| Median resident age: | 40.6 years |
| Indiana median age: | 38.2 years |
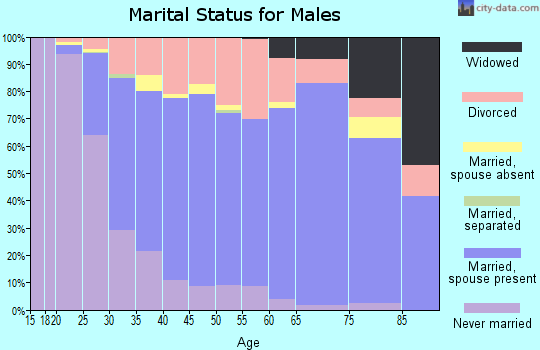
| Males: 4,422 | |
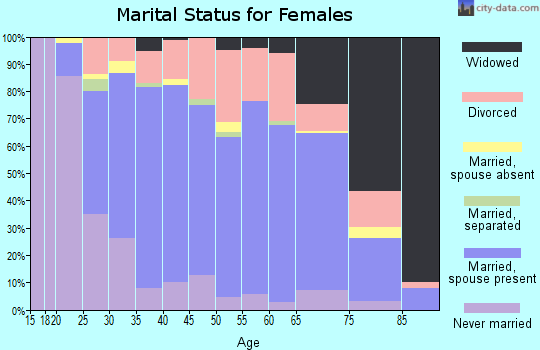
| Females: 4,349 |

 | Wind Farms in Benton County (47 replies) |
| Rural, Small-town (7 replies) |
| Share your Indiana photos here! (572 replies) |
| Wolves or Coyotes along I-65 just north of Lebanon (53 replies) |
| West Lafayette or Lafayette? (11 replies) |
| Relocating to Kentland.... (5 replies) |
| Benton County: | 2.0 people |
| Indiana: | 3 people |
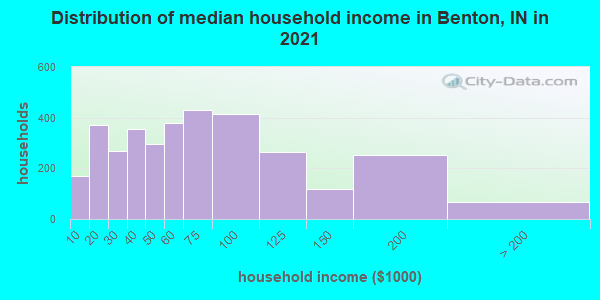
Estimated median household income in 2022: $58,281 ($39,813 in 1999)
| This county: | $58,281 |
| Indiana: | $66,785 |
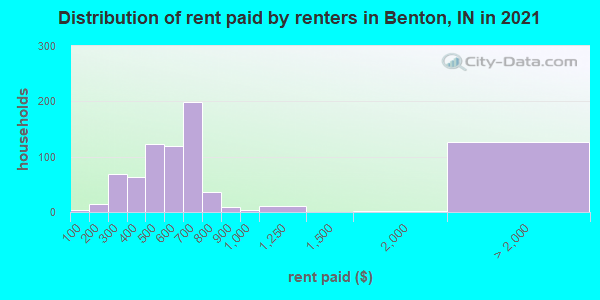
Median contract rent in 2022 for apartments: $556 (lower quartile is $421, upper quartile is $693)
| This county: | $556 |
| State: | $780 |
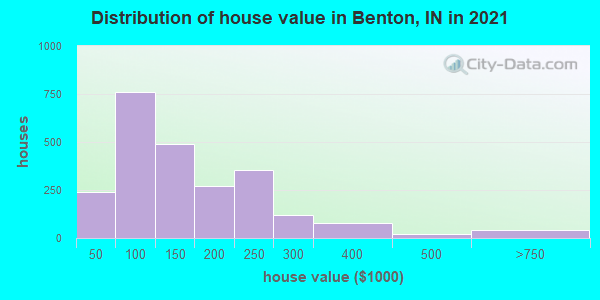
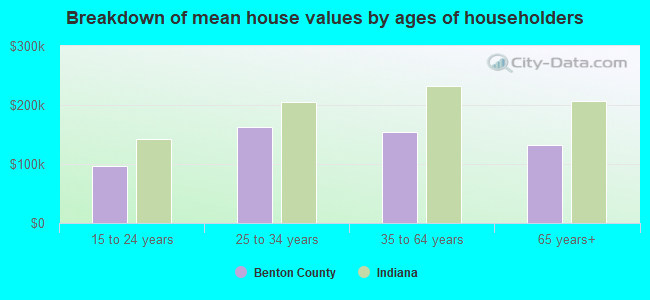
Estimated median house or condo value in 2022: $139,361 (it was $76,100 in 2000)
| Benton: | $139,361 |
| Indiana: | $208,700 |
Median monthly housing costs for homes and condos with a mortgage: $1,072
Median monthly housing costs for units without a mortgage: $450
Institutionalized population: 77
Crime in 2006 (reported by the sheriff's office or county police, not the county total):
- Murders: 0
- Rapes: 0
- Robberies: 0
- Assaults: 7
- Burglaries: 18
- Thefts: 44
- Auto thefts: 9
Crime in 1999 (reported by the sheriff's office or county police, not the county total):
- Murders: 0
- Rapes: 0
- Robberies: 0
- Assaults: 0
- Burglaries: 8
- Thefts: 31
- Auto thefts: 2
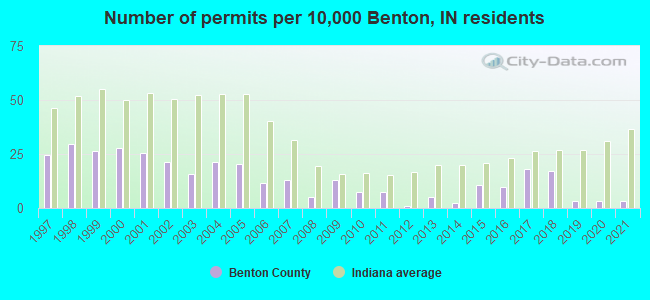
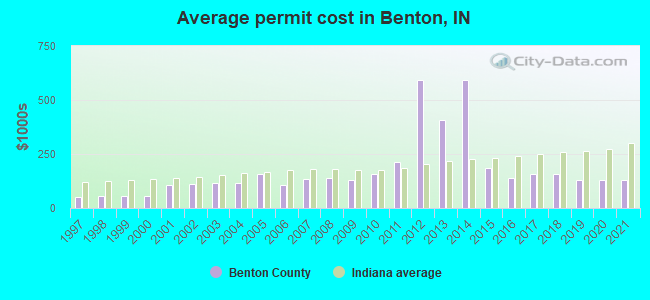
Single-family new house construction building permits:
- 2022: 0 buildings
- 2021: 3 buildings, average cost: $131,000
- 2020: 3 buildings, average cost: $131,000
- 2019: 3 buildings, average cost: $131,000
- 2018: 16 buildings, average cost: $156,000
- 2017: 17 buildings, average cost: $156,000
- 2016: 9 buildings, average cost: $141,000
- 2015: 10 buildings, average cost: $186,600
- 2014: 2 buildings, average cost: $592,000
- 2013: 5 buildings, average cost: $406,600
- 2012: 1 building, cost: $592,000
- 2011: 7 buildings, average cost: $214,100
- 2010: 7 buildings, average cost: $157,200
- 2009: 12 buildings, average cost: $128,700
- 2008: 5 buildings, average cost: $141,300
- 2007: 12 buildings, average cost: $134,700
- 2006: 11 buildings, average cost: $104,800
- 2005: 19 buildings, average cost: $155,600
- 2004: 20 buildings, average cost: $113,500
- 2003: 15 buildings, average cost: $118,400
- 2002: 20 buildings, average cost: $111,900
- 2001: 24 buildings, average cost: $106,800
- 2000: 26 buildings, average cost: $54,800
- 1999: 25 buildings, average cost: $54,000
- 1998: 28 buildings, average cost: $56,000
- 1997: 23 buildings, average cost: $52,600
Median real estate property taxes paid for housing units with mortgages in 2022: $972 (0.7%)
Median real estate property taxes paid for housing units with no mortgage in 2022: $806 (0.6%)
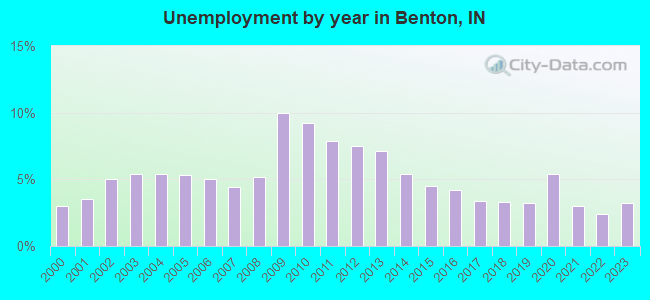
| Benton County: | 14.5% |
| Indiana: | 12.6% |
Median age of residents in 2022: 40.6 years old
(Males: 38.5 years old, Females: 42.4 years old)
(Median age for: White residents: 42.4 years old, Black residents: 31.9 years old, Asian residents: 17.3 years old, Hispanic or Latino residents: 24.5 years old, Other race residents: 47.9 years old)
Area name: Lafayette, IN HUD Metro FMR Area
Fair market rent in 2006 for a 1-bedroom apartment in Benton County is $550 a month.
Fair market rent for a 2-bedroom apartment is $676 a month.
Fair market rent for a 3-bedroom apartment is $880 a month.
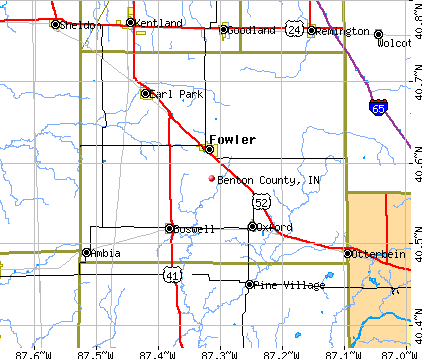
Cities in this county include: Fowler, Oxford, Boswell, Earl Park, Ambia.
Neighboring counties: Holmes County, Ohio  , Schuylkill County, Pennsylvania , Mason County, Illinois
  , Van Wert County, Ohio , Scotland County, Missouri .
| Here: | 2.1% |
| Indiana: | 2.8% |
Current college students: 247
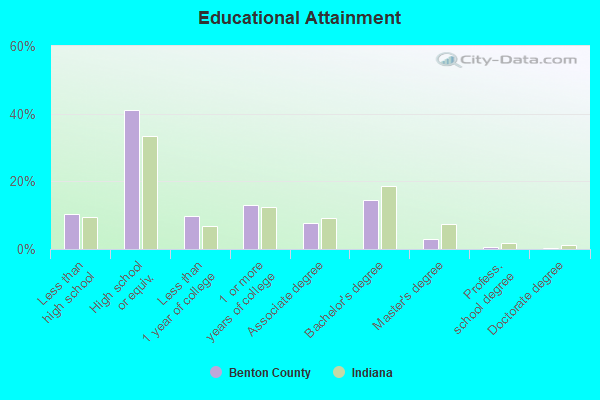
People 25 years of age or older with a high school degree or higher: 88.6%
People 25 years of age or older with a bachelor's degree or higher: 18.7%
Number of foreign born residents: 167 (16.8% naturalized citizens)
| Benton County: | 1.9% |
| Whole state: | 6.1% |
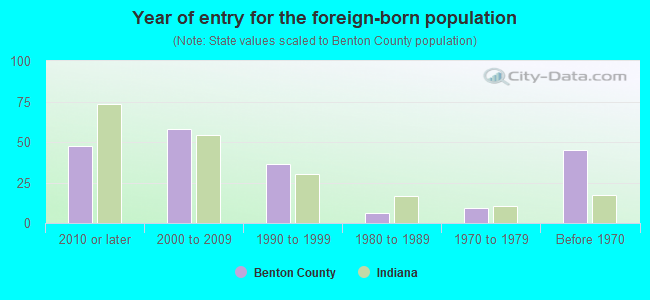
- Year of entry for the foreign-born population
- 462010 or later
- 682000 to 2009
- 261990 to 1999
- 61980 to 1989
- 91970 to 1979
- 45Before 1970
Mean travel time to work (commute): minutes
Percentage of county residents living and working in this county: 98.4%
Housing units in structures:
- One, detached: 3,346
- One, attached: 8
- Two: 90
- 3 or 4: 101
- 5 to 9: 117
- 10 to 19: 32
- 20 or more: 11
- Mobile homes: 132
Housing units in Benton County with a mortgage: 1,651 (294 second mortgage, 0 home equity loan, 294 both second mortgage and home equity loan)
Houses without a mortgage: 44
| Here: | 2.2% with mortgage |
| State: | 96.6% with mortgage |
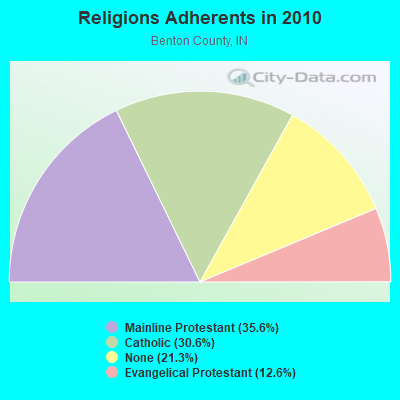
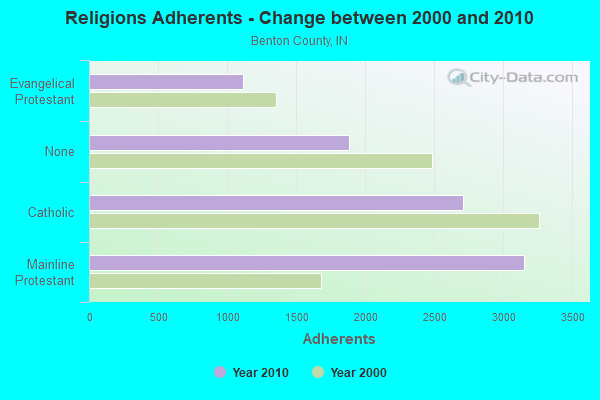
Religion statistics for Benton County
| Religion | Adherents | Congregations |
|---|---|---|
| Mainline Protestant | 3,149 | 12 |
| Catholic | 2,708 | 5 |
| Evangelical Protestant | 1,114 | 8 |
| None | 1,883 | - |
Source: Clifford Grammich, Kirk Hadaway, Richard Houseal, Dale E.Jones, Alexei Krindatch, Richie Stanley and Richard H.Taylor. 2012. 2010 U.S.Religion Census: Religious Congregations & Membership Study. Association of Statisticians of American Religious Bodies. Jones, Dale E., et al. 2002. Congregations and Membership in the United States 2000. Nashville, TN: Glenmary Research Center.
Food Environment Statistics:
| Benton County: | 2.28 / 10,000 pop. |
| State: | 1.73 / 10,000 pop. |
| Benton County: | 5.70 / 10,000 pop. |
| Indiana: | 3.57 / 10,000 pop. |
| This county: | 5.70 / 10,000 pop. |
| State: | 6.78 / 10,000 pop. |
| Benton County: | 10.0% |
| Indiana: | 9.2% |
| Benton County: | 29.1% |
| State: | 29.0% |
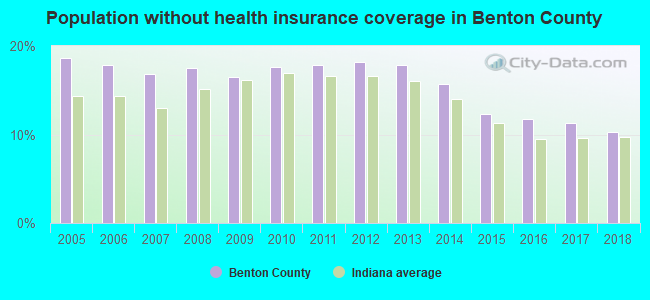
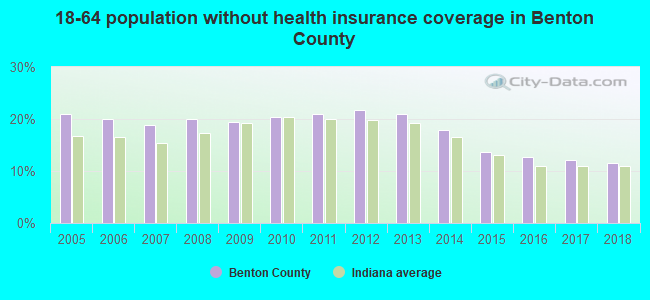
| Here: | 20.7% |
| State: | 14.3% |
Agriculture in Benton County:
Average size of farms: 629 acresAverage value of agricultural products sold per farm: $176,604
Average value of crops sold per acre for harvested cropland: $288.51
The value of livestock, poultry, and their products as a percentage of the total market value of agricultural products sold: 3.47%
Average total farm production expenses per farm: $125,438
Harvested cropland as a percentage of land in farms: 93.88%
Average market value of all machinery and equipment per farm: $155,254
The percentage of farms operated by a family or individual: 85.53%
Average age of principal farm operators: 54 years
Average number of cattle and calves per 100 acres of all land in farms: 1.00
Corn for grain: 116077 harvested acres
All wheat for grain: 256 harvested acres
Soybeans for beans: 114213 harvested acres
Earthquake activity:
Benton County-area historical earthquake activity is significantly above Indiana state average. It is 65% greater than the overall U.S. average.On 4/18/2008 at 09:36:59, a magnitude 5.4 (5.1 MB, 4.8 MS, 5.4 MW, 5.2 MW, Class: Moderate, Intensity: VI - VII) earthquake occurred 150.3 miles away from Benton County center
On 6/10/1987 at 23:48:54, a magnitude 5.1 (4.9 MB, 4.4 MS, 4.6 MS, 5.1 LG) earthquake occurred 125.4 miles away from the county center
On 4/18/2008 at 09:36:59, a magnitude 5.2 (5.2 MW, Depth: 8.9 mi) earthquake occurred 150.3 miles away from the county center
On 6/18/2002 at 17:37:15, a magnitude 5.0 (4.3 MB, 4.6 MW, 5.0 LG) earthquake occurred 181.0 miles away from the county center
On 4/18/2008 at 15:14:16, a magnitude 4.8 (4.5 MB, 4.8 MW, 4.6 MW, Class: Light, Intensity: IV - V) earthquake occurred 148.2 miles away from Benton County center
On 4/3/1974 at 23:05:02, a magnitude 4.7 (4.5 MB, 4.7 LG) earthquake occurred 143.6 miles away from the county center
Magnitude types: regional Lg-wave magnitude (LG), body-wave magnitude (MB), surface-wave magnitude (MS), moment magnitude (MW)
Most recent natural disasters:
- Indiana Covid-19 Pandemic, Incident Period: January 31, 2020, FEMA Id: 4515, Natural disaster type: Other
- Indiana Severe Storms And Flooding, Incident Period: February 14, 2018 - March 4, 2018, FEMA Id: 4363, Natural disaster type: Storm, Flood
- Indiana Severe Storms, Tornadoes, Straight-Line Winds, and Flooding, Incident Period: April 19, 2011 to June 06, 2011, Major Disaster (Presidential) Declared DR-1997: June 23, 2011, FEMA Id: 1997, Natural disaster type: Storm, Tornado, Flood, Wind
- Indiana Severe Storms and Flooding, Incident Period: May 30, 2008 to June 27, 2008, Major Disaster (Presidential) Declared DR-1766: June 08, 2008, FEMA Id: 1766, Natural disaster type: Storm, Flood
- Indiana Severe Storms and Flooding, Incident Period: January 07, 2008 to March 14, 2008, Major Disaster (Presidential) Declared DR-1740: January 30, 2008, FEMA Id: 1740, Natural disaster type: Storm, Flood
- Indiana Snow, Incident Period: February 12, 2007 to February 14, 2007, Emergency Declared EM-3274: March 12, 2007, FEMA Id: 3274, Natural disaster type: Snow
- Indiana Hurricane Katrina Evacuation, Incident Period: August 29, 2005 to October 01, 2005, Emergency Declared EM-3238: September 10, 2005, FEMA Id: 3238, Natural disaster type: Hurricane
- Indiana Severe Winter Storms and Flooding, Incident Period: January 01, 2005 to February 11, 2005, Major Disaster (Presidential) Declared DR-1573: January 21, 2005, FEMA Id: 1573, Natural disaster type: Winter Storm, Flood
- Indiana Severe Storms, Tornadoes, and Flooding, Incident Period: May 25, 2004 to June 25, 2004, Major Disaster (Presidential) Declared DR-1520: June 03, 2004, FEMA Id: 1520, Natural disaster type: Storm, Tornado, Flood
- Indiana Severe Storms, Tornadoes, and Flooding, Incident Period: July 04, 2003 to August 06, 2003, Major Disaster (Presidential) Declared DR-1476: July 11, 2003, FEMA Id: 1476, Natural disaster type: Storm, Tornado, Flood
- 8 other natural disasters have been reported since 1953.
The number of natural disasters in Benton County (18) is near the US average (15).
Major Disasters (Presidential) Declared: 11
Emergencies Declared: 5
Causes of natural disasters: Floods: 9, Storms: 9, Tornadoes: 5, Winter Storms: 4, Hurricane: 1, Ice Storm: 1, Snow: 1, Snowstorm: 1, Wind: 1, Other: 1 (Note: some incidents may be assigned to more than one category).
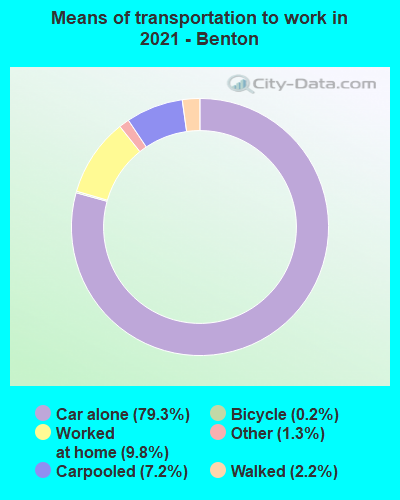
Means of transportation to work:
- Drove a car alone: 1,879 (76.6%)
- Carpooled: 156 (6.4%)
- Bus: 2 (0.1%)
- Taxicab, motorcycle, or other means: 15 (0.6%)
- Walked: 107 (4.4%)
- Worked at home: 287 (11.7%)
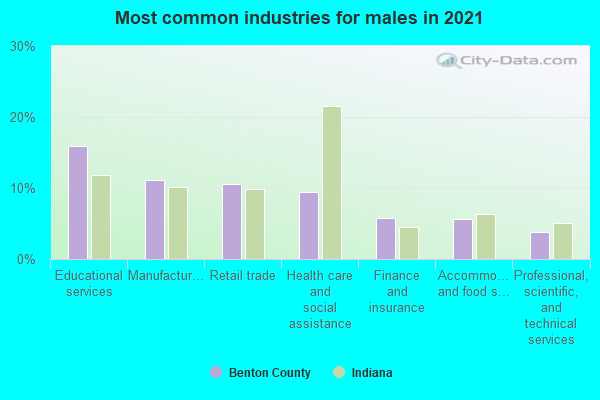
- Educational services (17%)
- Manufacturing (11%)
- Health care and social assistance (11%)
- Retail trade (10%)
- Accommodation and food services (6%)
- Finance and insurance (5%)
- Professional, scientific, and technical services (4%)
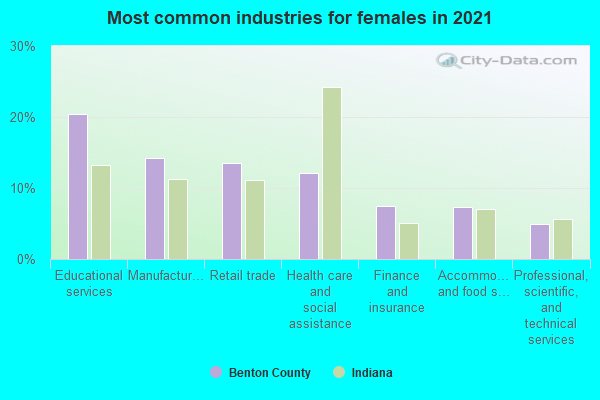
- Educational services (22%)
- Manufacturing (14%)
- Health care and social assistance (14%)
- Retail trade (13%)
- Accommodation and food services (7%)
- Finance and insurance (7%)
- Professional, scientific, and technical services (5%)
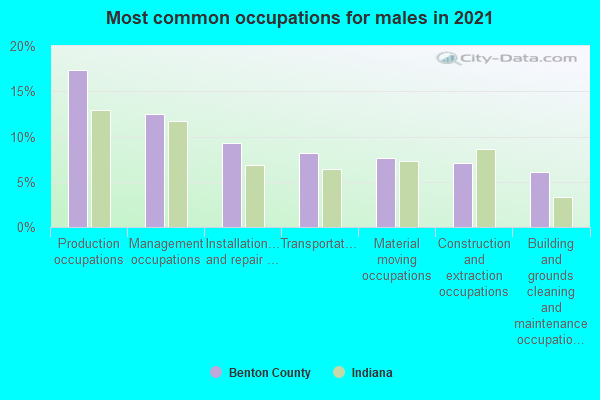
- Management occupations (17%)
- Production occupations (16%)
- Construction and extraction occupations (9%)
- Installation, maintenance, and repair occupations (8%)
- Material moving occupations (7%)
- Building and grounds cleaning and maintenance occupations (6%)
- Transportation occupations (6%)
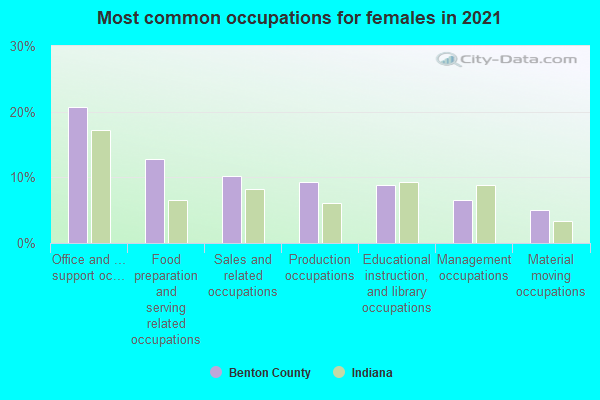
- Office and administrative support occupations (19%)
- Food preparation and serving related occupations (12%)
- Production occupations (10%)
- Sales and related occupations (10%)
- Educational instruction, and library occupations (9%)
- Management occupations (8%)
- Material moving occupations (6%)
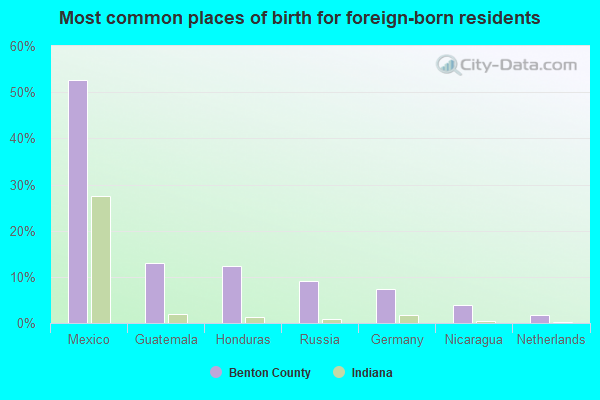
- Mexico (58%)
- Panama (13%)
- Guatemala (10%)
- Honduras (9%)
- Germany (4%)
- Netherlands (4%)
- Ukraine (2%)
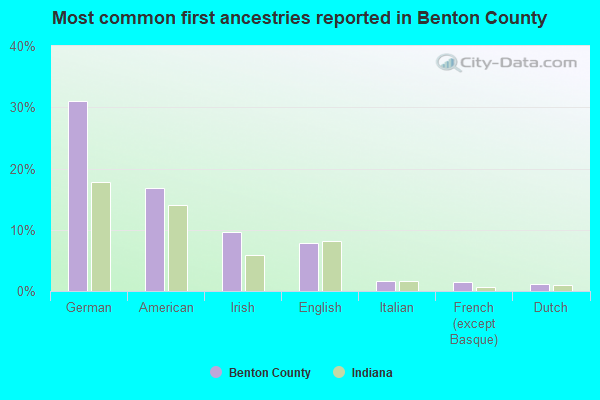
- German (25%)
- American (23%)
- English (10%)
- Irish (9%)
- Dutch (2%)
- Italian (1%)
- French (except Basque) (1%)
People in group quarters in Benton County, Indiana in 2010:
- 56 people in nursing facilities/skilled-nursing facilities
- 21 people in local jails and other municipal confinement facilities
- 12 people in workers' group living quarters and job corps centers
- 3 people in group homes intended for adults
47 people in local jails and other confinement facilities (including police lockups)
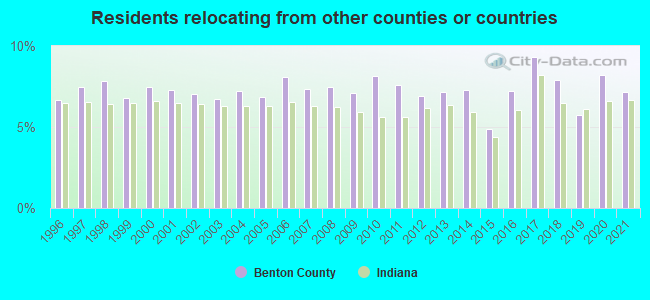
7.19% of this county's 2021 resident taxpayers lived in other counties in 2020 ($42,984 average adjusted gross income)
| Here: | 7.19% |
| Indiana average: | 6.66% |
10 or fewer of this county's residents moved from foreign countries.
6.32% relocated from other counties in Indiana ($37,536 average AGI)
0.86% relocated from other states ($5,444 average AGI)
Benton County: 0.86% Indiana average: 2.58%
Top counties from which taxpayers relocated into this county between 2020 and 2021:
| from Tippecanoe County, IN | |
| from Newton County, IN |
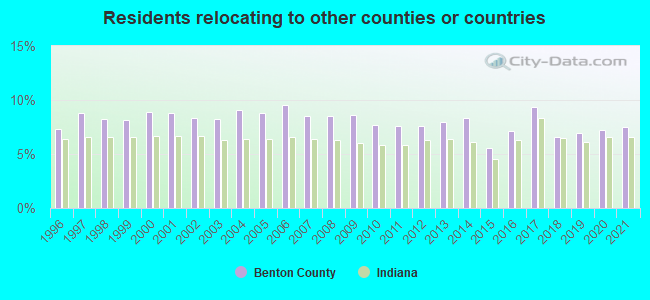
7.53% of this county's 2020 resident taxpayers moved to other counties in 2021 ($52,361 average adjusted gross income)
| Here: | 7.53% |
| Indiana average: | 6.55% |
10 or fewer of this county's residents moved to foreign countries.
6.21% relocated to other counties in Indiana ($43,753 average AGI)
1.32% relocated to other states ($8,605 average AGI)
Benton County: 1.32% Indiana average: 2.46%
Top counties to which taxpayers relocated from this county between 2020 and 2021:
| to Tippecanoe County, IN |
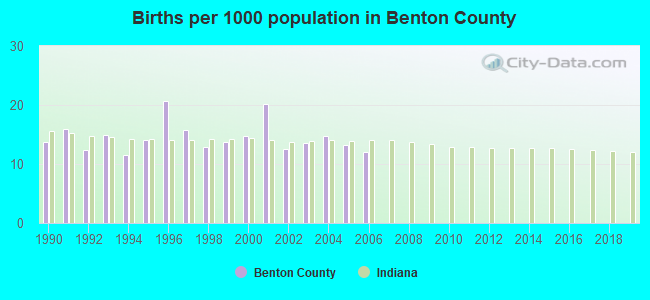
Births per 1000 population from 1990 to 1999: 14.6
Births per 1000 population from 2000 to 2006: 14.4
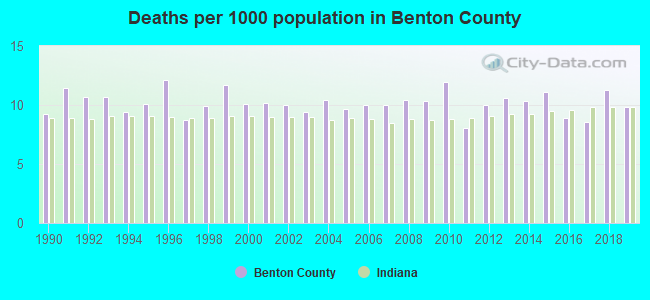
Deaths per 1000 population from 1990 to 1999: 10.4
Deaths per 1000 population from 2000 to 2009: 10.1
Deaths per 1000 population from 2010 to 2020: 10.3
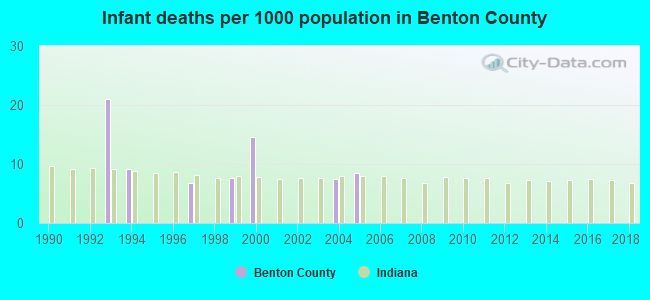
Infant deaths per 1000 live births from 1990 to 1999: 4.5
Infant deaths per 1000 live births from 2000 to 2006: 4.3
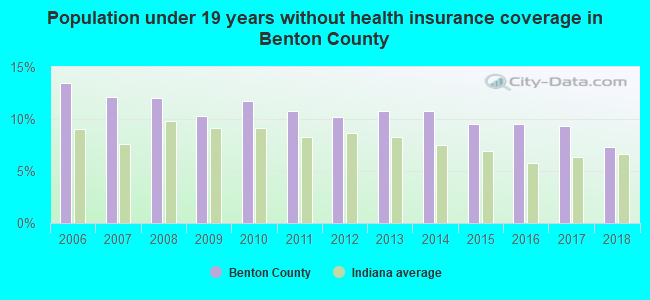
Persons under 19 years old without health insurance coverage in 2018: 7.3%
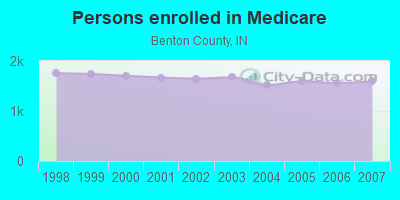
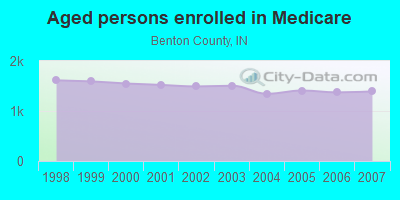
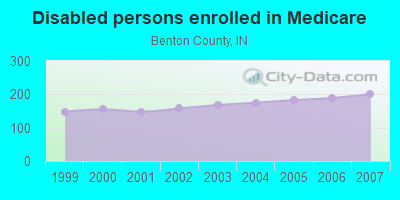
Persons enrolled in hospital insurance and/or supplemental medical insurance (Medicare) in July 1, 2007: 1,593 (1,392 aged, 201 disabled)
Children under 18 without health insurance coverage in 2007: 260 (11%)
Most common underlying causes of death in Benton County, Indiana in 1999 - 2019:
- Acute myocardial infarction, unspecified (101)
- Atherosclerotic heart disease (55)
- Bronchus or lung, unspecified - Malignant neoplasms (43)
Population without health insurance coverage in 2000: 12%
Children under 18 without health insurance coverage in 2000: 10%
Medical specialist MDs per 100,000 population in 2005: 1,117
Dentists per 100,000 population in 1998: 33
Total births per 100,000 population, July 2005 - July 2006 : 21
Total deaths per 100,000 population, July 2005 - July 2006: 55
Limited-service eating places per 100,000 population in 2005 : 11
Household type by relationship:
Households: 8,771- Male householders: 1,881 (621 living alone), Female householders: 1,632 (455 living alone)
1,597 spouses (1,572 opposite-sex spouses), 302 unmarried partners, (293 opposite-sex unmarried partners), 2,645 children (2,440 natural, 69 adopted, 135 stepchildren), 190 grandchildren, 43 brothers or sisters, 94 parents, 0 foster children, 95 other relatives, 176 non-relatives
- In group quarters: 112
Size of family households: 1,067 2-persons, 480 3-persons, 293 4-persons, 274 5-persons, 111 6-persons, 35 7-or-more-persons.
Size of nonfamily households: 1,075 1-person, 163 2-persons, 20 3-persons.
1,274 married couples with children.
619 single-parent households (150 men, 469 women).
94.1% of residents of Benton speak English at home.
4.8% of residents speak Spanish at home (66% speak English very well, 11% speak English well, 18% speak English not well, 5% don't speak English at all).
0.2% of residents speak other Indo-European language at home (79% speak English very well, 21% speak English well).
0.3% of residents speak Asian or Pacific Island language at home (64% speak English very well, 21% speak English well, 14% speak English not well).
0.1% of residents speak other language at home (100% speak English very well).
In fiscal year 2004:
Federal Government expenditure: $56,912,000 ($6,227 per capita)
Department of Defense expenditure: $740,000
Federal direct payments to individuals for retirement and disability: $23,834,000
Federal other direct payments to individuals: $11,189,000
Federal direct payments not to individuals: $10,516,000
Federal grants: $8,654,000
Federal procurement contracts: $517,000 ($0,000 Department of Defense)
Federal salaries and wages: $2,202,000 ($187,000 Department of Defense)
Federal Government direct loans: $685,000
Federal guaranteed/insured loans: $8,190,000
Federal Government insurance: $55,213,000
Population change from April 1, 2000 to July 1, 2005:
Births: 604| Here: | 67 per 1000 residents |
| State: | 72 per 1000 residents |
Deaths: 475
| Here: | 53 per 1000 residents |
| State: | 47 per 1000 residents |
Net international migration: +3
| Here: | +0 per 1000 residents |
| State: | +9 per 1000 residents |
Net internal migration: -497
| Here: | |
| State: |
Total withdrawal of fresh water for public supply: 0.48 millions of gallons per day (all from ground)
| Here: | 6.9 |
| State: | 6.6 |
| Here: | 5.4 |
| State: | 4.3 |
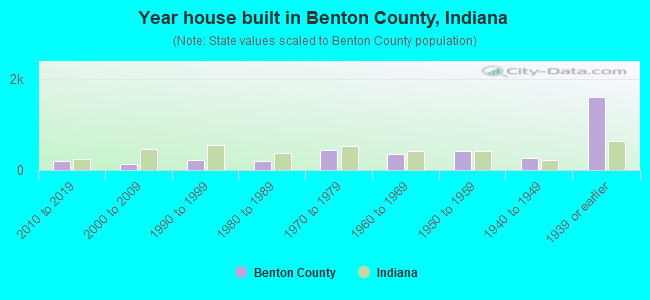
- Year house built in Benton County, Indiana
- 02020 or later
- 1912010 to 2019
- 1322000 to 2009
- 1721990 to 1999
- 2281980 to 1989
- 4511970 to 1979
- 3331960 to 1969
- 4161950 to 1959
- 2591940 to 1949
- 1,6011939 or earlier
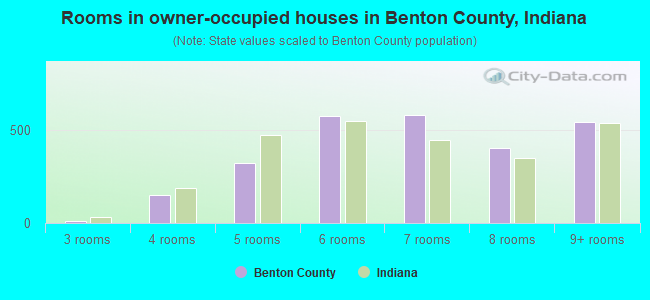
- Rooms in owner-occupied houses in Benton County, Indiana
- 01 room
- 132 rooms
- 223 rooms
- 2044 rooms
- 3085 rooms
- 6116 rooms
- 5927 rooms
- 4738 rooms
- 5569+ rooms
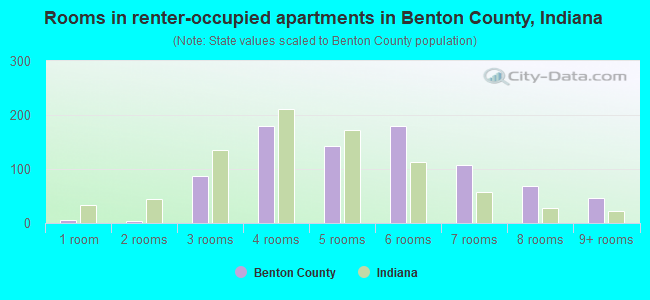
- Rooms in renter-occupied apartments in Benton County, Indiana
- 51 room
- 212 rooms
- 773 rooms
- 1834 rooms
- 895 rooms
- 1846 rooms
- 867 rooms
- 518 rooms
- 449+ rooms
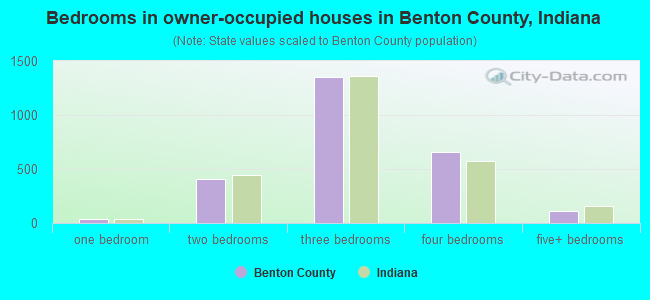
- Bedrooms in owner-occupied houses in Benton County, Indiana
- 15no bedroom
- 511 bedroom
- 4862 bedrooms
- 1,3563 bedrooms
- 7704 bedrooms
- 1025+ bedrooms
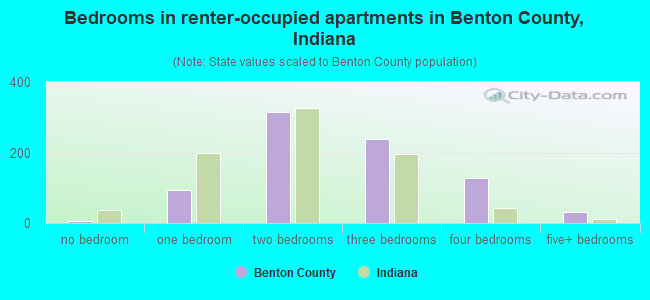
- Bedrooms in renter-occupied apartments in Benton County, Indiana
- 5no bedroom
- 1131 bedroom
- 2512 bedrooms
- 2343 bedrooms
- 1224 bedrooms
- 175+ bedrooms
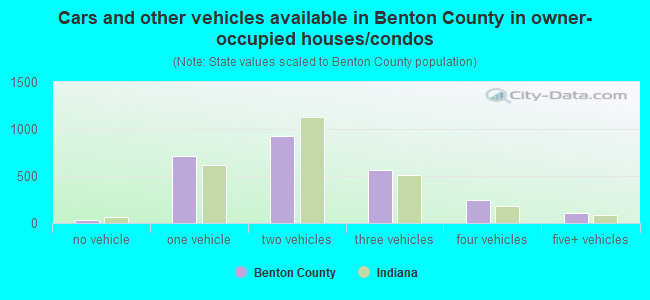
- Cars and other vehicles available in Benton County in owner-occupied houses/condos
- 44no vehicle
- 8881 vehicle
- 8452 vehicles
- 6363 vehicles
- 2704 vehicles
- 945+ vehicles
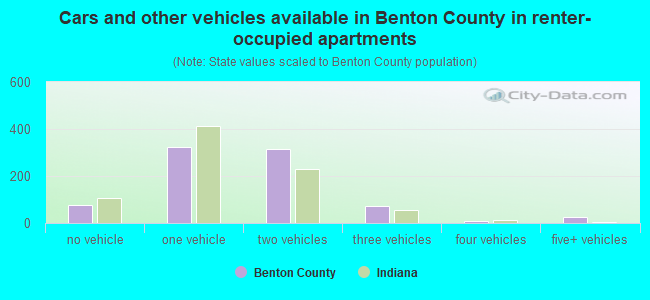
- Cars and other vehicles available in Benton County in renter-occupied apartments
- 82no vehicle
- 3121 vehicle
- 2442 vehicles
- 653 vehicles
- 54 vehicles
- 335+ vehicles
90.3% of Benton County residents lived in the same house 1 years ago.
Out of people who lived in different houses, 20% lived in this county.
Out of people who lived in different counties, 76% lived in Indiana.
| Benton County: | 90.3% |
| State average: | 87.1% |
Place of birth for U.S.-born residents:
- This state: 6,713
- Other state: 1,796
- Northeast: 91
- Midwest: 989
- South: 495
- West: 222
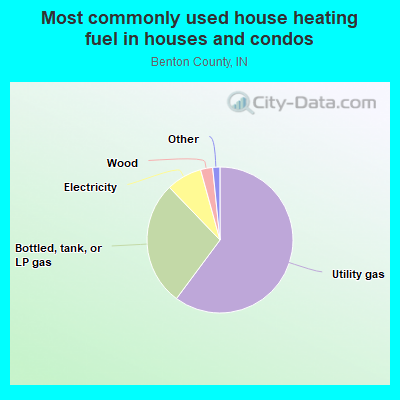
- 58.0%Utility gas
- 29.6%Bottled, tank, or LP gas
- 8.4%Electricity
- 2.4%Wood
- 0.7%Fuel oil, kerosene, etc.
- 0.6%Other fuel
- 0.4%No fuel used
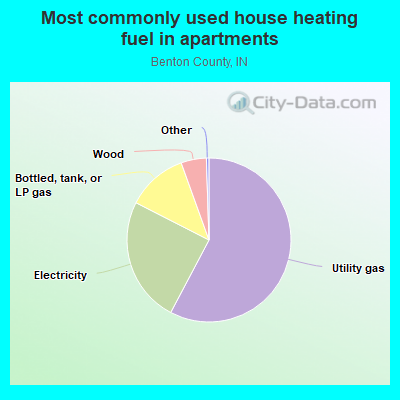
- 55.2%Utility gas
- 26.9%Electricity
- 11.7%Bottled, tank, or LP gas
- 5.9%Wood
- 0.3%Fuel oil, kerosene, etc.
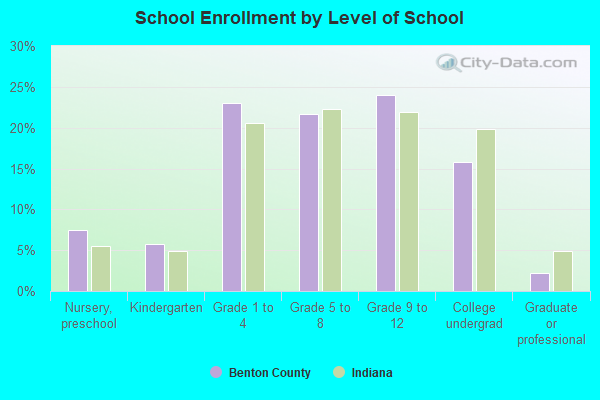
Private vs. public school enrollment:
| Here: | 9.7% |
| Indiana: | 14.9% |
| Here: | 9.0% |
| Indiana: | 11.4% |
| Here: | 27.1% |
| Indiana: | 22.3% |
Benton County government finances - Expenditure in 2017:
- Bond Funds - Cash and Securities: $2,215,000
- Charges - Sewerage: $21,000
Other: $12,000
- Construction - General - Other: $92,000
Correctional Institutions: $82,000
Regular Highways: $53,000
- Current Operations - Regular Highways: $1,791,000
Central Staff Services: $926,000
General - Other: $863,000
Police Protection: $548,000
Judicial and Legal Services: $505,000
Financial Administration: $391,000
Correctional Institutions: $387,000
Health - Other: $349,000
Corrections - Other: $228,000
Public Welfare Institutions: $195,000
Natural Resources - Other: $154,000
Solid Waste Management: $94,000
Sewerage: $17,000
- Local Intergovernmental - Highways: $81,000
- Miscellaneous - Donations From Private Sources: $25,000
Fines and Forfeits: $1,000
- Other Capital Outlay - Regular Highways: $153,000
General - Other: $127,000
Health - Other: $3,000
Police Protection: $2,000
- Other Funds - Cash and Securities: $11,696,000
- State Intergovernmental - Highways: $2,234,000
General Local Government Support: $539,000
Other: $264,000
- Tax - Property: $3,256,000
Other License: $5,000
Benton County government finances - Revenue in 2017:
- Bond Funds - Cash and Securities: $2,215,000
- Charges - Sewerage: $21,000
Other: $12,000
- Construction - General - Other: $92,000
Correctional Institutions: $82,000
Regular Highways: $53,000
- Current Operations - Regular Highways: $1,791,000
Central Staff Services: $926,000
General - Other: $863,000
Police Protection: $548,000
Judicial and Legal Services: $505,000
Financial Administration: $391,000
Correctional Institutions: $387,000
Health - Other: $349,000
Corrections - Other: $228,000
Public Welfare Institutions: $195,000
Natural Resources - Other: $154,000
Solid Waste Management: $94,000
Sewerage: $17,000
- Local Intergovernmental - Highways: $81,000
- Miscellaneous - Donations From Private Sources: $25,000
Fines and Forfeits: $1,000
- Other Capital Outlay - Regular Highways: $153,000
General - Other: $127,000
Health - Other: $3,000
Police Protection: $2,000
- Other Funds - Cash and Securities: $11,696,000
- State Intergovernmental - Highways: $2,234,000
General Local Government Support: $539,000
Other: $264,000
- Tax - Property: $3,256,000
Other License: $5,000
Benton County government finances - Debt in 2017:
- Bond Funds - Cash and Securities: $2,215,000
- Charges - Sewerage: $21,000
Other: $12,000
- Construction - General - Other: $92,000
Correctional Institutions: $82,000
Regular Highways: $53,000
- Current Operations - Regular Highways: $1,791,000
Central Staff Services: $926,000
General - Other: $863,000
Police Protection: $548,000
Judicial and Legal Services: $505,000
Financial Administration: $391,000
Correctional Institutions: $387,000
Health - Other: $349,000
Corrections - Other: $228,000
Public Welfare Institutions: $195,000
Natural Resources - Other: $154,000
Solid Waste Management: $94,000
Sewerage: $17,000
- Local Intergovernmental - Highways: $81,000
- Miscellaneous - Donations From Private Sources: $25,000
Fines and Forfeits: $1,000
- Other Capital Outlay - Regular Highways: $153,000
General - Other: $127,000
Health - Other: $3,000
Police Protection: $2,000
- Other Funds - Cash and Securities: $11,696,000
- State Intergovernmental - Highways: $2,234,000
General Local Government Support: $539,000
Other: $264,000
- Tax - Property: $3,256,000
Other License: $5,000
Benton County government finances - Cash and Securities in 2017:
- Bond Funds - Cash and Securities: $2,215,000
- Charges - Sewerage: $21,000
Other: $12,000
- Construction - General - Other: $92,000
Correctional Institutions: $82,000
Regular Highways: $53,000
- Current Operations - Regular Highways: $1,791,000
Central Staff Services: $926,000
General - Other: $863,000
Police Protection: $548,000
Judicial and Legal Services: $505,000
Financial Administration: $391,000
Correctional Institutions: $387,000
Health - Other: $349,000
Corrections - Other: $228,000
Public Welfare Institutions: $195,000
Natural Resources - Other: $154,000
Solid Waste Management: $94,000
Sewerage: $17,000
- Local Intergovernmental - Highways: $81,000
- Miscellaneous - Donations From Private Sources: $25,000
Fines and Forfeits: $1,000
- Other Capital Outlay - Regular Highways: $153,000
General - Other: $127,000
Health - Other: $3,000
Police Protection: $2,000
- Other Funds - Cash and Securities: $11,696,000
- State Intergovernmental - Highways: $2,234,000
General Local Government Support: $539,000
Other: $264,000
- Tax - Property: $3,256,000
Other License: $5,000
Supplemental Security Income (SSI) in 2006:
- Total number of recipients: 112
- Number of aged recipients: 6
- Number of blind and disabled recipients: 106
- Number of recipients under 18: 20
- Number of recipients between 18 and 64: 84
- Number of recipients older than 64: 8
- Number of recipients also receiving OASDI: 45
- Amount of payments (thousands of dollars): 45
| Most common first names in Benton County, IN among deceased individuals | ||
| Name | Count | Lived (average) |
|---|---|---|
| John | 65 | 74.3 years |
| Mary | 64 | 80.3 years |
| William | 58 | 77.1 years |
| Robert | 57 | 70.9 years |
| James | 51 | 70.2 years |
| George | 47 | 79.8 years |
| Charles | 44 | 74.4 years |
| Helen | 29 | 80.3 years |
| Margaret | 26 | 81.9 years |
| Donald | 25 | 71.7 years |
| Most common last names in Benton County, IN among deceased individuals | ||
| Last name | Count | Lived (average) |
|---|---|---|
| Smith | 51 | 77.5 years |
| Johnson | 24 | 83.0 years |
| Anderson | 21 | 77.4 years |
| Brown | 21 | 76.5 years |
| Foster | 20 | 80.4 years |
| Muller | 17 | 69.0 years |
| Williams | 17 | 70.9 years |
| Nichols | 16 | 83.5 years |
| Budreau | 14 | 77.3 years |
| Gick | 14 | 83.5 years |
| Businesses in Benton County, IN | ||||
| Name | Count | Name | Count | |
|---|---|---|---|---|
| La-Z-Boy | 1 | Subway | 1 | |
| Lane Furniture | 1 | U-Haul | 1 | |
| MasterBrand Cabinets | 2 | UPS | 1 | |
| RadioShack | 1 | |||