Benton County, Missouri (MO)
County owner-occupied free and clear houses and condos in 2010: 3,284
County owner-occupied houses and condos in 2000: 6,097
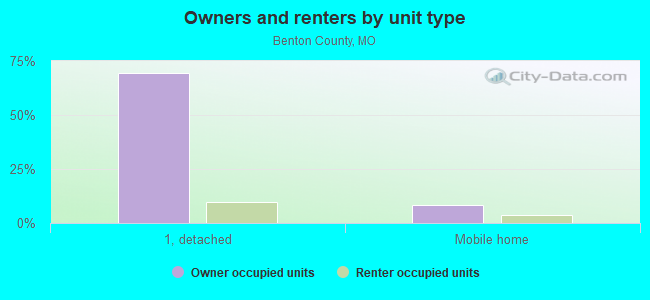
Renter-occupied apartments: 1,560 (it was 1,323 in 2000)
| % of renters here: | 18% |
| State: | 31% |
Land area: 706 sq. mi.
Water area: 47.0 sq. mi.
Population density: 28 people per square mile (low).
Industries providing employment: Educational, health and social services (27.8%), Retail trade (14.2%), Construction (13.6%), Manufacturing (11.1%).
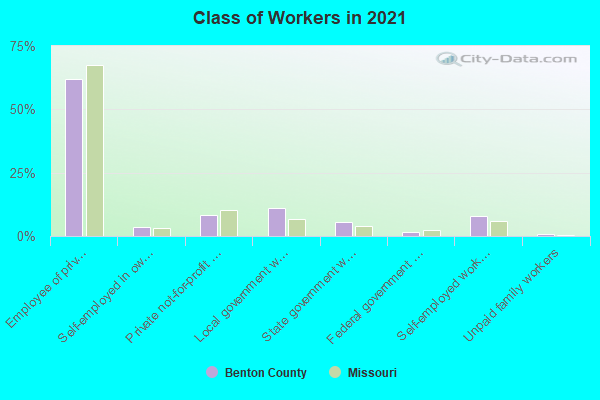
Type of workers:
- Private wage or salary: 72%
- Government: 19%
- Self-employed, not incorporated: 8%
- Unpaid family work: 1%
- OSM Map
- General Map
- Google Map
- MSN Map

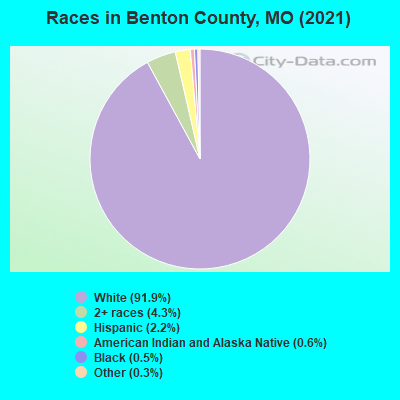
- 18,00891.5%White Non-Hispanic Alone
- 8524.3%Two or more races
- 4602.3%Hispanic or Latino
- 1280.7%Black Non-Hispanic Alone
- 1260.6%American Indian and Alaska Native alone
- 810.4%Some other race alone
- 170.09%Asian alone
- 70.04%Native Hawaiian and Other
Pacific Islander alone
| Median resident age: | 54.5 years |
| Missouri median age: | 39.1 years |
| Males: 10,024 | |
| Females: 9,667 |

 | Where in Missouri does the South begin? (507 replies) |
| Interesting Missouri facts. (1186 replies) |
| Is St. Louis a Southern city? (755 replies) |
| Where is the Golden Valley area in Missouri? (7 replies) |
| I need cities similar in demographics to Columbia,MO. (4 replies) |
| Deer Season (20 replies) |
| Benton County: | 2.0 people |
| Missouri: | 2 people |
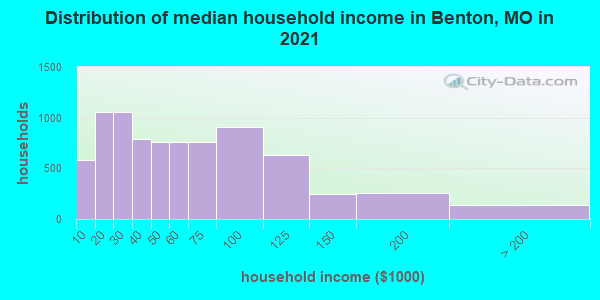
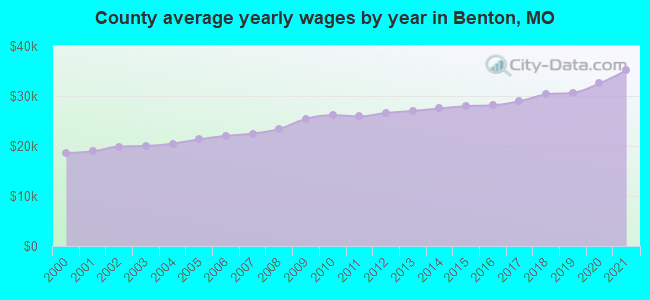
Estimated median household income in 2022: $49,383 ($26,646 in 1999)
| This county: | $49,383 |
| Missouri: | $64,811 |
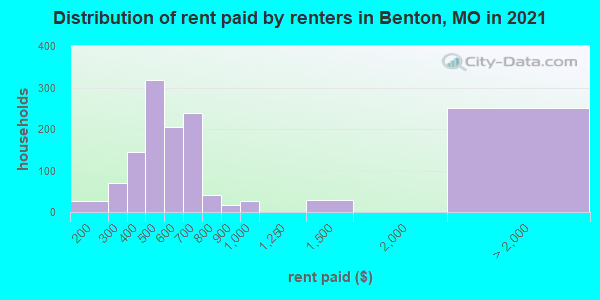
Median contract rent in 2022 for apartments: $563 (lower quartile is $458, upper quartile is $706)
| This county: | $563 |
| State: | $757 |
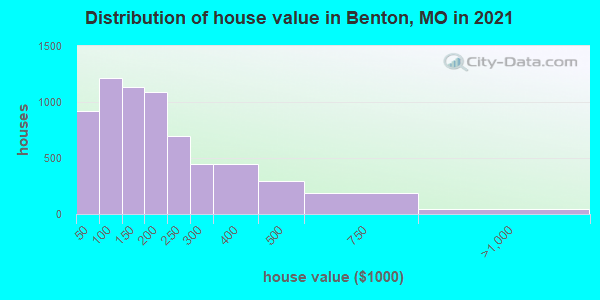
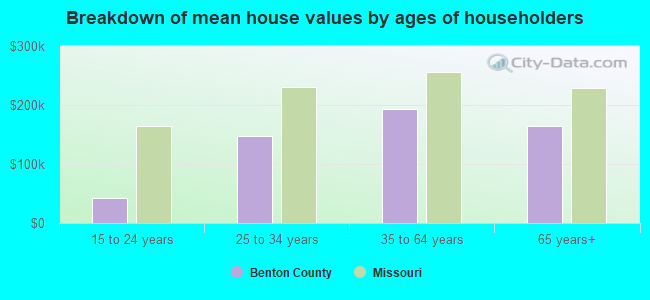
Estimated median house or condo value in 2022: $171,613 (it was $66,800 in 2000)
| Benton: | $171,613 |
| Missouri: | $221,200 |
Mean price in 2022:
Median monthly housing costs for homes and condos with a mortgage: $1,051Detached houses: $192,518
Here: $192,518 State: $278,068 In 2-unit structures: $206,632
Here: $206,632 State: $172,667 Mobile homes: $105,041
Here: $105,041 State: $95,912
Median monthly housing costs for units without a mortgage: $370
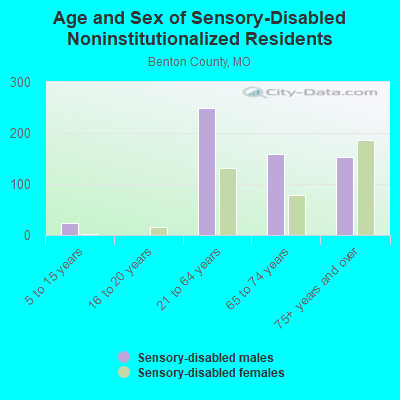
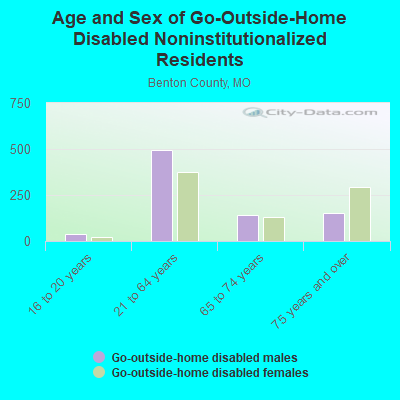
Institutionalized population: 206
Crime in 2021 (reported by the sheriff's office or county police, not the county total):
- Murders: 1
- Rapes: 2
- Robberies: 0
- Assaults: 24
- Burglaries: 47
- Thefts: 75
- Auto thefts: 33
Crime in 2020 (reported by the sheriff's office or county police, not the county total):
- Murders: 2
- Rapes: 2
- Robberies: 0
- Assaults: 32
- Burglaries: 69
- Thefts: 68
- Auto thefts: 54
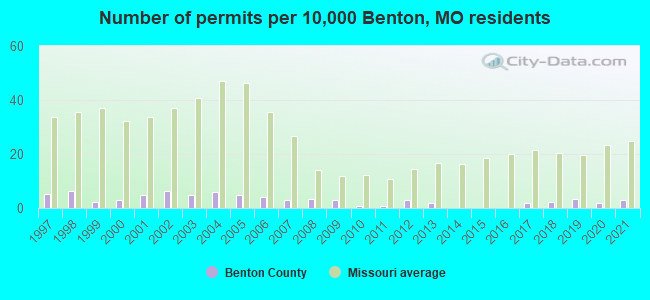
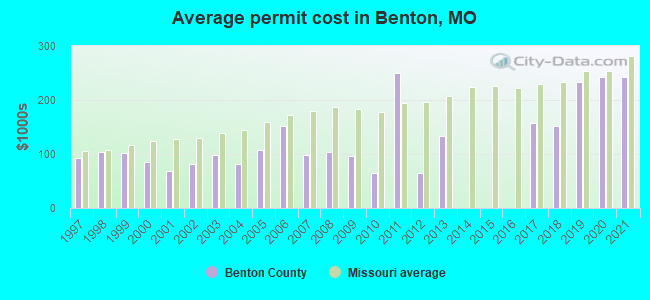
Single-family new house construction building permits:
- 2022: 2 buildings, average cost: $275,000
- 2021: 5 buildings, average cost: $243,000
- 2020: 3 buildings, average cost: $241,800
- 2019: 6 buildings, average cost: $234,400
- 2018: 4 buildings, average cost: $151,300
- 2017: 3 buildings, average cost: $156,700
- 2016: 0 buildings
- 2015: 0 buildings
- 2014: 0 buildings
- 2013: 3 buildings, average cost: $133,300
- 2012: 5 buildings, average cost: $64,000
- 2011: 1 building, cost: $250,000
- 2010: 1 building, cost: $65,000
- 2009: 5 buildings, average cost: $96,000
- 2008: 6 buildings, average cost: $102,500
- 2007: 5 buildings, average cost: $98,500
- 2006: 7 buildings, average cost: $150,700
- 2005: 8 buildings, average cost: $107,100
- 2004: 10 buildings, average cost: $80,500
- 2003: 8 buildings, average cost: $98,200
- 2002: 11 buildings, average cost: $80,500
- 2001: 8 buildings, average cost: $67,500
- 2000: 5 buildings, average cost: $84,600
- 1999: 4 buildings, average cost: $100,600
- 1998: 11 buildings, average cost: $103,200
- 1997: 9 buildings, average cost: $93,100
Median real estate property taxes paid for housing units with mortgages in 2022: $962 (0.5%)
Median real estate property taxes paid for housing units with no mortgage in 2022: $838 (0.5%)
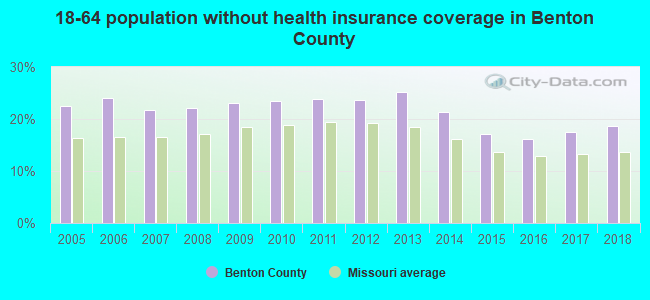
| Benton County: | 18.0% |
| Missouri: | 13.2% |
Median age of residents in 2022: 54.5 years old
(Males: 53.6 years old, Females: 55.1 years old)
(Median age for: White residents: 55.0 years old, Black residents: 18.2 years old, American Indian residents: 59.1 years old, Hispanic or Latino residents: 34.8 years old, Other race residents: 29.4 years old)
Fair market rent in 2006 for a 1-bedroom apartment in Benton County is $359 a month.
Fair market rent for a 2-bedroom apartment is $464 a month.
Fair market rent for a 3-bedroom apartment is $644 a month.
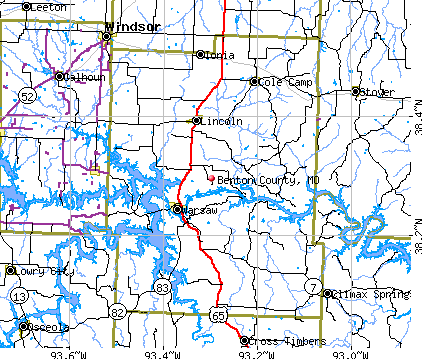
Cities in this county include: Warsaw, Cole Camp, Lincoln, Ionia.
Neighboring counties: Beaver County, Utah  , Boone County, West Virginia
  , Caroline County, Virginia , Nicholas County, West Virginia , Greenwood County, Kansas , Jefferson County, Indiana , Stafford County, Kansas .
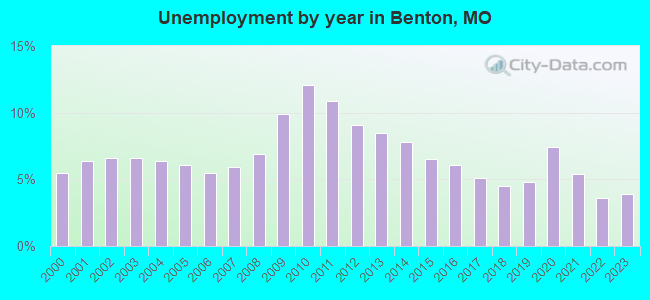
| Here: | 4.1% |
| Missouri: | 2.8% |
Current college students: 293
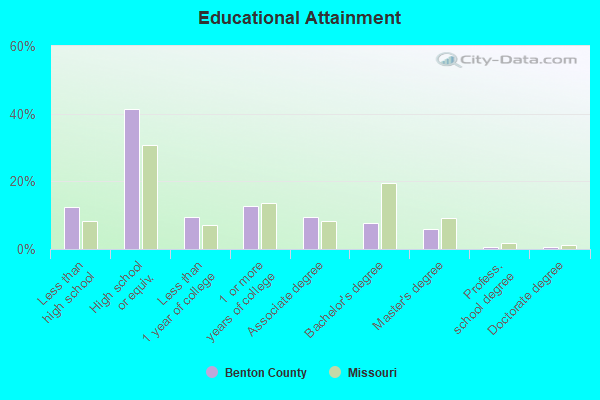
People 25 years of age or older with a high school degree or higher: 87.6%
People 25 years of age or older with a bachelor's degree or higher: 15.0%
Number of foreign born residents: 209 (43.7% naturalized citizens)
| Benton County: | 1.1% |
| Whole state: | 4.1% |
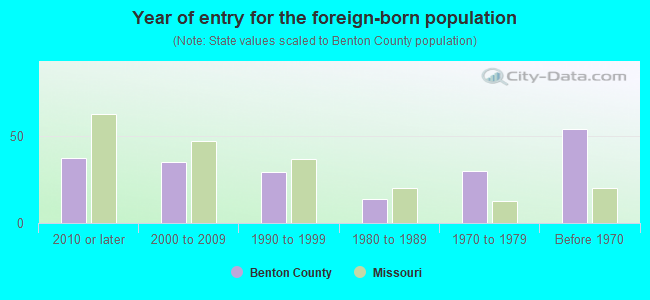
- Year of entry for the foreign-born population
- 572010 or later
- 422000 to 2009
- 291990 to 1999
- 141980 to 1989
- 301970 to 1979
- 54Before 1970
Mean travel time to work (commute): minutes
Percentage of county residents living and working in this county: 97.3%
Housing units in structures:
- One, detached: 9,629
- One, attached: 153
- Two: 78
- 3 or 4: 217
- 5 to 9: 135
- 10 to 19: 81
- 20 to 49: 64
- 50 or more: 9
- Mobile homes: 3,104
- Boats, RVs, vans, etc.: 114
Housing units in Benton County with a mortgage: 3,057 (148 second mortgage, 4 home equity loan, 106 both second mortgage and home equity loan)
Houses without a mortgage: 91
| Here: | 3.2% with mortgage |
| State: | 98.0% with mortgage |
Religion statistics for Benton County
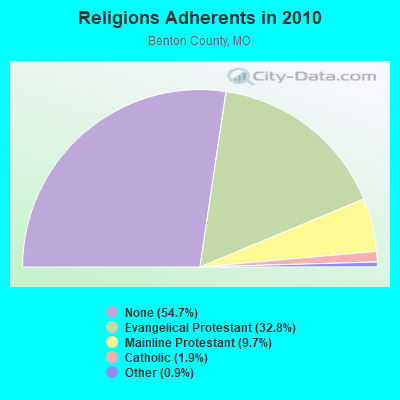
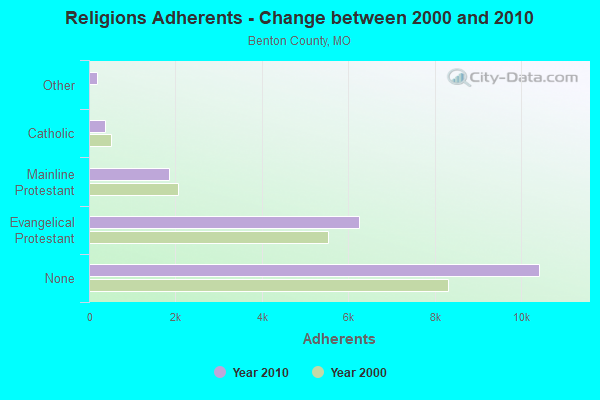
| Religion | Adherents | Congregations |
|---|---|---|
| Evangelical Protestant | 6,253 | 30 |
| Mainline Protestant | 1,842 | 8 |
| Catholic | 360 | 2 |
| Other | 179 | 3 |
| None | 10,422 | - |
Source: Clifford Grammich, Kirk Hadaway, Richard Houseal, Dale E.Jones, Alexei Krindatch, Richie Stanley and Richard H.Taylor. 2012. 2010 U.S.Religion Census: Religious Congregations & Membership Study. Association of Statisticians of American Religious Bodies. Jones, Dale E., et al. 2002. Congregations and Membership in the United States 2000. Nashville, TN: Glenmary Research Center.
Food Environment Statistics:
| Benton County: | 2.17 / 10,000 pop. |
| State: | 1.88 / 10,000 pop. |
| Benton County: | 5.97 / 10,000 pop. |
| Missouri: | 4.34 / 10,000 pop. |
| This county: | 18.44 / 10,000 pop. |
| State: | 7.37 / 10,000 pop. |
| Benton County: | 10.1% |
| Missouri: | 8.8% |
| Benton County: | 29.4% |
| State: | 29.6% |
| Here: | 11.8% |
| State: | 13.5% |
Agriculture in Benton County:
Average size of farms: 309 acresAverage value of agricultural products sold per farm: $37,196
Average value of crops sold per acre for harvested cropland: $77.07
The value of nursery, greenhouse, floriculture, and sod as a percentage of the total market value of agricultural products sold: 0.19%
The value of livestock, poultry, and their products as a percentage of the total market value of agricultural products sold: 80.98%
Average total farm production expenses per farm: $35,665
Harvested cropland as a percentage of land in farms: 29.76%
Average market value of all machinery and equipment per farm: $43,377
The percentage of farms operated by a family or individual: 95.23%
Average age of principal farm operators: 56 years
Average number of cattle and calves per 100 acres of all land in farms: 17.34
Milk cows as a percentage of all cattle and calves: 2.87%
Corn for grain: 8700 harvested acres
All wheat for grain: 6484 harvested acres
Soybeans for beans: 18881 harvested acres
Land in orchards: 30 acres
Earthquake activity:
Benton County-area historical earthquake activity is significantly above Missouri state average. It is 491% greater than the overall U.S. average.On 9/3/2016 at 12:02:44, a magnitude 5.8 (5.8 MW, Depth: 3.5 mi, Class: Moderate, Intensity: VI - VII) earthquake occurred 237.7 miles away from Benton County center
On 11/6/2011 at 03:53:10, a magnitude 5.7 (5.7 MW, Depth: 3.2 mi) earthquake occurred 270.6 miles away from the county center
On 4/18/2008 at 09:36:59, a magnitude 5.4 (5.1 MB, 4.8 MS, 5.4 MW, 5.2 MW) earthquake occurred 293.7 miles away from the county center
On 9/26/1990 at 13:18:51, a magnitude 5.0 (4.7 MB, 4.8 LG, 5.0 LG, Depth: 7.7 mi) earthquake occurred 220.2 miles away from the county center
On 5/4/1991 at 01:18:54, a magnitude 5.0 (4.4 MB, 4.6 LG, 5.0 LG, Depth: 3.1 mi) earthquake occurred 225.3 miles away from Benton County center
On 3/25/1976 at 00:41:20, a magnitude 5.0 (4.9 MB, 5.0 LG) earthquake occurred 246.5 miles away from the county center
Magnitude types: regional Lg-wave magnitude (LG), body-wave magnitude (MB), surface-wave magnitude (MS), moment magnitude (MW)
Most recent natural disasters:
- Missouri Covid-19 Pandemic, Incident Period: January 20, 2020, FEMA Id: 4490, Natural disaster type: Other
- Missouri Severe Storms, Tornadoes, And Flooding, Incident Period: April 29, 2019, FEMA Id: 4451, Natural disaster type: Storm, Tornado, Flood
- Missouri Severe Storms, Tornadoes, Straight-line Winds, and Flooding, Incident Period: May 15, 2015 to July 27, 2015, Major Disaster (Presidential) Declared DR-4238: August 07, 2015, FEMA Id: 4238, Natural disaster type: Storm, Tornado, Flood, Wind
- Missouri Severe Winter Storm and Snowstorm, Incident Period: January 31, 2011 to February 05, 2011, Major Disaster (Presidential) Declared DR-1961: March 23, 2011, FEMA Id: 1961, Natural disaster type: Snowstorm, Winter Storm
- Missouri Severe Winter Storm, Incident Period: January 31, 2011 to February 05, 2011, Emergency Declared EM-3317: February 03, 2011, FEMA Id: 3317, Natural disaster type: Winter Storm
- Missouri Severe Winter Storm, Incident Period: January 26, 2009 to January 28, 2009, Emergency Declared EM-3303: January 30, 2009, FEMA Id: 3303, Natural disaster type: Winter Storm
- Missouri Severe Winter Storms, Incident Period: December 08, 2007 to December 15, 2007, Emergency Declared EM-3281: December 12, 2007, FEMA Id: 3281, Natural disaster type: Winter Storm
- Missouri Severe Winter Storms, Incident Period: December 06, 2007 to December 15, 2007, Major Disaster (Presidential) Declared DR-1736: December 27, 2007, FEMA Id: 1736, Natural disaster type: Winter Storm
- Missouri Severe Winter Storms and Flooding, Incident Period: January 12, 2007 to January 22, 2007, Major Disaster (Presidential) Declared DR-1676: January 15, 2007, FEMA Id: 1676, Natural disaster type: Winter Storm, Flood
- Missouri Severe Storms, Tornadoes, and Flooding, Incident Period: March 08, 2006 to March 13, 2006, Major Disaster (Presidential) Declared DR-1631: March 16, 2006, FEMA Id: 1631, Natural disaster type: Storm, Tornado, Flood
- 9 other natural disasters have been reported since 1953.
The number of natural disasters in Benton County (19) is greater than the US average (15).
Major Disasters (Presidential) Declared: 12
Emergencies Declared: 5
Causes of natural disasters: Floods: 10, Storms: 8, Tornadoes: 7, Winter Storms: 6, Drought: 1, Heavy Rain: 1, Hurricane: 1, Ice Storm: 1, Snowstorm: 1, Wind: 1, Other: 1 (Note: some incidents may be assigned to more than one category).
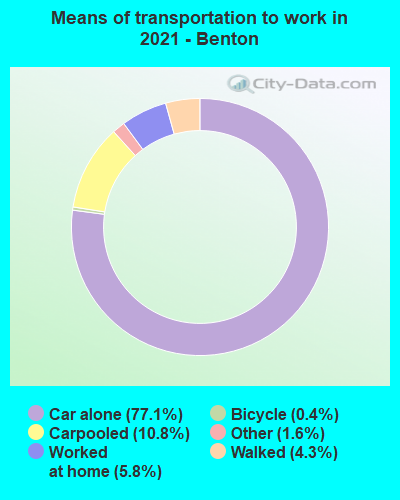
Means of transportation to work:
- Drove a car alone: 3,604 (76.9%)
- Carpooled: 427 (9.1%)
- Bus: 3 (0.1%)
- Taxicab, motorcycle, or other means: 56 (1.2%)
- Bicycle: 11 (0.2%)
- Walked: 146 (3.1%)
- Worked at home: 382 (8.2%)
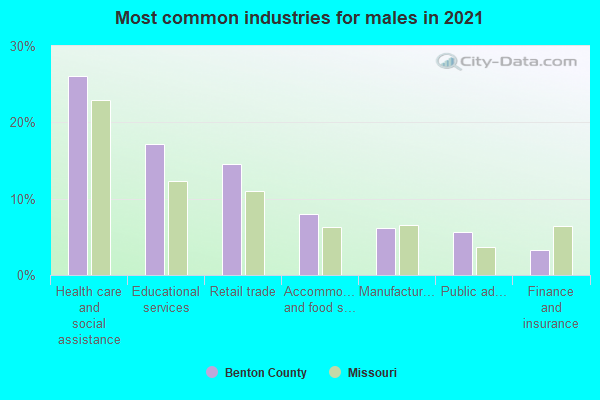
- Health care and social assistance (26%)
- Educational services (17%)
- Retail trade (14%)
- Accommodation and food services (6%)
- Manufacturing (6%)
- Public administration (5%)
- Real estate and rental and leasing (4%)
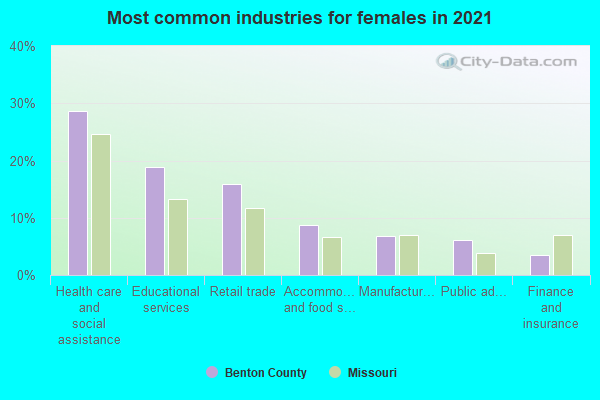
- Health care and social assistance (28%)
- Educational services (19%)
- Retail trade (16%)
- Accommodation and food services (7%)
- Manufacturing (7%)
- Public administration (6%)
- Real estate and rental and leasing (4%)
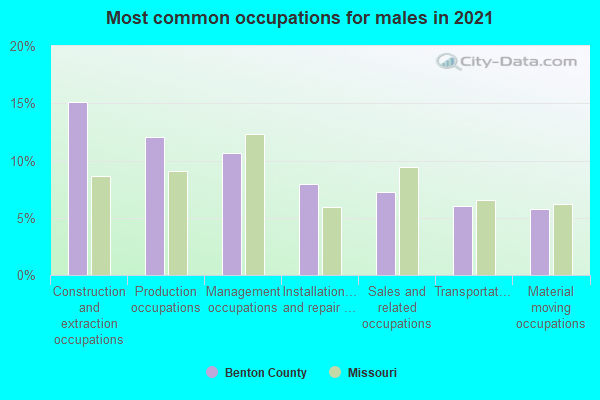
- Construction and extraction occupations (17%)
- Management occupations (11%)
- Installation, maintenance, and repair occupations (11%)
- Production occupations (11%)
- Sales and related occupations (7%)
- Transportation occupations (6%)
- Material moving occupations (6%)
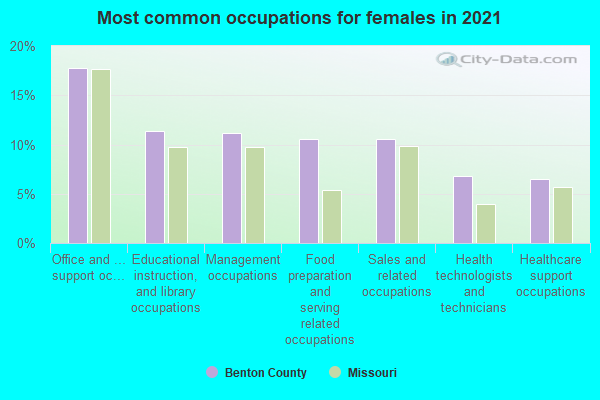
- Office and administrative support occupations (18%)
- Sales and related occupations (11%)
- Food preparation and serving related occupations (10%)
- Educational instruction, and library occupations (10%)
- Healthcare support occupations (9%)
- Management occupations (8%)
- Health diagnosing and treating practitioners and other technical occupations (6%)
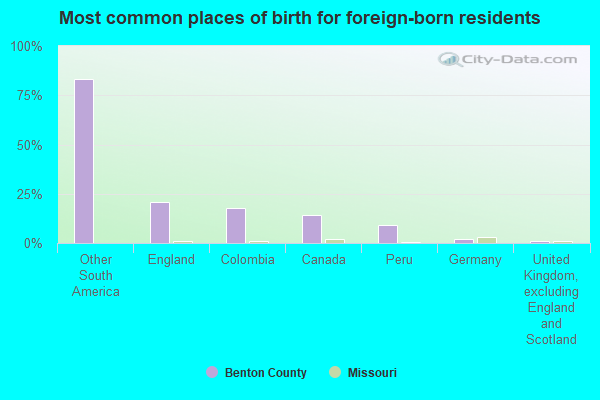
- England (24%)
- Other South America (22%)
- Canada (17%)
- Colombia (11%)
- Philippines (9%)
- Mexico (9%)
- Peru (5%)
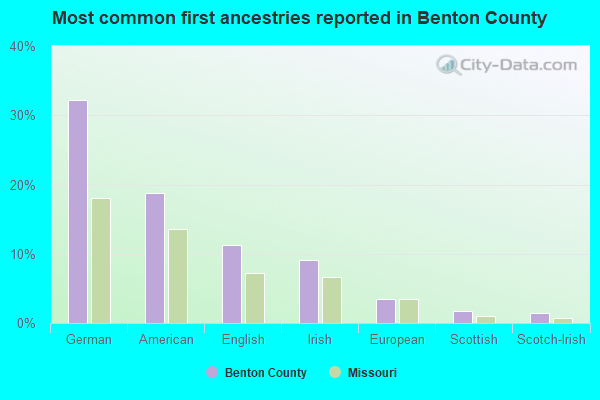
- German (28%)
- American (20%)
- English (10%)
- Irish (9%)
- European (4%)
- Scottish (2%)
- Scotch-Irish (2%)
People in group quarters in Benton County, Missouri in 2010:
- 184 people in nursing facilities/skilled-nursing facilities
- 22 people in group homes intended for adults
- 18 people in local jails and other municipal confinement facilities
- 10 people in residential treatment centers for adults
- 6 people in workers' group living quarters and job corps centers
- 4 people in group homes for juveniles (non-correctional)
People in group quarters in Benton County, Missouri in 2000:
- 179 people in nursing homes
- 34 people in other noninstitutional group quarters
- 22 people in other nonhousehold living situations
- 13 people in local jails and other confinement facilities (including police lockups)
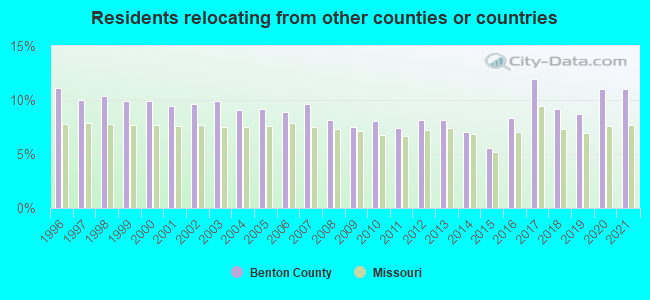
11.04% of this county's 2021 resident taxpayers lived in other counties in 2020 ($54,069 average adjusted gross income)
| Here: | 11.04% |
| Missouri average: | 7.67% |
10 or fewer of this county's residents moved from foreign countries.
8.07% relocated from other counties in Missouri ($38,441 average AGI)
2.97% relocated from other states ($15,628 average AGI)
Benton County: 2.97% Missouri average: 3.04%
Top counties from which taxpayers relocated into this county between 2020 and 2021:
| from Jackson County, MO | |
| from Pettis County, MO | |
| from Cass County, MO | |
| from Clay County, MO | |
| from Henry County, MO | |
| from Johnson County, MO |
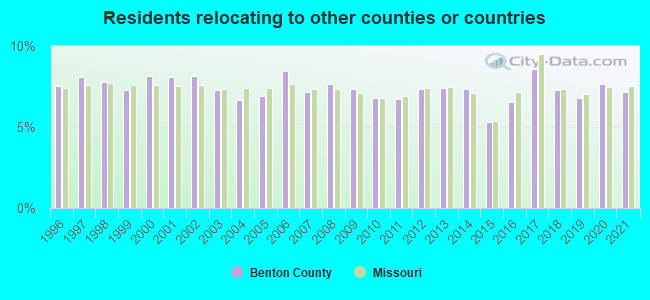
7.14% of this county's 2020 resident taxpayers moved to other counties in 2021 ($40,329 average adjusted gross income)
| Here: | 7.14% |
| Missouri average: | 7.51% |
10 or fewer of this county's residents moved to foreign countries.
5.33% relocated to other counties in Missouri ($30,404 average AGI)
1.81% relocated to other states ($9,924 average AGI)
Benton County: 1.81% Missouri average: 2.88%
Top counties to which taxpayers relocated from this county between 2020 and 2021:
| to Pettis County, MO | |
| to Jackson County, MO | |
| to Henry County, MO |
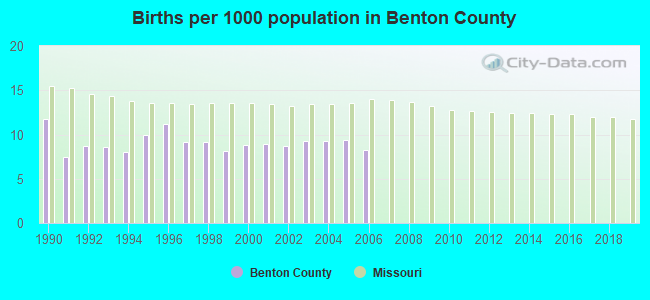
Births per 1000 population from 1990 to 1999: 9.2
Births per 1000 population from 2000 to 2006: 8.9
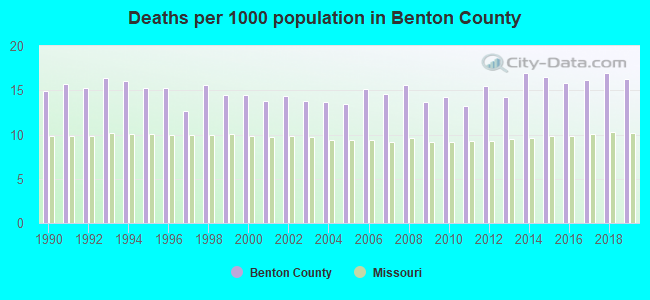
Deaths per 1000 population from 1990 to 1999: 15.2
Deaths per 1000 population from 2000 to 2009: 14.2
Deaths per 1000 population from 2010 to 2020: 15.9
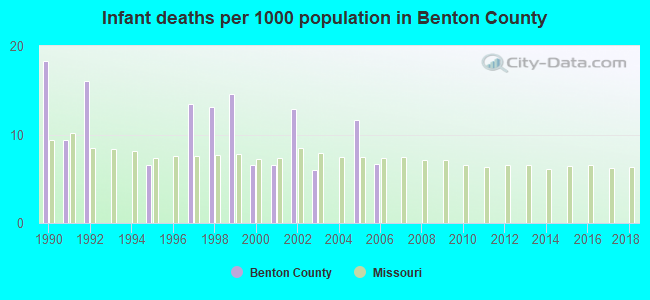
Infant deaths per 1000 live births from 1990 to 1999: 9.1
Infant deaths per 1000 live births from 2000 to 2006: 7.2
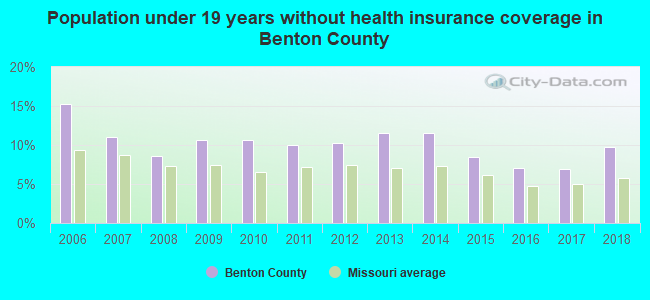
Persons under 19 years old without health insurance coverage in 2018: 9.7%
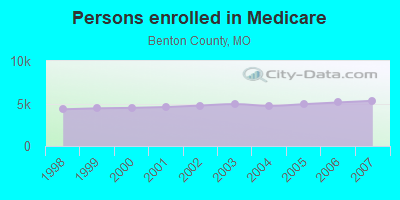
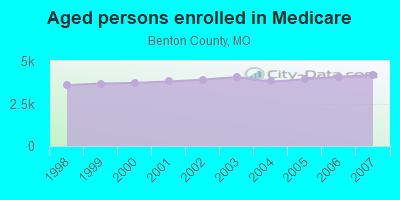
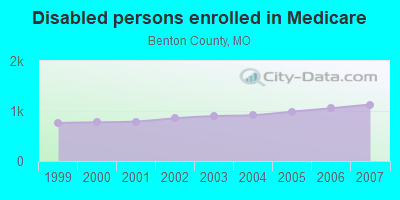
Persons enrolled in hospital insurance and/or supplemental medical insurance (Medicare) in July 1, 2007: 5,318 (4,188 aged, 1,130 disabled)
Children under 18 without health insurance coverage in 2007: 359 (10%)
Most common underlying causes of death in Benton County, Missouri in 1999 - 2019:
- Bronchus or lung, unspecified - Malignant neoplasms (548)
- Acute myocardial infarction, unspecified (491)
- Chronic obstructive pulmonary disease, unspecified (349)
- Atherosclerotic heart disease (233)
- Stroke, not specified as haemorrhage or infarction (136)
- Alzheimer disease, unspecified (108)
- Congestive heart failure (55)
- Unspecified dementia (32)
- Colon, unspecified - Malignant neoplasms (11)
- Pancreas, unspecified - Malignant neoplasms (11)
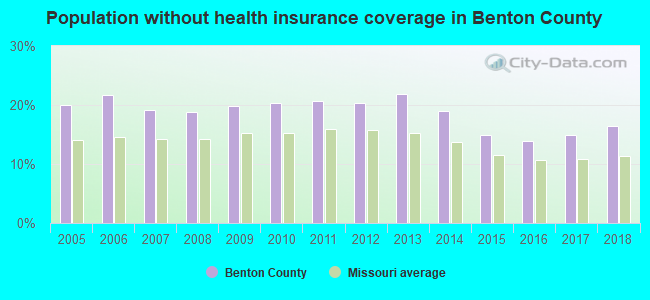
Population without health insurance coverage in 2000: 16%
Children under 18 without health insurance coverage in 2000: 14%
Medical specialist MDs per 100,000 population in 2005: 1,368
Dentists per 100,000 population in 1998: 5
Total births per 100,000 population, July 2005 - July 2006 : 18
Total deaths per 100,000 population, July 2005 - July 2006: 37
Limited-service eating places per 100,000 population in 2005 : 5
Suicides per 1,000,000 population from 2000 to 2006: 184.5. This is more than state average.
Household type by relationship:
Households: 19,691- Male householders: 4,166 (1,428 living alone), Female householders: 4,186 (1,257 living alone)
4,457 spouses (4,449 opposite-sex spouses), 387 unmarried partners, (372 opposite-sex unmarried partners), 4,306 children (3,802 natural, 163 adopted, 336 stepchildren), 436 grandchildren, 263 brothers or sisters, 214 parents, 0 foster children, 450 other relatives, 557 non-relatives
- In group quarters: 268
Size of family households: 3,434 2-persons, 855 3-persons, 577 4-persons, 256 5-persons, 82 6-persons, 138 7-or-more-persons.
Size of nonfamily households: 2,681 1-person, 320 2-persons, 20 3-persons.
2,179 married couples with children.
805 single-parent households (205 men, 600 women).
98.0% of residents of Benton speak English at home.
0.6% of residents speak Spanish at home (84% speak English very well, 16% speak English not well).
2.0% of residents speak other Indo-European language at home (92% speak English very well, 6% speak English well, 1% speak English not well).
0.1% of residents speak Asian or Pacific Island language at home (29% speak English very well, 71% speak English well).
In fiscal year 2004:
Federal Government expenditure: $132,846,000 ($7,173 per capita)
Department of Defense expenditure: $7,350,000
Federal direct payments to individuals for retirement and disability: $76,088,000
Federal other direct payments to individuals: $30,568,000
Federal direct payments not to individuals: $1,639,000
Federal grants: $18,151,000
Federal procurement contracts: $1,821,000 ($1,159,000 Department of Defense)
Federal salaries and wages: $4,578,000 ($1,684,000 Department of Defense)
Federal Government direct loans: $2,839,000
Federal guaranteed/insured loans: $6,727,000
Federal Government insurance: $4,367,000
Population change from April 1, 2000 to July 1, 2005:
Births: 826| Here: | 44 per 1000 residents |
| State: | 69 per 1000 residents |
Deaths: 1,299
| Here: | 69 per 1000 residents |
| State: | 49 per 1000 residents |
Net international migration: -1
| Here: | |
| State: |
Net internal migration: +2,178
| Here: | +116 per 1000 residents |
| State: | +5 per 1000 residents |
Total withdrawal of fresh water for public supply: 0.64 millions of gallons per day (all from ground)
| Here: | 5.8 |
| State: | 6.4 |
| Here: | 4.7 |
| State: | 4.4 |
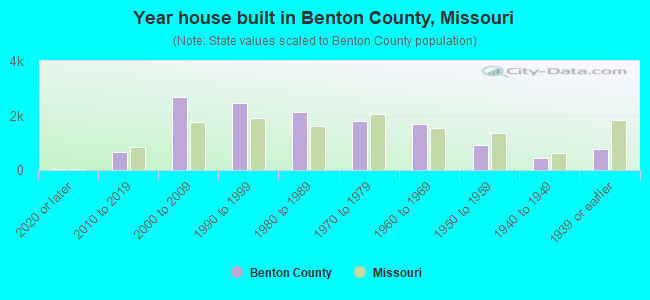
- Year house built in Benton County, Missouri
- 702020 or later
- 9922010 to 2019
- 2,4212000 to 2009
- 2,2741990 to 1999
- 2,2071980 to 1989
- 1,7881970 to 1979
- 1,6911960 to 1969
- 1,0031950 to 1959
- 3571940 to 1949
- 7591939 or earlier
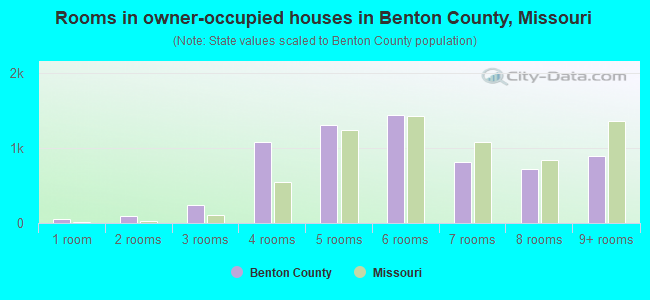
- Rooms in owner-occupied houses in Benton County, Missouri
- 811 room
- 1282 rooms
- 3403 rooms
- 1,0274 rooms
- 1,3725 rooms
- 1,4596 rooms
- 9457 rooms
- 6748 rooms
- 9279+ rooms
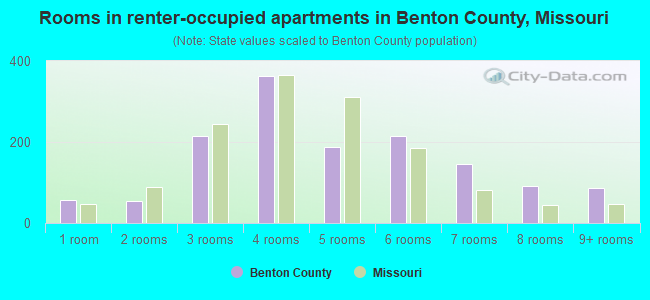
- Rooms in renter-occupied apartments in Benton County, Missouri
- 551 room
- 502 rooms
- 2423 rooms
- 3274 rooms
- 2415 rooms
- 1696 rooms
- 1757 rooms
- 1068 rooms
- 1079+ rooms
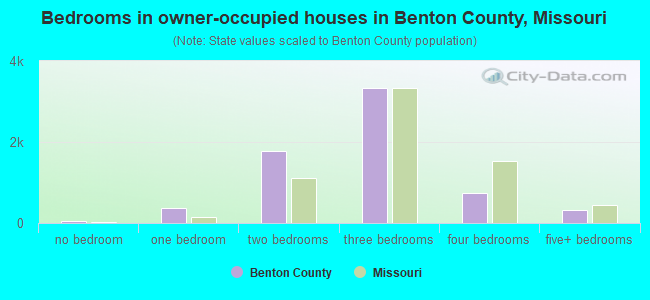
- Bedrooms in owner-occupied houses in Benton County, Missouri
- 97no bedroom
- 4881 bedroom
- 1,8872 bedrooms
- 3,3013 bedrooms
- 8784 bedrooms
- 2795+ bedrooms
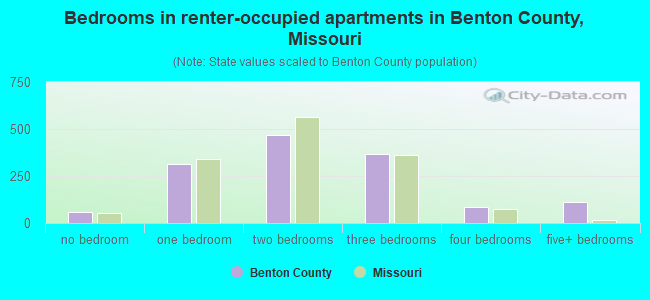
- Bedrooms in renter-occupied apartments in Benton County, Missouri
- 54no bedroom
- 3311 bedroom
- 5012 bedrooms
- 3393 bedrooms
- 894 bedrooms
- 1255+ bedrooms
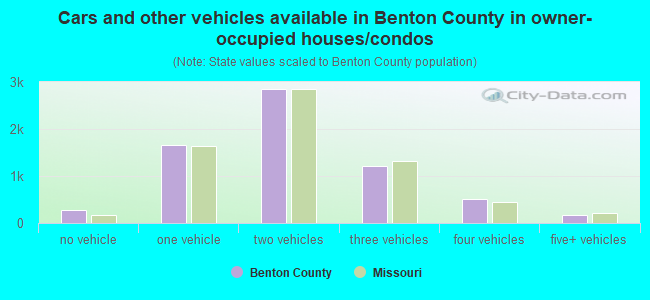
- Cars and other vehicles available in Benton County in owner-occupied houses/condos
- 304no vehicle
- 1,6891 vehicle
- 2,8412 vehicles
- 1,3383 vehicles
- 5384 vehicles
- 2045+ vehicles
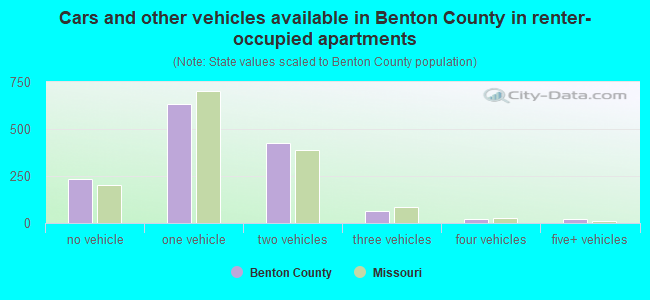
- Cars and other vehicles available in Benton County in renter-occupied apartments
- 231no vehicle
- 5871 vehicle
- 5102 vehicles
- 863 vehicles
- 104 vehicles
- 275+ vehicles
90.8% of Benton County residents lived in the same house 1 years ago.
Out of people who lived in different houses, 17% lived in this county.
Out of people who lived in different counties, 65% lived in Missouri.
| Benton County: | 90.8% |
| State average: | 87.1% |
Place of birth for U.S.-born residents:
- This state: 12,582
- Other state: 6,793
- Northeast: 257
- Midwest: 3,225
- South: 1,490
- West: 1,845
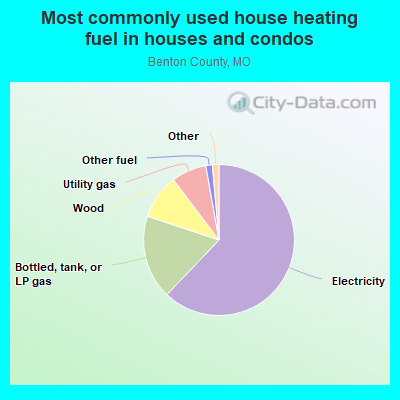
- 63.6%Electricity
- 18.1%Bottled, tank, or LP gas
- 9.7%Wood
- 6.4%Utility gas
- 1.2%Other fuel
- 0.7%Fuel oil, kerosene, etc.
- 0.1%Coal or coke
- 0.1%No fuel used
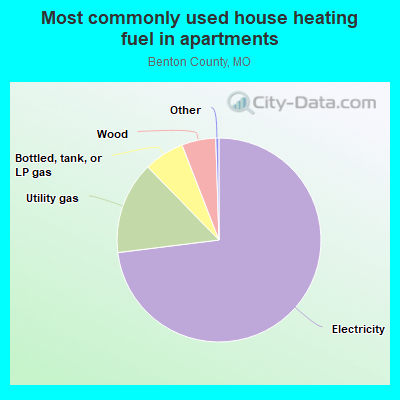
- 75.0%Electricity
- 12.9%Utility gas
- 6.6%Bottled, tank, or LP gas
- 4.5%Wood
- 0.6%Other fuel
- 0.3%No fuel used
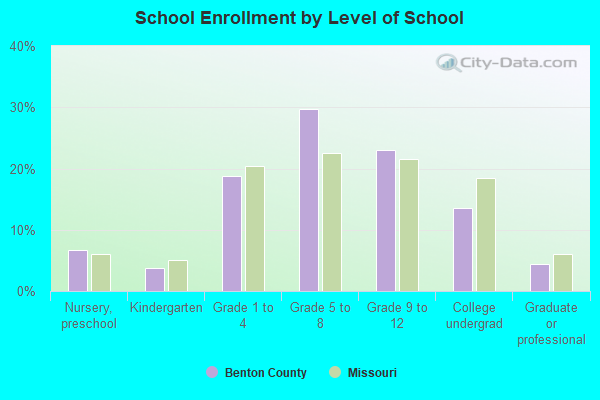
Private vs. public school enrollment:
| Here: | 29.5% |
| Missouri: | 15.4% |
| Here: | 6.7% |
| Missouri: | 13.9% |
| Here: | 5.1% |
| Missouri: | 22.6% |
Benton County government finances - Expenditure in 2017:
- Construction - Regular Highways: $1,021,000
- Current Operations - Police Protection: $795,000
Financial Administration: $488,000
Regular Highways: $462,000
Correctional Institutions: $452,000
Central Staff Services: $376,000
Judicial and Legal Services: $366,000
General Public Buildings: $55,000
- Federal Intergovernmental - General Local Government Support: $149,000
- Miscellaneous - General Revenue - Other: $2,340,000
Interest Earnings: $1,000
- Other Capital Outlay - Regular Highways: $69,000
- Other Funds - Cash and Securities: $245,000
- State Intergovernmental - Highways: $304,000
Other: $3,000
- Tax - General Sales and Gross Receipts: $2,871,000
Property: $850,000
Motor Vehicle License: $82,000
Alcoholic Beverage License: $19,000
Occupation and Business License - Other: $1,000
- Total Salaries and Wages: $2,527,000
Benton County government finances - Revenue in 2017:
- Construction - Regular Highways: $1,021,000
- Current Operations - Police Protection: $795,000
Financial Administration: $488,000
Regular Highways: $462,000
Correctional Institutions: $452,000
Central Staff Services: $376,000
Judicial and Legal Services: $366,000
General Public Buildings: $55,000
- Federal Intergovernmental - General Local Government Support: $149,000
- Miscellaneous - General Revenue - Other: $2,340,000
Interest Earnings: $1,000
- Other Capital Outlay - Regular Highways: $69,000
- Other Funds - Cash and Securities: $245,000
- State Intergovernmental - Highways: $304,000
Other: $3,000
- Tax - General Sales and Gross Receipts: $2,871,000
Property: $850,000
Motor Vehicle License: $82,000
Alcoholic Beverage License: $19,000
Occupation and Business License - Other: $1,000
- Total Salaries and Wages: $2,527,000
Benton County government finances - Debt in 2017:
- Construction - Regular Highways: $1,021,000
- Current Operations - Police Protection: $795,000
Financial Administration: $488,000
Regular Highways: $462,000
Correctional Institutions: $452,000
Central Staff Services: $376,000
Judicial and Legal Services: $366,000
General Public Buildings: $55,000
- Federal Intergovernmental - General Local Government Support: $149,000
- Miscellaneous - General Revenue - Other: $2,340,000
Interest Earnings: $1,000
- Other Capital Outlay - Regular Highways: $69,000
- Other Funds - Cash and Securities: $245,000
- State Intergovernmental - Highways: $304,000
Other: $3,000
- Tax - General Sales and Gross Receipts: $2,871,000
Property: $850,000
Motor Vehicle License: $82,000
Alcoholic Beverage License: $19,000
Occupation and Business License - Other: $1,000
- Total Salaries and Wages: $2,527,000
Benton County government finances - Cash and Securities in 2017:
- Construction - Regular Highways: $1,021,000
- Current Operations - Police Protection: $795,000
Financial Administration: $488,000
Regular Highways: $462,000
Correctional Institutions: $452,000
Central Staff Services: $376,000
Judicial and Legal Services: $366,000
General Public Buildings: $55,000
- Federal Intergovernmental - General Local Government Support: $149,000
- Miscellaneous - General Revenue - Other: $2,340,000
Interest Earnings: $1,000
- Other Capital Outlay - Regular Highways: $69,000
- Other Funds - Cash and Securities: $245,000
- State Intergovernmental - Highways: $304,000
Other: $3,000
- Tax - General Sales and Gross Receipts: $2,871,000
Property: $850,000
Motor Vehicle License: $82,000
Alcoholic Beverage License: $19,000
Occupation and Business License - Other: $1,000
- Total Salaries and Wages: $2,527,000
Supplemental Security Income (SSI) in 2006:
- Total number of recipients: 473
- Number of aged recipients: 43
- Number of blind and disabled recipients: 430
- Number of recipients under 18: 59
- Number of recipients between 18 and 64: 334
- Number of recipients older than 64: 80
- Number of recipients also receiving OASDI: 206
- Amount of payments (thousands of dollars): 243
| Most common first names in Benton County, MO among deceased individuals | ||
| Name | Count | Lived (average) |
|---|---|---|
| John | 158 | 76.9 years |
| William | 151 | 76.7 years |
| Charles | 108 | 72.6 years |
| James | 103 | 72.2 years |
| Mary | 101 | 79.5 years |
| Robert | 98 | 70.4 years |
| George | 83 | 76.0 years |
| Helen | 61 | 78.9 years |
| Dorothy | 58 | 79.8 years |
| Ruth | 47 | 79.0 years |
| Most common last names in Benton County, MO among deceased individuals | ||
| Last name | Count | Lived (average) |
|---|---|---|
| Smith | 93 | 75.0 years |
| Davis | 51 | 79.2 years |
| Johnson | 49 | 73.3 years |
| Harms | 43 | 81.5 years |
| Williams | 42 | 78.2 years |
| Meyer | 40 | 81.3 years |
| Brown | 35 | 73.7 years |
| Miller | 34 | 73.7 years |
| Balke | 33 | 79.3 years |
| Eckhoff | 33 | 81.4 years |
| Businesses in Benton County, MO | ||||
| Name | Count | Name | Count | |
|---|---|---|---|---|
| AT&T | 1 | SONIC Drive-In | 1 | |
| FedEx | 1 | Subway | 1 | |
| Ford | 1 | T-Mobile | 1 | |
| H&R Block | 1 | U-Haul | 2 | |
| La-Z-Boy | 1 | UPS | 1 | |
| McDonald's | 1 | Walmart | 1 | |