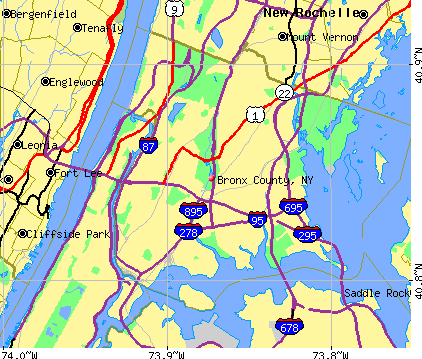
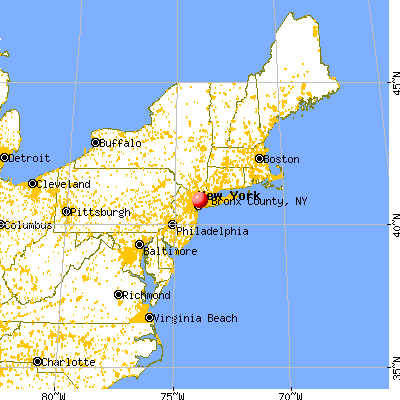
Bronx County, New York (NY)
County owner-occupied free and clear houses and condos in 2010: 31,796
County owner-occupied houses and condos in 2000: 90,522
Renter-occupied apartments: 390,348 (it was 372,690 in 2000)
| % of renters here: | 80% |
| State: | 47% |
Land area: 42 sq. mi.
Water area: 15.4 sq. mi.
Population density: 32835 people per square mile (very high).
Industries providing employment: Educational, health and social services (36.1%), Retail trade (10.9%).
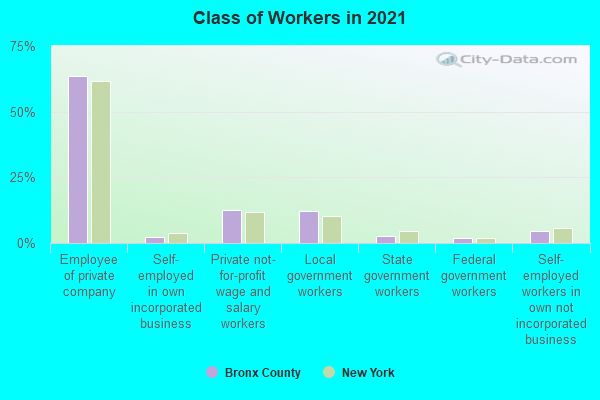
Type of workers:
- Private wage or salary: 78%
- Government: 16%
- Self-employed, not incorporated: 5%
- Unpaid family work: 0%
- OSM Map
- General Map
- Google Map
- MSN Map

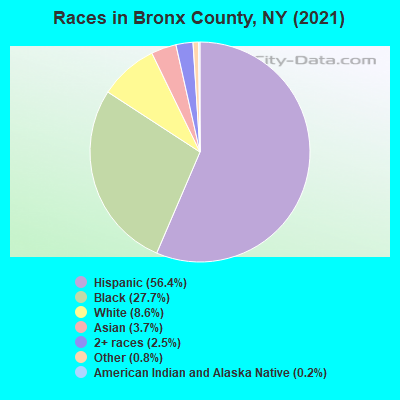
- 780,81856.6%Hispanic or Latino
- 388,63928.2%Black Non-Hispanic Alone
- 113,9018.3%White Non-Hispanic Alone
- 53,9873.9%Asian alone
- 24,9981.8%Two or more races
- 14,2941.0%Some other race alone
- 3,1290.2%American Indian and Alaska Native alone
- 1800.01%Native Hawaiian and Other
Pacific Islander alone
| Median resident age: | 35.8 years |
| New York median age: | 40.0 years |
| Males: 653,279 | |
| Females: 726,667 |


| Bronx County: | 2.0 people |
| New York: | 3 people |
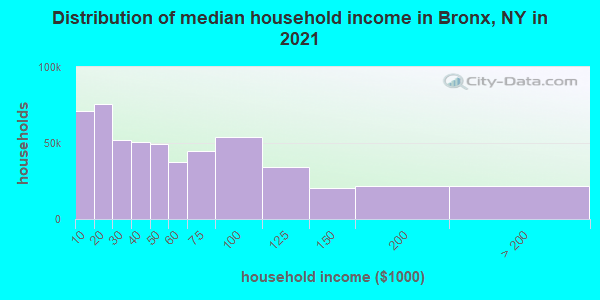
Estimated median household income in 2022: $45,517 ($27,611 in 1999)
| This county: | $45,517 |
| New York: | $79,557 |
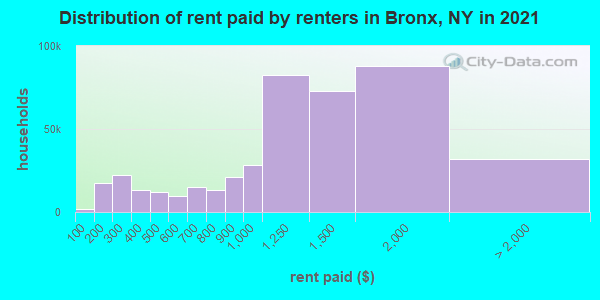
Median contract rent in 2022 for apartments: $1,203 (lower quartile is $798, upper quartile is $1,615)
| This county: | $1203 |
| State: | $1354 |
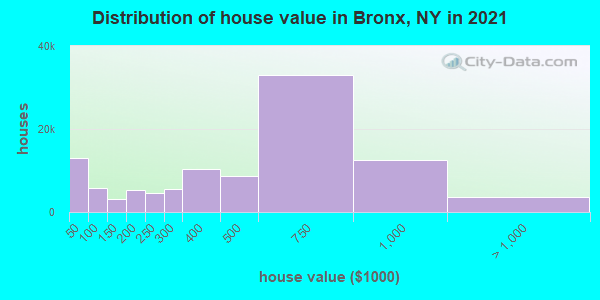
Estimated median house or condo value in 2022: $489,800 (it was $183,800 in 2000)
| Bronx: | $489,800 |
| New York: | $400,400 |
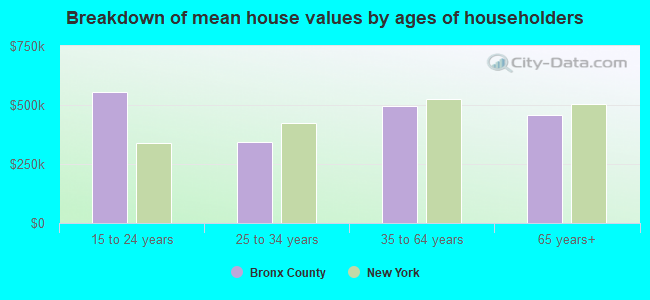
Mean price in 2022:
Median monthly housing costs for homes and condos with a mortgage: $2,697Detached houses: $664,444
Here: $664,444 State: $476,719 Townhouses or other attached units: $592,819
Here: $592,819 State: $699,270 In 2-unit structures: $631,574
Here: $631,574 State: $713,077 In 3-to-4-unit structures: $573,744
Here: $573,744 State: $764,568 In 5-or-more-unit structures: $249,506
Here: $249,506 State: $912,009 Mobile homes: $253,221
Here: $253,221 State: $88,925 Occupied boats, RVs, vans, etc.: $60,479
Here: $60,479 State: $480,795
Median monthly housing costs for units without a mortgage: $911
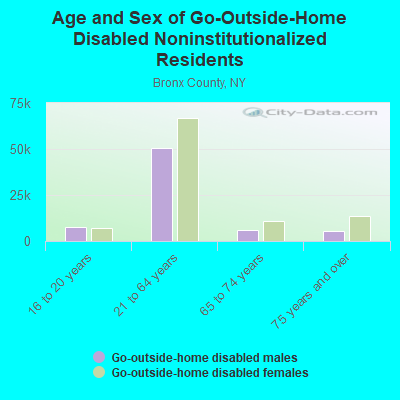
Institutionalized population: 25,437
Health of residents in Bronx County based on CDC Behavioral Risk Factor Surveillance System Survey Questionnaires from 2003 to 2012:
General health status score of residents in this county from 1 (poor) to 5 (excellent) is 3.2. This is significantly worse than average.67.5% of residents exercised in the past month. This is less than average.
39.6% of residents smoked 100+ cigarettes in their lives. This is less than average.
73.2% of adult residents drank alcohol in the past 30 days. This is about average.
67.0% of residents visited a dentist within the past year. This is less than average.
Average weight of males is 189 pounds. This is less than average.
Average weight of females is 160 pounds. This is about average.
2.6% of residents keep firearms around their homes. This is less than average.
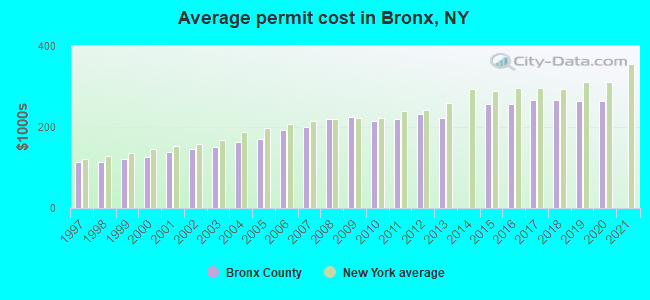
Single-family new house construction building permits:
- 2022: 1 building, cost: $298,700
- 2021: 0 buildings
- 2020: 5 buildings, average cost: $263,000
- 2019: 2 buildings, average cost: $264,200
- 2018: 7 buildings, average cost: $266,300
- 2017: 9 buildings, average cost: $267,200
- 2016: 2 buildings, average cost: $257,200
- 2015: 4 buildings, average cost: $257,200
- 2014: 0 buildings
- 2013: 3 buildings, average cost: $222,200
- 2012: 8 buildings, average cost: $232,600
- 2011: 1 building, cost: $220,300
- 2010: 6 buildings, average cost: $216,400
- 2009: 61 buildings, average cost: $224,900
- 2008: 162 buildings, average cost: $218,800
- 2007: 44 buildings, average cost: $200,600
- 2006: 74 buildings, average cost: $191,600
- 2005: 29 buildings, average cost: $169,900
- 2004: 33 buildings, average cost: $163,600
- 2003: 55 buildings, average cost: $150,300
- 2002: 18 buildings, average cost: $144,900
- 2001: 20 buildings, average cost: $138,800
- 2000: 36 buildings, average cost: $127,200
- 1999: 25 buildings, average cost: $120,500
- 1998: 28 buildings, average cost: $114,200
- 1997: 24 buildings, average cost: $113,800

Median real estate property taxes paid for housing units with mortgages in 2022: $5,145 (1.0%)
Median real estate property taxes paid for housing units with no mortgage in 2022: $4,581 (1.3%)
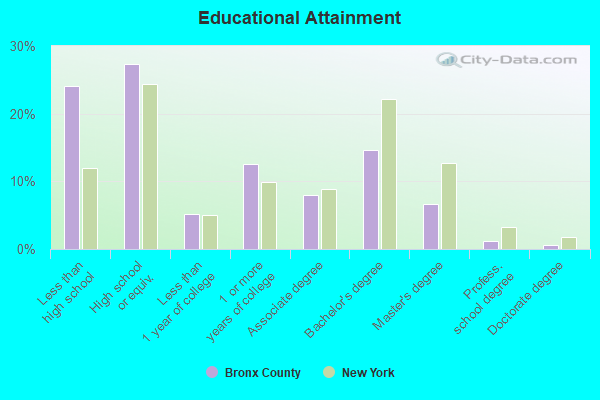
| Bronx County: | 27.7% |
| New York: | 14.3% |
Median age of residents in 2022: 35.8 years old
(Males: 33.9 years old, Females: 38.1 years old)
(Median age for: White residents: 48.0 years old, Black residents: 35.8 years old, American Indian residents: 29.2 years old, Asian residents: 39.2 years old, Hispanic or Latino residents: 33.9 years old, Other race residents: 34.6 years old)
Area name: New York-Monmouth-Ocean, NY-NJ HUD Metro FMR Area
Fair market rent in 2006 for a 1-bedroom apartment in Bronx County is $1003 a month.
Fair market rent for a 2-bedroom apartment is $1133 a month.
Fair market rent for a 3-bedroom apartment is $1406 a month.
Cities in this county include: Bronx.
2023 air pollution in Bronx County:
Carbon Monoxide: 0.255 ppm (standard limit: 9 ppm). Near U.S. average.
Nitrogen Dioxide: 0.01 ppm (standard limit: 0.053 ppm). Above U.S. average.
Ozone (1-hour): 0.029 ppm (standard limit: 0.12 ppm). Below U.S. average.
Particulate Matter (PM2.5) Annual: 10.7 µg/m3(standard limit: 15.0 µg/m3). Near U.S. average.
Sulfur Oxides Annual: 0.000 ppm (standard limit: 0.03 ppm). Near U.S. average.
Neighboring counties: Brown County, Illinois  , Buchanan County, Missouri , Chariton County, Missouri , Logan County, Colorado , Mifflin County, Pennsylvania , Routt County, Colorado , York County, Pennsylvania
  , Ross County, Ohio .
| Here: | 6.6% |
| New York: | 4.4% |
Current college students: 86,014
People 25 years of age or older with a high school degree or higher: 75.6%
People 25 years of age or older with a bachelor's degree or higher: 21.8%
Number of foreign born residents: 491,508 (55.0% naturalized citizens)
| Bronx County: | 35.6% |
| Whole state: | 22.7% |
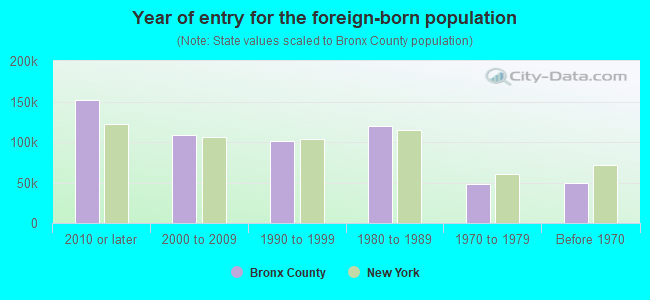
- Year of entry for the foreign-born population
- 180,8512010 or later
- 113,6542000 to 2009
- 88,4331990 to 1999
- 119,9501980 to 1989
- 48,7601970 to 1979
- 49,451Before 1970
Mean travel time to work (commute): + minutes
Percentage of county residents living and working in this county: 98.3%
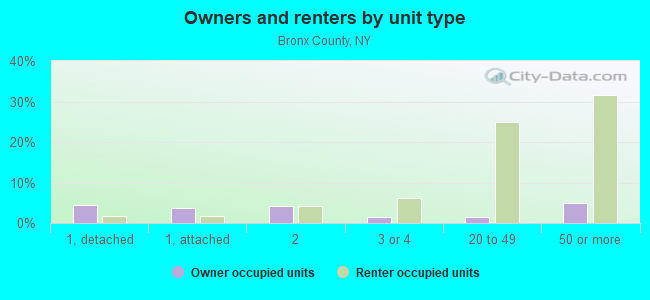
Housing units in structures:
- One, detached: 36,082
- One, attached: 32,895
- Two: 44,201
- 3 or 4: 45,883
- 5 to 9: 28,607
- 10 to 19: 37,253
- 20 to 49: 132,802
- 50 or more: 198,735
- Mobile homes: 1,230
- Boats, RVs, vans, etc.: 297
Housing units in Bronx County with a mortgage: 64,065 (5,725 second mortgage, 500 home equity loan, 3,505 both second mortgage and home equity loan)
Houses without a mortgage: 1,635
| Here: | 98.5% with mortgage |
| State: | 95.5% with mortgage |
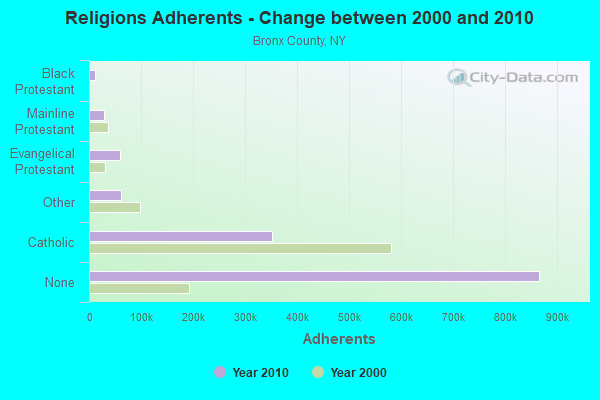
Religion statistics for Bronx County
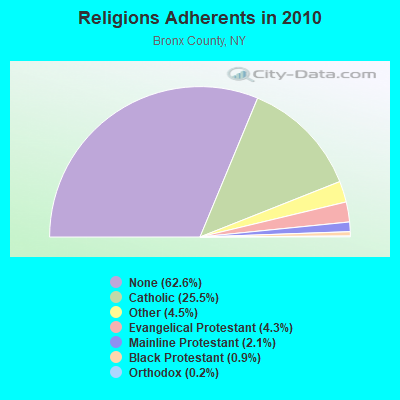
| Religion | Adherents | Congregations |
|---|---|---|
| Catholic | 353,098 | 72 |
| Other | 62,139 | 83 |
| Evangelical Protestant | 59,530 | 287 |
| Mainline Protestant | 28,611 | 123 |
| Black Protestant | 12,275 | 50 |
| Orthodox | 2,350 | 4 |
| None | 867,105 | - |
Source: Clifford Grammich, Kirk Hadaway, Richard Houseal, Dale E.Jones, Alexei Krindatch, Richie Stanley and Richard H.Taylor. 2012. 2010 U.S.Religion Census: Religious Congregations & Membership Study. Association of Statisticians of American Religious Bodies. Jones, Dale E., et al. 2002. Congregations and Membership in the United States 2000. Nashville, TN: Glenmary Research Center.
Food Environment Statistics:
| Bronx County: | 6.06 / 10,000 pop. |
| State: | 4.13 / 10,000 pop. |
| This county: | 0.64 / 10,000 pop. |
| New York: | 0.92 / 10,000 pop. |
| Bronx County: | 0.33 / 10,000 pop. |
| New York: | 1.68 / 10,000 pop. |
| This county: | 3.14 / 10,000 pop. |
| State: | 8.82 / 10,000 pop. |
| Bronx County: | 8.8% |
| New York: | 8.2% |
| Bronx County: | 25.4% |
| State: | 23.8% |
| Here: | 15.4% |
| State: | 15.6% |
Agriculture in Bronx County:
The value of nursery, greenhouse, floriculture, and sod as a percentage of the total market value of agricultural products sold: 0.00%The value of livestock, poultry, and their products as a percentage of the total market value of agricultural products sold: 0.00%
The percentage of farms operated by a family or individual: 0.00%
Average age of principal farm operators: 0 years
Earthquake activity:
Bronx County-area historical earthquake activity is significantly above New York state average. It is 69% smaller than the overall U.S. average.On 8/23/2011 at 17:51:04, a magnitude 5.8 (5.8 MW, Depth: 3.7 mi, Class: Moderate, Intensity: VI - VII) earthquake occurred 297.4 miles away from Bronx County center
On 10/7/1983 at 10:18:46, a magnitude 5.3 (5.1 MB, 5.3 LG, 5.1 ML) earthquake occurred 216.2 miles away from the county center
On 4/20/2002 at 10:50:47, a magnitude 5.3 (5.3 ML, Depth: 3.0 mi) earthquake occurred 253.7 miles away from the county center
On 1/16/1994 at 01:49:16, a magnitude 4.6 (4.6 MB, 4.6 LG, Depth: 3.1 mi, Class: Light, Intensity: IV - V) earthquake occurred 119.1 miles away from the county center
On 4/20/2002 at 10:50:47, a magnitude 5.2 (5.2 MB, 4.2 MS, 5.2 MW, 5.0 MW) earthquake occurred 251.9 miles away from Bronx County center
On 8/22/1992 at 12:20:32, a magnitude 4.8 (4.8 MB, 3.8 MS, 4.7 LG, Depth: 6.2 mi) earthquake occurred 223.5 miles away from the county center
Magnitude types: regional Lg-wave magnitude (LG), body-wave magnitude (MB), local magnitude (ML), surface-wave magnitude (MS), moment magnitude (MW)
Most recent natural disasters:
- New York Covid-19 Pandemic, Incident Period: January 20, 2020, Major Disaster (Presidential) Declared DR-4480-NY: March 20, 2020, FEMA Id: 4480, Natural disaster type: Other
- New York Hurricane Sandy, Incident Period: October 27, 2012 to November 09, 2012, Emergency Declared EM-3351: October 28, 2012, FEMA Id: 3351, Natural disaster type: Hurricane
- New York Hurricane Sandy, Incident Period: October 27, 2012 to November 09, 2012, Major Disaster (Presidential) Declared DR-4085: October 30, 2012, FEMA Id: 4085, Natural disaster type: Hurricane
- New York Hurricane Irene, Incident Period: August 26, 2011 to September 05, 2011, Major Disaster (Presidential) Declared DR-4020: August 31, 2011, FEMA Id: 4020, Natural disaster type: Hurricane
- New York Hurricane Irene, Incident Period: August 25, 2011 to September 05, 2011, Emergency Declared EM-3328: August 26, 2011, FEMA Id: 3328, Natural disaster type: Hurricane
- New York Hurricane Katrina Evacuation, Incident Period: August 29, 2005 to October 01, 2005, Emergency Declared EM-3262: September 30, 2005, FEMA Id: 3262, Natural disaster type: Hurricane
- New York Power Outage, Incident Period: August 14, 2003 to August 16, 2003, Emergency Declared EM-3186: August 23, 2003, FEMA Id: 3186, Natural disaster type: Power Outage
- New York Snowstorm, Incident Period: February 17, 2003 to February 18, 2003, Emergency Declared EM-3184: March 27, 2003, FEMA Id: 3184, Natural disaster type: Snowstorm
- New York Terrorist Attack, Incident Period: September 11, 2001, Major Disaster (Presidential) Declared DR-1391: September 11, 2001, FEMA Id: 1391, Natural disaster type: Other
- New York Virus Threat, Incident Period: May 22, 2000 to November 01, 2000, Emergency Declared EM-3155: October 11, 2000, FEMA Id: 3155, Natural disaster type: Other
- 4 other natural disasters have been reported since 1953.
The number of natural disasters in Bronx County (14) is near the US average (15).
Major Disasters (Presidential) Declared: 7
Emergencies Declared: 7
Causes of natural disasters: Hurricanes: 5, Blizzards: 2, Floods: 2, Storms: 2, Power Outage: 1, Snowstorm: 1, Other: 3 (Note: some incidents may be assigned to more than one category).
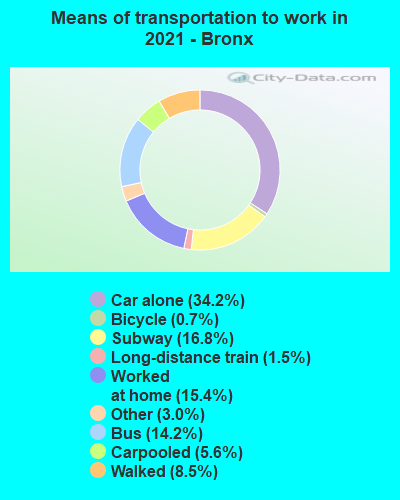
Means of transportation to work:
- Drove a car alone: 146,739 (35.5%)
- Carpooled: 26,812 (6.5%)
- Bus: 63,242 (15.3%)
- Subway or elevated rail: 73,102 (17.7%)
- Long-distance train or commuter rail: 3,346 (0.8%)
- Light rail, streetcar or trolley: 370 (0.1%)
- Ferryboat: 416 (0.1%)
- Taxicab, motorcycle, or other means: 12,726 (3.1%)
- Bicycle: 3,244 (0.8%)
- Walked: 41,169 (10.0%)
- Worked at home: 42,453 (10.3%)
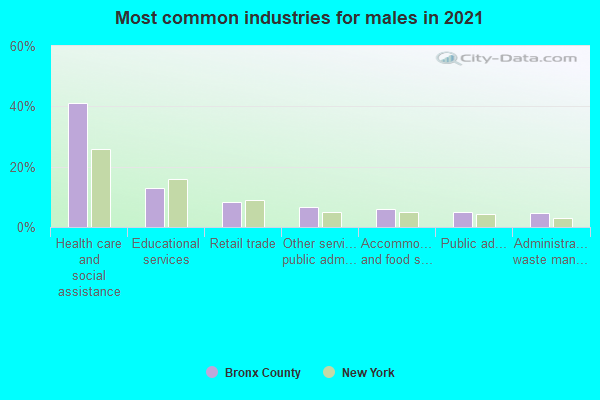
- Health care and social assistance (42%)
- Educational services (13%)
- Retail trade (11%)
- Other services, except public administration (7%)
- Administrative and support and waste management services (5%)
- Accommodation and food services (5%)
- Transportation and warehousing (4%)

- Health care and social assistance (40%)
- Educational services (13%)
- Retail trade (10%)
- Other services, except public administration (7%)
- Administrative and support and waste management services (5%)
- Accommodation and food services (5%)
- Transportation and warehousing (4%)
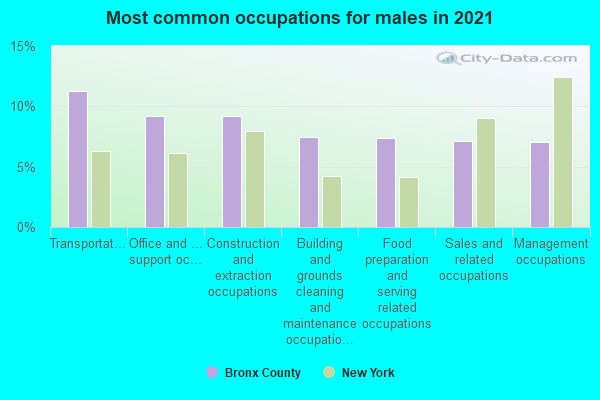
- Transportation occupations (13%)
- Food preparation and serving related occupations (9%)
- Construction and extraction occupations (8%)
- Office and administrative support occupations (7%)
- Sales and related occupations (7%)
- Building and grounds cleaning and maintenance occupations (7%)
- Management occupations (7%)
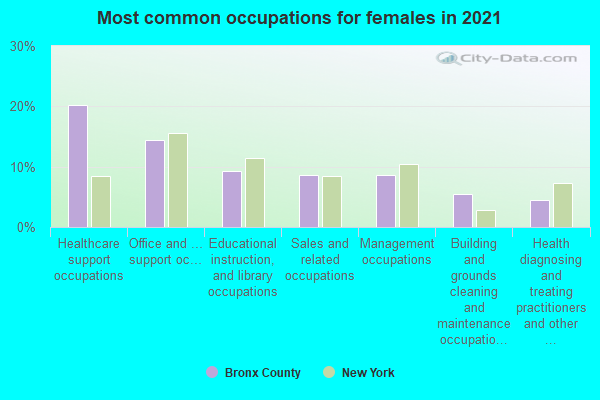
- Healthcare support occupations (22%)
- Office and administrative support occupations (14%)
- Educational instruction, and library occupations (9%)
- Sales and related occupations (9%)
- Management occupations (7%)
- Building and grounds cleaning and maintenance occupations (6%)
- Personal care and service occupations (6%)
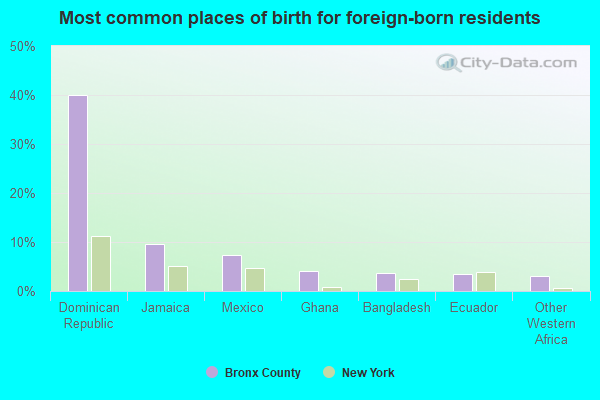
- Dominican Republic (41%)
- Jamaica (8%)
- Mexico (8%)
- Ghana (5%)
- Bangladesh (3%)
- Ecuador (3%)
- Honduras (3%)
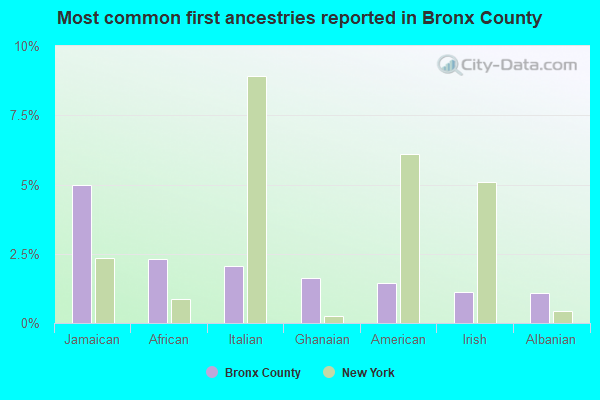
- Jamaican (4%)
- African (3%)
- Italian (2%)
- Ghanaian (2%)
- American (2%)
- Irish (1%)
- Albanian (1%)
People in group quarters in Bronx County, New York in 2010:
- 11,939 people in local jails and other municipal confinement facilities
- 11,734 people in nursing facilities/skilled-nursing facilities
- 8,990 people in emergency and transitional shelters (with sleeping facilities) for people experiencing homelessness
- 6,418 people in college/university student housing
- 2,099 people in other noninstitutional facilities
- 1,689 people in residential treatment centers for adults
- 1,222 people in group homes intended for adults
- 855 people in workers' group living quarters and job corps centers
- 610 people in mental (psychiatric) hospitals and psychiatric units in other hospitals
- 353 people in hospitals with patients who have no usual home elsewhere
- 265 people in correctional facilities intended for juveniles
- 222 people in in-patient hospice facilities
- 135 people in group homes for juveniles (non-correctional)
- 127 people in state prisons
- 42 people in residential treatment centers for juveniles (non-correctional)
- 10 people in correctional residential facilities
People in group quarters in Bronx County, New York in 2000:
- 13,154 people in local jails and other confinement facilities (including police lockups)
- 11,663 people in nursing homes
- 8,864 people in other noninstitutional group quarters
- 5,720 people in college dormitories (includes college quarters off campus)
- 1,289 people in mental (psychiatric) hospitals or wards
- 851 people in homes for the mentally ill
- 848 people in homes or halfway houses for drug/alcohol abuse
- 841 people in other group homes
- 702 people in homes for the mentally retarded
- 666 people in other nonhousehold living situations
- 635 people in religious group quarters
- 317 people in hospitals or wards for drug/alcohol abuse
- 309 people in other types of correctional institutions
- 288 people in hospitals/wards and hospices for chronically ill
- 288 people in other hospitals or wards for chronically ill
- 253 people in state prisons
- 192 people in wards in general hospitals for patients who have no usual home elsewhere
- 142 people in job corps and vocational training facilities
- 133 people in training schools for juvenile delinquents
- 80 people in schools, hospitals, or wards for the intellectually disabled
- 75 people in institutions for the blind
- 64 people in orthopedic wards and institutions for the physically handicapped
- 62 people in homes for the physically handicapped
- 41 people in unknown juvenile institutions
- 22 people in short-term care, detention or diagnostic centers for delinquent children
- 19 people in halfway houses
- 5 people in homes for abused, dependent, and neglected children
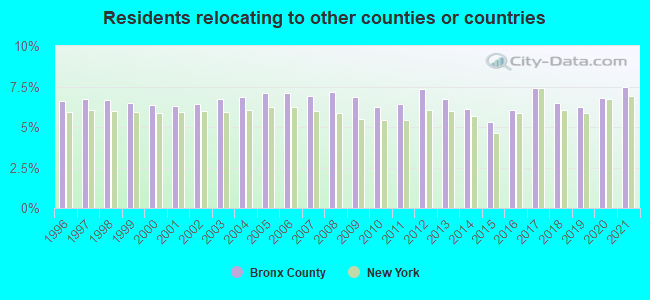
4.09% of this county's 2021 resident taxpayers lived in other counties in 2020 ($45,781 average adjusted gross income)
| Here: | 4.09% |
| New York average: | 5.29% |
0.04% of residents moved from foreign countries ($101 average AGI)
Bronx County: 0.04% New York average: 0.01%
2.75% relocated from other counties in New York ($31,005 average AGI)
1.30% relocated from other states ($14,676 average AGI)
Bronx County: 1.30% New York average: 1.86%

Top counties from which taxpayers relocated into this county between 2020 and 2021:
| from New York County, NY | |
| from Kings County, NY | |
| from Queens County, NY | |
| from Westchester County, NY | |
| from Fairfield County, CT | |
| from Essex County, NJ | |
| from Hudson County, NJ |
7.48% of this county's 2020 resident taxpayers moved to other counties in 2021 ($49,395 average adjusted gross income)
| Here: | 7.48% |
| New York average: | 6.93% |
0.05% of residents moved to foreign countries ($120 average AGI)
Bronx County: 0.05% New York average: 0.02%
3.91% relocated to other counties in New York ($27,317 average AGI)
3.52% relocated to other states ($21,958 average AGI)
Bronx County: 3.52% New York average: 3.55%
Top counties to which taxpayers relocated from this county between 2020 and 2021:
| to New York County, NY | |
| to Westchester County, NY | |
| to Queens County, NY | |
| to Kings County, NY | |
| to Fairfield County, CT | |
| to Orange County, NY | |
| to Bergen County, NJ |
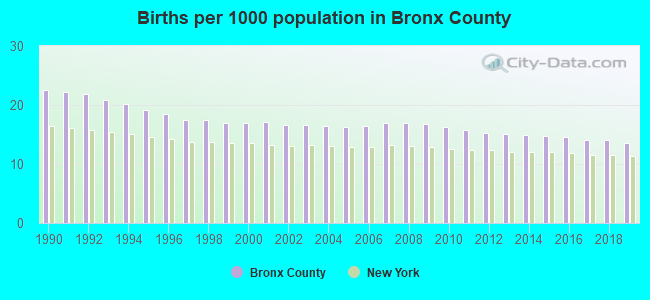
Births per 1000 population from 1990 to 1999: 19.7
Births per 1000 population from 2000 to 2009: 16.7
Births per 1000 population from 2010 to 2022: 12.4
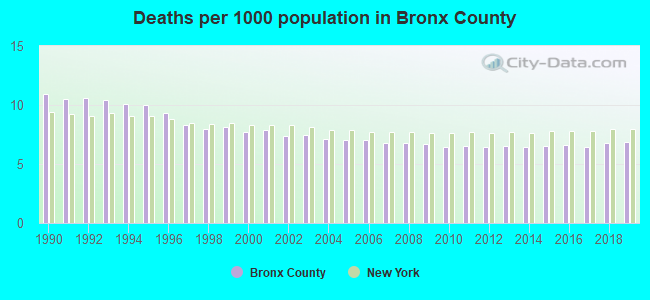
Deaths per 1000 population from 1990 to 1999: 9.6
Deaths per 1000 population from 2000 to 2009: 7.2
Deaths per 1000 population from 2010 to 2020: 7.0
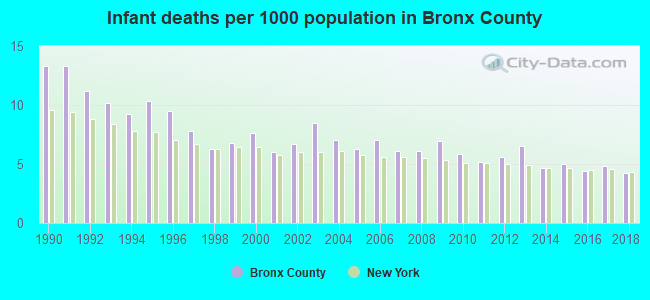
Infant deaths per 1000 live births from 1990 to 1999: 9.8
Infant deaths per 1000 live births from 2000 to 2009: 6.8
Infant deaths per 1000 live births from 2010 to 2021: 5.2
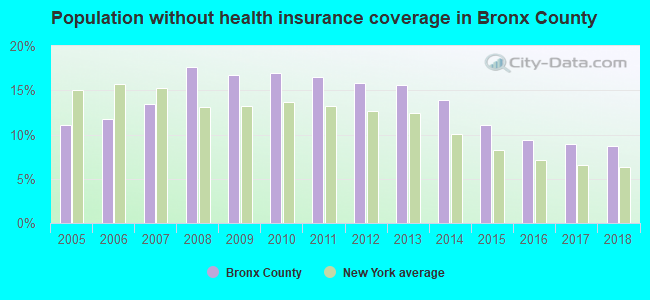
Persons under 19 years old without health insurance coverage in 2018: 2.2%

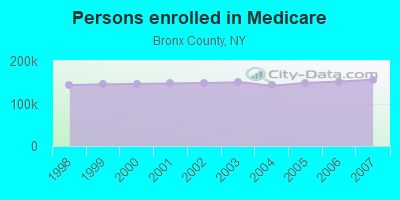
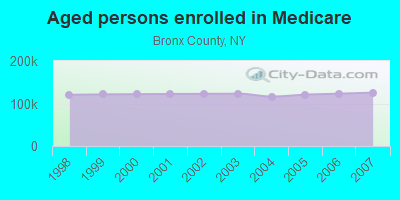
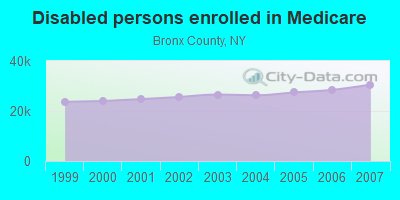
Persons enrolled in hospital insurance and/or supplemental medical insurance (Medicare) in July 1, 2007: 156,146 (125,561 aged, 30,585 disabled)
Children under 18 without health insurance coverage in 2007: 28,416 (7%)
Most common underlying causes of death in Bronx County, New York in 1999 - 2019:
- Atherosclerotic heart disease (29,132)
- Atherosclerotic cardiovascular disease, so described (11,246)
- Acute myocardial infarction, unspecified (10,500)
- Bronchus or lung, unspecified - Malignant neoplasms (9,061)
- Hypertensive heart disease without (congestive) heart failure (5,557)
- Unspecified diabetes mellitus, without complications (4,290)
- Chronic obstructive pulmonary disease, unspecified (3,961)
- Colon, unspecified - Malignant neoplasms (3,818)
- Breast, unspecified - Malignant neoplasms (3,755)
- Pneumonia, unspecified (3,665)
Population without health insurance coverage in 2000: 22%
Children under 18 without health insurance coverage in 2000: 15%
Short term general hospital admissions per 100,000 population in 2004: 13,731
Short term general hospital beds per 100,000 population in 2004: 326
Emergency room visits per 100,000 population in 2004: 49,831
General practice office based MDs per 100,000 population in 2005: 1,628
Medical specialist MDs per 100,000 population in 2005: 734
Dentists per 100,000 population in 1998: 9
Total births per 100,000 population, July 2005 - July 2006 : 29
Total deaths per 100,000 population, July 2005 - July 2006: 49
Limited-service eating places per 100,000 population in 2005 : 3
Beer, wine & liquor stores per 100,000 population in 2005: 1
Fitness & recreation sports centers per 100,000 population in 2005: 5,227
EPA green book nonattainment status in 2004-2006: 1
Crimes per 100,000 population in 1996: 1
Homicides per 1,000,000 population from 2000 to 2006: 132.4. This is more than state average.
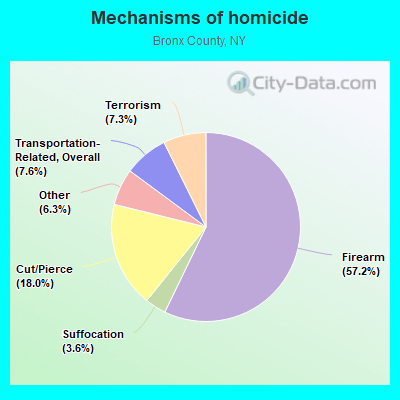
- Firearm - 75.7
- Cut/Pierce - 23.9
- Transportation-Related, Overall - 10.0
- Terrorism - 9.7
- Suffocation - 4.8
- Other - 8.3
Suicides per 1,000,000 population from 2000 to 2006: 51.9. This is less than state average.
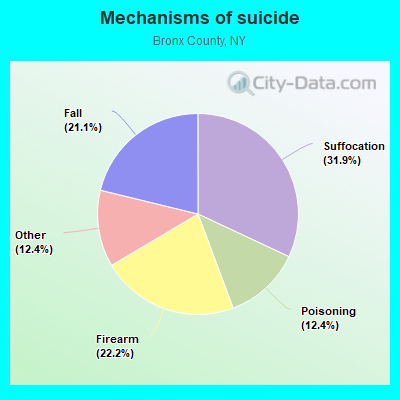
- Suffocation - 16.6
- Firearm - 11.5
- Fall - 11.0
- Poisoning - 6.4
- Other - 6.4
Household type by relationship:
Households: 1,379,946- Male householders: 221,364 (76,791 living alone), Female householders: 311,671 (98,044 living alone)
138,455 spouses (135,896 opposite-sex spouses), 37,488 unmarried partners, (34,874 opposite-sex unmarried partners), 441,876 children (428,455 natural, 3,859 adopted, 9,562 stepchildren), 46,766 grandchildren, 30,221 brothers or sisters, 30,876 parents, 1,407 foster children, 37,708 other relatives, 34,406 non-relatives
- In group quarters: 47,708
Size of family households: 112,465 2-persons, 90,075 3-persons, 66,042 4-persons, 37,275 5-persons, 14,003 6-persons, 9,748 7-or-more-persons.
Size of nonfamily households: 174,835 1-person, 23,595 2-persons, 2,974 3-persons, 1,276 4-persons, 261 5-persons, 372 6-persons, 114 7-or-more-persons.
111,905 married couples with children.
162,369 single-parent households (25,424 men, 136,945 women).
42.5% of residents of Bronx speak English at home.
45.7% of residents speak Spanish at home (53% speak English very well, 18% speak English well, 19% speak English not well, 11% don't speak English at all).
5.6% of residents speak other Indo-European language at home (57% speak English very well, 26% speak English well, 12% speak English not well, 4% don't speak English at all).
1.6% of residents speak Asian or Pacific Island language at home (50% speak English very well, 20% speak English well, 25% speak English not well, 5% don't speak English at all).
4.7% of residents speak other language at home (66% speak English very well, 24% speak English well, 9% speak English not well, 1% don't speak English at all).
In fiscal year 2004:
Federal Government expenditure: $0,000 ($0 per capita)
Department of Defense expenditure: $0,000
Federal direct payments to individuals for retirement and disability: $0,000
Federal other direct payments to individuals: $0,000
Federal direct payments not to individuals: $0,000
Federal grants: $0,000
Federal procurement contracts: $0,000 ($0,000 Department of Defense)
Federal salaries and wages: $0,000 ($0,000 Department of Defense)
Federal Government direct loans: $0,000
Federal guaranteed/insured loans: $0,000
Federal Government insurance: $0,000
Population change from April 1, 2000 to July 1, 2005:
Births: 128,965| Here: | 95 per 1000 residents |
| State: | 70 per 1000 residents |
Deaths: 51,340
| Here: | 38 per 1000 residents |
| State: | 42 per 1000 residents |
Net international migration: +68,981
| Here: | +51 per 1000 residents |
| State: | +35 per 1000 residents |
Net internal migration: -119,310
| Here: | |
| State: |
Total withdrawal of fresh water for public supply: 0.00 millions of gallons per day (all from surface)
| Here: | 4.9 |
| State: | 6.3 |
| Here: | 3.7 |
| State: | 3.8 |
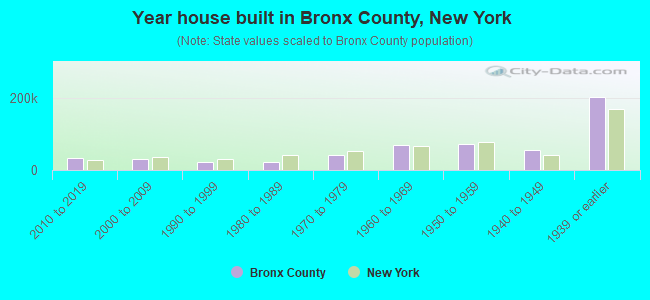
- Year house built in Bronx County, New York
- 3,3162020 or later
- 34,7062010 to 2019
- 31,4492000 to 2009
- 22,9881990 to 1999
- 27,4471980 to 1989
- 44,0081970 to 1979
- 76,3491960 to 1969
- 71,1101950 to 1959
- 61,5721940 to 1949
- 185,0401939 or earlier
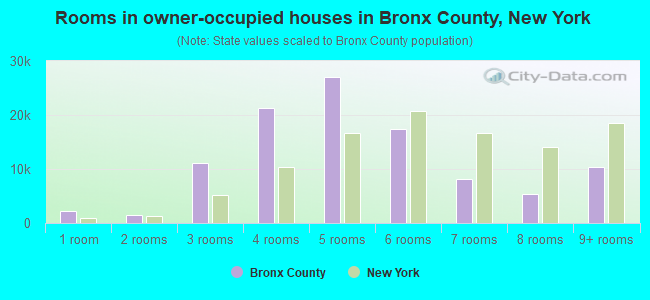
- Rooms in owner-occupied houses in Bronx County, New York
- 1,4631 room
- 2,9352 rooms
- 14,4723 rooms
- 27,0414 rooms
- 23,9885 rooms
- 20,5046 rooms
- 8,2617 rooms
- 5,3488 rooms
- 8,8279+ rooms
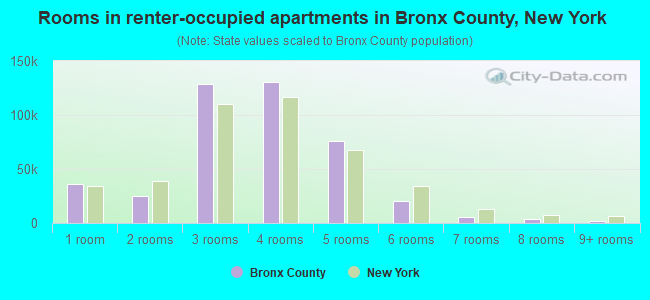
- Rooms in renter-occupied apartments in Bronx County, New York
- 39,0541 room
- 20,7162 rooms
- 127,7383 rooms
- 124,6174 rooms
- 74,3905 rooms
- 23,0276 rooms
- 5,0907 rooms
- 2,6718 rooms
- 2,8939+ rooms
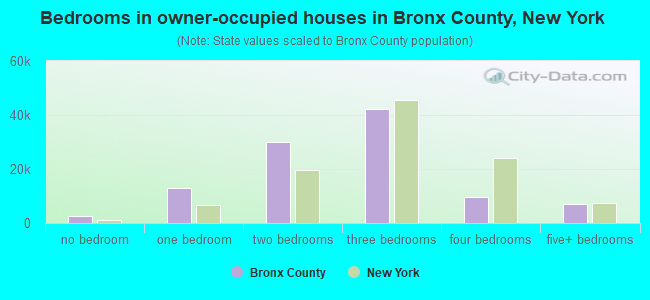
- Bedrooms in owner-occupied houses in Bronx County, New York
- 1,919no bedroom
- 18,7301 bedroom
- 31,9462 bedrooms
- 44,6853 bedrooms
- 9,6264 bedrooms
- 5,9335+ bedrooms
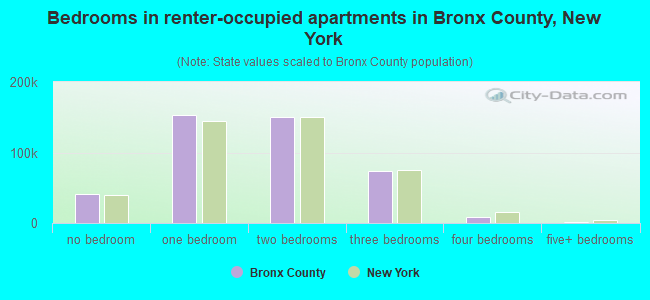
- Bedrooms in renter-occupied apartments in Bronx County, New York
- 42,877no bedroom
- 144,4331 bedroom
- 152,1502 bedrooms
- 68,8523 bedrooms
- 10,2454 bedrooms
- 1,6395+ bedrooms
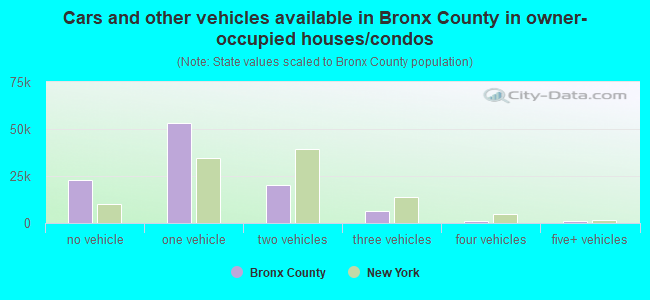
- Cars and other vehicles available in Bronx County in owner-occupied houses/condos
- 32,562no vehicle
- 51,2051 vehicle
- 22,9772 vehicles
- 4,6823 vehicles
- 1,3624 vehicles
- 515+ vehicles
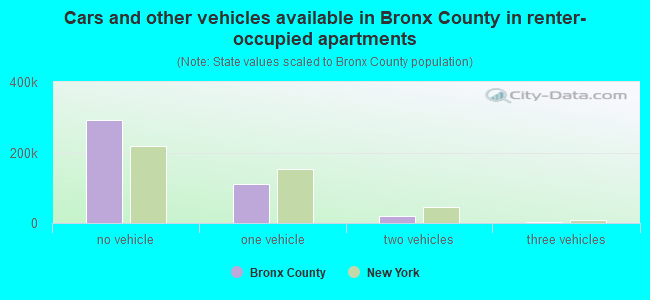
- Cars and other vehicles available in Bronx County in renter-occupied apartments
- 292,951no vehicle
- 103,2551 vehicle
- 22,1142 vehicles
- 1,6983 vehicles
- 04 vehicles
- 1785+ vehicles
92.2% of Bronx County residents lived in the same house 1 years ago.
Out of people who lived in different houses, 41% lived in this county.
Out of people who lived in different counties, 39% lived in New York.
| Bronx County: | 92.2% |
| State average: | 89.6% |
Place of birth for U.S.-born residents:
- This state: 712,881
- Other state: 75,091
- Northeast: 28,884
- Midwest: 7,701
- South: 30,693
- West: 7,813

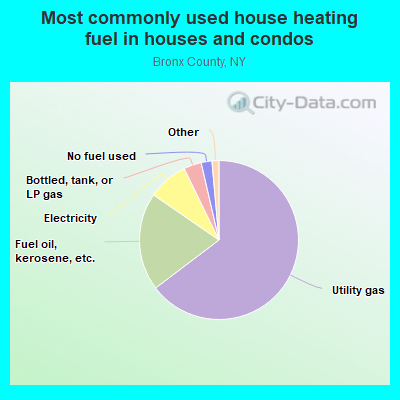
- 62.9%Utility gas
- 16.5%Fuel oil, kerosene, etc.
- 11.3%Electricity
- 4.0%Bottled, tank, or LP gas
- 3.0%No fuel used
- 1.8%Other fuel
- 0.4%Solar energy
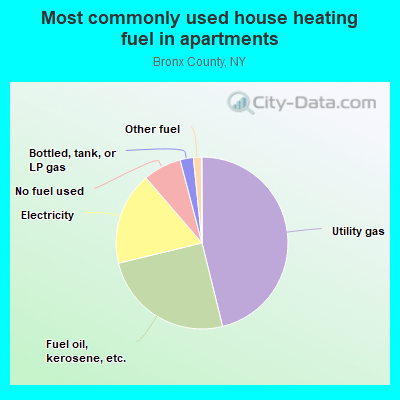
- 46.9%Utility gas
- 23.2%Fuel oil, kerosene, etc.
- 18.4%Electricity
- 6.6%No fuel used
- 2.6%Bottled, tank, or LP gas
- 2.0%Other fuel
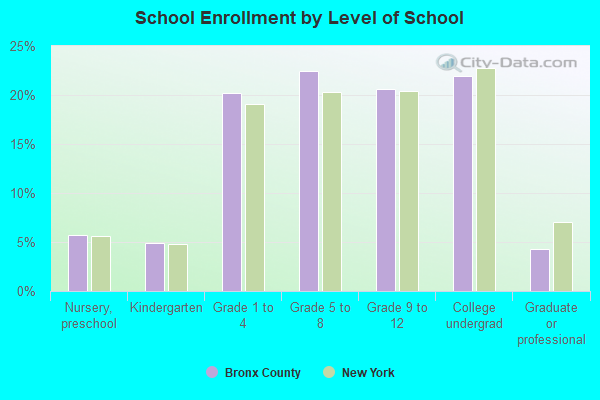
Private vs. public school enrollment:
| Here: | 10.6% |
| New York: | 15.6% |
| Here: | 13.1% |
| New York: | 15.0% |
| Here: | 33.6% |
| New York: | 39.2% |

Supplemental Security Income (SSI) in 2006:
- Total number of recipients: 94,525
- Number of aged recipients: 14,959
- Number of blind and disabled recipients: 79,566
- Number of recipients under 18: 14,824
- Number of recipients between 18 and 64: 50,076
- Number of recipients older than 64: 29,625
- Number of recipients also receiving OASDI: 25,137
- Amount of payments (thousands of dollars): 51,269
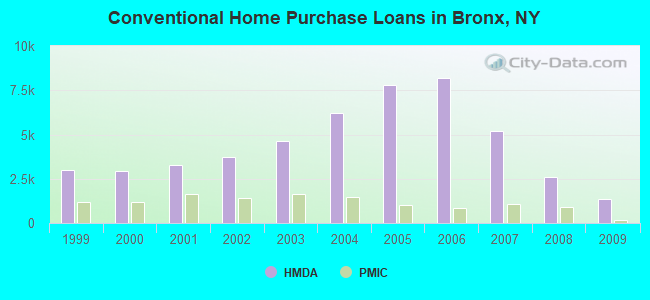
| Home Mortgage Disclosure Act Aggregated Statistics For Year 2009 (Based on 330 full tracts) | ||||||||||||||
| A) FHA, FSA/RHS & VA Home Purchase Loans | B) Conventional Home Purchase Loans | C) Refinancings | D) Home Improvement Loans | E) Loans on Dwellings For 5+ Families | F) Non-occupant Loans on < 5 Family Dwellings (A B C & D) | G) Loans On Manufactured Home Dwelling (A B C & D) | ||||||||
|---|---|---|---|---|---|---|---|---|---|---|---|---|---|---|
| Number | Average Value | Number | Average Value | Number | Average Value | Number | Average Value | Number | Average Value | Number | Average Value | Number | Average Value | |
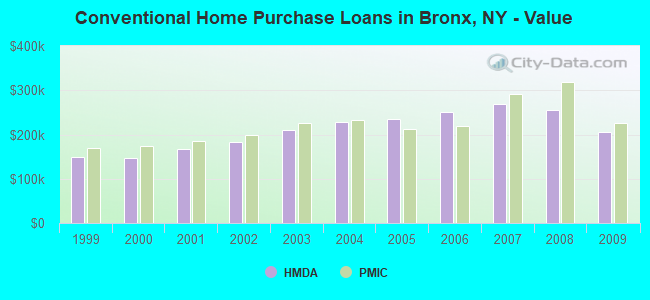
| LOANS ORIGINATED | 617 | $398,739 | 1,369 | $205,033 | 2,166 | $282,596 | 156 | $147,013 | 130 | $1,607,208 | 147 | $345,286 | 12 | $307,167 |
| APPLICATIONS APPROVED, NOT ACCEPTED | 78 | $378,487 | 170 | $275,271 | 441 | $285,481 | 61 | $114,967 | 16 | $1,788,875 | 41 | $296,512 | 1 | $351,000 |
| APPLICATIONS DENIED | 307 | $405,130 | 821 | $204,123 | 2,384 | $302,222 | 490 | $66,322 | 75 | $2,027,093 | 309 | $235,502 | 12 | $51,583 |
| APPLICATIONS WITHDRAWN | 215 | $404,465 | 235 | $247,847 | 978 | $319,738 | 65 | $180,523 | 29 | $1,295,931 | 85 | $288,353 | 1 | $355,000 |
| FILES CLOSED FOR INCOMPLETENESS | 76 | $394,368 | 172 | $200,645 | 455 | $306,813 | 32 | $224,094 | 2 | $1,262,500 | 25 | $274,960 | 0 | $0 |
| Private Mortgage Insurance Companies Aggregated Statistics For Year 2009 (Based on 157 full tracts) | ||||||
| A) Conventional Home Purchase Loans | B) Refinancings | C) Non-occupant Loans on < 5 Family Dwellings (A & B) | ||||
|---|---|---|---|---|---|---|
| Number | Average Value | Number | Average Value | Number | Average Value | |
| LOANS ORIGINATED | 163 | $224,914 | 18 | $351,222 | 0 | $0 |
| APPLICATIONS APPROVED, NOT ACCEPTED | 123 | $284,935 | 36 | $339,500 | 1 | $368,000 |
| APPLICATIONS DENIED | 96 | $233,865 | 37 | $368,108 | 1 | $399,000 |
| APPLICATIONS WITHDRAWN | 67 | $221,612 | 13 | $316,000 | 2 | $251,000 |
| FILES CLOSED FOR INCOMPLETENESS | 21 | $250,667 | 4 | $420,250 | 0 | $0 |
Bronx County on our top lists:
- #2 on the list of "Top 101 counties with the lowest percentage of residents that keep firearms around their homes"
- #3 on the list of "Top 101 counties with highest percentage of residents voting for Obama (Democrat) in the 2012 Presidential Election (pop. 50,000+)"
- #4 on the list of "Top 101 counties with highest percentage of residents voting for Obama (Democrat) in the 2012 Presidential Election"
- #6 on the list of "Top 101 counties with the highest Nitrogen Dioxide air pollution readings in 2012 (ppm)"
- #6 on the list of "Top 101 counties with the lowest Ozone (1-hour) air pollution readings in 2012 (ppm)"
- #17 on the list of "Top 101 counties with the lowest percentage of residents that drank alcohol in the past 30 days"
- #23 on the list of "Top 101 counties with the worst general health status score of residents (1-5), 3 years of data"
- #24 on the list of "Top 101 counties with the largest number of people moving out compared to moving in (pop. 50,000+)"
- #27 on the list of "Top 101 counties with the most Catholic adherents (pop. 50,000+)"
- #27 on the list of "Top 101 counties with the most Catholic adherents"
- #31 on the list of "Top 101 counties with the most Catholic congregations"
- #31 on the list of "Top 101 counties with the most Catholic congregations (pop. 50,000+)"
- #35 on the list of "Top 101 counties with the lowest percentage of residents that exercised in the past month"
- #39 on the list of "Top 101 counties with the most Other adherents"
- #39 on the list of "Top 101 counties with the most Other adherents (pop. 50,000+)"
- #45 on the list of "Top 101 counties with the largest decrease in the number of deaths per 1000 residents 2000-2006 to 2007-2013 (pop. 50,000+)"
- #46 on the list of "Top 101 counties with the lowest percentage of residents that smoked 100+ cigarettes in their lives"
- #48 on the list of "Top 101 counties with the highest number of births per 1000 residents 2007-2013"
- #48 on the list of "Top 101 counties with the highest number of births per 1000 residents 2007-2013 (pop 50,000+)"
- #49 on the list of "Top 101 counties with the highest Sulfur Oxides Annual air pollution readings in 2012 (µg/m3)"