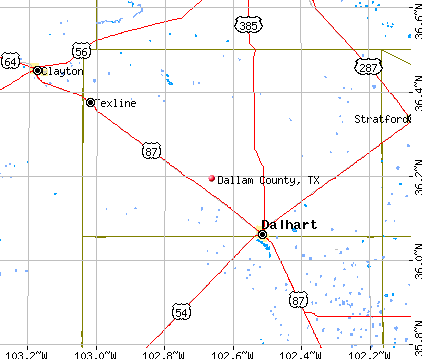
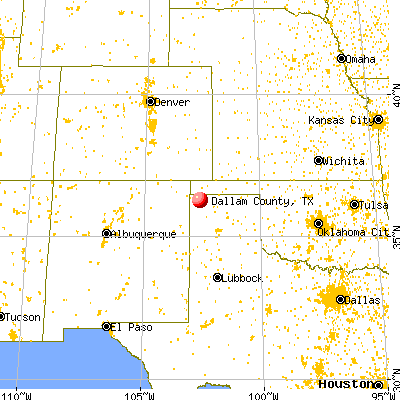
Dallam County, Texas (TX)
County owner-occupied free and clear houses and condos in 2010: 694
County owner-occupied houses and condos in 2000: 1,459
Renter-occupied apartments: 972 (it was 858 in 2000)
| % of renters here: | 37% |
| State: | 36% |
Land area: 1505 sq. mi.
Water area: 0.6 sq. mi.
Population density: 5 people per square mile (very low).
Industries providing employment: Agriculture,forestry,fishing and hunting, and mining (18.0%), Transportation and warehousing,and utilities (16.0%), Manufacturing (13.1%), Arts, entertainment, recreation, accommodation and food services (12.3%), Retail trade (12.0%).
Type of workers:
- Private wage or salary: 73%
- Government: 9%
- Self-employed, not incorporated: 18%
- Unpaid family work: 0%
- OSM Map
- General Map
- Google Map
- MSN Map

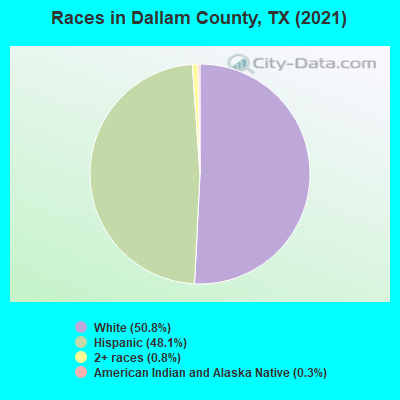
- 3,55148.1%Hispanic or Latino
- 3,36945.6%White Non-Hispanic Alone
- 3024.1%Two or more races
- 1542.1%Some other race alone
- 50.07%Black Non-Hispanic Alone
| Median resident age: | 31.1 years |
| Texas median age: | 35.6 years |
| Males: 3,939 | |
| Females: 3,418 |


| Dallam County: | 2.0 people |
| Texas: | 3 people |
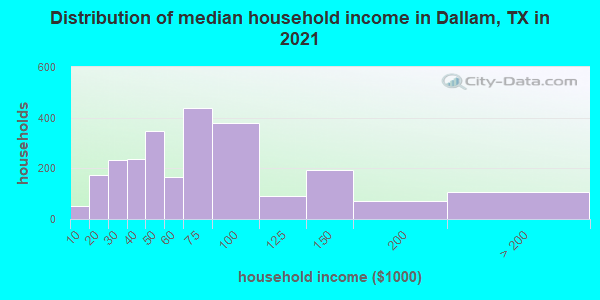
Estimated median household income in 2022: $71,228 ($27,946 in 1999)
| This county: | $71,228 |
| Texas: | $72,284 |
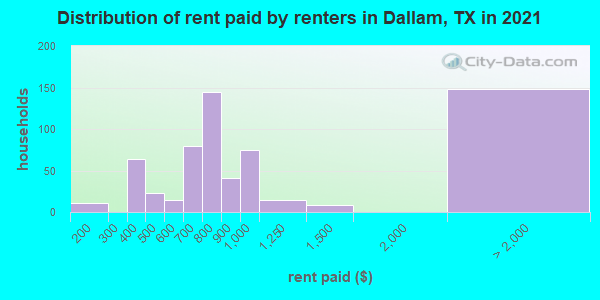
Median contract rent in 2022 for apartments: $856 (lower quartile is $665, upper quartile is $1,019)
| This county: | $856 |
| State: | $1117 |
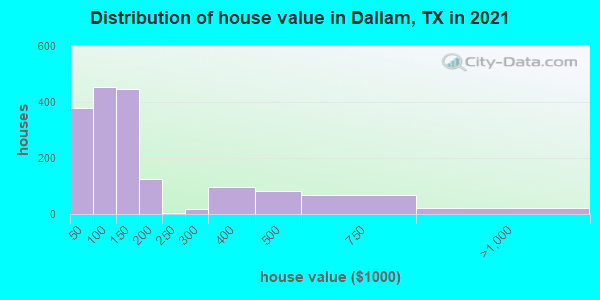
Estimated median house or condo value in 2022: $131,683 (it was $44,200 in 2000)
| Dallam: | $131,683 |
| Texas: | $275,400 |
Mean price in 2022:
Median monthly housing costs for homes and condos with a mortgage: $1,032Detached houses: $250,357
Here: $250,357 State: $369,058 Mobile homes: $65,746
Here: $65,746 State: $124,413
Median monthly housing costs for units without a mortgage: $462
Institutionalized population: 38
Crime in 2021 (reported by the sheriff's office or county police, not the county total):
- Murders: 0
- Rapes: 0
- Robberies: 0
- Assaults: 0
- Burglaries: 2
- Thefts: 0
- Auto thefts: 3
Crime in 2020 (reported by the sheriff's office or county police, not the county total):
- Murders: 0
- Rapes: 0
- Robberies: 0
- Assaults: 3
- Burglaries: 4
- Thefts: 3
- Auto thefts: 6
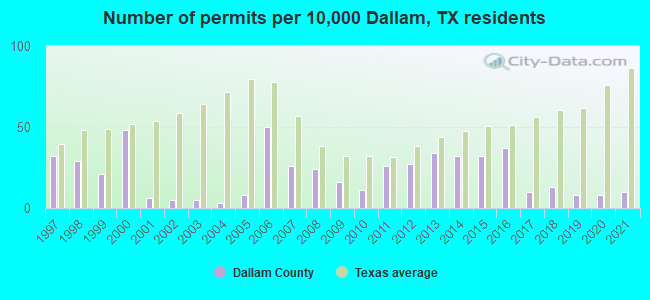
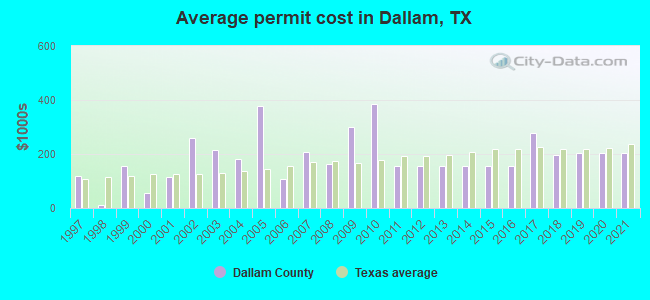
Single-family new house construction building permits:
- 2022: 9 buildings, average cost: $392,200
- 2021: 6 buildings, average cost: $204,900
- 2020: 5 buildings, average cost: $204,900
- 2019: 5 buildings, average cost: $204,900
- 2018: 8 buildings, average cost: $195,200
- 2017: 6 buildings, average cost: $275,500
- 2016: 23 buildings, average cost: $156,100
- 2015: 20 buildings, average cost: $156,100
- 2014: 20 buildings, average cost: $156,100
- 2013: 21 buildings, average cost: $156,100
- 2012: 17 buildings, average cost: $156,100
- 2011: 16 buildings, average cost: $156,100
- 2010: 7 buildings, average cost: $384,800
- 2009: 10 buildings, average cost: $298,800
- 2008: 15 buildings, average cost: $162,600
- 2007: 16 buildings, average cost: $206,800
- 2006: 31 buildings, average cost: $106,700
- 2005: 5 buildings, average cost: $377,000
- 2004: 2 buildings, average cost: $181,500
- 2003: 3 buildings, average cost: $216,000
- 2002: 3 buildings, average cost: $258,700
- 2001: 4 buildings, average cost: $116,300
- 2000: 30 buildings, average cost: $57,000
- 1999: 13 buildings, average cost: $155,900
- 1998: 18 buildings, average cost: $12,100
- 1997: 20 buildings, average cost: $119,100
Median real estate property taxes paid for housing units with mortgages in 2022: $1,888 (1.4%)
Median real estate property taxes paid for housing units with no mortgage in 2022: $1,048 (0.8%)
| Dallam County: | 8.6% |
| Texas: | 14.0% |
Median age of residents in 2022: 31.1 years old
(Males: 35.6 years old, Females: 27.0 years old)
(Median age for: White residents: 36.9 years old, American Indian residents: 22.0 years old, Hispanic or Latino residents: 25.9 years old, Other race residents: 37.4 years old)
Fair market rent in 2006 for a 1-bedroom apartment in Dallam County is $396 a month.
Fair market rent for a 2-bedroom apartment is $523 a month.
Fair market rent for a 3-bedroom apartment is $625 a month.
Notable locations in this county outside city limits:
Notable locations in Dallam County: Mallett (A), Dean Cluck Feedyard (B), Sherman County Depot Museum (C). Display/hide their locations on the map
Church in Dallam County: Spurlock Chapel (A). Display/hide its location on the map
Cemetery: Whaley Cemetery (1). Display/hide its location on the map
Reservoirs: Runyan Lake (A), Kenson Lake (B), Bryson Lake (C), Pleasure Pond (D), Stratford Feeders Reservoir (E), Coldwater Cattle Company Lake (F), Frank Brannan Lake (G), Petty Lake (H). Display/hide their locations on the map
Park in Dallam County: Clark Monument Number 7 (1). Display/hide its location on the map
Neighboring counties: Alfalfa County, Oklahoma  , Benton County, Arkansas , Harper County, Oklahoma
  , Henry County, Tennessee , Hartley County
  , Hemphill County , Moore County
  .
.
| Here: | 2.2% |
| Texas: | 3.5% |

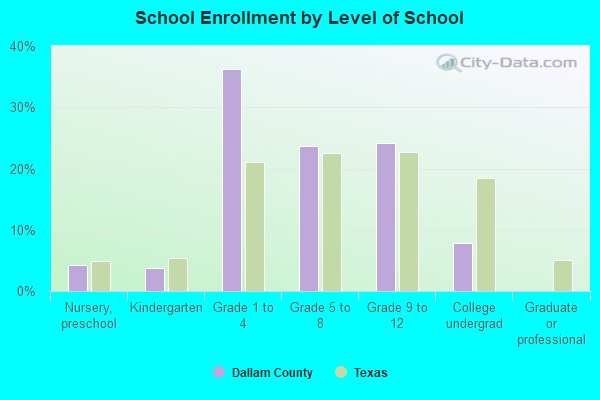
Current college students: 138
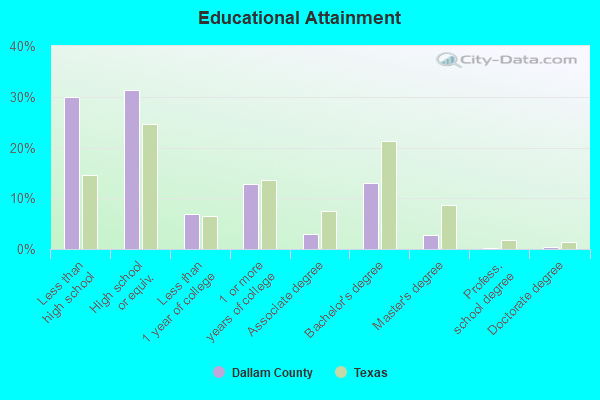
People 25 years of age or older with a high school degree or higher: 78.0%
People 25 years of age or older with a bachelor's degree or higher: 14.3%
Number of foreign born residents: 1,665 (28.1% naturalized citizens)
| Dallam County: | 22.6% |
| Whole state: | 17.2% |
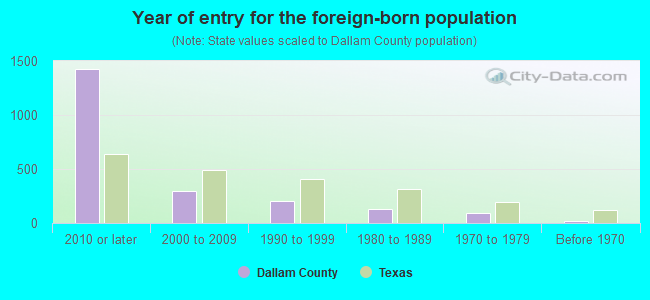
- Year of entry for the foreign-born population
- 1,0642010 or later
- 3382000 to 2009
- 1601990 to 1999
- 1311980 to 1989
- 891970 to 1979
- 20Before 1970
Mean travel time to work (commute): minutes
Percentage of county residents living and working in this county: 98.0%

Housing units in structures:
- One, detached: 2,284
- One, attached: 35
- Two: 74
- 3 or 4: 2
- 5 to 9: 52
- 10 to 19: 133
- 20 to 49: 32
- 50 or more: 39
- Mobile homes: 471
Housing units in Dallam County with a mortgage: 838 (54 second mortgage, 0 home equity loan, 59 both second mortgage and home equity loan)
Houses without a mortgage: 0
| Here: | 100.0% with mortgage |
| State: | 98.4% with mortgage |
Religion statistics for Dallam County
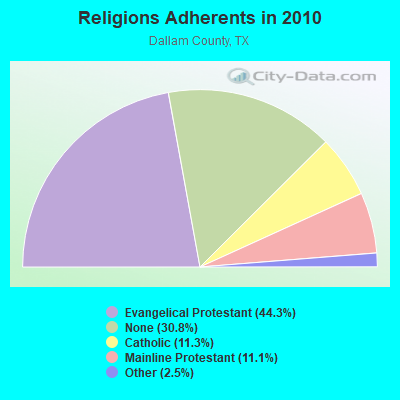
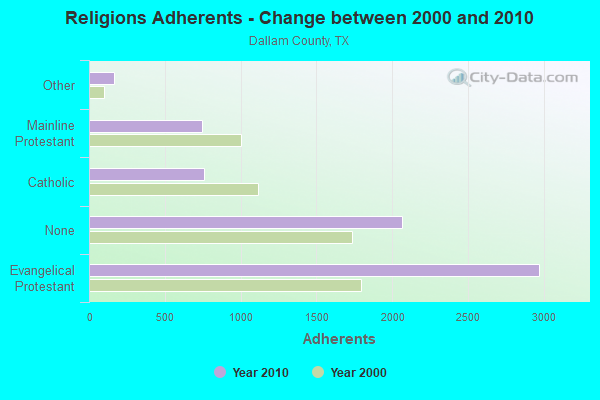
| Religion | Adherents | Congregations |
|---|---|---|
| Evangelical Protestant | 2,972 | 17 |
| Catholic | 760 | 2 |
| Mainline Protestant | 743 | 4 |
| Other | 166 | 2 |
| None | 2,062 | - |
Source: Clifford Grammich, Kirk Hadaway, Richard Houseal, Dale E.Jones, Alexei Krindatch, Richie Stanley and Richard H.Taylor. 2012. 2010 U.S.Religion Census: Religious Congregations & Membership Study. Association of Statisticians of American Religious Bodies. Jones, Dale E., et al. 2002. Congregations and Membership in the United States 2000. Nashville, TN: Glenmary Research Center.
Food Environment Statistics:
| Dallam County: | 4.89 / 10,000 pop. |
| Texas: | 3.95 / 10,000 pop. |
| This county: | 17.95 / 10,000 pop. |
| State: | 6.13 / 10,000 pop. |
| Dallam County: | 8.5% |
| Texas: | 8.9% |
| Dallam County: | 26.8% |
| State: | 26.6% |
| Here: | 12.2% |
| State: | 15.7% |
Agriculture in Dallam County:
Average size of farms: 2146 acresAverage value of agricultural products sold per farm: $897,376
Average value of crops sold per acre for harvested cropland: $332.36
The value of nursery, greenhouse, floriculture, and sod as a percentage of the total market value of agricultural products sold: 0.00%
The value of livestock, poultry, and their products as a percentage of the total market value of agricultural products sold: 77.49%
Average total farm production expenses per farm: $797,928
Harvested cropland as a percentage of land in farms: 28.31%
Irrigated harvested cropland as a percentage of land in farms: 84.01%
Average market value of all machinery and equipment per farm: $181,034
The percentage of farms operated by a family or individual: 74.03%
Average age of principal farm operators: 55 years
Average number of cattle and calves per 100 acres of all land in farms: 23.04
Corn for grain: 134820 harvested acres
All wheat for grain: 84154 harvested acres
Soybeans for beans: 1056 harvested acres
Tornado activity:
Dallam County historical area-adjusted tornado activity is significantly below Texas state average. It is 10648299.0 times below overall U.S. average.Earthquake activity:
Dallam County-area historical earthquake activity is significantly above Texas state average. It is 612% greater than the overall U.S. average.On 8/23/2011 at 05:46:18, a magnitude 5.3 (5.3 MW, Depth: 2.5 mi, Class: Moderate, Intensity: VI - VII) earthquake occurred 128.1 miles away from Dallam County center
On 8/10/2005 at 22:08:22, a magnitude 5.0 (5.0 MB, 4.7 MS, 5.0 MW) earthquake occurred 127.2 miles away from the county center
On 8/10/2005 at 22:08:22, a magnitude 5.0 (5.0 MW, Depth: 3.1 mi) earthquake occurred 131.3 miles away from the county center
On 9/3/2016 at 12:02:44, a magnitude 5.8 (5.8 MW, Depth: 3.5 mi) earthquake occurred 320.1 miles away from the county center
On 8/22/2011 at 23:30:19, a magnitude 4.7 (4.7 MW, Depth: 3.1 mi, Class: Light, Intensity: IV - V) earthquake occurred 119.9 miles away from Dallam County center
On 6/16/1978 at 11:46:54, a magnitude 5.3 (4.4 MB, 4.6 UK, 5.3 ML) earthquake occurred 244.0 miles away from the county center
Magnitude types: body-wave magnitude (MB), local magnitude (ML), surface-wave magnitude (MS), moment magnitude (MW)
Most recent natural disasters:
- Texas Covid-19 Pandemic, Incident Period: January 20, 2020, FEMA Id: 4485, Natural disaster type: Other
- Texas Wildfires, Incident Period: March 14, 2008 to September 01, 2008, Emergency Declared EM-3284: March 14, 2008, FEMA Id: 3284, Natural disaster type: Fire
- Texas Hurricane Rita, Incident Period: September 23, 2005 to October 14, 2005, Major Disaster (Presidential) Declared DR-1606: September 24, 2005, FEMA Id: 1606, Natural disaster type: Hurricane
- Texas Hurricane Rita, Incident Period: September 20, 2005 to October 14, 2005, Emergency Declared EM-3261: September 21, 2005, FEMA Id: 3261, Natural disaster type: Hurricane
- Texas Hurricane Katrina, Incident Period: August 29, 2005 to October 01, 2005, Emergency Declared EM-3216: September 02, 2005, FEMA Id: 3216, Natural disaster type: Hurricane
- Texas Extreme Fire Hazards, Incident Period: August 01, 1999 to December 10, 1999, Emergency Declared EM-3142: September 01, 1999, FEMA Id: 3142, Natural disaster type: Fire
The number of natural disasters in Dallam County (6) is a lot smaller than the US average (15).
Major Disasters (Presidential) Declared: 1
Emergencies Declared: 4
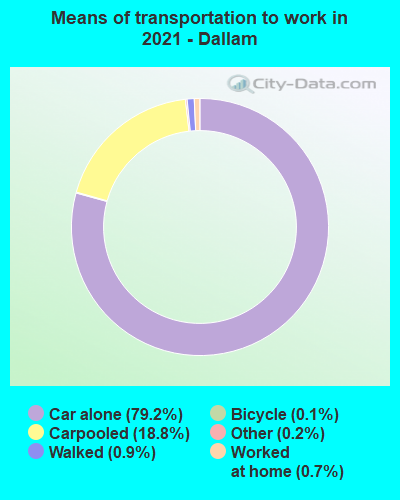
Means of transportation to work:
- Drove a car alone: 3,142 (76.0%)
- Carpooled: 761 (18.4%)
- Taxicab, motorcycle, or other means: 22 (0.5%)
- Bicycle: 1 (0.0%)
- Walked: 16 (0.4%)
- Worked at home: 61 (1.5%)
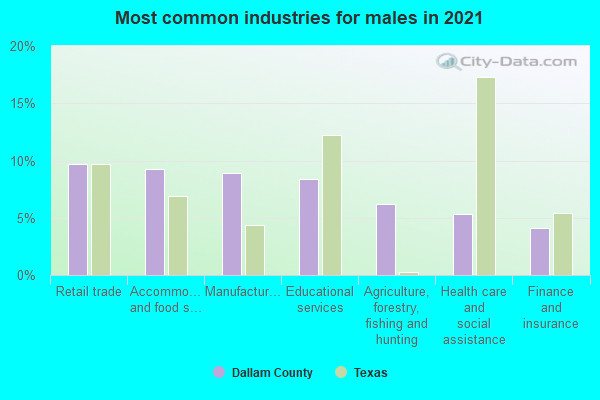
- Accommodation and food services (10%)
- Retail trade (6%)
- Manufacturing (6%)
- Agriculture, forestry, fishing and hunting (5%)
- Health care and social assistance (5%)
- Finance and insurance (4%)
- Public administration (4%)
- Accommodation and food services (19%)
- Retail trade (12%)
- Manufacturing (11%)
- Agriculture, forestry, fishing and hunting (10%)
- Health care and social assistance (9%)
- Finance and insurance (8%)
- Public administration (8%)
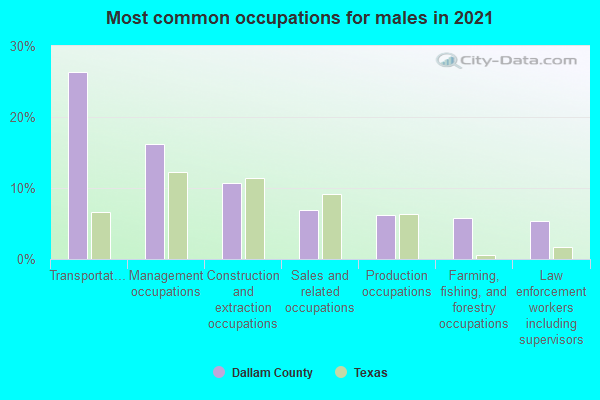
- Transportation occupations (29%)
- Management occupations (9%)
- Production occupations (8%)
- Material moving occupations (8%)
- Construction and extraction occupations (7%)
- Farming, fishing, and forestry occupations (6%)
- Office and administrative support occupations (5%)
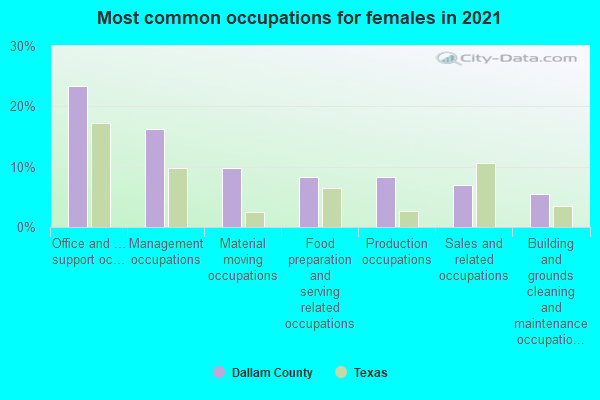
- Office and administrative support occupations (31%)
- Management occupations (19%)
- Food preparation and serving related occupations (10%)
- Production occupations (7%)
- Sales and related occupations (4%)
- Legal occupations (4%)
- Educational instruction, and library occupations (3%)
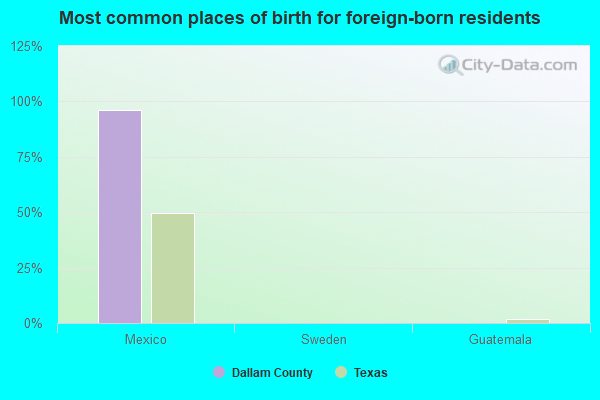
- Mexico (91%)
- South Africa (6%)
- Guatemala (1%)
- England (0%)
- Sweden (0%)
- United Kingdom, excluding England and Scotland (0%)
- Scotland (0%)
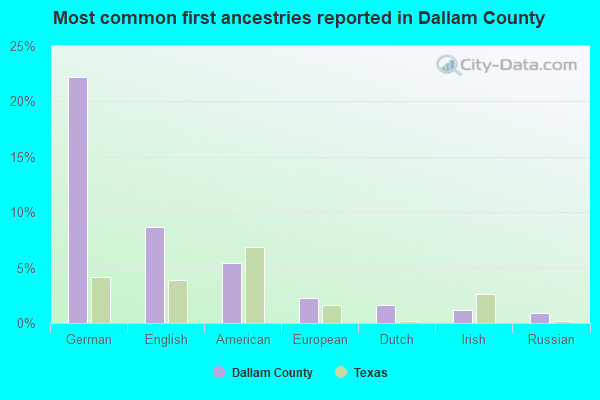
- German (13%)
- English (9%)
- American (9%)
- South African (3%)
- Irish (1%)
- Pennsylvania German (1%)
- Lebanese (1%)

12 people in local jails and other confinement facilities (including police lockups)
4 people in other noninstitutional group quarters
9.81% of this county's 2021 resident taxpayers lived in other counties in 2020 ($51,534 average adjusted gross income)
| Here: | 9.81% |
| Texas average: | 8.12% |
10 or fewer of this county's residents moved from foreign countries.
5.99% relocated from other counties in Texas ($36,165 average AGI)
3.82% relocated from other states ($15,369 average AGI)
Dallam County: 3.82% Texas average: 2.83%

Top counties from which taxpayers relocated into this county between 2020 and 2021:
| from Hartley County, TX |
10.27% of this county's 2020 resident taxpayers moved to other counties in 2021 ($47,286 average adjusted gross income)
| Here: | 10.27% |
| Texas average: | 7.40% |
10 or fewer of this county's residents moved to foreign countries.
7.49% relocated to other counties in Texas ($36,160 average AGI)
2.78% relocated to other states ($11,126 average AGI)
Dallam County: 2.78% Texas average: 2.08%
Top counties to which taxpayers relocated from this county between 2020 and 2021:
| to Hartley County, TX |
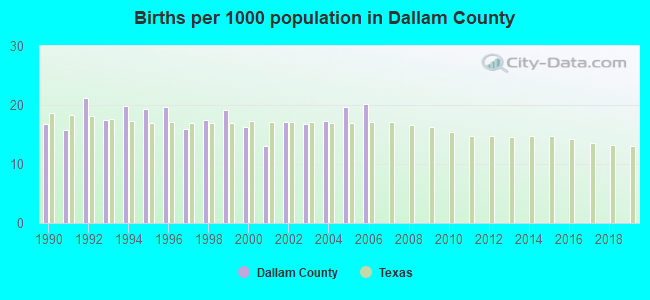
Births per 1000 population from 1990 to 1999: 18.2
Births per 1000 population from 2000 to 2006: 17.2
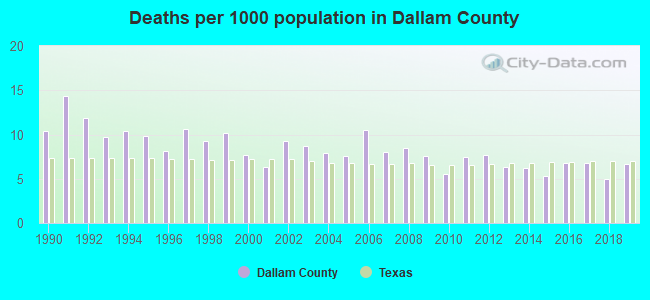
Deaths per 1000 population from 1990 to 1999: 10.5
Deaths per 1000 population from 2000 to 2009: 8.2
Deaths per 1000 population from 2010 to 2020: 6.8
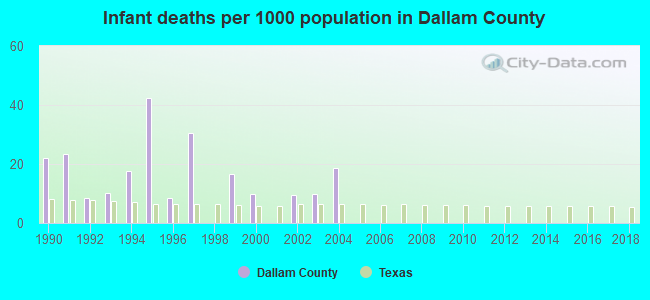
Infant deaths per 1000 live births from 1990 to 1999: 18.0
Infant deaths per 1000 live births from 2000 to 2006: 6.8
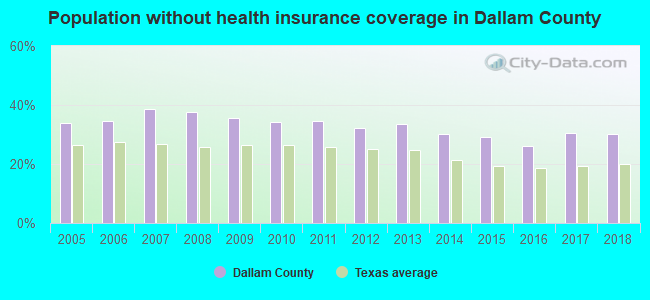
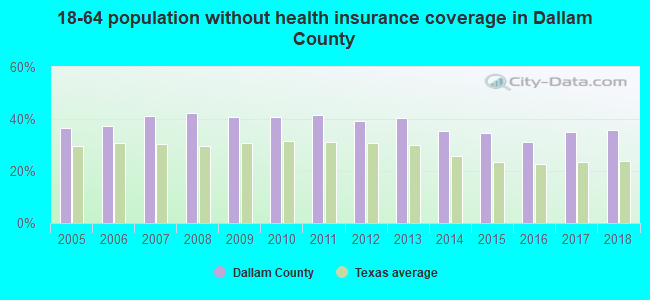
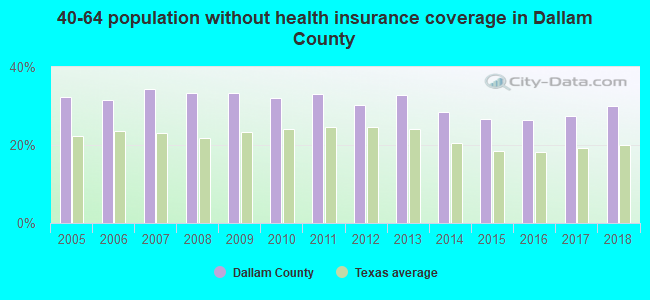
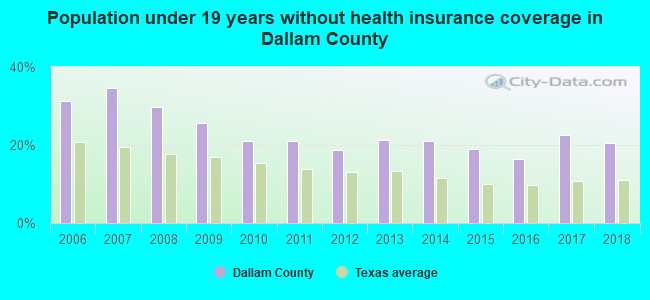
Persons under 19 years old without health insurance coverage in 2018: 20.4%

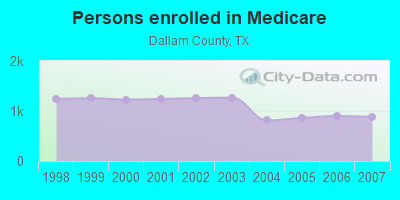
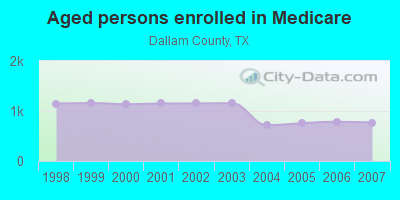
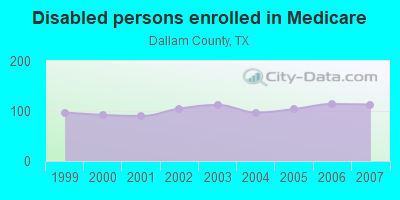
Persons enrolled in hospital insurance and/or supplemental medical insurance (Medicare) in July 1, 2007: 883 (770 aged, 113 disabled)
Children under 18 without health insurance coverage in 2007: 630 (33%)
Most common underlying causes of death in Dallam County, Texas in 1999 - 2019:
- Acute myocardial infarction, unspecified (10)
Population without health insurance coverage in 2000: 23%
Children under 18 without health insurance coverage in 2000: 23%
Short term general hospital admissions per 100,000 population in 2004: 9,927
Short term general hospital beds per 100,000 population in 2004: 1,652
Emergency room visits per 100,000 population in 2004: 75,789
General practice office based MDs per 100,000 population in 2005: 1,911
Medical specialist MDs per 100,000 population in 2005: 1,004
Dentists per 100,000 population in 1998: 32
Total births per 100,000 population, July 2005 - July 2006 : 30
Total deaths per 100,000 population, July 2005 - July 2006: 113
Crimes per 100,000 population in 1996: 1
Household type by relationship:
Households: 7,357- Male householders: 1,362 (572 living alone), Female householders: 1,101 (214 living alone)
1,461 spouses (1,461 opposite-sex spouses), 99 unmarried partners, (99 opposite-sex unmarried partners), 2,575 children (2,172 natural, 38 adopted, 365 stepchildren), 319 grandchildren, 0 brothers or sisters, 6 parents, 0 foster children, 69 other relatives, 298 non-relatives
- In group quarters: 40
Size of family households: 759 2-persons, 63 3-persons, 335 4-persons, 227 5-persons, 123 6-persons, 125 7-or-more-persons.
Size of nonfamily households: 787 1-person, 39 2-persons.
1,502 married couples with children.
362 single-parent households (191 men, 171 women).
66.1% of residents of Dallam speak English at home.
31.2% of residents speak Spanish at home (52% speak English very well, 10% speak English well, 14% speak English not well, 24% don't speak English at all).
2.8% of residents speak other Indo-European language at home (81% speak English very well, 18% speak English well, 1% speak English not well).
In fiscal year 2004:
Federal Government expenditure: $62,462,000 ($10,115 per capita)
Department of Defense expenditure: $622,000
Federal direct payments to individuals for retirement and disability: $18,120,000
Federal other direct payments to individuals: $10,190,000
Federal direct payments not to individuals: $20,897,000
Federal grants: $12,016,000
Federal procurement contracts: $182,000 ($0,000 Department of Defense)
Federal salaries and wages: $1,058,000 ($0,000 Department of Defense)
Federal Government direct loans: $790,000
Federal guaranteed/insured loans: $1,600,000
Federal Government insurance: $44,785,000
Population change from April 1, 2000 to July 1, 2005:
Births: 508| Here: | 82 per 1000 residents |
| State: | 85 per 1000 residents |
Deaths: 269
| Here: | 44 per 1000 residents |
| State: | 35 per 1000 residents |
Net international migration: +63
| Here: | +10 per 1000 residents |
| State: | +29 per 1000 residents |
Net internal migration: -343
| Here: | |
| State: |
Total withdrawal of fresh water for public supply: 2.33 millions of gallons per day (all from ground)
| Here: | 6.0 |
| State: | 6.3 |
| Here: | 4.1 |
| State: | 4.0 |
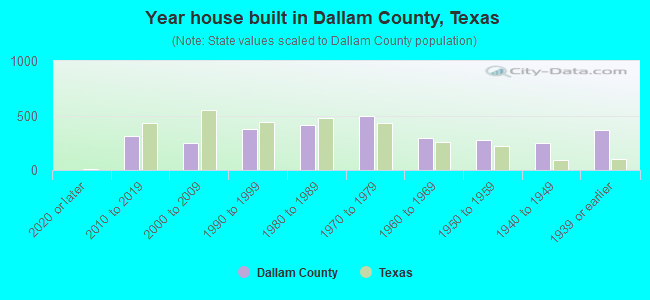
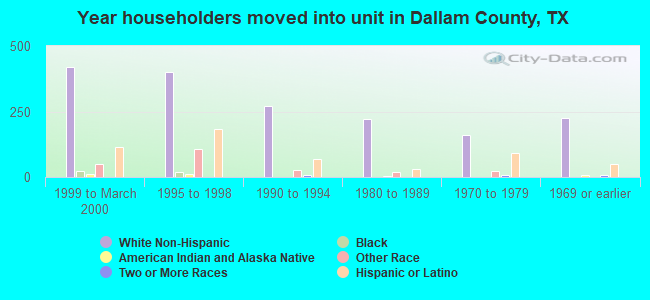
- Year house built in Dallam County, Texas
- 32020 or later
- 1632010 to 2019
- 4152000 to 2009
- 4071990 to 1999
- 3421980 to 1989
- 5111970 to 1979
- 2441960 to 1969
- 3401950 to 1959
- 1761940 to 1949
- 3851939 or earlier
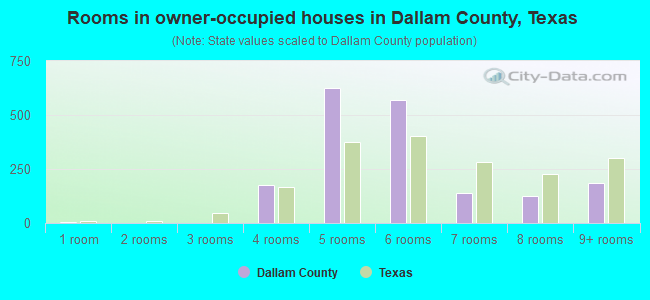
- Rooms in owner-occupied houses in Dallam County, Texas
- 161 room
- 02 rooms
- 03 rooms
- 1764 rooms
- 2895 rooms
- 7656 rooms
- 2797 rooms
- 1208 rooms
- 1209+ rooms
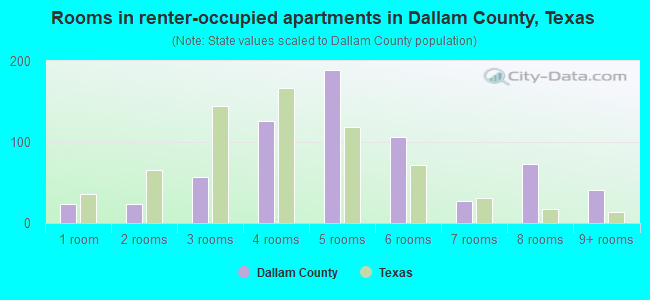
- Rooms in renter-occupied apartments in Dallam County, Texas
- 761 room
- 362 rooms
- 1563 rooms
- 1444 rooms
- 1705 rooms
- 726 rooms
- 37 rooms
- 58 rooms
- 389+ rooms
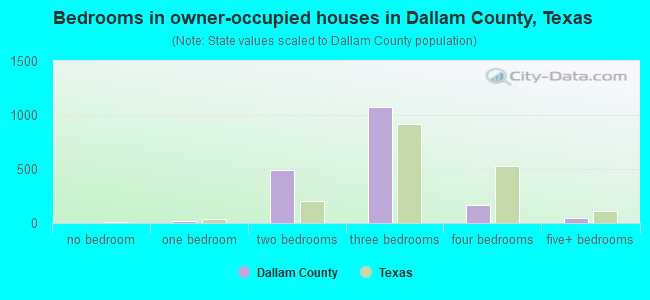
- Bedrooms in owner-occupied houses in Dallam County, Texas
- 18no bedroom
- 491 bedroom
- 3682 bedrooms
- 1,0413 bedrooms
- 2444 bedrooms
- 425+ bedrooms
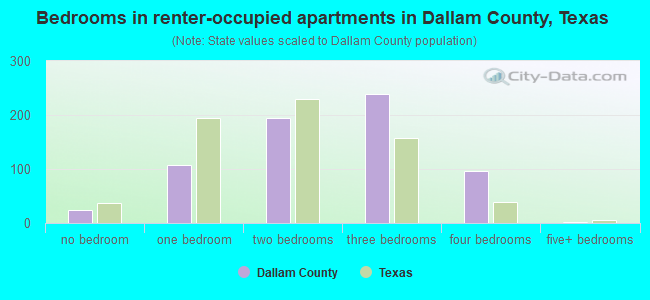
- Bedrooms in renter-occupied apartments in Dallam County, Texas
- 75no bedroom
- 1021 bedroom
- 3152 bedrooms
- 1633 bedrooms
- 374 bedrooms
- 105+ bedrooms

- Cars and other vehicles available in Dallam County in owner-occupied houses/condos
- 24no vehicle
- 3471 vehicle
- 6602 vehicles
- 2663 vehicles
- 3734 vehicles
- 935+ vehicles
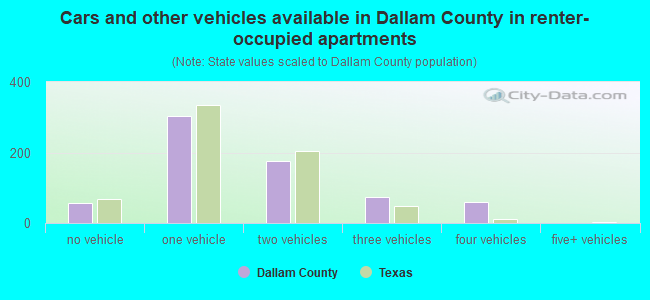
- Cars and other vehicles available in Dallam County in renter-occupied apartments
- 63no vehicle
- 4351 vehicle
- 932 vehicles
- 593 vehicles
- 524 vehicles
- 05+ vehicles
85.5% of Dallam County residents lived in the same house 1 years ago.
Out of people who lived in different houses, 38% lived in this county.
Out of people who lived in different counties, 58% lived in Texas.
| Dallam County: | 85.5% |
| State average: | 85.7% |
Place of birth for U.S.-born residents:
- This state: 3,734
- Other state: 1,844
- Northeast: 48
- Midwest: 666
- South: 320
- West: 824
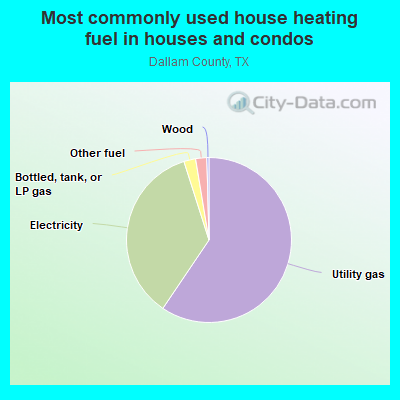
- 61.7%Utility gas
- 33.0%Electricity
- 2.5%Bottled, tank, or LP gas
- 2.2%Other fuel
- 0.5%Wood
- 0.2%No fuel used
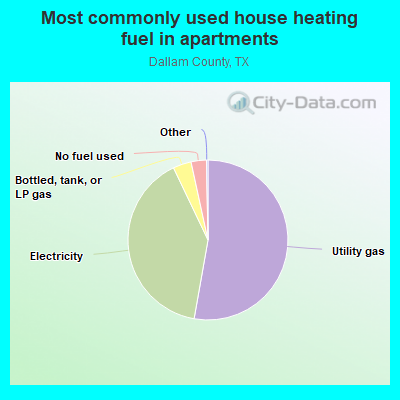
- 50.1%Utility gas
- 45.1%Electricity
- 4.4%No fuel used
- 0.5%Bottled, tank, or LP gas
Private vs. public school enrollment:
| Here: | 12.5% |
| Texas: | 8.8% |
| Here: | 15.6% |
| Texas: | 8.0% |
| Here: | 2.2% |
| Texas: | 16.2% |


Dallam County government finances - Expenditure in 2017:
- Current Operations - Correctional Institutions: $789,000
Judicial and Legal Services: $585,000
Regular Highways: $565,000
Central Staff Services: $549,000
Police Protection: $516,000
Financial Administration: $317,000
Natural Resources - Other: $248,000
General Public Buildings: $225,000
Local Fire Protection: $120,000
Libraries: $82,000
Corrections - Other: $51,000
Parks and Recreation: $40,000
Health - Other: $33,000
Public Welfare - Other: $19,000
- Federal Intergovernmental - Other: $185,000
- General - Interest on Debt: $25,000
- Long Term Debt - Beginning Outstanding - Unspecified Public Purpose: $549,000
Outstanding Unspecified Public Purpose: $392,000
Retired Unspecified Public Purpose: $157,000
- Miscellaneous - Fines and Forfeits: $409,000
Interest Earnings: $1,000
- Other Capital Outlay - Regular Highways: $133,000
- Other Funds - Cash and Securities: $782,000
- State Intergovernmental - Highways: $24,000
- Tax - Property: $3,166,000
Motor Vehicle License: $566,000
Alcoholic Beverage License: $3,000
- Total Salaries and Wages: $1,969,000
Dallam County government finances - Revenue in 2017:
- Current Operations - Correctional Institutions: $789,000
Judicial and Legal Services: $585,000
Regular Highways: $565,000
Central Staff Services: $549,000
Police Protection: $516,000
Financial Administration: $317,000
Natural Resources - Other: $248,000
General Public Buildings: $225,000
Local Fire Protection: $120,000
Libraries: $82,000
Corrections - Other: $51,000
Parks and Recreation: $40,000
Health - Other: $33,000
Public Welfare - Other: $19,000
- Federal Intergovernmental - Other: $185,000
- General - Interest on Debt: $25,000
- Long Term Debt - Beginning Outstanding - Unspecified Public Purpose: $549,000
Outstanding Unspecified Public Purpose: $392,000
Retired Unspecified Public Purpose: $157,000
- Miscellaneous - Fines and Forfeits: $409,000
Interest Earnings: $1,000
- Other Capital Outlay - Regular Highways: $133,000
- Other Funds - Cash and Securities: $782,000
- State Intergovernmental - Highways: $24,000
- Tax - Property: $3,166,000
Motor Vehicle License: $566,000
Alcoholic Beverage License: $3,000
- Total Salaries and Wages: $1,969,000
Dallam County government finances - Debt in 2017:
- Current Operations - Correctional Institutions: $789,000
Judicial and Legal Services: $585,000
Regular Highways: $565,000
Central Staff Services: $549,000
Police Protection: $516,000
Financial Administration: $317,000
Natural Resources - Other: $248,000
General Public Buildings: $225,000
Local Fire Protection: $120,000
Libraries: $82,000
Corrections - Other: $51,000
Parks and Recreation: $40,000
Health - Other: $33,000
Public Welfare - Other: $19,000
- Federal Intergovernmental - Other: $185,000
- General - Interest on Debt: $25,000
- Long Term Debt - Beginning Outstanding - Unspecified Public Purpose: $549,000
Outstanding Unspecified Public Purpose: $392,000
Retired Unspecified Public Purpose: $157,000
- Miscellaneous - Fines and Forfeits: $409,000
Interest Earnings: $1,000
- Other Capital Outlay - Regular Highways: $133,000
- Other Funds - Cash and Securities: $782,000
- State Intergovernmental - Highways: $24,000
- Tax - Property: $3,166,000
Motor Vehicle License: $566,000
Alcoholic Beverage License: $3,000
- Total Salaries and Wages: $1,969,000
Dallam County government finances - Cash and Securities in 2017:
- Current Operations - Correctional Institutions: $789,000
Judicial and Legal Services: $585,000
Regular Highways: $565,000
Central Staff Services: $549,000
Police Protection: $516,000
Financial Administration: $317,000
Natural Resources - Other: $248,000
General Public Buildings: $225,000
Local Fire Protection: $120,000
Libraries: $82,000
Corrections - Other: $51,000
Parks and Recreation: $40,000
Health - Other: $33,000
Public Welfare - Other: $19,000
- Federal Intergovernmental - Other: $185,000
- General - Interest on Debt: $25,000
- Long Term Debt - Beginning Outstanding - Unspecified Public Purpose: $549,000
Outstanding Unspecified Public Purpose: $392,000
Retired Unspecified Public Purpose: $157,000
- Miscellaneous - Fines and Forfeits: $409,000
Interest Earnings: $1,000
- Other Capital Outlay - Regular Highways: $133,000
- Other Funds - Cash and Securities: $782,000
- State Intergovernmental - Highways: $24,000
- Tax - Property: $3,166,000
Motor Vehicle License: $566,000
Alcoholic Beverage License: $3,000
- Total Salaries and Wages: $1,969,000
Supplemental Security Income (SSI) in 2006:
- Total number of recipients: 111
- Number of aged recipients: 27
- Number of blind and disabled recipients: 84
- Number of recipients under 18: 14
- Number of recipients between 18 and 64: 57
- Number of recipients older than 64: 40
- Number of recipients also receiving OASDI: 52
- Amount of payments (thousands of dollars): 55
| Most common first names in Dallam County, TX among deceased individuals | ||
| Name | Count | Lived (average) |
|---|---|---|
| Mary | 67 | 80.5 years |
| John | 53 | 73.8 years |
| James | 47 | 76.2 years |
| William | 42 | 78.7 years |
| Robert | 39 | 77.6 years |
| Ruth | 29 | 79.4 years |
| Charles | 22 | 76.6 years |
| George | 20 | 76.5 years |
| Joe | 19 | 75.2 years |
| Raymond | 18 | 75.7 years |
| Most common last names in Dallam County, TX among deceased individuals | ||
| Last name | Count | Lived (average) |
|---|---|---|
| Brown | 29 | 77.3 years |
| Smith | 26 | 78.5 years |
| Williams | 20 | 84.0 years |
| Johnson | 19 | 77.3 years |
| Thompson | 16 | 76.9 years |
| Hall | 15 | 80.1 years |
| Moore | 15 | 74.1 years |
| White | 14 | 71.2 years |
| Jones | 13 | 74.7 years |
| Davis | 13 | 76.0 years |
| Businesses in Dallam County, TX | ||||
| Name | Count | Name | Count | |
|---|---|---|---|---|
| Alco Stores | 1 | Nike | 1 | |
| Best Western | 1 | RadioShack | 1 | |
| Chevrolet | 1 | Rodeway Inn | 1 | |
| Days Inn | 1 | SONIC Drive-In | 1 | |
| Econo Lodge | 1 | Sears | 1 | |
| FedEx | 1 | Subway | 1 | |
| H&R Block | 1 | Super 8 | 1 | |
| Holiday Inn | 1 | True Value | 1 | |
| La-Z-Boy | 1 | U-Haul | 1 | |
| Lane Furniture | 1 | UPS | 1 | |
| McDonald's | 1 | |||