Dallas County, Missouri (MO)
County owner-occupied free and clear houses and condos in 2010: 2,128
County owner-occupied houses and condos in 2000: 4,774
Renter-occupied apartments: 1,476 (it was 1,256 in 2000)
| % of renters here: | 21% |
| State: | 31% |
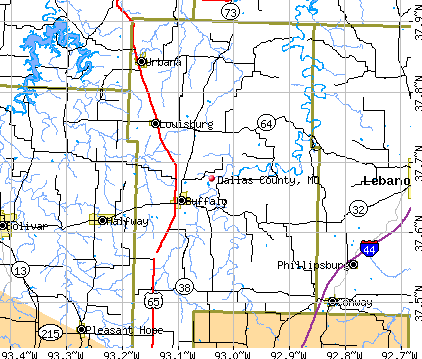
Land area: 542 sq. mi.
Water area: 1.3 sq. mi.
Population density: 32 people per square mile (low).
Industries providing employment: Educational, health and social services (21.8%), Manufacturing (14.1%), Retail trade (12.9%), Transportation and warehousing,and utilities (10.7%).
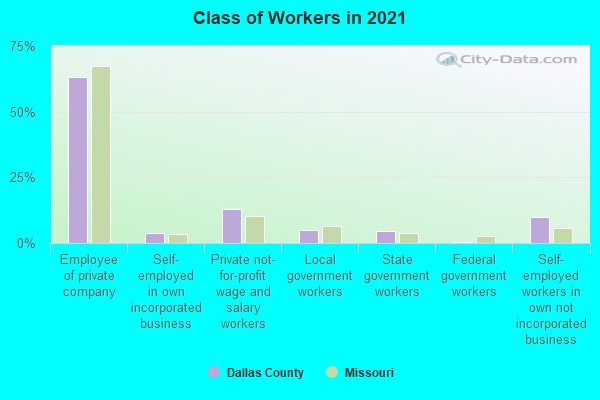
Type of workers:
- Private wage or salary: 79%
- Government: 11%
- Self-employed, not incorporated: 10%
- Unpaid family work: 0%
- OSM Map
- General Map
- Google Map
- MSN Map

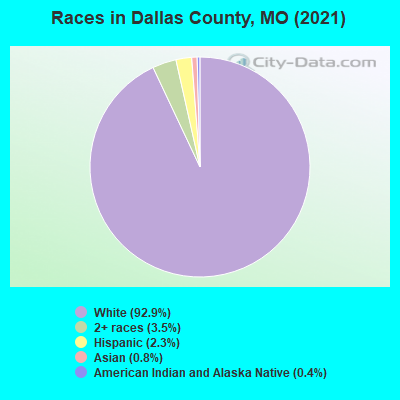
- 15,88392.2%White Non-Hispanic Alone
- 8434.9%Two or more races
- 4342.5%Hispanic or Latino
- 310.2%American Indian and Alaska Native alone
- 210.1%Asian alone
- 140.08%Black Non-Hispanic Alone
| Median resident age: | 42.0 years |
| Missouri median age: | 39.1 years |
| Males: 8,421 | |
| Females: 8,802 |

 | Your Feedback on these Springfield Suburbs (13 replies) |
| Best county or town with easy zoning/rules/laws within 50 miles of Springfield? (7 replies) |
| Bolivar? (25 replies) |
| Best town for us? (16 replies) |
| Small towns north of Springfield, south of Clinton (5 replies) |
| What about Buffalo???? (2 replies) |
| Dallas County: | 2.0 people |
| Missouri: | 2 people |
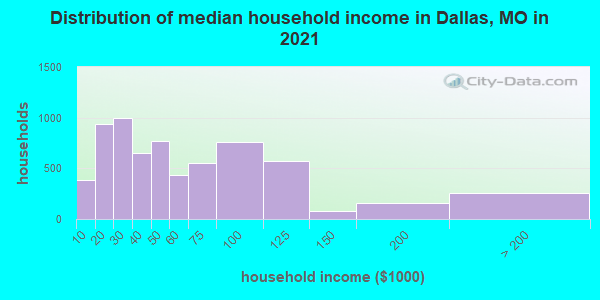
Estimated median household income in 2022: $45,763 ($27,346 in 1999)
| This county: | $45,763 |
| Missouri: | $64,811 |
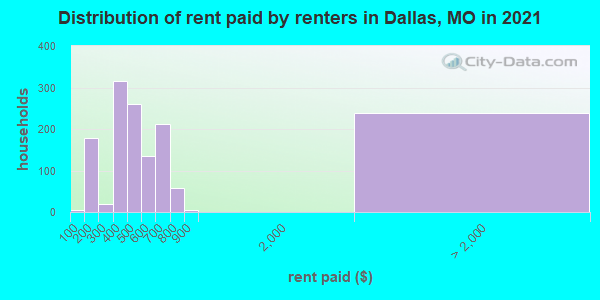
Median contract rent in 2022 for apartments: $455 (lower quartile is $368, upper quartile is $622)
| This county: | $455 |
| State: | $757 |
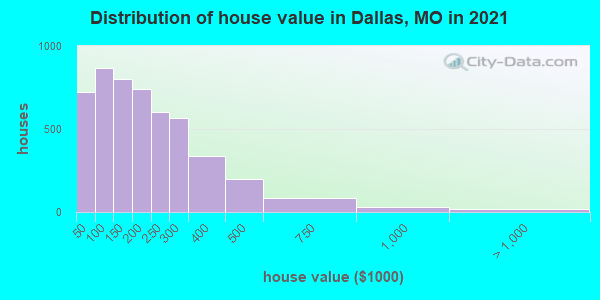
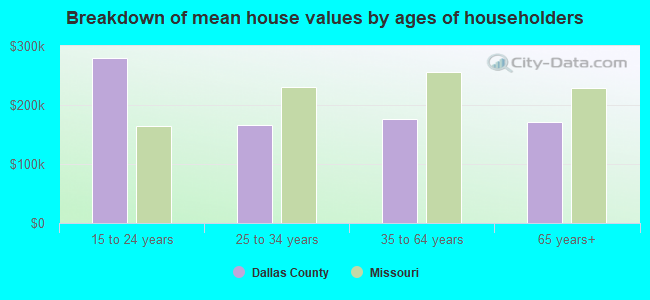
Estimated median house or condo value in 2022: $154,640 (it was $70,200 in 2000)
| Dallas: | $154,640 |
| Missouri: | $221,200 |
Median monthly housing costs for homes and condos with a mortgage: $1,037
Median monthly housing costs for units without a mortgage: $333
Institutionalized population: 168
Crime in 2021 (reported by the sheriff's office or county police, not the county total):
- Murders: 0
- Rapes: 0
- Robberies: 0
- Assaults: 2
- Burglaries: 3
- Thefts: 9
- Auto thefts: 3
Crime in 2020 (reported by the sheriff's office or county police, not the county total):
- Murders: 0
- Rapes: 0
- Robberies: 0
- Assaults: 1
- Burglaries: 14
- Thefts: 25
- Auto thefts: 1
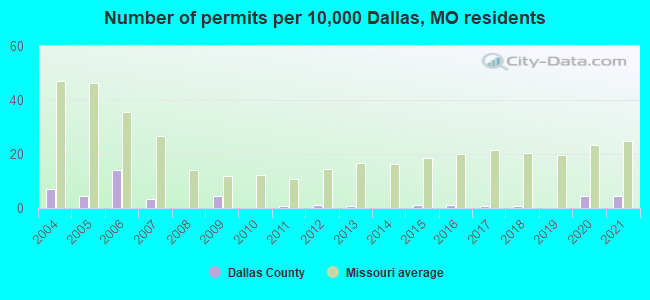
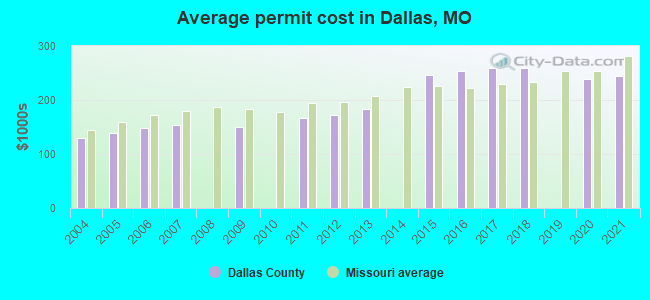
Single-family new house construction building permits:
- 2022: 12 buildings, average cost: $263,800
- 2021: 7 buildings, average cost: $244,800
- 2020: 7 buildings, average cost: $237,700
- 2019: 0 buildings
- 2018: 1 building, cost: $258,500
- 2017: 1 building, cost: $258,700
- 2016: 2 buildings, average cost: $254,100
- 2015: 2 buildings, average cost: $246,100
- 2014: 0 buildings
- 2013: 1 building, cost: $183,300
- 2012: 2 buildings, average cost: $172,600
- 2011: 1 building, cost: $167,300
- 2010: 0 buildings
- 2009: 7 buildings, average cost: $150,000
- 2008: 0 buildings
- 2007: 5 buildings, average cost: $152,800
- 2006: 22 buildings, average cost: $149,000
- 2005: 7 buildings, average cost: $138,100
- 2004: 11 buildings, average cost: $129,600
Median real estate property taxes paid for housing units with mortgages in 2022: $729 (0.4%)
Median real estate property taxes paid for housing units with no mortgage in 2022: $763 (0.6%)
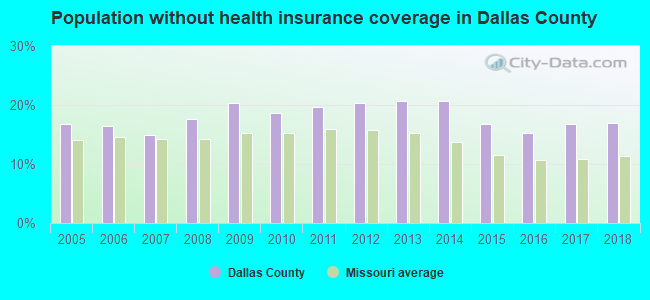
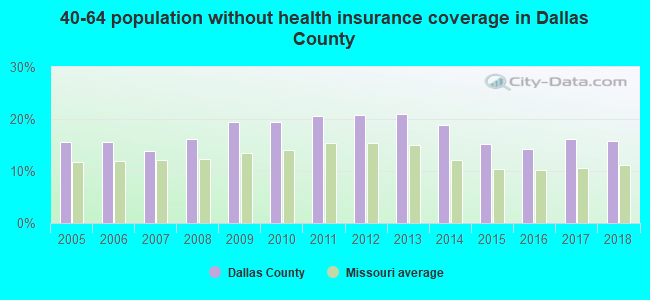
| Dallas County: | 21.2% |
| Missouri: | 13.2% |
Median age of residents in 2022: 42.0 years old
(Males: 41.1 years old, Females: 42.9 years old)
(Median age for: White residents: 42.6 years old, Black residents: 18.9 years old, American Indian residents: 55.9 years old, Hispanic or Latino residents: 28.8 years old, Other race residents: 68.1 years old)
Fair market rent in 2006 for a 1-bedroom apartment in Dallas County is $392 a month.
Fair market rent for a 2-bedroom apartment is $464 a month.
Fair market rent for a 3-bedroom apartment is $633 a month.
Neighboring counties: Coffey County, Kansas  , Dent County
  , Montezuma County, Colorado
  , Rockbridge County, Virginia .
| Here: | 2.9% |
| Missouri: | 2.8% |
Current college students: 446
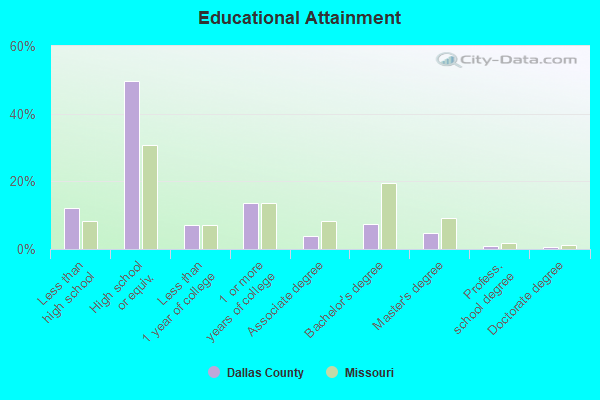
People 25 years of age or older with a high school degree or higher: 88.9%
People 25 years of age or older with a bachelor's degree or higher: 13.3%
Number of foreign born residents: 244 (68.4% naturalized citizens)
| Dallas County: | 1.4% |
| Whole state: | 4.1% |
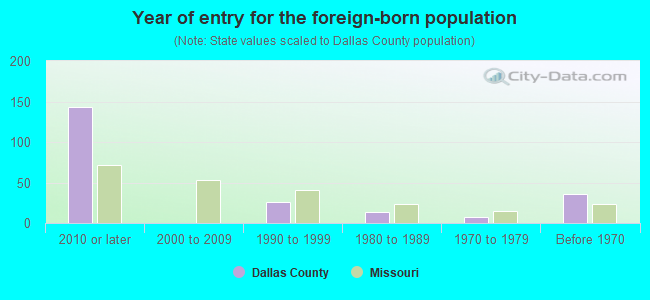
- Year of entry for the foreign-born population
- 782010 or later
- 902000 to 2009
- 281990 to 1999
- 131980 to 1989
- 81970 to 1979
- 36Before 1970
Mean travel time to work (commute): minutes
Percentage of county residents living and working in this county: 96.2%
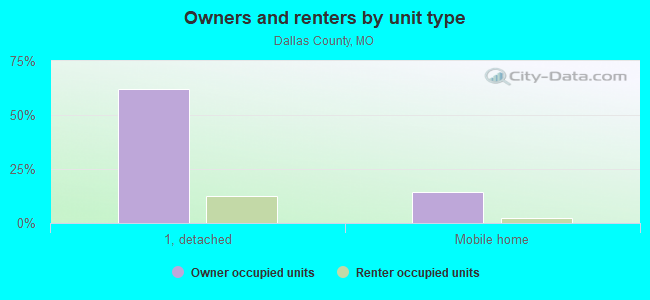
Housing units in structures:
- One, detached: 5,779
- One, attached: 42
- Two: 147
- 3 or 4: 262
- 5 to 9: 74
- 10 to 19: 20
- 20 or more: 26
- Mobile homes: 1,234
- Boats, RVs, vans, etc.: 16
Housing units in Dallas County with a mortgage: 2,695 (146 second mortgage, 0 home equity loan, 135 both second mortgage and home equity loan)
Houses without a mortgage: 167
| Here: | 1.2% with mortgage |
| State: | 98.0% with mortgage |
Religion statistics for Dallas County
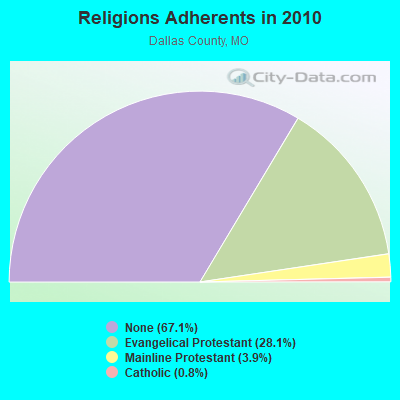
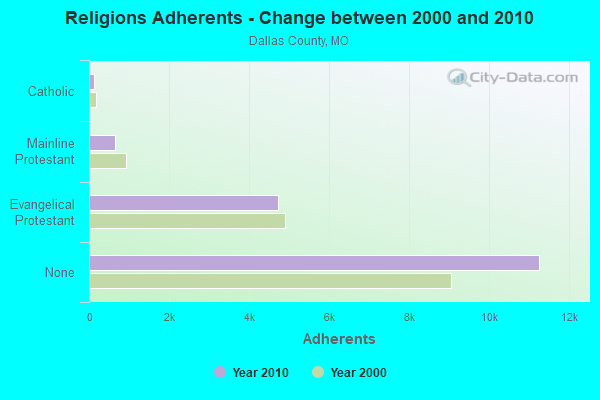
| Religion | Adherents | Congregations |
|---|---|---|
| Evangelical Protestant | 4,722 | 26 |
| Mainline Protestant | 658 | 3 |
| Catholic | 129 | 1 |
| Other | 9 | 1 |
| None | 11,259 | - |
Source: Clifford Grammich, Kirk Hadaway, Richard Houseal, Dale E.Jones, Alexei Krindatch, Richie Stanley and Richard H.Taylor. 2012. 2010 U.S.Religion Census: Religious Congregations & Membership Study. Association of Statisticians of American Religious Bodies. Jones, Dale E., et al. 2002. Congregations and Membership in the United States 2000. Nashville, TN: Glenmary Research Center.
Food Environment Statistics:
| Dallas County: | 2.97 / 10,000 pop. |
| State: | 1.88 / 10,000 pop. |
| This county: | 1.19 / 10,000 pop. |
| Missouri: | 0.60 / 10,000 pop. |
| Dallas County: | 6.54 / 10,000 pop. |
| Missouri: | 4.34 / 10,000 pop. |
| This county: | 2.97 / 10,000 pop. |
| State: | 7.37 / 10,000 pop. |
| Dallas County: | 8.9% |
| Missouri: | 8.8% |
| Dallas County: | 30.6% |
| State: | 29.6% |
| Here: | 13.0% |
| State: | 13.5% |
Agriculture in Dallas County:
Average size of farms: 189 acresAverage value of agricultural products sold per farm: $29,501
Average value of crops sold per acre for harvested cropland: $36.74
The value of nursery, greenhouse, floriculture, and sod as a percentage of the total market value of agricultural products sold: 0.26%
The value of livestock, poultry, and their products as a percentage of the total market value of agricultural products sold: 93.77%
Average total farm production expenses per farm: $24,854
Harvested cropland as a percentage of land in farms: 26.48%
Average market value of all machinery and equipment per farm: $29,362
The percentage of farms operated by a family or individual: 96.06%
Average age of principal farm operators: 55 years
Average number of cattle and calves per 100 acres of all land in farms: 25.45
Milk cows as a percentage of all cattle and calves: 10.77%
Corn for grain: 103 harvested acres
All wheat for grain: 440 harvested acres
Soybeans for beans: 124 harvested acres
Vegetables: 17 harvested acres
Land in orchards: 171 acres
Earthquake activity:
Dallas County-area historical earthquake activity is significantly above Missouri state average. It is 516% greater than the overall U.S. average.On 9/3/2016 at 12:02:44, a magnitude 5.8 (5.8 MW, Depth: 3.5 mi, Class: Moderate, Intensity: VI - VII) earthquake occurred 231.4 miles away from Dallas County center
On 11/6/2011 at 03:53:10, a magnitude 5.7 (5.7 MW, Depth: 3.2 mi) earthquake occurred 254.4 miles away from the county center
On 5/4/1991 at 01:18:54, a magnitude 5.0 (4.4 MB, 4.6 LG, 5.0 LG, Depth: 3.1 mi) earthquake occurred 193.4 miles away from the county center
On 9/26/1990 at 13:18:51, a magnitude 5.0 (4.7 MB, 4.8 LG, 5.0 LG, Depth: 7.7 mi) earthquake occurred 195.8 miles away from the county center
On 3/25/1976 at 00:41:20, a magnitude 5.0 (4.9 MB, 5.0 LG) earthquake occurred 206.3 miles away from Dallas County center
On 4/18/2008 at 09:36:59, a magnitude 5.4 (5.1 MB, 4.8 MS, 5.4 MW, 5.2 MW) earthquake occurred 285.8 miles away from the county center
Magnitude types: regional Lg-wave magnitude (LG), body-wave magnitude (MB), surface-wave magnitude (MS), moment magnitude (MW)
Most recent natural disasters:
- Missouri Severe Storms, Tornadoes, Straight-line Winds, And Flooding, Incident Period: May 3, 2020 - May 4, 2020, Major Disaster (Presidential) Declared DR-4552-MO: July 9, 2020, FEMA Id: 4552, Natural disaster type: Storm, Tornado, Flood, Wind
- Missouri Covid-19 Pandemic, Incident Period: January 20, 2020, FEMA Id: 4490, Natural disaster type: Other
- Missouri Severe Storms, Tornadoes, And Flooding, Incident Period: April 29, 2019, FEMA Id: 4451, Natural disaster type: Storm, Tornado, Flood
- Missouri Severe Storms, Tornadoes, Straight-line Winds, And Flooding, Incident Period: April 28, 2017 - May 11, 2017, FEMA Id: 4317, Natural disaster type: Storm, Tornado, Flood, Wind
- Missouri Severe Storms, Tornadoes, Straight-line Winds, and Flooding, Incident Period: December 23, 2015 to January 09, 2016, Major Disaster (Presidential) Declared DR-4250: January 21, 2016, FEMA Id: 4250, Natural disaster type: Storm, Tornado, Flood, Wind
- Missouri Severe Storms, Tornadoes, Straight-line Winds, and Flooding, Incident Period: December 22, 2015 to January 09, 2016, Emergency Declared EM-3374: January 02, 2016, FEMA Id: 3374, Natural disaster type: Storm, Tornado, Flood, Wind
- Missouri Severe Storms, Tornadoes, Straight-line Winds, and Flooding, Incident Period: May 15, 2015 to July 27, 2015, Major Disaster (Presidential) Declared DR-4238: August 07, 2015, FEMA Id: 4238, Natural disaster type: Storm, Tornado, Flood, Wind
- Missouri Severe Storms, Straight-line Winds, and Flooding, Incident Period: August 02, 2013 to August 14, 2013, Major Disaster (Presidential) Declared DR-4144: September 06, 2013, FEMA Id: 4144, Natural disaster type: Storm, Flood, Wind
- Missouri Severe Winter Storm and Snowstorm, Incident Period: January 31, 2011 to February 05, 2011, Major Disaster (Presidential) Declared DR-1961: March 23, 2011, FEMA Id: 1961, Natural disaster type: Snowstorm, Winter Storm
- Missouri Severe Winter Storm, Incident Period: January 31, 2011 to February 05, 2011, Emergency Declared EM-3317: February 03, 2011, FEMA Id: 3317, Natural disaster type: Winter Storm
- 14 other natural disasters have been reported since 1953.
The number of natural disasters in Dallas County (24) is greater than the US average (15).
Major Disasters (Presidential) Declared: 15
Emergencies Declared: 6
Causes of natural disasters: Floods: 16, Storms: 15, Tornadoes: 12, Winds: 6, Winter Storms: 5, Drought: 1, Heavy Rain: 1, Hurricane: 1, Snowstorm: 1, Other: 1 (Note: some incidents may be assigned to more than one category).
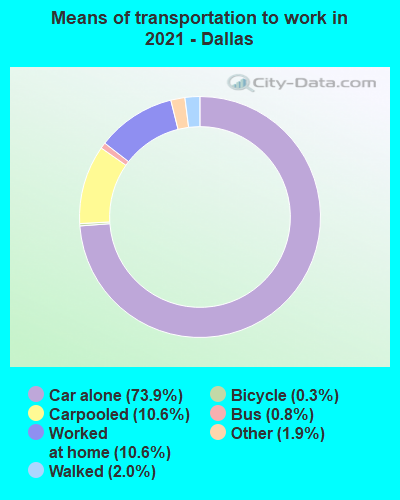
Means of transportation to work:
- Drove a car alone: 2,445 (67.1%)
- Carpooled: 423 (11.6%)
- Bus: 9 (0.2%)
- Taxicab, motorcycle, or other means: 83 (2.3%)
- Bicycle: 54 (1.5%)
- Walked: 46 (1.3%)
- Worked at home: 636 (17.5%)
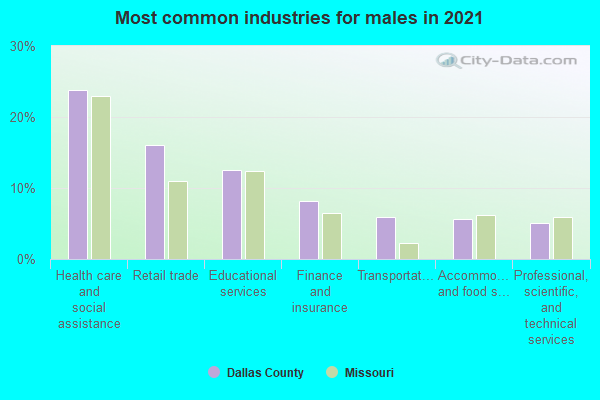
- Health care and social assistance (20%)
- Retail trade (16%)
- Educational services (14%)
- Finance and insurance (8%)
- Accommodation and food services (7%)
- Transportation and warehousing (6%)
- Other services, except public administration (6%)

- Health care and social assistance (21%)
- Retail trade (16%)
- Educational services (15%)
- Finance and insurance (9%)
- Accommodation and food services (7%)
- Transportation and warehousing (7%)
- Other services, except public administration (6%)
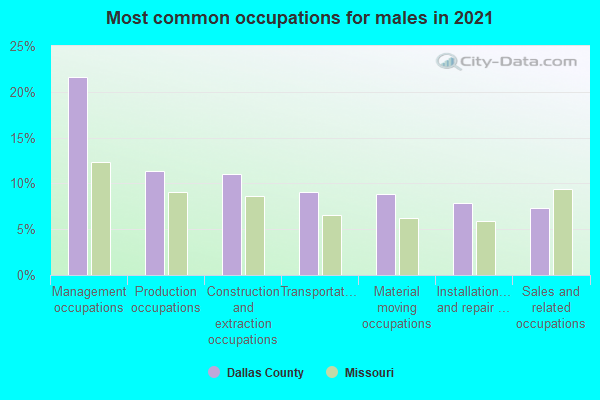
- Management occupations (18%)
- Transportation occupations (12%)
- Production occupations (12%)
- Material moving occupations (12%)
- Construction and extraction occupations (11%)
- Installation, maintenance, and repair occupations (10%)
- Sales and related occupations (5%)
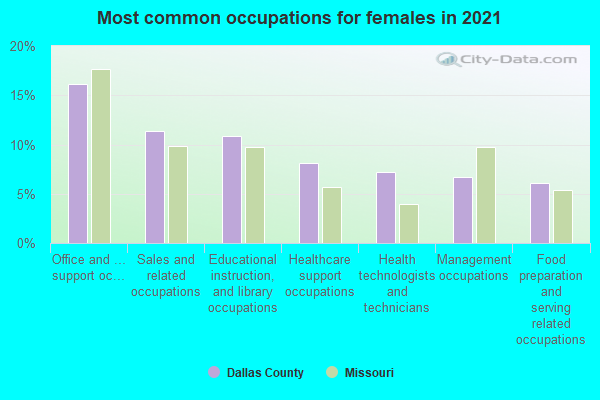
- Office and administrative support occupations (14%)
- Sales and related occupations (12%)
- Educational instruction, and library occupations (11%)
- Healthcare support occupations (9%)
- Food preparation and serving related occupations (9%)
- Health diagnosing and treating practitioners and other technical occupations (6%)
- Management occupations (6%)
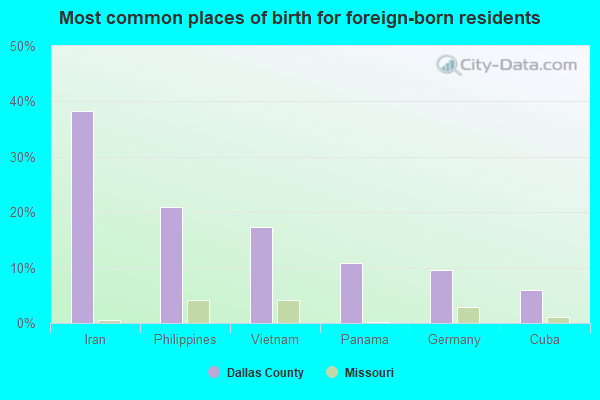
- Romania (27%)
- Iran (27%)
- Russia (15%)
- Hungary (9%)
- Germany (9%)
- Panama (8%)
- Vietnam (6%)
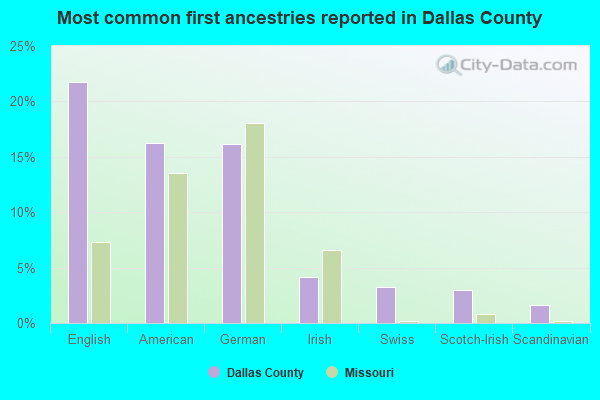
- American (21%)
- English (20%)
- German (13%)
- Irish (4%)
- Swiss (3%)
- Scotch-Irish (3%)
- European (2%)
People in group quarters in Dallas County, Missouri in 2010:
- 154 people in nursing facilities/skilled-nursing facilities
- 25 people in workers' group living quarters and job corps centers
- 14 people in local jails and other municipal confinement facilities
- 6 people in group homes intended for adults
People in group quarters in Dallas County, Missouri in 2000:
- 93 people in nursing homes
- 15 people in local jails and other confinement facilities (including police lockups)
- 13 people in college dormitories (includes college quarters off campus)
- 12 people in homes for the mentally retarded
- 11 people in other noninstitutional group quarters
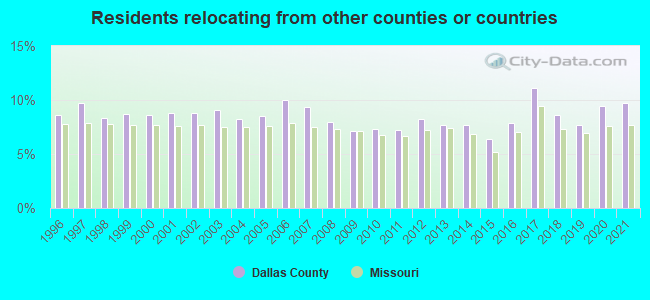
9.76% of this county's 2021 resident taxpayers lived in other counties in 2020 ($40,058 average adjusted gross income)
| Here: | 9.76% |
| Missouri average: | 7.67% |
10 or fewer of this county's residents moved from foreign countries.
7.34% relocated from other counties in Missouri ($29,136 average AGI)
2.42% relocated from other states ($10,922 average AGI)
Dallas County: 2.42% Missouri average: 3.04%
Top counties from which taxpayers relocated into this county between 2020 and 2021:
| from Greene County, MO | |
| from Polk County, MO | |
| from Laclede County, MO | |
| from Webster County, MO | |
| from Christian County, MO | |
| from Hickory County, MO |
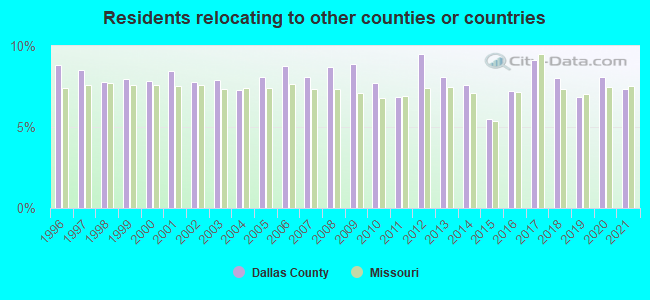
7.35% of this county's 2020 resident taxpayers moved to other counties in 2021 ($36,169 average adjusted gross income)
| Here: | 7.35% |
| Missouri average: | 7.51% |
10 or fewer of this county's residents moved to foreign countries.
6.06% relocated to other counties in Missouri ($28,998 average AGI)
1.29% relocated to other states ($7,169 average AGI)
Dallas County: 1.29% Missouri average: 2.88%
Top counties to which taxpayers relocated from this county between 2020 and 2021:
| to Greene County, MO | |
| to Polk County, MO | |
| to Laclede County, MO | |
| to Hickory County, MO | |
| to Webster County, MO |
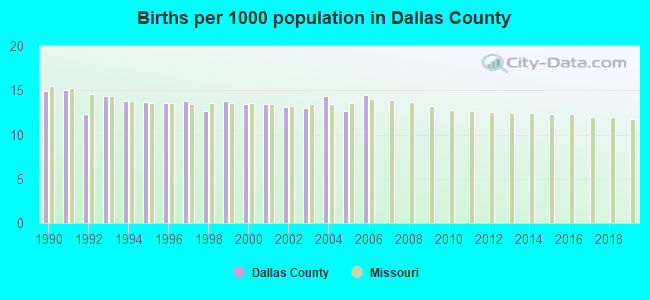
Births per 1000 population from 1990 to 1999: 13.8
Births per 1000 population from 2000 to 2006: 13.5
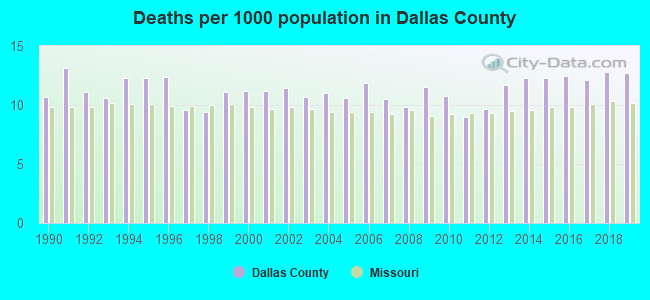
Deaths per 1000 population from 1990 to 1999: 11.3
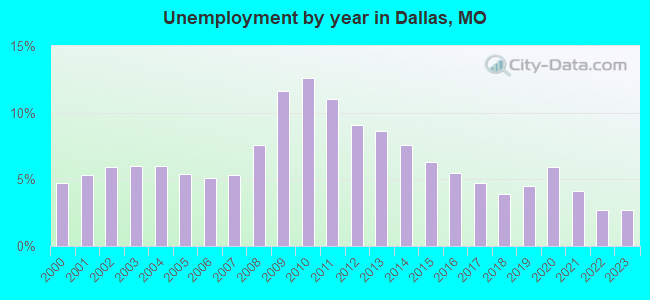
Deaths per 1000 population from 2000 to 2009: 11.0
Deaths per 1000 population from 2010 to 2020: 12.1
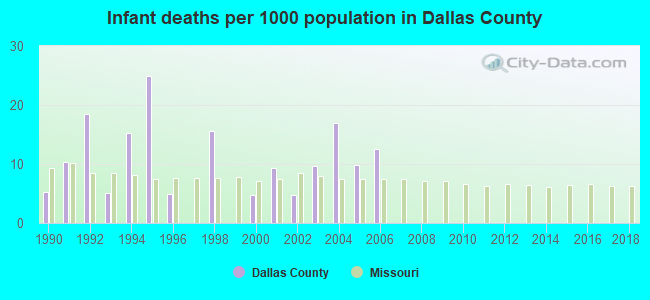
Infant deaths per 1000 live births from 1990 to 1999: 10.0
Infant deaths per 1000 live births from 2000 to 2006: 9.7
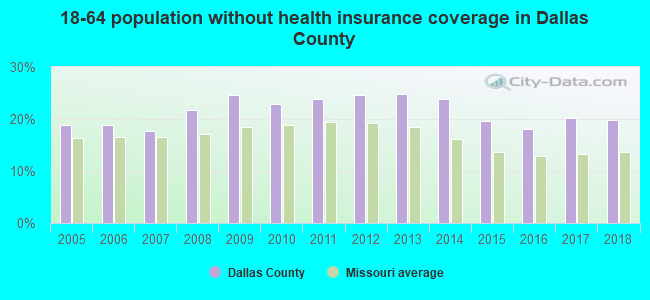
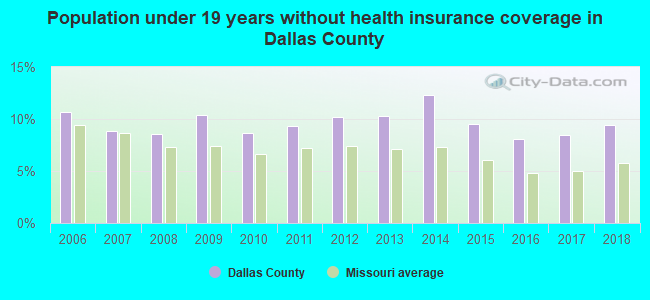
Persons under 19 years old without health insurance coverage in 2018: 9.4%
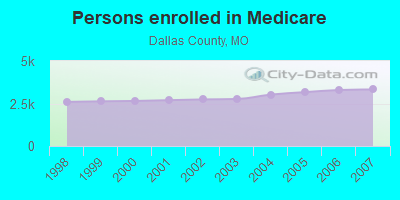
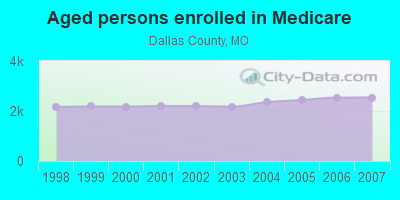
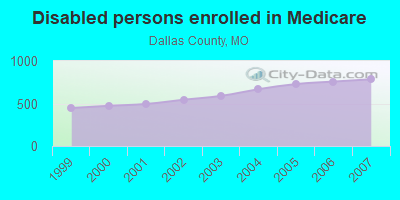
Persons enrolled in hospital insurance and/or supplemental medical insurance (Medicare) in July 1, 2007: 3,325 (2,540 aged, 785 disabled)
Children under 18 without health insurance coverage in 2007: 350 (8%)
Most common underlying causes of death in Dallas County, Missouri in 1999 - 2019:
- Acute myocardial infarction, unspecified (379)
- Bronchus or lung, unspecified - Malignant neoplasms (281)
- Chronic obstructive pulmonary disease, unspecified (151)
- Unspecified dementia (115)
- Atherosclerotic heart disease (76)
- Congestive heart failure (20)
- Stroke, not specified as haemorrhage or infarction (12)
- Pneumonia, unspecified (10)
Population without health insurance coverage in 2000: 17%
Children under 18 without health insurance coverage in 2000: 15%
Medical specialist MDs per 100,000 population in 2005: 1,144
Dentists per 100,000 population in 1998: 6
Total births per 100,000 population, July 2005 - July 2006 : 20
Total deaths per 100,000 population, July 2005 - July 2006: 79
Limited-service eating places per 100,000 population in 2005 : 12
Suicides per 1,000,000 population from 2000 to 2006: 187.5. This is more than state average.
Household type by relationship:
Households: 17,223- Male householders: 3,602 (873 living alone), Female householders: 3,162 (909 living alone)
3,776 spouses (3,711 opposite-sex spouses), 293 unmarried partners, (293 opposite-sex unmarried partners), 4,961 children (4,128 natural, 181 adopted, 650 stepchildren), 483 grandchildren, 201 brothers or sisters, 57 parents, 0 foster children, 266 other relatives, 163 non-relatives
- In group quarters: 214
Size of family households: 2,595 2-persons, 769 3-persons, 799 4-persons, 353 5-persons, 83 6-persons, 160 7-or-more-persons.
Size of nonfamily households: 1,782 1-person, 213 2-persons.
2,777 married couples with children.
722 single-parent households (257 men, 465 women).
95.1% of residents of Dallas speak English at home.
0.7% of residents speak Spanish at home (92% speak English very well, 8% speak English well).
4.1% of residents speak other Indo-European language at home (64% speak English very well, 32% speak English well, 4% speak English not well).
0.1% of residents speak other language at home (100% speak English very well).
In fiscal year 2004:
Federal Government expenditure: $85,657,000 ($5,246 per capita)
Department of Defense expenditure: $2,290,000
Federal direct payments to individuals for retirement and disability: $40,585,000
Federal other direct payments to individuals: $18,243,000
Federal direct payments not to individuals: $335,000
Federal grants: $23,696,000
Federal procurement contracts: $549,000 ($3,000 Department of Defense)
Federal salaries and wages: $2,249,000 ($0,000 Department of Defense)
Federal Government direct loans: $53,000
Federal guaranteed/insured loans: $4,276,000
Federal Government insurance: $4,000
Population change from April 1, 2000 to July 1, 2005:
Births: 1,103| Here: | 67 per 1000 residents |
| State: | 69 per 1000 residents |
Deaths: 892
| Here: | 54 per 1000 residents |
| State: | 49 per 1000 residents |
Net international migration: +20
| Here: | +1 per 1000 residents |
| State: | +7 per 1000 residents |
Net internal migration: +564
| Here: | +34 per 1000 residents |
| State: | +5 per 1000 residents |
Total withdrawal of fresh water for public supply: 0.54 millions of gallons per day (all from ground)
| Here: | 6.2 |
| State: | 6.4 |
| Here: | 4.8 |
| State: | 4.4 |
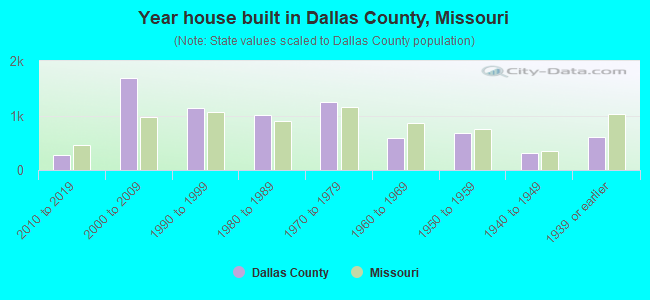
- Year house built in Dallas County, Missouri
- 472020 or later
- 3562010 to 2019
- 1,7172000 to 2009
- 1,0561990 to 1999
- 8661980 to 1989
- 1,2811970 to 1979
- 5561960 to 1969
- 7301950 to 1959
- 3451940 to 1949
- 6141939 or earlier
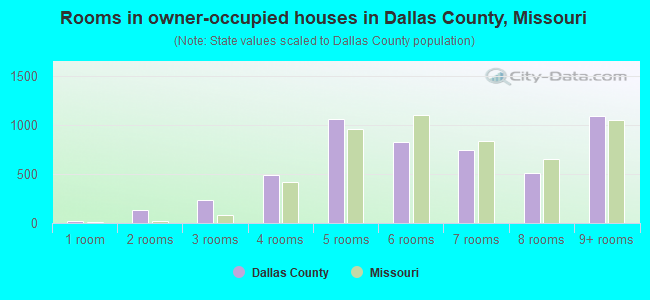
- Rooms in owner-occupied houses in Dallas County, Missouri
- 361 room
- 1092 rooms
- 2483 rooms
- 4494 rooms
- 1,1315 rooms
- 8266 rooms
- 7157 rooms
- 5608 rooms
- 1,0779+ rooms
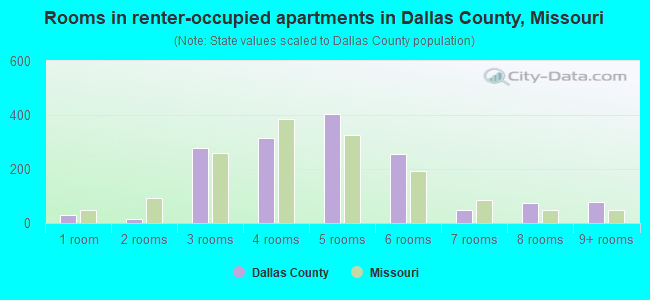
- Rooms in renter-occupied apartments in Dallas County, Missouri
- 281 room
- 332 rooms
- 2703 rooms
- 3594 rooms
- 3855 rooms
- 2776 rooms
- 777 rooms
- 968 rooms
- 1289+ rooms
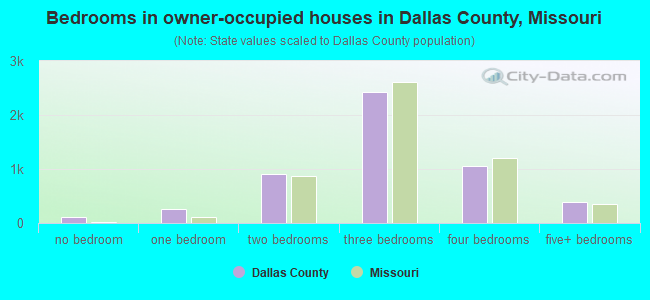
- Bedrooms in owner-occupied houses in Dallas County, Missouri
- 133no bedroom
- 2331 bedroom
- 9492 bedrooms
- 2,4133 bedrooms
- 1,1044 bedrooms
- 3315+ bedrooms
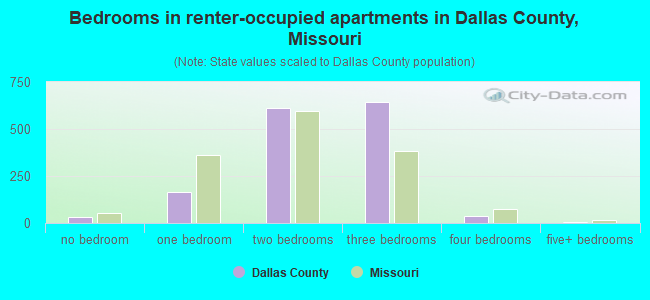
- Bedrooms in renter-occupied apartments in Dallas County, Missouri
- 28no bedroom
- 2271 bedroom
- 7312 bedrooms
- 5663 bedrooms
- 844 bedrooms
- 145+ bedrooms
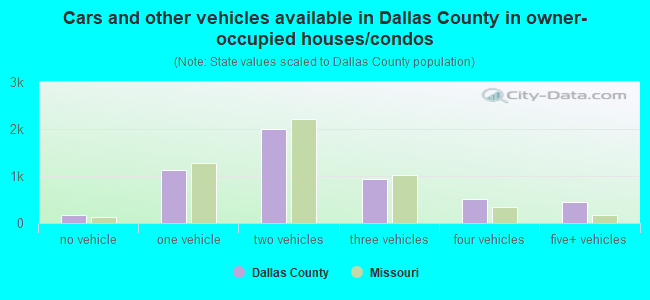
- Cars and other vehicles available in Dallas County in owner-occupied houses/condos
- 205no vehicle
- 1,0751 vehicle
- 2,0002 vehicles
- 9843 vehicles
- 4804 vehicles
- 3865+ vehicles
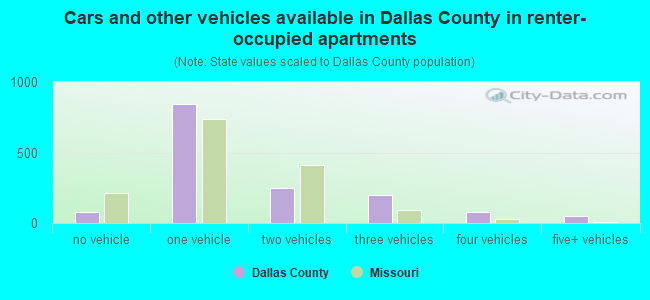
- Cars and other vehicles available in Dallas County in renter-occupied apartments
- 135no vehicle
- 9551 vehicle
- 2152 vehicles
- 2153 vehicles
- 834 vehicles
- 465+ vehicles
91.4% of Dallas County residents lived in the same house 1 years ago.
Out of people who lived in different houses, 27% lived in this county.
Out of people who lived in different counties, 59% lived in Missouri.
| Dallas County: | 91.4% |
| State average: | 87.1% |
Place of birth for U.S.-born residents:
- This state: 10,612
- Other state: 6,275
- Northeast: 533
- Midwest: 2,306
- South: 1,629
- West: 1,834
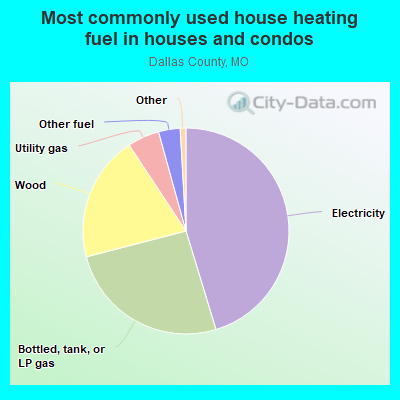
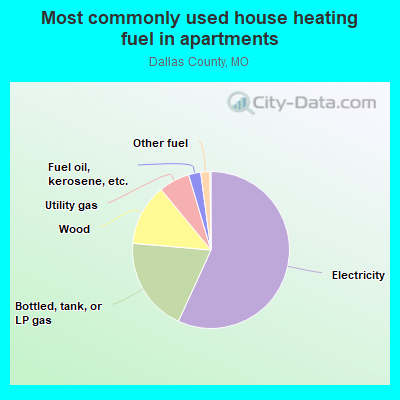
- 46.6%Electricity
- 24.9%Bottled, tank, or LP gas
- 20.1%Wood
- 3.7%Utility gas
- 3.5%Other fuel
- 1.3%Fuel oil, kerosene, etc.
- 54.5%Electricity
- 21.7%Bottled, tank, or LP gas
- 13.9%Wood
- 5.5%Utility gas
- 3.1%Fuel oil, kerosene, etc.
- 1.3%Other fuel
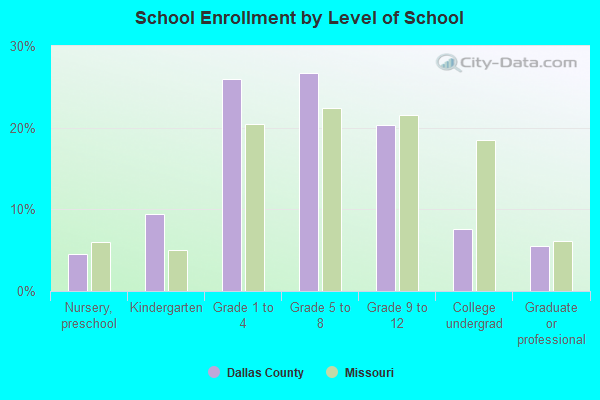
Private vs. public school enrollment:
| Here: | 16.8% |
| Missouri: | 15.4% |
| Here: | 4.2% |
| Missouri: | 13.9% |
| Here: | 23.4% |
| Missouri: | 22.6% |
Dallas County government finances - Expenditure in 2018:
- Current Operations - Police Protection: $994,000
General - Other: $220,000
Central Staff Services: $165,000
- Federal Intergovernmental - Highways: $17,000
- General - Interest on Debt: $7,000
- Long Term Debt - Outstanding Unspecified Public Purpose: $164,000
Beginning Outstanding - Unspecified Public Purpose: $164,000
- Miscellaneous - Fines and Forfeits: $18,000
Interest Earnings: $15,000
- Other Funds - Cash and Securities: $1,380,000
- State Intergovernmental - Highways: $18,000
- Tax - General Sales and Gross Receipts: $2,088,000
Property: $725,000
- Total Salaries and Wages: $1,894,000
Dallas County government finances - Revenue in 2018:
- Current Operations - Police Protection: $994,000
General - Other: $220,000
Central Staff Services: $165,000
- Federal Intergovernmental - Highways: $17,000
- General - Interest on Debt: $7,000
- Long Term Debt - Outstanding Unspecified Public Purpose: $164,000
Beginning Outstanding - Unspecified Public Purpose: $164,000
- Miscellaneous - Fines and Forfeits: $18,000
Interest Earnings: $15,000
- Other Funds - Cash and Securities: $1,380,000
- State Intergovernmental - Highways: $18,000
- Tax - General Sales and Gross Receipts: $2,088,000
Property: $725,000
- Total Salaries and Wages: $1,894,000
Dallas County government finances - Debt in 2018:
- Current Operations - Police Protection: $994,000
General - Other: $220,000
Central Staff Services: $165,000
- Federal Intergovernmental - Highways: $17,000
- General - Interest on Debt: $7,000
- Long Term Debt - Outstanding Unspecified Public Purpose: $164,000
Beginning Outstanding - Unspecified Public Purpose: $164,000
- Miscellaneous - Fines and Forfeits: $18,000
Interest Earnings: $15,000
- Other Funds - Cash and Securities: $1,380,000
- State Intergovernmental - Highways: $18,000
- Tax - General Sales and Gross Receipts: $2,088,000
Property: $725,000
- Total Salaries and Wages: $1,894,000
Dallas County government finances - Cash and Securities in 2018:
- Current Operations - Police Protection: $994,000
General - Other: $220,000
Central Staff Services: $165,000
- Federal Intergovernmental - Highways: $17,000
- General - Interest on Debt: $7,000
- Long Term Debt - Outstanding Unspecified Public Purpose: $164,000
Beginning Outstanding - Unspecified Public Purpose: $164,000
- Miscellaneous - Fines and Forfeits: $18,000
Interest Earnings: $15,000
- Other Funds - Cash and Securities: $1,380,000
- State Intergovernmental - Highways: $18,000
- Tax - General Sales and Gross Receipts: $2,088,000
Property: $725,000
- Total Salaries and Wages: $1,894,000
Supplemental Security Income (SSI) in 2006:
- Total number of recipients: 490
- Number of aged recipients: 55
- Number of blind and disabled recipients: 435
- Number of recipients under 18: 52
- Number of recipients between 18 and 64: 335
- Number of recipients older than 64: 103
- Number of recipients also receiving OASDI: 223
- Amount of payments (thousands of dollars): 196
| Most common first names in Dallas County, MO among deceased individuals | ||
| Name | Count | Lived (average) |
|---|---|---|
| William | 98 | 76.4 years |
| John | 94 | 74.8 years |
| James | 85 | 74.9 years |
| Mary | 65 | 80.9 years |
| Charles | 57 | 78.1 years |
| Robert | 50 | 72.5 years |
| George | 50 | 76.9 years |
| Frank | 27 | 74.1 years |
| Ethel | 26 | 88.7 years |
| Henry | 26 | 81.0 years |
| Most common last names in Dallas County, MO among deceased individuals | ||
| Last name | Count | Lived (average) |
|---|---|---|
| Smith | 49 | 75.9 years |
| Miller | 40 | 75.3 years |
| Williams | 36 | 79.4 years |
| Brown | 30 | 78.4 years |
| Johnson | 30 | 77.6 years |
| Owens | 28 | 76.4 years |
| Wilson | 24 | 75.2 years |
| Davis | 22 | 80.5 years |
| Cox | 21 | 70.8 years |
| Evans | 21 | 73.8 years |
| Businesses in Dallas County, MO | ||||
| Name | Count | Name | Count | |
|---|---|---|---|---|
| Dairy Queen | 1 | Nike | 1 | |
| FedEx | 1 | Pizza Hut | 1 | |
| Ford | 1 | RadioShack | 1 | |
| H&R Block | 1 | SONIC Drive-In | 1 | |
| Hardee's | 1 | Subway | 1 | |
| KFC | 1 | Taco Bell | 1 | |
| Lane Furniture | 1 | U-Haul | 2 | |
| MasterBrand Cabinets | 1 | UPS | 1 | |
| McDonald's | 1 | Walmart | 1 | |