Dearborn County, Indiana (IN)
County owner-occupied free and clear houses and condos in 2010: 3,565
County owner-occupied houses and condos in 2000: 13,228
Renter-occupied apartments: 4,036 (it was 3,604 in 2000)
| % of renters here: | 21% |
| State: | 30% |
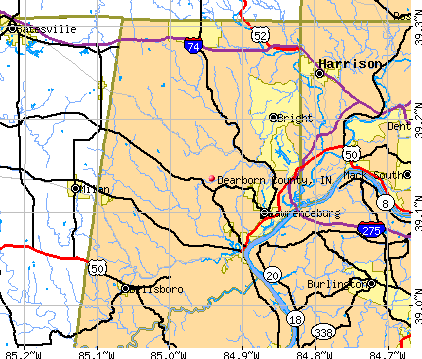
Land area: 305 sq. mi.
Water area: 1.8 sq. mi.
Population density: 167 people per square mile (high).
Industries providing employment: Educational, health and social services (22.9%), Manufacturing (17.2%), Retail trade (11.5%).
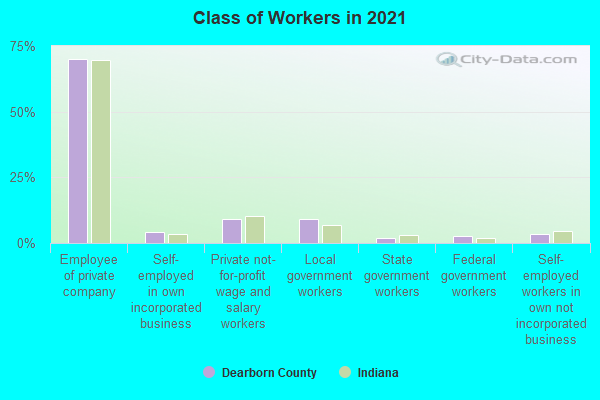
Type of workers:
- Private wage or salary: 83%
- Government: 13%
- Self-employed, not incorporated: 4%
- Unpaid family work: 0%
- OSM Map
- General Map
- Google Map
- MSN Map

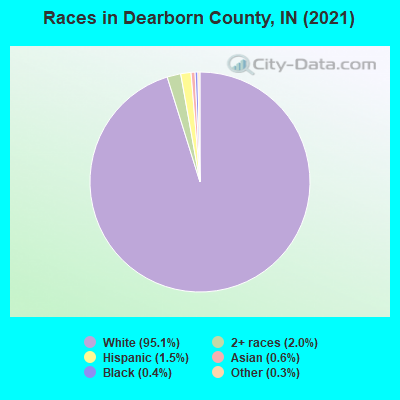
- 48,02594.9%White Non-Hispanic Alone
- 1,0002.0%Two or more races
- 7771.5%Hispanic or Latino
- 2850.6%Asian alone
- 2590.5%Black Non-Hispanic Alone
- 2110.4%Some other race alone
- 470.09%Native Hawaiian and Other
Pacific Islander alone - 90.02%American Indian and Alaska Native alone
| Median resident age: | 42.5 years |
| Indiana median age: | 38.2 years |
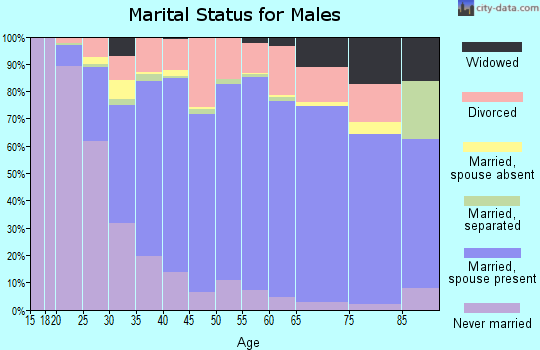
| Males: 25,500 | |
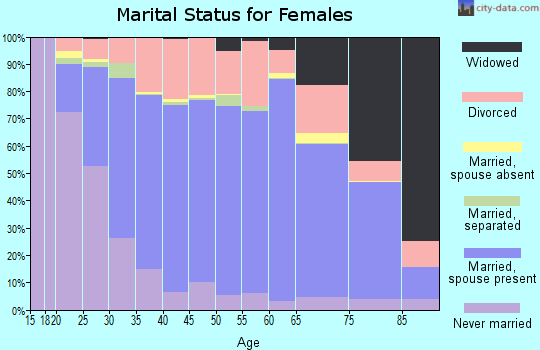
| Females: 25,572 |

 | Relocation: Rising Sun vs Aurora vs Lawrenceburg (5 replies) |
| Where to meet successful professional guys in their 30s in Indy? (85 replies) |
| New Harrison area (5 replies) |
| Madison, IN Questions (28 replies) |
| Hidden Valley Lake area (1 reply) |
| Ripley County (8 replies) |
| Dearborn County: | 2.0 people |
| Indiana: | 3 people |
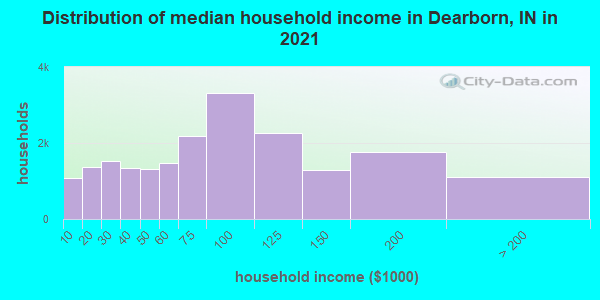
Estimated median household income in 2022: $79,887 ($48,899 in 1999)
| This county: | $79,887 |
| Indiana: | $66,785 |
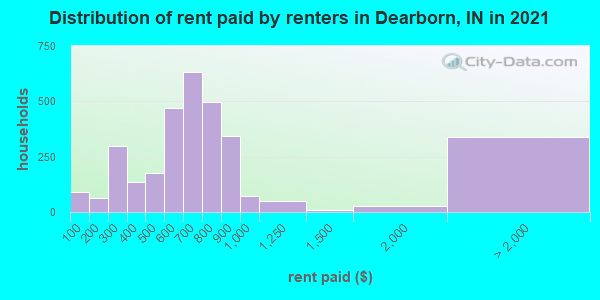
Median contract rent in 2022 for apartments: $678 (lower quartile is $499, upper quartile is $890)
| This county: | $678 |
| State: | $780 |
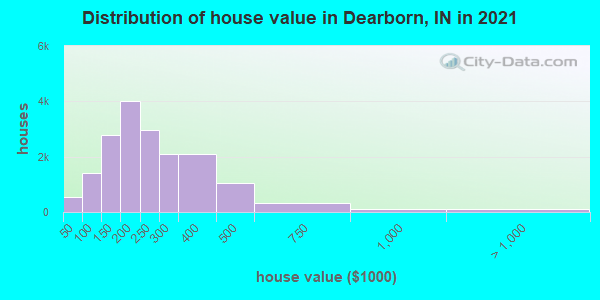
Estimated median house or condo value in 2022: $239,619 (it was $123,100 in 2000)
| Dearborn: | $239,619 |
| Indiana: | $208,700 |
Mean price in 2022:
Median monthly housing costs for homes and condos with a mortgage: $1,393Detached houses: $270,003
Here: $270,003 State: $257,916 Townhouses or other attached units: $195,639
Here: $195,639 State: $224,114 In 2-unit structures: $149,155
Here: $149,155 State: $175,375 In 3-to-4-unit structures: $168,044
Here: $168,044 State: $151,116 In 5-or-more-unit structures: $94,439
Here: $94,439 State: $200,844 Mobile homes: $114,377
Here: $114,377 State: $67,116
Median monthly housing costs for units without a mortgage: $482
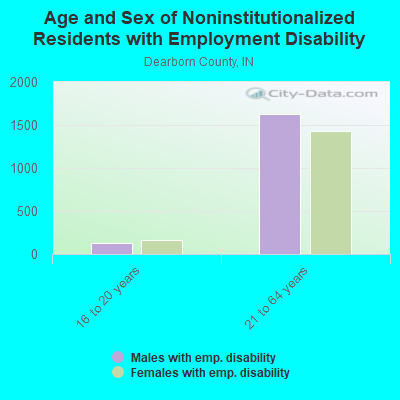
Institutionalized population: 480
Crime in 2012 (reported by the sheriff's office or county police, not the county total):
- Murders: 0
- Rapes: 1
- Robberies: 0
- Assaults: 0
- Burglaries: 10
- Thefts: 4
- Auto thefts: 0
Crime in 2011 (reported by the sheriff's office or county police, not the county total):
- Murders: 0
- Rapes: 0
- Robberies: 0
- Assaults: 0
- Burglaries: 17
- Thefts: 2
- Auto thefts: 0
Health of residents in Dearborn County based on CDC Behavioral Risk Factor Surveillance System Survey Questionnaires from 2013 to 2021:
General health status score of residents in this county from 1 (poor) to 5 (excellent) is 3.4. This is about average.71.1% of residents exercised in the past month. This is about average.
44.4% of residents smoked 100+ cigarettes in their lives. This is about average.
51.4% of adult residents drank alcohol in the past 30 days. This is less than average.
67.6% of residents visited a dentist within the past year. This is about average.
Average weight of males is 202 pounds. This is more than average.
Average weight of females is 167 pounds. This is more than average.
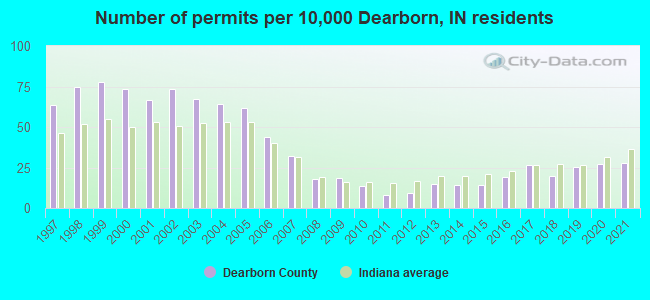
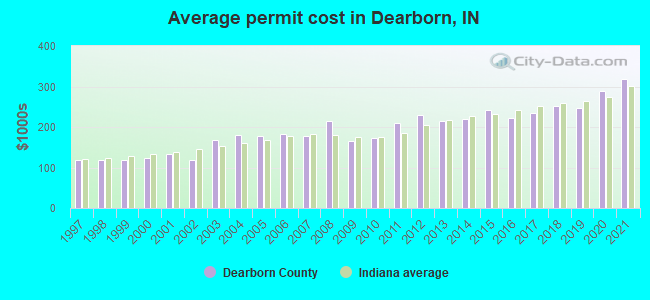
Single-family new house construction building permits:
- 2022: 96 buildings, average cost: $411,100
- 2021: 127 buildings, average cost: $319,400
- 2020: 124 buildings, average cost: $287,700
- 2019: 117 buildings, average cost: $247,400
- 2018: 90 buildings, average cost: $250,600
- 2017: 122 buildings, average cost: $233,700
- 2016: 88 buildings, average cost: $221,900
- 2015: 65 buildings, average cost: $241,200
- 2014: 65 buildings, average cost: $218,600
- 2013: 68 buildings, average cost: $213,900
- 2012: 44 buildings, average cost: $228,600
- 2011: 36 buildings, average cost: $209,100
- 2010: 64 buildings, average cost: $173,500
- 2009: 84 buildings, average cost: $166,200
- 2008: 82 buildings, average cost: $215,900
- 2007: 147 buildings, average cost: $176,800
- 2006: 201 buildings, average cost: $182,800
- 2005: 284 buildings, average cost: $177,800
- 2004: 295 buildings, average cost: $180,400
- 2003: 310 buildings, average cost: $168,300
- 2002: 340 buildings, average cost: $119,400
- 2001: 306 buildings, average cost: $132,800
- 2000: 340 buildings, average cost: $123,600
- 1999: 360 buildings, average cost: $118,700
- 1998: 344 buildings, average cost: $119,300
- 1997: 292 buildings, average cost: $118,700
Median real estate property taxes paid for housing units with mortgages in 2022: $1,685 (0.7%)
Median real estate property taxes paid for housing units with no mortgage in 2022: $1,634 (0.8%)
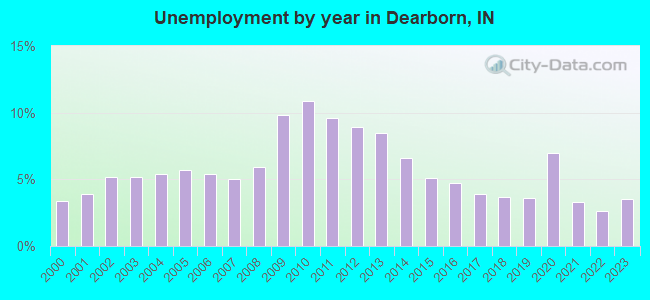
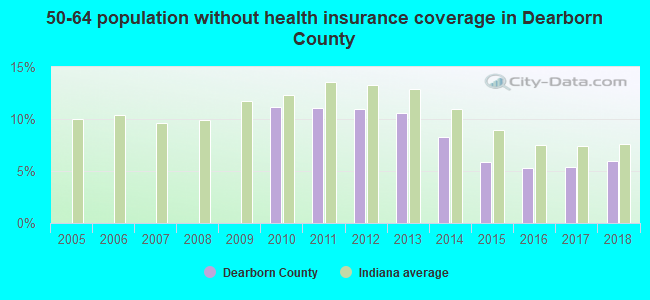
| Dearborn County: | 8.6% |
| Indiana: | 12.6% |
Median age of residents in 2022: 42.5 years old
(Males: 41.5 years old, Females: 43.4 years old)
(Median age for: White residents: 43.4 years old, Black residents: 43.1 years old, Asian residents: 32.6 years old, Hispanic or Latino residents: 29.6 years old, Other race residents: 18.7 years old)
Area name: Cincinnati-Middleton, OH-KY-IN HUD Metro FMR Area
Fair market rent in 2006 for a 1-bedroom apartment in Dearborn County is $506 a month.
Fair market rent for a 2-bedroom apartment is $655 a month.
Fair market rent for a 3-bedroom apartment is $877 a month.
Cities in this county include: Bright, Lawrenceburg, Hidden Valley, Greendale, Aurora, Dillsboro, Moores Hill, St. Leon, West Harrison.
Neighboring counties: Sussex County, Delaware  , Geary County, Kansas
  , Graham County, Kansas , Osborne County, Kansas , Russell County, Kansas , Shelby County, Illinois .
| Here: | 2.7% |
| Indiana: | 2.8% |
Current college students: 1,518
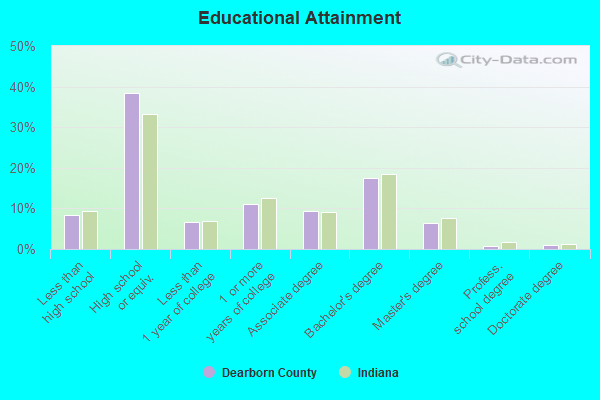
People 25 years of age or older with a high school degree or higher: 91.1%
People 25 years of age or older with a bachelor's degree or higher: 24.7%
Number of foreign born residents: 661 (60.9% naturalized citizens)
| Dearborn County: | 1.3% |
| Whole state: | 6.1% |
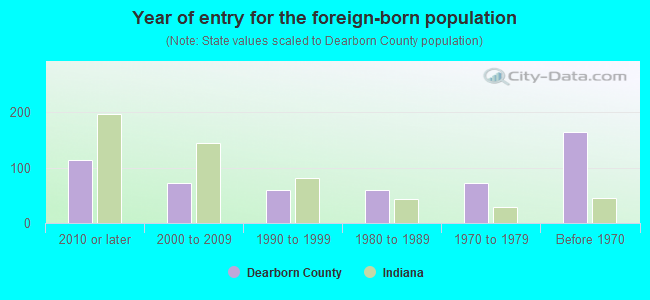
- Year of entry for the foreign-born population
- 1532010 or later
- 1282000 to 2009
- 631990 to 1999
- 591980 to 1989
- 731970 to 1979
- 164Before 1970
Mean travel time to work (commute): minutes
Percentage of county residents living and working in this county: 52.1%
Housing units in structures:
- One, detached: 17,241
- One, attached: 725
- Two: 465
- 3 or 4: 495
- 5 to 9: 466
- 10 to 19: 516
- 20 to 49: 424
- 50 or more: 151
- Mobile homes: 682
- Boats, RVs, vans, etc.: 6
Housing units in Dearborn County with a mortgage: 11,411 (1,302 second mortgage, 30 home equity loan, 1,089 both second mortgage and home equity loan)
Houses without a mortgage: 191
| Here: | 5.4% with mortgage |
| State: | 96.6% with mortgage |
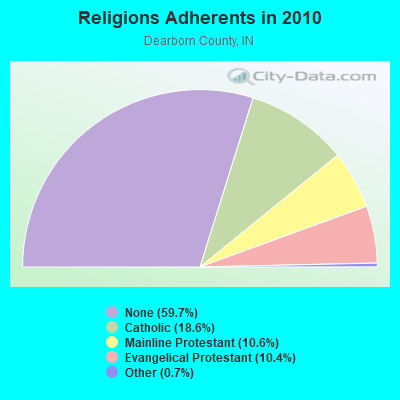
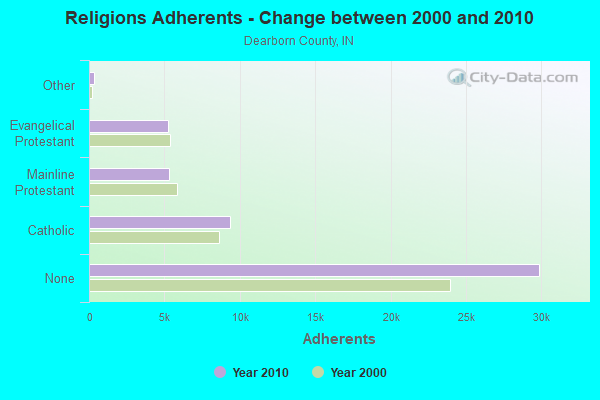
Religion statistics for Dearborn County
| Religion | Adherents | Congregations |
|---|---|---|
| Catholic | 9,317 | 7 |
| Mainline Protestant | 5,305 | 33 |
| Evangelical Protestant | 5,222 | 28 |
| Other | 336 | 3 |
| None | 29,867 | - |
Source: Clifford Grammich, Kirk Hadaway, Richard Houseal, Dale E.Jones, Alexei Krindatch, Richie Stanley and Richard H.Taylor. 2012. 2010 U.S.Religion Census: Religious Congregations & Membership Study. Association of Statisticians of American Religious Bodies. Jones, Dale E., et al. 2002. Congregations and Membership in the United States 2000. Nashville, TN: Glenmary Research Center.
Food Environment Statistics:
| Dearborn County: | 1.41 / 10,000 pop. |
| State: | 1.73 / 10,000 pop. |
| Here: | 0.20 / 10,000 pop. |
| Indiana: | 0.21 / 10,000 pop. |
| This county: | 0.40 / 10,000 pop. |
| Indiana: | 0.50 / 10,000 pop. |
| Dearborn County: | 3.83 / 10,000 pop. |
| Indiana: | 3.57 / 10,000 pop. |
| This county: | 6.66 / 10,000 pop. |
| State: | 6.78 / 10,000 pop. |
| Dearborn County: | 8.8% |
| Indiana: | 9.2% |
| Dearborn County: | 27.8% |
| State: | 29.0% |
| Here: | 11.8% |
| State: | 14.3% |
Agriculture in Dearborn County:
Average size of farms: 110 acresAverage value of agricultural products sold per farm: $10,193
Average value of crops sold per acre for harvested cropland: $160.69
The value of nursery, greenhouse, floriculture, and sod as a percentage of the total market value of agricultural products sold: 6.42%
The value of livestock, poultry, and their products as a percentage of the total market value of agricultural products sold: 36.00%
Average total farm production expenses per farm: $15,589
Harvested cropland as a percentage of land in farms: 37.07%
Irrigated harvested cropland as a percentage of land in farms: 0.34%
Average market value of all machinery and equipment per farm: $26,496
The percentage of farms operated by a family or individual: 93.64%
Average age of principal farm operators: 57 years
Average number of cattle and calves per 100 acres of all land in farms: 11.33
Milk cows as a percentage of all cattle and calves: 2.34%
Corn for grain: 4003 harvested acres
All wheat for grain: 563 harvested acres
Soybeans for beans: 10530 harvested acres
Vegetables: 108 harvested acres
Land in orchards: 228 acres
Earthquake activity:
Dearborn County-area historical earthquake activity is significantly above Indiana state average. It is 61% greater than the overall U.S. average.On 7/27/1980 at 18:52:21, a magnitude 5.2 (5.1 MB, 4.7 MS, 5.0 UK, 5.2 UK, Class: Moderate, Intensity: VI - VII) earthquake occurred 84.0 miles away from Dearborn County center
On 4/18/2008 at 09:36:59, a magnitude 5.4 (5.1 MB, 4.8 MS, 5.4 MW, 5.2 MW) earthquake occurred 165.5 miles away from the county center
On 4/18/2008 at 09:36:59, a magnitude 5.2 (5.2 MW, Depth: 8.9 mi) earthquake occurred 165.5 miles away from the county center
On 6/10/1987 at 23:48:54, a magnitude 5.1 (4.9 MB, 4.4 MS, 4.6 MS, 5.1 LG) earthquake occurred 159.7 miles away from the county center
On 9/7/1988 at 02:28:09, a magnitude 4.6 (4.5 MB, 4.6 LG, Class: Light, Intensity: IV - V) earthquake occurred 89.6 miles away from Dearborn County center
On 6/18/2002 at 17:37:15, a magnitude 5.0 (4.3 MB, 4.6 MW, 5.0 LG) earthquake occurred 172.8 miles away from the county center
Magnitude types: regional Lg-wave magnitude (LG), body-wave magnitude (MB), surface-wave magnitude (MS), moment magnitude (MW)
Most recent natural disasters:
- Indiana Covid-19 Pandemic, Incident Period: January 31, 2020, FEMA Id: 4515, Natural disaster type: Other
- Indiana Severe Storms And Flooding, Incident Period: February 14, 2018 - March 4, 2018, FEMA Id: 4363, Natural disaster type: Storm, Flood
- Indiana Severe Storms, Tornadoes, Straight-Line Winds, and Flooding, Incident Period: April 19, 2011 to June 06, 2011, Major Disaster (Presidential) Declared DR-1997: June 23, 2011, FEMA Id: 1997, Natural disaster type: Storm, Tornado, Flood, Wind
- Indiana Severe Storms and Flooding, Incident Period: September 12, 2008 to October 06, 2008, Major Disaster (Presidential) Declared DR-1795: September 23, 2008, FEMA Id: 1795, Natural disaster type: Storm, Flood
- Indiana Severe Storms and Flooding, Incident Period: May 30, 2008 to June 27, 2008, Major Disaster (Presidential) Declared DR-1766: June 08, 2008, FEMA Id: 1766, Natural disaster type: Storm, Flood
- Indiana Hurricane Katrina Evacuation, Incident Period: August 29, 2005 to October 01, 2005, Emergency Declared EM-3238: September 10, 2005, FEMA Id: 3238, Natural disaster type: Hurricane
- Indiana Severe Winter Storms and Flooding, Incident Period: January 01, 2005 to February 11, 2005, Major Disaster (Presidential) Declared DR-1573: January 21, 2005, FEMA Id: 1573, Natural disaster type: Winter Storm, Flood
- Indiana Snow, Incident Period: December 21, 2004 to December 23, 2004, Emergency Declared EM-3197: January 11, 2005, FEMA Id: 3197, Natural disaster type: Snow
- Indiana Severe Storms, Tornadoes, and Flooding, Incident Period: May 25, 2004 to June 25, 2004, Major Disaster (Presidential) Declared DR-1520: June 03, 2004, FEMA Id: 1520, Natural disaster type: Storm, Tornado, Flood
- Indiana Severe Storms, Tornadoes and Flooding, Incident Period: April 28, 2002 to June 07, 2002, Major Disaster (Presidential) Declared DR-1418: June 13, 2002, FEMA Id: 1418, Natural disaster type: Storm, Tornado, Flood
- 8 other natural disasters have been reported since 1953.
The number of natural disasters in Dearborn County (18) is near the US average (15).
Major Disasters (Presidential) Declared: 14
Emergencies Declared: 2
Causes of natural disasters: Floods: 13, Storms: 10, Tornadoes: 6, Blizzard: 1, Hurricane: 1, Snow: 1, Wind: 1, Winter Storm: 1, Other: 1 (Note: some incidents may be assigned to more than one category).
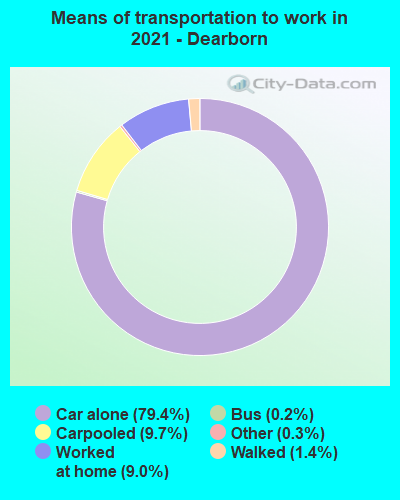
Means of transportation to work:
- Drove a car alone: 11,915 (73.7%)
- Carpooled: 1,640 (10.1%)
- Bus: 31 (0.2%)
- Taxicab, motorcycle, or other means: 74 (0.5%)
- Walked: 236 (1.5%)
- Worked at home: 2,413 (14.9%)

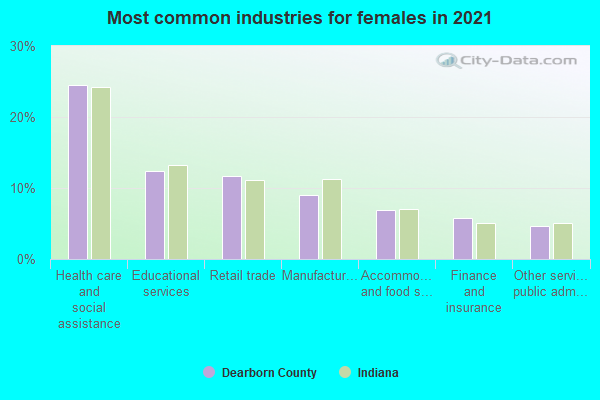
- Health care and social assistance (23%)
- Educational services (11%)
- Retail trade (10%)
- Manufacturing (8%)
- Accommodation and food services (6%)
- Finance and insurance (4%)
- Professional, scientific, and technical services (4%)
- Health care and social assistance (26%)
- Educational services (13%)
- Retail trade (12%)
- Manufacturing (10%)
- Accommodation and food services (7%)
- Finance and insurance (5%)
- Professional, scientific, and technical services (4%)
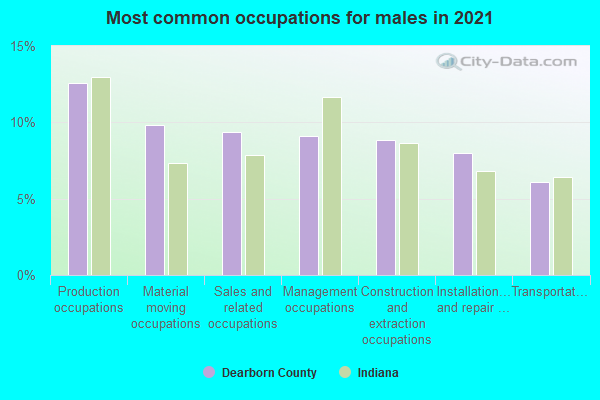
- Production occupations (14%)
- Sales and related occupations (10%)
- Construction and extraction occupations (10%)
- Management occupations (10%)
- Material moving occupations (8%)
- Installation, maintenance, and repair occupations (7%)
- Transportation occupations (6%)
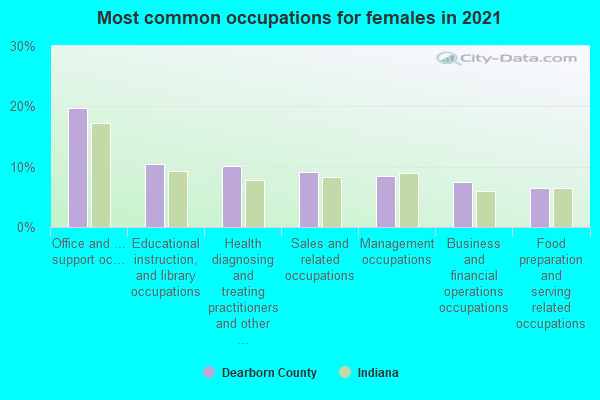
- Office and administrative support occupations (19%)
- Educational instruction, and library occupations (10%)
- Health diagnosing and treating practitioners and other technical occupations (10%)
- Sales and related occupations (9%)
- Management occupations (9%)
- Business and financial operations occupations (7%)
- Food preparation and serving related occupations (6%)
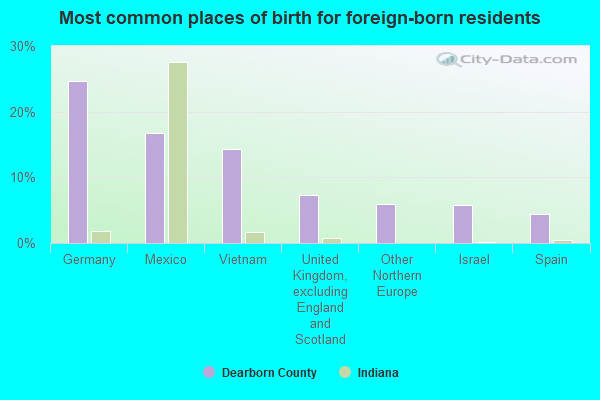
- Mexico (20%)
- Germany (17%)
- Vietnam (10%)
- Other Australian and New Zealand Subregion (8%)
- United Kingdom, excluding England and Scotland (7%)
- Armenia (5%)
- Canada (4%)
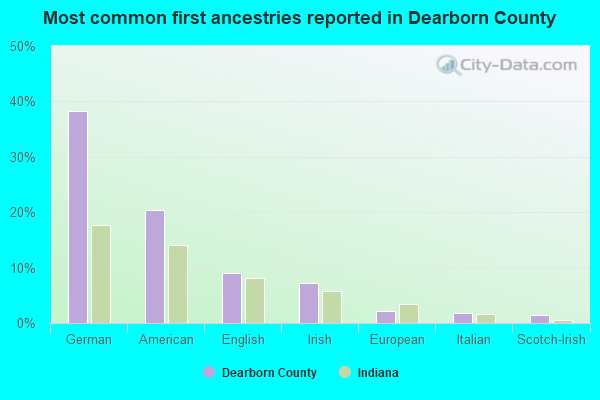
- German (36%)
- American (21%)
- English (9%)
- Irish (7%)
- Italian (2%)
- European (2%)
- Scotch-Irish (1%)
People in group quarters in Dearborn County, Indiana in 2010:
- 248 people in local jails and other municipal confinement facilities
- 232 people in nursing facilities/skilled-nursing facilities
- 34 people in emergency and transitional shelters (with sleeping facilities) for people experiencing homelessness
- 12 people in residential treatment centers for adults
- 4 people in other noninstitutional facilities
People in group quarters in Dearborn County, Indiana in 2000:
- 249 people in nursing homes
- 137 people in local jails and other confinement facilities (including police lockups)
- 44 people in wards in general hospitals for patients who have no usual home elsewhere
- 34 people in other nonhousehold living situations
- 28 people in other noninstitutional group quarters
- 14 people in homes for the mentally retarded
- 4 people in homes for the mentally ill
- 3 people in religious group quarters
6.30% of this county's 2021 resident taxpayers lived in other counties in 2020 ($60,216 average adjusted gross income)
| Here: | 6.30% |
| Indiana average: | 6.66% |
10 or fewer of this county's residents moved from foreign countries.
1.83% relocated from other counties in Indiana ($14,272 average AGI)
4.47% relocated from other states ($45,944 average AGI)
Dearborn County: 4.47% Indiana average: 2.58%
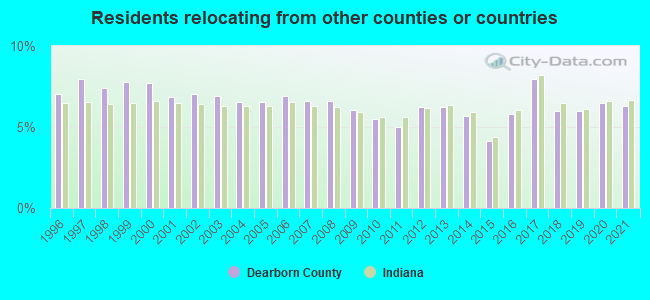
Top counties from which taxpayers relocated into this county between 2020 and 2021:
| from Hamilton County, OH | |
| from Ripley County, IN | |
| from Butler County, OH | |
| from Boone County, KY | |
| from Kenton County, KY | |
| from Ohio County, IN | |
| from Franklin County, IN |
6.01% of this county's 2020 resident taxpayers moved to other counties in 2021 ($60,579 average adjusted gross income)
| Here: | 6.01% |
| Indiana average: | 6.55% |
10 or fewer of this county's residents moved to foreign countries.
2.28% relocated to other counties in Indiana ($18,701 average AGI)
3.73% relocated to other states ($41,878 average AGI)
Dearborn County: 3.73% Indiana average: 2.46%
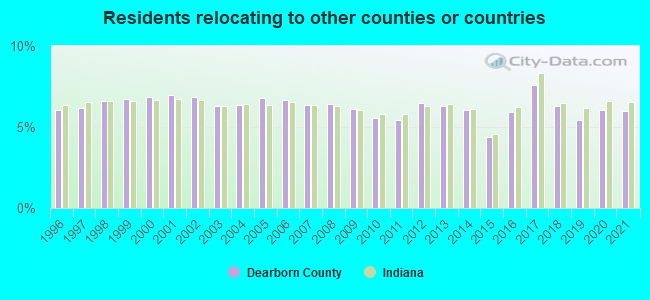
Top counties to which taxpayers relocated from this county between 2020 and 2021:
| to Hamilton County, OH | |
| to Ripley County, IN | |
| to Ohio County, IN | |
| to Boone County, KY | |
| to Franklin County, IN | |
| to Butler County, OH | |
| to Kenton County, KY |
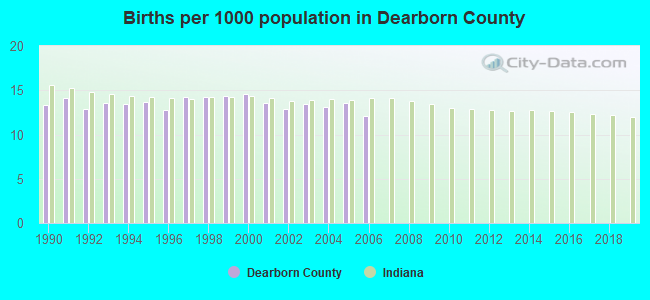
Births per 1000 population from 1990 to 1999: 13.7
Births per 1000 population from 2000 to 2006: 13.3
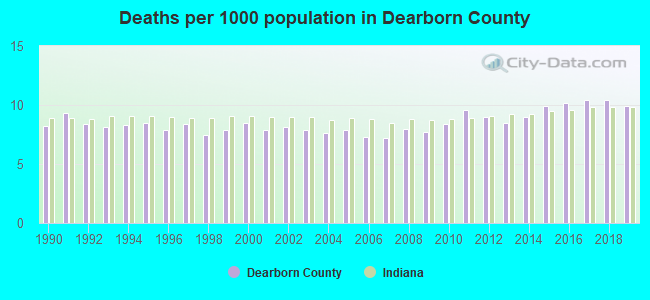
Deaths per 1000 population from 1990 to 1999: 8.2
Deaths per 1000 population from 2000 to 2009: 7.8
Deaths per 1000 population from 2010 to 2020: 9.7
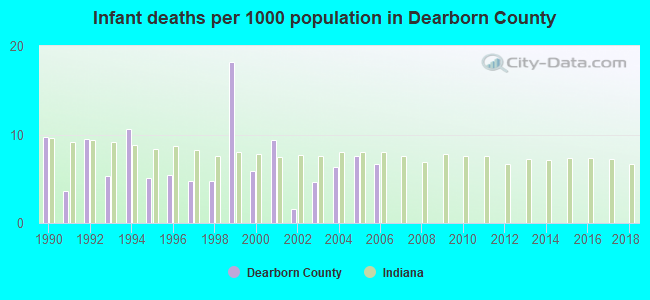
Infant deaths per 1000 live births from 1990 to 1999: 7.7
Infant deaths per 1000 live births from 2000 to 2006: 6.0
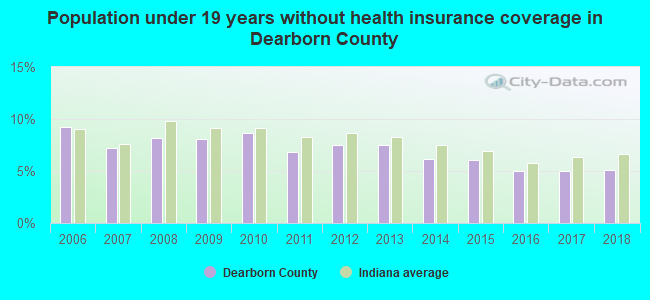
Persons under 19 years old without health insurance coverage in 2018: 5.1%
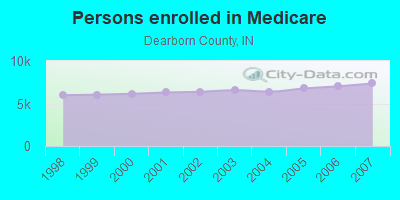
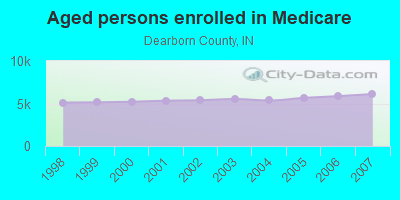
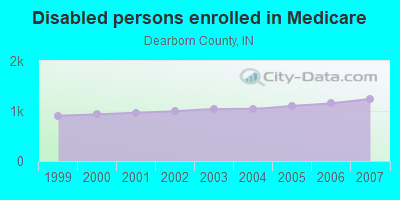
Persons enrolled in hospital insurance and/or supplemental medical insurance (Medicare) in July 1, 2007: 7,356 (6,111 aged, 1,245 disabled)
Children under 18 without health insurance coverage in 2007: 872 (7%)
Most common underlying causes of death in Dearborn County, Indiana in 1999 - 2019:
- Bronchus or lung, unspecified - Malignant neoplasms (730)
- Atherosclerotic heart disease (695)
- Acute myocardial infarction, unspecified (535)
- Chronic obstructive pulmonary disease, unspecified (374)
- Unspecified dementia (307)
- Stroke, not specified as haemorrhage or infarction (255)
- Alzheimer disease, unspecified (235)
- Pneumonia, unspecified (73)
- Colon, unspecified - Malignant neoplasms (45)
- Sequelae of stroke, not specified as haemorrhage or infarction (45)
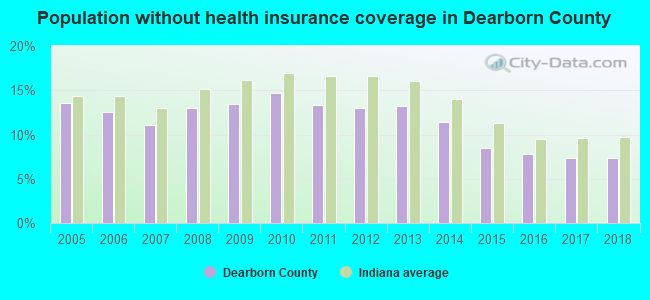
Population without health insurance coverage in 2000: 8%
Children under 18 without health insurance coverage in 2000: 7%
Short term general hospital admissions per 100,000 population in 2004: 9,744
Short term general hospital beds per 100,000 population in 2004: 179
Emergency room visits per 100,000 population in 2004: 34,806
General practice office based MDs per 100,000 population in 2005: 1,367
Medical specialist MDs per 100,000 population in 2005: 795
Dentists per 100,000 population in 1998: 16
Total births per 100,000 population, July 2005 - July 2006 : 19
Total deaths per 100,000 population, July 2005 - July 2006: 57
Limited-service eating places per 100,000 population in 2005 : 16
Beer, wine & liquor stores per 100,000 population in 2005: 1
Suicides per 1,000,000 population from 2000 to 2006: 107.8. This is less than state average.
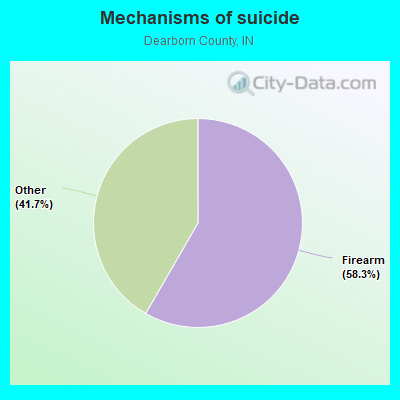
- Firearm - 62.9
- Other - 44.9
Household type by relationship:
Households: 51,072- Male householders: 10,180 (2,354 living alone), Female householders: 10,282 (2,412 living alone)
11,637 spouses (11,544 opposite-sex spouses), 1,255 unmarried partners, (1,236 opposite-sex unmarried partners), 14,322 children (13,391 natural, 282 adopted, 640 stepchildren), 977 grandchildren, 368 brothers or sisters, 359 parents, 20 foster children, 387 other relatives, 899 non-relatives
- In group quarters: 513
Size of family households: 6,638 2-persons, 3,634 3-persons, 2,283 4-persons, 1,364 5-persons, 566 6-persons, 207 7-or-more-persons.
Size of nonfamily households: 4,765 1-person, 831 2-persons, 105 3-persons, 22 4-persons, 36 5-persons, 18 7-or-more-persons.
7,704 married couples with children.
2,256 single-parent households (663 men, 1,593 women).
97.6% of residents of Dearborn speak English at home.
0.7% of residents speak Spanish at home (79% speak English very well, 18% speak English well, 2% speak English not well, 1% don't speak English at all).
0.8% of residents speak other Indo-European language at home (89% speak English very well, 8% speak English well, 3% speak English not well).
0.3% of residents speak Asian or Pacific Island language at home (11% speak English very well, 32% speak English well, 58% speak English not well).
0.1% of residents speak other language at home (58% speak English very well, 42% speak English well).
In fiscal year 2004:
Federal Government expenditure: $184,757,000 ($3,803 per capita)
Department of Defense expenditure: $3,170,000
Federal direct payments to individuals for retirement and disability: $101,280,000
Federal other direct payments to individuals: $41,929,000
Federal direct payments not to individuals: $911,000
Federal grants: $32,938,000
Federal procurement contracts: $1,581,000 ($83,000 Department of Defense)
Federal salaries and wages: $6,118,000 ($48,000 Department of Defense)
Federal Government direct loans: $941,000
Federal guaranteed/insured loans: $23,594,000
Federal Government insurance: $20,209,000
Population change from April 1, 2000 to July 1, 2005:
Births: 3,117| Here: | 64 per 1000 residents |
| State: | 72 per 1000 residents |
Deaths: 1,816
| Here: | 37 per 1000 residents |
| State: | 47 per 1000 residents |
Net international migration: +61
| Here: | +1 per 1000 residents |
| State: | +9 per 1000 residents |
Net internal migration: +1,645
| Here: | |
| State: |
Total withdrawal of fresh water for public supply: 3.59 millions of gallons per day (all from ground)
| Here: | 6.7 |
| State: | 6.6 |
| Here: | 4.5 |
| State: | 4.3 |
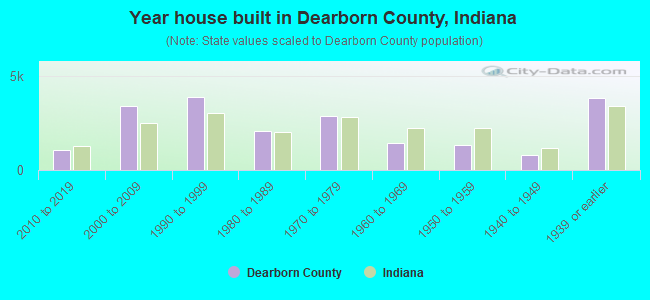
- Year house built in Dearborn County, Indiana
- 912020 or later
- 1,1062010 to 2019
- 3,4542000 to 2009
- 4,0611990 to 1999
- 2,1821980 to 1989
- 2,9611970 to 1979
- 1,4001960 to 1969
- 1,5661950 to 1959
- 6151940 to 1949
- 3,4501939 or earlier
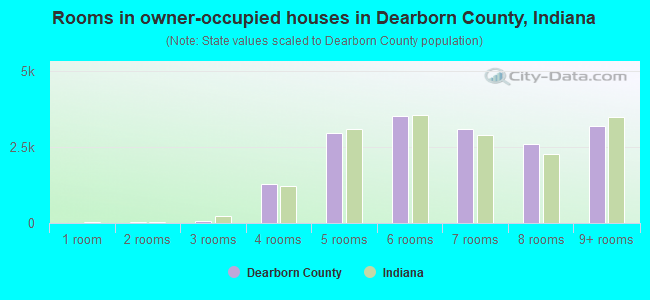
- Rooms in owner-occupied houses in Dearborn County, Indiana
- 61 room
- 352 rooms
- 1483 rooms
- 1,0404 rooms
- 3,0365 rooms
- 3,7256 rooms
- 3,3267 rooms
- 2,3918 rooms
- 3,4469+ rooms
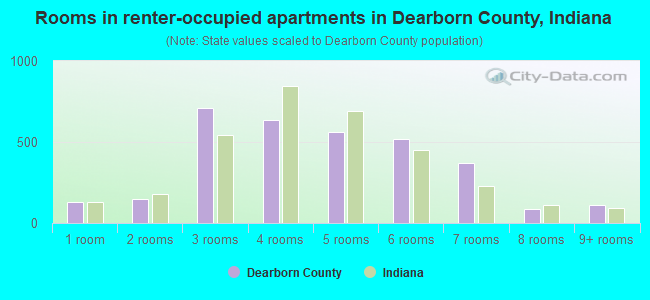
- Rooms in renter-occupied apartments in Dearborn County, Indiana
- 411 room
- 1272 rooms
- 7363 rooms
- 7274 rooms
- 6945 rooms
- 6196 rooms
- 2077 rooms
- 888 rooms
- 1269+ rooms
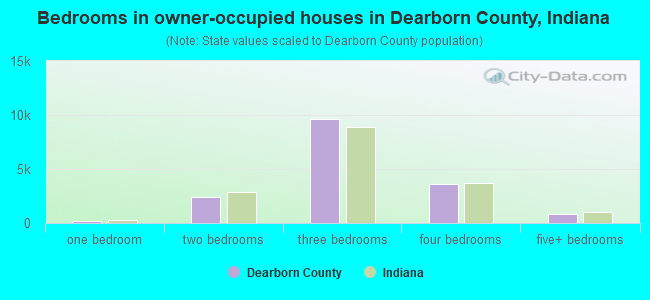
- Bedrooms in owner-occupied houses in Dearborn County, Indiana
- 7no bedroom
- 2231 bedroom
- 2,4202 bedrooms
- 9,8803 bedrooms
- 3,9654 bedrooms
- 6785+ bedrooms
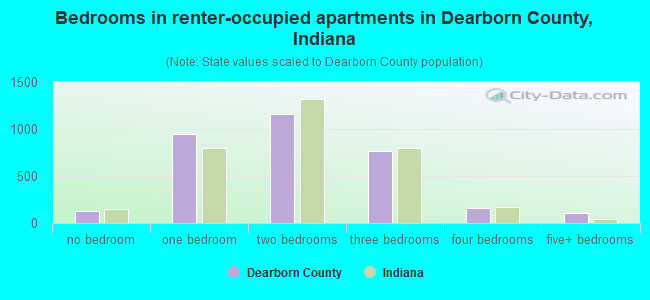
- Bedrooms in renter-occupied apartments in Dearborn County, Indiana
- 42no bedroom
- 9921 bedroom
- 1,2082 bedrooms
- 8623 bedrooms
- 2174 bedrooms
- 525+ bedrooms
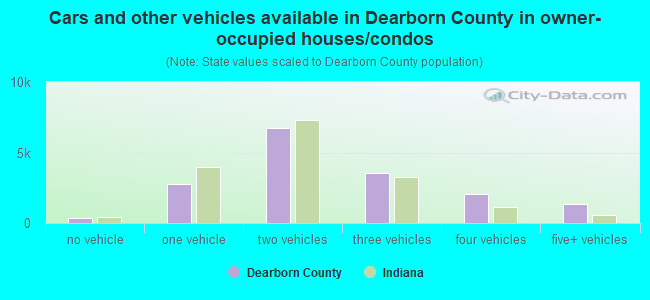
- Cars and other vehicles available in Dearborn County in owner-occupied houses/condos
- 290no vehicle
- 3,1711 vehicle
- 6,6852 vehicles
- 3,5673 vehicles
- 2,0534 vehicles
- 1,3135+ vehicles
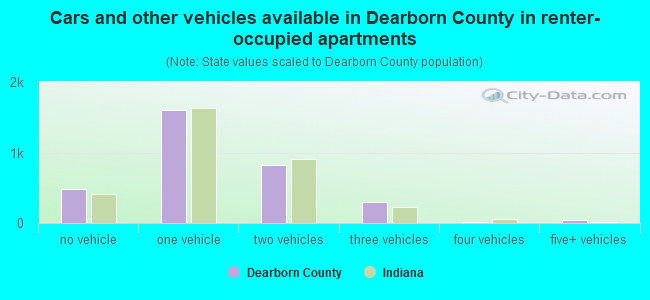
- Cars and other vehicles available in Dearborn County in renter-occupied apartments
- 620no vehicle
- 1,6691 vehicle
- 8282 vehicles
- 2103 vehicles
- 124 vehicles
- 345+ vehicles
93.0% of Dearborn County residents lived in the same house 1 years ago.
Out of people who lived in different houses, 36% lived in this county.
Out of people who lived in different counties, 38% lived in Indiana.
| Dearborn County: | 93.0% |
| State average: | 87.1% |
Place of birth for U.S.-born residents:
- This state: 19,778
- Other state: 30,453
- Northeast: 1,069
- Midwest: 23,652
- South: 4,911
- West: 857
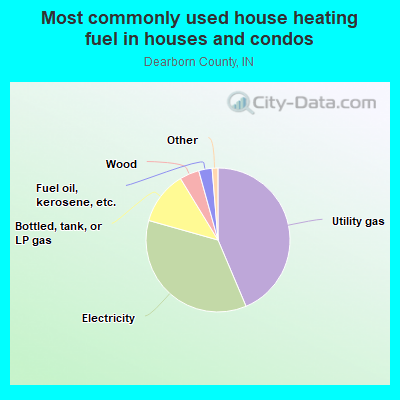
- 45.6%Utility gas
- 33.9%Electricity
- 12.0%Bottled, tank, or LP gas
- 4.0%Wood
- 2.8%Fuel oil, kerosene, etc.
- 0.7%Other fuel
- 0.6%Solar energy
- 0.4%No fuel used
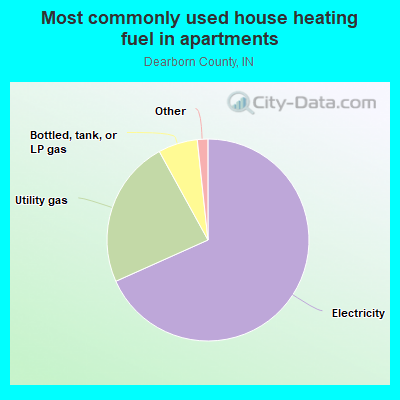
- 64.8%Electricity
- 27.3%Utility gas
- 6.0%Bottled, tank, or LP gas
- 1.0%Fuel oil, kerosene, etc.
- 0.7%Wood
- 0.2%No fuel used
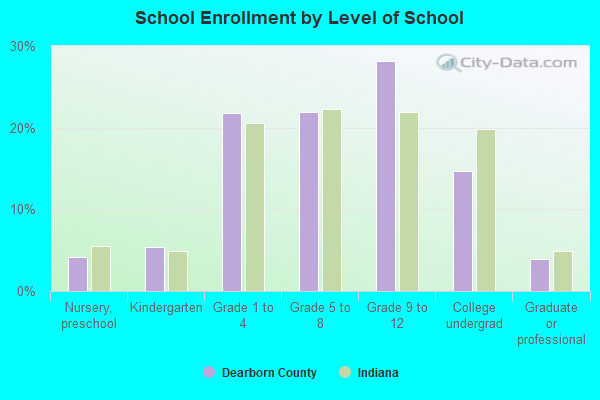
Private vs. public school enrollment:
| Here: | 6.2% |
| Indiana: | 14.9% |
| Here: | 8.5% |
| Indiana: | 11.4% |
| Here: | 11.9% |
| Indiana: | 22.3% |
Dearborn County government finances - Expenditure in 2020:
- Bond Funds - Cash and Securities: $3,803,000
- Charges - Hospital Public: $159,831,000
Other: $769,000
Sewerage: $12,000
Natural Resources - Other: $7,000
- Construction - General - Other: $8,258,000
Regular Highways: $5,237,000
Hospitals: $3,914,000
Regular Highways: $1,299,000
Central Staff Services: $583,000
Judicial and Legal Services: $469,000
Housing and Community Development: $77,000
Housing and Community Development: $77,000
Public Welfare - Other: $43,000
Parks and Recreation: $25,000
- Current Operations - Hospitals: $182,268,000
Central Staff Services: $7,925,000
Regular Highways: $6,230,000
Correctional Institutions: $5,577,000
General - Other: $5,474,000
Central Staff Services: $5,196,000
Police Protection: $4,167,000
Correctional Institutions: $3,978,000
Judicial and Legal Services: $3,353,000
Judicial and Legal Services: $3,220,000
Regular Highways: $2,918,000
Police Protection: $2,723,000
Corrections - Other: $2,128,000
Corrections - Other: $1,729,000
Financial Administration: $1,274,000
General Public Buildings: $1,270,000
Financial Administration: $1,248,000
General Public Buildings: $909,000
Health - Other: $873,000
Health - Other: $853,000
Parks and Recreation: $622,000
Natural Resources - Other: $398,000
Local Fire Protection: $301,000
Local Fire Protection: $293,000
Sewerage: $284,000
Natural Resources - Other: $150,000
Parks and Recreation: $95,000
Housing and Community Development: $77,000
Public Welfare - Other: $22,000
Public Welfare - Other: $16,000
Public Welfare Institutions: $16,000
Housing and Community Development: $1,000
- Federal Intergovernmental - Highways: $2,419,000
Public Welfare: $734,000
Other: $143,000
Health and Hospitals: $138,000
Housing and Community Development: $41,000
- General - Interest on Debt: $1,145,000
Interest on Debt: $1,111,000
- Intergovernmental to Local - Other - General - Other: $1,506,000
Other - General - Other: $1,464,000
- Local Intergovernmental - General Local Government Support: $3,954,000
General Local Government Support: $3,953,000
Public Welfare: $335,000
Public Welfare: $237,000
Other: $111,000
Housing and Community Development: $59,000
Housing and Community Development: $50,000
Other: $49,000
- Long Term Debt - Beginning Outstanding - Unspecified Public Purpose: $28,624,000
Outstanding Unspecified Public Purpose: $28,624,000
Beginning Outstanding - Unspecified Public Purpose: $27,787,000
Outstanding Unspecified Public Purpose: $27,787,000
- Miscellaneous - Fines and Forfeits: $1,674,000
General Revenue - Other: $1,150,000
General Revenue - Other: $949,000
Interest Earnings: $324,000
Fines and Forfeits: $43,000
Special Assessments: $23,000
Rents: $16,000
Rents: $14,000
Donations From Private Sources: $13,000
Sale of Property: $10,000
Donations From Private Sources: $2,000
- Other Capital Outlay - Central Staff Services: $476,000
Regular Highways: $472,000
Police Protection: $221,000
Regular Highways: $154,000
Police Protection: $105,000
General - Other: $102,000
Parks and Recreation: $64,000
General Public Building: $62,000
Judicial and Legal Services: $46,000
Central Staff Services: $41,000
General Public Building: $37,000
Health - Other: $32,000
Parks and Recreation: $25,000
Corrections - Other: $17,000
Health - Other: $15,000
Financial Administration: $7,000
Correctional Institutions: $5,000
Judicial and Legal Services: $5,000
- Other Funds - Cash and Securities: $69,433,000
Cash and Securities: $34,692,000
- State Intergovernmental - Other: $23,660,000
General Local Government Support: $6,302,000
Highways: $996,000
Public Welfare: $689,000
General Local Government Support: $631,000
Public Welfare: $151,000
Housing and Community Development: $76,000
Health and Hospitals: $59,000
Health and Hospitals: $49,000
Housing and Community Development: $37,000
Highways: $6,000
- Tax - Property: $10,716,000
Other: $10,466,000
Property: $9,025,000
Public Utilities Sales: $784,000
Other Selective Sales: $488,000
Other License: $150,000
Other License: $148,000
Public Utilities Sales: $112,000
Other: $111,000
Occupation and Business License - Other: $28,000
Occupation and Business License - Other: $24,000
- Total Salaries and Wages: $12,312,000
: $12,057,000
Dearborn County government finances - Revenue in 2020:
- Bond Funds - Cash and Securities: $3,803,000
- Charges - Hospital Public: $159,831,000
Other: $769,000
Sewerage: $12,000
Natural Resources - Other: $7,000
- Construction - General - Other: $8,258,000
Regular Highways: $5,237,000
Hospitals: $3,914,000
Regular Highways: $1,299,000
Central Staff Services: $583,000
Judicial and Legal Services: $469,000
Housing and Community Development: $77,000
Housing and Community Development: $77,000
Public Welfare - Other: $43,000
Parks and Recreation: $25,000
- Current Operations - Hospitals: $182,268,000
Central Staff Services: $7,925,000
Regular Highways: $6,230,000
Correctional Institutions: $5,577,000
General - Other: $5,474,000
Central Staff Services: $5,196,000
Police Protection: $4,167,000
Correctional Institutions: $3,978,000
Judicial and Legal Services: $3,353,000
Judicial and Legal Services: $3,220,000
Regular Highways: $2,918,000
Police Protection: $2,723,000
Corrections - Other: $2,128,000
Corrections - Other: $1,729,000
Financial Administration: $1,274,000
General Public Buildings: $1,270,000
Financial Administration: $1,248,000
General Public Buildings: $909,000
Health - Other: $873,000
Health - Other: $853,000
Parks and Recreation: $622,000
Natural Resources - Other: $398,000
Local Fire Protection: $301,000
Local Fire Protection: $293,000
Sewerage: $284,000
Natural Resources - Other: $150,000
Parks and Recreation: $95,000
Housing and Community Development: $77,000
Public Welfare - Other: $22,000
Public Welfare - Other: $16,000
Public Welfare Institutions: $16,000
Housing and Community Development: $1,000
- Federal Intergovernmental - Highways: $2,419,000
Public Welfare: $734,000
Other: $143,000
Health and Hospitals: $138,000
Housing and Community Development: $41,000
- General - Interest on Debt: $1,145,000
Interest on Debt: $1,111,000
- Intergovernmental to Local - Other - General - Other: $1,506,000
Other - General - Other: $1,464,000
- Local Intergovernmental - General Local Government Support: $3,954,000
General Local Government Support: $3,953,000
Public Welfare: $335,000
Public Welfare: $237,000
Other: $111,000
Housing and Community Development: $59,000
Housing and Community Development: $50,000
Other: $49,000
- Long Term Debt - Beginning Outstanding - Unspecified Public Purpose: $28,624,000
Outstanding Unspecified Public Purpose: $28,624,000
Beginning Outstanding - Unspecified Public Purpose: $27,787,000
Outstanding Unspecified Public Purpose: $27,787,000
- Miscellaneous - Fines and Forfeits: $1,674,000
General Revenue - Other: $1,150,000
General Revenue - Other: $949,000
Interest Earnings: $324,000
Fines and Forfeits: $43,000
Special Assessments: $23,000
Rents: $16,000
Rents: $14,000
Donations From Private Sources: $13,000
Sale of Property: $10,000
Donations From Private Sources: $2,000
- Other Capital Outlay - Central Staff Services: $476,000
Regular Highways: $472,000
Police Protection: $221,000
Regular Highways: $154,000
Police Protection: $105,000
General - Other: $102,000
Parks and Recreation: $64,000
General Public Building: $62,000
Judicial and Legal Services: $46,000
Central Staff Services: $41,000
General Public Building: $37,000
Health - Other: $32,000
Parks and Recreation: $25,000
Corrections - Other: $17,000
Health - Other: $15,000
Financial Administration: $7,000
Correctional Institutions: $5,000
Judicial and Legal Services: $5,000
- Other Funds - Cash and Securities: $69,433,000
Cash and Securities: $34,692,000
- State Intergovernmental - Other: $23,660,000
General Local Government Support: $6,302,000
Highways: $996,000
Public Welfare: $689,000
General Local Government Support: $631,000
Public Welfare: $151,000
Housing and Community Development: $76,000
Health and Hospitals: $59,000
Health and Hospitals: $49,000
Housing and Community Development: $37,000
Highways: $6,000
- Tax - Property: $10,716,000
Other: $10,466,000
Property: $9,025,000
Public Utilities Sales: $784,000
Other Selective Sales: $488,000
Other License: $150,000
Other License: $148,000
Public Utilities Sales: $112,000
Other: $111,000
Occupation and Business License - Other: $28,000
Occupation and Business License - Other: $24,000
- Total Salaries and Wages: $12,312,000
: $12,057,000
Dearborn County government finances - Debt in 2020:
- Bond Funds - Cash and Securities: $3,803,000
- Charges - Hospital Public: $159,831,000
Other: $769,000
Sewerage: $12,000
Natural Resources - Other: $7,000
- Construction - General - Other: $8,258,000
Regular Highways: $5,237,000
Hospitals: $3,914,000
Regular Highways: $1,299,000
Central Staff Services: $583,000
Judicial and Legal Services: $469,000
Housing and Community Development: $77,000
Housing and Community Development: $77,000
Public Welfare - Other: $43,000
Parks and Recreation: $25,000
- Current Operations - Hospitals: $182,268,000
Central Staff Services: $7,925,000
Regular Highways: $6,230,000
Correctional Institutions: $5,577,000
General - Other: $5,474,000
Central Staff Services: $5,196,000
Police Protection: $4,167,000
Correctional Institutions: $3,978,000
Judicial and Legal Services: $3,353,000
Judicial and Legal Services: $3,220,000
Regular Highways: $2,918,000
Police Protection: $2,723,000
Corrections - Other: $2,128,000
Corrections - Other: $1,729,000
Financial Administration: $1,274,000
General Public Buildings: $1,270,000
Financial Administration: $1,248,000
General Public Buildings: $909,000
Health - Other: $873,000
Health - Other: $853,000
Parks and Recreation: $622,000
Natural Resources - Other: $398,000
Local Fire Protection: $301,000
Local Fire Protection: $293,000
Sewerage: $284,000
Natural Resources - Other: $150,000
Parks and Recreation: $95,000
Housing and Community Development: $77,000
Public Welfare - Other: $22,000
Public Welfare - Other: $16,000
Public Welfare Institutions: $16,000
Housing and Community Development: $1,000
- Federal Intergovernmental - Highways: $2,419,000
Public Welfare: $734,000
Other: $143,000
Health and Hospitals: $138,000
Housing and Community Development: $41,000
- General - Interest on Debt: $1,145,000
Interest on Debt: $1,111,000
- Intergovernmental to Local - Other - General - Other: $1,506,000
Other - General - Other: $1,464,000
- Local Intergovernmental - General Local Government Support: $3,954,000
General Local Government Support: $3,953,000
Public Welfare: $335,000
Public Welfare: $237,000
Other: $111,000
Housing and Community Development: $59,000
Housing and Community Development: $50,000
Other: $49,000
- Long Term Debt - Beginning Outstanding - Unspecified Public Purpose: $28,624,000
Outstanding Unspecified Public Purpose: $28,624,000
Beginning Outstanding - Unspecified Public Purpose: $27,787,000
Outstanding Unspecified Public Purpose: $27,787,000
- Miscellaneous - Fines and Forfeits: $1,674,000
General Revenue - Other: $1,150,000
General Revenue - Other: $949,000
Interest Earnings: $324,000
Fines and Forfeits: $43,000
Special Assessments: $23,000
Rents: $16,000
Rents: $14,000
Donations From Private Sources: $13,000
Sale of Property: $10,000
Donations From Private Sources: $2,000
- Other Capital Outlay - Central Staff Services: $476,000
Regular Highways: $472,000
Police Protection: $221,000
Regular Highways: $154,000
Police Protection: $105,000
General - Other: $102,000
Parks and Recreation: $64,000
General Public Building: $62,000
Judicial and Legal Services: $46,000
Central Staff Services: $41,000
General Public Building: $37,000
Health - Other: $32,000
Parks and Recreation: $25,000
Corrections - Other: $17,000
Health - Other: $15,000
Financial Administration: $7,000
Correctional Institutions: $5,000
Judicial and Legal Services: $5,000
- Other Funds - Cash and Securities: $69,433,000
Cash and Securities: $34,692,000
- State Intergovernmental - Other: $23,660,000
General Local Government Support: $6,302,000
Highways: $996,000
Public Welfare: $689,000
General Local Government Support: $631,000
Public Welfare: $151,000
Housing and Community Development: $76,000
Health and Hospitals: $59,000
Health and Hospitals: $49,000
Housing and Community Development: $37,000
Highways: $6,000
- Tax - Property: $10,716,000
Other: $10,466,000
Property: $9,025,000
Public Utilities Sales: $784,000
Other Selective Sales: $488,000
Other License: $150,000
Other License: $148,000
Public Utilities Sales: $112,000
Other: $111,000
Occupation and Business License - Other: $28,000
Occupation and Business License - Other: $24,000
- Total Salaries and Wages: $12,312,000
: $12,057,000
Dearborn County government finances - Cash and Securities in 2020:
- Bond Funds - Cash and Securities: $3,803,000
- Charges - Hospital Public: $159,831,000
Other: $769,000
Sewerage: $12,000
Natural Resources - Other: $7,000
- Construction - General - Other: $8,258,000
Regular Highways: $5,237,000
Hospitals: $3,914,000
Regular Highways: $1,299,000
Central Staff Services: $583,000
Judicial and Legal Services: $469,000
Housing and Community Development: $77,000
Housing and Community Development: $77,000
Public Welfare - Other: $43,000
Parks and Recreation: $25,000
- Current Operations - Hospitals: $182,268,000
Central Staff Services: $7,925,000
Regular Highways: $6,230,000
Correctional Institutions: $5,577,000
General - Other: $5,474,000
Central Staff Services: $5,196,000
Police Protection: $4,167,000
Correctional Institutions: $3,978,000
Judicial and Legal Services: $3,353,000
Judicial and Legal Services: $3,220,000
Regular Highways: $2,918,000
Police Protection: $2,723,000
Corrections - Other: $2,128,000
Corrections - Other: $1,729,000
Financial Administration: $1,274,000
General Public Buildings: $1,270,000
Financial Administration: $1,248,000
General Public Buildings: $909,000
Health - Other: $873,000
Health - Other: $853,000
Parks and Recreation: $622,000
Natural Resources - Other: $398,000
Local Fire Protection: $301,000
Local Fire Protection: $293,000
Sewerage: $284,000
Natural Resources - Other: $150,000
Parks and Recreation: $95,000
Housing and Community Development: $77,000
Public Welfare - Other: $22,000
Public Welfare - Other: $16,000
Public Welfare Institutions: $16,000
Housing and Community Development: $1,000
- Federal Intergovernmental - Highways: $2,419,000
Public Welfare: $734,000
Other: $143,000
Health and Hospitals: $138,000
Housing and Community Development: $41,000
- General - Interest on Debt: $1,145,000
Interest on Debt: $1,111,000
- Intergovernmental to Local - Other - General - Other: $1,506,000
Other - General - Other: $1,464,000
- Local Intergovernmental - General Local Government Support: $3,954,000
General Local Government Support: $3,953,000
Public Welfare: $335,000
Public Welfare: $237,000
Other: $111,000
Housing and Community Development: $59,000
Housing and Community Development: $50,000
Other: $49,000
- Long Term Debt - Beginning Outstanding - Unspecified Public Purpose: $28,624,000
Outstanding Unspecified Public Purpose: $28,624,000
Beginning Outstanding - Unspecified Public Purpose: $27,787,000
Outstanding Unspecified Public Purpose: $27,787,000
- Miscellaneous - Fines and Forfeits: $1,674,000
General Revenue - Other: $1,150,000
General Revenue - Other: $949,000
Interest Earnings: $324,000
Fines and Forfeits: $43,000
Special Assessments: $23,000
Rents: $16,000
Rents: $14,000
Donations From Private Sources: $13,000
Sale of Property: $10,000
Donations From Private Sources: $2,000
- Other Capital Outlay - Central Staff Services: $476,000
Regular Highways: $472,000
Police Protection: $221,000
Regular Highways: $154,000
Police Protection: $105,000
General - Other: $102,000
Parks and Recreation: $64,000
General Public Building: $62,000
Judicial and Legal Services: $46,000
Central Staff Services: $41,000
General Public Building: $37,000
Health - Other: $32,000
Parks and Recreation: $25,000
Corrections - Other: $17,000
Health - Other: $15,000
Financial Administration: $7,000
Correctional Institutions: $5,000
Judicial and Legal Services: $5,000
- Other Funds - Cash and Securities: $69,433,000
Cash and Securities: $34,692,000
- State Intergovernmental - Other: $23,660,000
General Local Government Support: $6,302,000
Highways: $996,000
Public Welfare: $689,000
General Local Government Support: $631,000
Public Welfare: $151,000
Housing and Community Development: $76,000
Health and Hospitals: $59,000
Health and Hospitals: $49,000
Housing and Community Development: $37,000
Highways: $6,000
- Tax - Property: $10,716,000
Other: $10,466,000
Property: $9,025,000
Public Utilities Sales: $784,000
Other Selective Sales: $488,000
Other License: $150,000
Other License: $148,000
Public Utilities Sales: $112,000
Other: $111,000
Occupation and Business License - Other: $28,000
Occupation and Business License - Other: $24,000
- Total Salaries and Wages: $12,312,000
: $12,057,000
Supplemental Security Income (SSI) in 2006:
- Total number of recipients: 478
- Number of aged recipients: 24
- Number of blind and disabled recipients: 454
- Number of recipients under 18: 71
- Number of recipients between 18 and 64: 353
- Number of recipients older than 64: 54
- Number of recipients also receiving OASDI: 151
- Amount of payments (thousands of dollars): 212
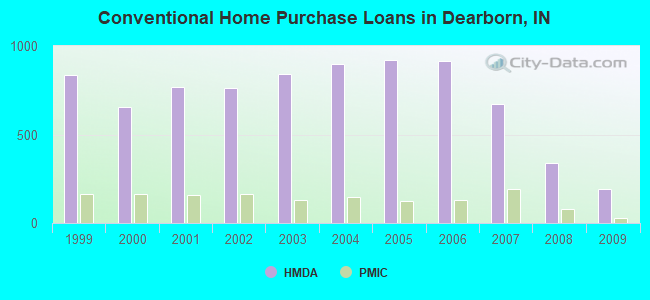
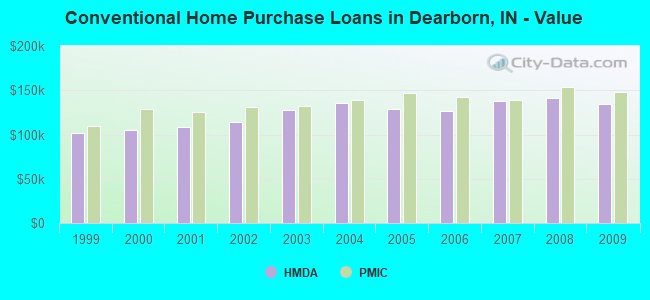
| Home Mortgage Disclosure Act Aggregated Statistics For Year 2009 (Based on 9 full tracts) | ||||||||||||||
| A) FHA, FSA/RHS & VA Home Purchase Loans | B) Conventional Home Purchase Loans | C) Refinancings | D) Home Improvement Loans | E) Loans on Dwellings For 5+ Families | F) Non-occupant Loans on < 5 Family Dwellings (A B C & D) | G) Loans On Manufactured Home Dwelling (A B C & D) | ||||||||
|---|---|---|---|---|---|---|---|---|---|---|---|---|---|---|
| Number | Average Value | Number | Average Value | Number | Average Value | Number | Average Value | Number | Average Value | Number | Average Value | Number | Average Value | |
| LOANS ORIGINATED | 227 | $137,965 | 194 | $134,928 | 1,506 | $146,829 | 88 | $54,557 | 0 | $0 | 48 | $112,958 | 42 | $75,500 |
| APPLICATIONS APPROVED, NOT ACCEPTED | 23 | $118,652 | 27 | $102,741 | 106 | $157,623 | 6 | $41,500 | 0 | $0 | 10 | $104,700 | 4 | $50,500 |
| APPLICATIONS DENIED | 33 | $125,121 | 59 | $114,729 | 528 | $154,564 | 43 | $51,233 | 2 | $662,000 | 30 | $95,700 | 17 | $75,706 |
| APPLICATIONS WITHDRAWN | 26 | $135,077 | 12 | $115,750 | 305 | $164,613 | 12 | $84,750 | 0 | $0 | 5 | $61,600 | 2 | $109,000 |
| FILES CLOSED FOR INCOMPLETENESS | 6 | $134,167 | 5 | $86,000 | 43 | $152,419 | 0 | $0 | 0 | $0 | 2 | $56,500 | 0 | $0 |
| Private Mortgage Insurance Companies Aggregated Statistics For Year 2009 (Based on 9 full tracts) | ||||
| A) Conventional Home Purchase Loans | B) Refinancings | |||
|---|---|---|---|---|
| Number | Average Value | Number | Average Value | |
| LOANS ORIGINATED | 30 | $148,433 | 32 | $160,875 |
| APPLICATIONS APPROVED, NOT ACCEPTED | 16 | $160,750 | 14 | $166,071 |
| APPLICATIONS DENIED | 10 | $124,200 | 17 | $161,588 |
| APPLICATIONS WITHDRAWN | 1 | $199,000 | 9 | $151,000 |
| FILES CLOSED FOR INCOMPLETENESS | 0 | $0 | 4 | $190,750 |
| Most common first names in Dearborn County, IN among deceased individuals | ||
| Name | Count | Lived (average) |
|---|---|---|
| William | 267 | 74.4 years |
| Mary | 239 | 78.5 years |
| Robert | 221 | 71.2 years |
| John | 213 | 73.3 years |
| Charles | 203 | 73.7 years |
| James | 203 | 72.0 years |
| George | 145 | 75.4 years |
| Edward | 112 | 75.5 years |
| Margaret | 108 | 79.3 years |
| Ruth | 103 | 78.7 years |
| Most common last names in Dearborn County, IN among deceased individuals | ||
| Last name | Count | Lived (average) |
|---|---|---|
| Smith | 109 | 77.7 years |
| Miller | 78 | 76.6 years |
| Meyer | 61 | 77.4 years |
| Baker | 56 | 78.6 years |
| Clark | 52 | 72.9 years |
| Jackson | 51 | 72.5 years |
| Brown | 44 | 76.0 years |
| Johnson | 42 | 73.2 years |
| Taylor | 42 | 72.4 years |
| Kaiser | 40 | 81.3 years |
| Businesses in Dearborn County, IN | ||||
| Name | Count | Name | Count | |
|---|---|---|---|---|
| ALDI | 1 | Kroger | 1 | |
| AT&T | 1 | La-Z-Boy | 1 | |
| Advance Auto Parts | 1 | Lane Furniture | 1 | |
| Arby's | 1 | Long John Silver's | 1 | |
| AutoZone | 1 | Lowe's | 1 | |
| Baskin-Robbins | 1 | MasterBrand Cabinets | 4 | |
| Blockbuster | 1 | McDonald's | 4 | |
| Burger King | 2 | Nike | 1 | |
| CVS | 2 | Papa John's Pizza | 1 | |
| Chevrolet | 2 | Payless | 1 | |
| Circle K | 2 | Penske | 1 | |
| Comfort Inn | 1 | Pizza Hut | 1 | |
| Cricket Wireless | 1 | Quality | 1 | |
| Curves | 1 | RadioShack | 1 | |
| Dairy Queen | 1 | Sears | 1 | |
| Decora Cabinetry | 1 | Steak 'n Shake | 1 | |
| Domino's Pizza | 1 | Subway | 3 | |
| Dunkin Donuts | 1 | T-Mobile | 1 | |
| Fashion Bug | 1 | Taco Bell | 1 | |
| FedEx | 3 | U-Haul | 3 | |
| Ford | 1 | UPS | 3 | |
| GNC | 1 | Vans | 1 | |
| GameStop | 1 | Walgreens | 2 | |
| H&R Block | 1 | Walmart | 1 | |
| Holiday Inn | 1 | Wendy's | 1 | |
| KFC | 1 | White Castle | 1 | |
| Kincaid | 1 | YMCA | 1 | |