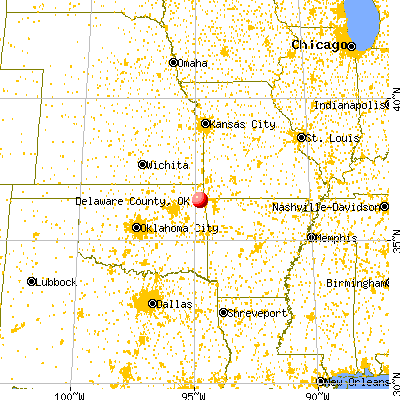
Delaware County, Oklahoma (OK)
County owner-occupied free and clear houses and condos in 2010: 6,320
County owner-occupied houses and condos in 2000: 11,749
Renter-occupied apartments: 3,798 (it was 3,089 in 2000)
| % of renters here: | 21% |
| State: | 33% |
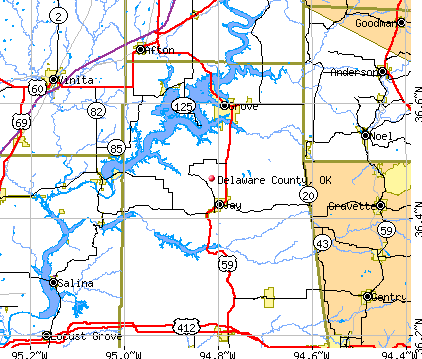
Land area: 741 sq. mi.
Water area: 51.7 sq. mi.
Population density: 56 people per square mile (average).
Industries providing employment: Educational, health and social services (20.7%), Manufacturing (12.9%), Retail trade (10.8%), Construction (10.6%).
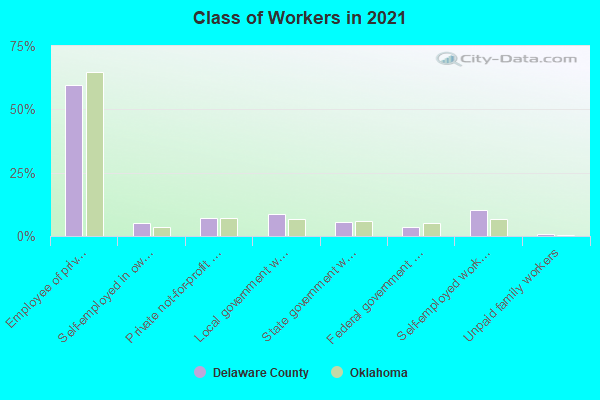
Type of workers:
- Private wage or salary: 72%
- Government: 17%
- Self-employed, not incorporated: 10%
- Unpaid family work: 0%
- OSM Map
- General Map
- Google Map
- MSN Map

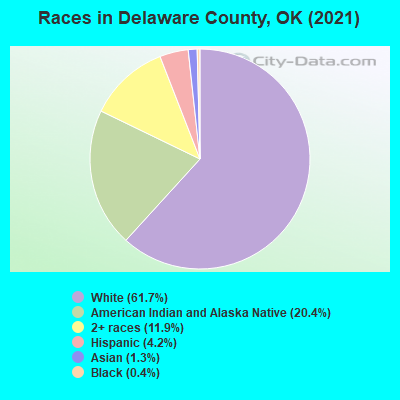
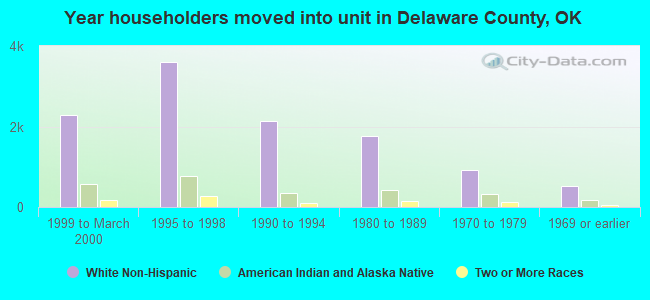
- 25,53462.0%White Non-Hispanic Alone
- 8,68821.1%American Indian and Alaska Native alone
- 4,30810.5%Two or more races
- 1,7984.4%Hispanic or Latino
- 5831.4%Asian alone
- 1650.4%Black Non-Hispanic Alone
- 490.1%Some other race alone
- 430.1%Native Hawaiian and Other
Pacific Islander alone
| Median resident age: | 47.1 years |
| Oklahoma median age: | 37.1 years |
| Males: 20,441 | |
| Females: 20,856 |


| Delaware County: | 2.0 people |
| Oklahoma: | 2 people |
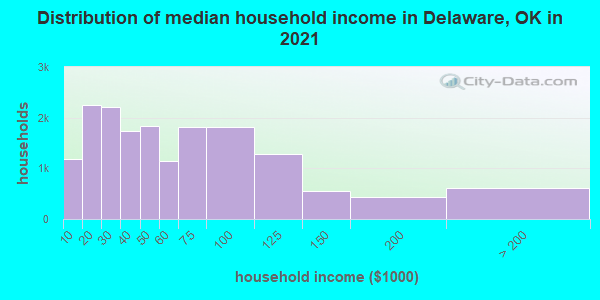
Estimated median household income in 2022: $51,821 ($27,996 in 1999)
| This county: | $51,821 |
| Oklahoma: | $59,673 |
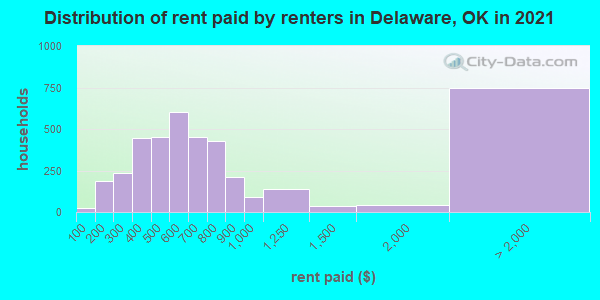
Median contract rent in 2022 for apartments: $587 (lower quartile is $405, upper quartile is $775)
| This county: | $587 |
| State: | $744 |
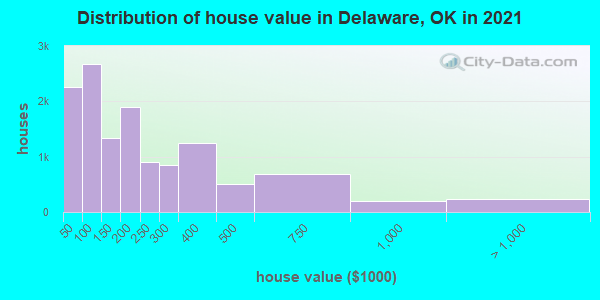
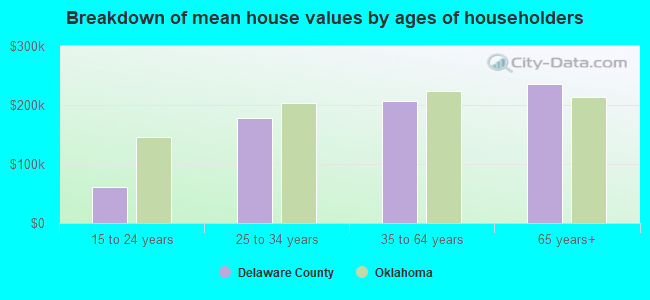
Estimated median house or condo value in 2022: $171,462 (it was $67,200 in 2000)
| Delaware: | $171,462 |
| Oklahoma: | $191,700 |
Mean price in 2022:
Median monthly housing costs for homes and condos with a mortgage: $1,295Detached houses: $295,481
Here: $295,481 State: $255,409 Townhouses or other attached units: $313,014
Here: $313,014 State: $206,466 In 2-unit structures: $82,151
Here: $82,151 State: $195,100 In 3-to-4-unit structures: $159,406
Here: $159,406 State: $140,612 In 5-or-more-unit structures: $153,856
Here: $153,856 State: $233,805 Mobile homes: $155,466
Here: $155,466 State: $110,804 Occupied boats, RVs, vans, etc.: $42,286
Here: $42,286 State: $68,690
Median monthly housing costs for units without a mortgage: $415
Institutionalized population: 321
Crime in 2021 (reported by the sheriff's office or county police, not the county total):
- Murders: 2
- Rapes: 11
- Robberies: 0
- Assaults: 68
- Burglaries: 124
- Thefts: 179
- Auto thefts: 82
Crime in 2020 (reported by the sheriff's office or county police, not the county total):
- Murders: 3
- Rapes: 9
- Robberies: 1
- Assaults: 41
- Burglaries: 108
- Thefts: 168
- Auto thefts: 60
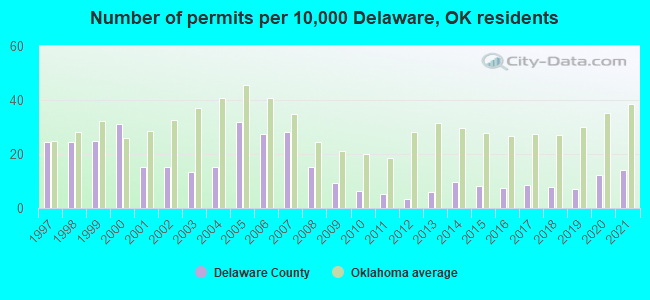
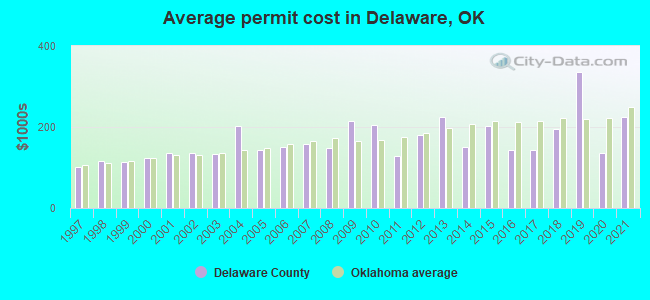
Single-family new house construction building permits:
- 2022: 40 buildings, average cost: $192,500
- 2021: 52 buildings, average cost: $225,100
- 2020: 45 buildings, average cost: $135,800
- 2019: 26 buildings, average cost: $335,000
- 2018: 29 buildings, average cost: $195,200
- 2017: 32 buildings, average cost: $141,600
- 2016: 28 buildings, average cost: $143,100
- 2015: 30 buildings, average cost: $202,100
- 2014: 36 buildings, average cost: $151,100
- 2013: 22 buildings, average cost: $225,200
- 2012: 12 buildings, average cost: $179,500
- 2011: 19 buildings, average cost: $127,600
- 2010: 24 buildings, average cost: $205,600
- 2009: 34 buildings, average cost: $215,700
- 2008: 56 buildings, average cost: $148,700
- 2007: 105 buildings, average cost: $158,100
- 2006: 102 buildings, average cost: $150,800
- 2005: 118 buildings, average cost: $142,600
- 2004: 56 buildings, average cost: $203,100
- 2003: 49 buildings, average cost: $134,100
- 2002: 57 buildings, average cost: $135,500
- 2001: 56 buildings, average cost: $135,600
- 2000: 115 buildings, average cost: $122,600
- 1999: 92 buildings, average cost: $113,700
- 1998: 90 buildings, average cost: $115,400
- 1997: 91 buildings, average cost: $102,200
Median real estate property taxes paid for housing units with mortgages in 2022: $1,379 (0.6%)
Median real estate property taxes paid for housing units with no mortgage in 2022: $669 (0.5%)
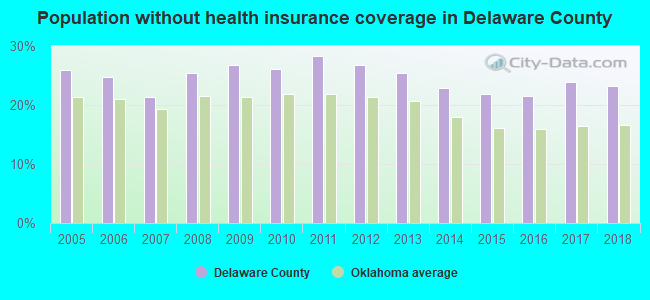
| Delaware County: | 19.6% |
| Oklahoma: | 15.7% |
Median age of residents in 2022: 47.1 years old
(Males: 46.3 years old, Females: 48.6 years old)
(Median age for: White residents: 55.4 years old, Black residents: 39.0 years old, American Indian residents: 34.7 years old, Asian residents: 34.4 years old, Hispanic or Latino residents: 23.4 years old, Other race residents: 29.5 years old)
Fair market rent in 2006 for a 1-bedroom apartment in Delaware County is $364 a month.
Fair market rent for a 2-bedroom apartment is $451 a month.
Fair market rent for a 3-bedroom apartment is $606 a month.
Cities in this county include: Grove, Jay, Copeland, Kenwood, Cleora, West Siloam Springs, Colcord, Kansas, Flint Creek, Bernice.
Neighboring counties: Christian County, Missouri  , Greene County, Tennessee
  , Robertson County, Tennessee , Trousdale County, Tennessee , Scott County, Virginia , Todd County, Kentucky , Danville city, Virginia .
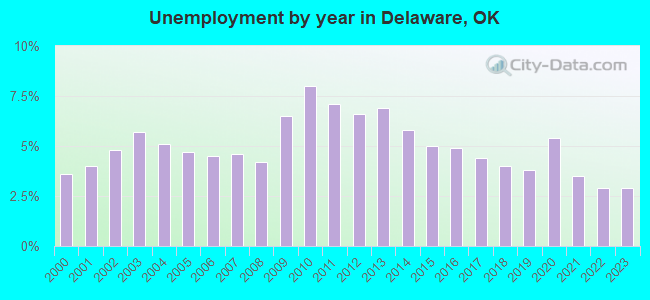
| Here: | 4.1% |
| Oklahoma: | 3.2% |

Current college students: 796
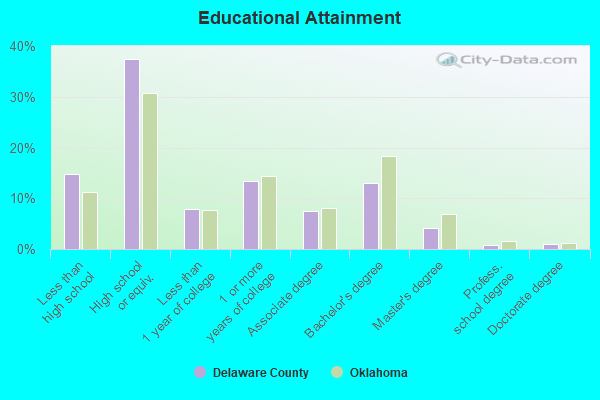
People 25 years of age or older with a high school degree or higher: 85.9%
People 25 years of age or older with a bachelor's degree or higher: 18.7%
Number of foreign born residents: 767 (55.0% naturalized citizens)
| Delaware County: | 1.9% |
| Whole state: | 6.0% |
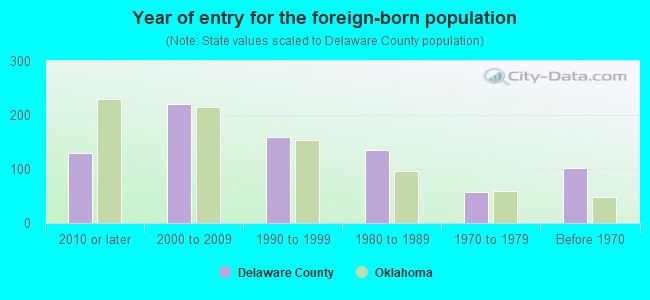
- Year of entry for the foreign-born population
- 1322010 or later
- 2662000 to 2009
- 1451990 to 1999
- 1351980 to 1989
- 571970 to 1979
- 102Before 1970
Mean travel time to work (commute): minutes
Percentage of county residents living and working in this county: 78.1%
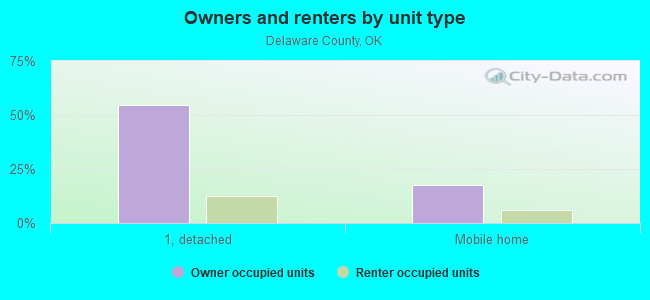
Housing units in structures:
- One, detached: 15,985
- One, attached: 607
- Two: 471
- 3 or 4: 373
- 5 to 9: 206
- 10 to 19: 117
- 20 to 49: 103
- 50 or more: 197
- Mobile homes: 6,267
- Boats, RVs, vans, etc.: 97
Housing units in Delaware County with a mortgage: 5,524 (347 second mortgage, 7 home equity loan, 236 both second mortgage and home equity loan)
Houses without a mortgage: 76
| Here: | 6.2% with mortgage |
| State: | 98.5% with mortgage |
Religion statistics for Delaware County
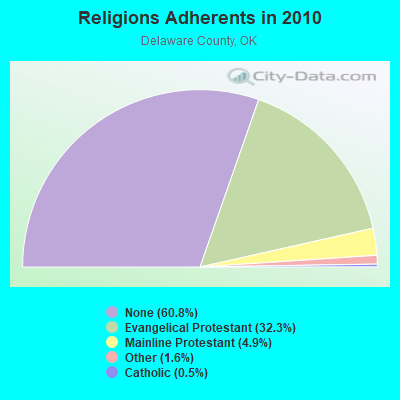
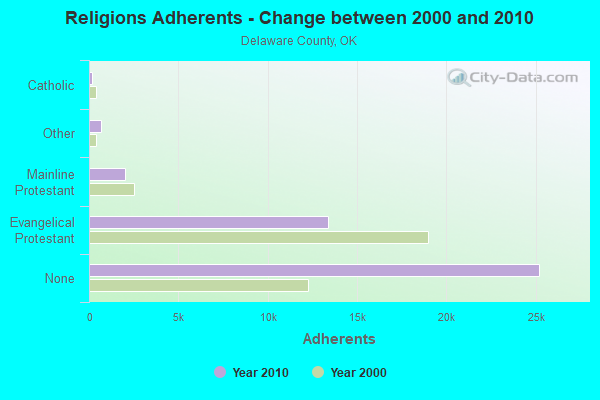
| Religion | Adherents | Congregations |
|---|---|---|
| Evangelical Protestant | 13,399 | 77 |
| Mainline Protestant | 2,031 | 6 |
| Other | 660 | 4 |
| Catholic | 190 | 1 |
| None | 25,207 | - |
Source: Clifford Grammich, Kirk Hadaway, Richard Houseal, Dale E.Jones, Alexei Krindatch, Richie Stanley and Richard H.Taylor. 2012. 2010 U.S.Religion Census: Religious Congregations & Membership Study. Association of Statisticians of American Religious Bodies. Jones, Dale E., et al. 2002. Congregations and Membership in the United States 2000. Nashville, TN: Glenmary Research Center.
Food Environment Statistics:
| Delaware County: | 1.24 / 10,000 pop. |
| State: | 1.97 / 10,000 pop. |
| Here: | 0.25 / 10,000 pop. |
| Oklahoma: | 0.20 / 10,000 pop. |
| This county: | 1.98 / 10,000 pop. |
| Oklahoma: | 0.76 / 10,000 pop. |
| Delaware County: | 4.22 / 10,000 pop. |
| Oklahoma: | 4.35 / 10,000 pop. |
| This county: | 6.20 / 10,000 pop. |
| State: | 6.89 / 10,000 pop. |
| Delaware County: | 12.1% |
| Oklahoma: | 10.3% |
| Delaware County: | 30.0% |
| State: | 29.2% |
Agriculture in Delaware County:
Average size of farms: 203 acresAverage value of agricultural products sold per farm: $94,478
Average value of crops sold per acre for harvested cropland: $59.55
The value of livestock, poultry, and their products as a percentage of the total market value of agricultural products sold: 97.07%
Average total farm production expenses per farm: $70,190
Harvested cropland as a percentage of land in farms: 22.92%
Irrigated harvested cropland as a percentage of land in farms: 0.63%
Average market value of all machinery and equipment per farm: $30,518
The percentage of farms operated by a family or individual: 95.05%
Average age of principal farm operators: 55 years
Average number of cattle and calves per 100 acres of all land in farms: 26.49
Milk cows as a percentage of all cattle and calves: 4.09%
All wheat for grain: 2868 harvested acres
Soybeans for beans: 1790 harvested acres
Vegetables: 457 harvested acres
Land in orchards: 184 acres
Earthquake activity:
Delaware County-area historical earthquake activity is significantly above Oklahoma state average. It is 694% greater than the overall U.S. average.On 9/3/2016 at 12:02:44, a magnitude 5.8 (5.8 MW, Depth: 3.5 mi, Class: Moderate, Intensity: VI - VII) earthquake occurred 117.6 miles away from Delaware County center
On 11/6/2011 at 03:53:10, a magnitude 5.7 (5.7 MW, Depth: 3.2 mi) earthquake occurred 126.8 miles away from the county center
On 11/7/2016 at 01:44:24, a magnitude 5.0 (5.0 MW, Depth: 2.8 mi) earthquake occurred 115.7 miles away from the county center
On 11/5/2011 at 07:12:45, a magnitude 4.8 (4.8 MW, Depth: 1.9 mi, Class: Light, Intensity: IV - V) earthquake occurred 126.1 miles away from the county center
On 11/8/2011 at 02:46:57, a magnitude 4.8 (4.8 MW, Depth: 3.1 mi) earthquake occurred 128.0 miles away from Delaware County center
On 11/12/2014 at 21:40:00, a magnitude 4.9 (4.9 MW, Depth: 2.5 mi) earthquake occurred 164.8 miles away from the county center
Magnitude types: moment magnitude (MW)
Most recent natural disasters:
- Oklahoma Covid-19 Pandemic, Incident Period: January 20, 2020, FEMA Id: 4530, Natural disaster type: Other
- Oklahoma Severe Storms, Straight-line Winds, Tornadoes, And Flooding, Incident Period: May 7, 2019, FEMA Id: 4438, Natural disaster type: Storm, Tornado, Flood, Wind
- Oklahoma Severe Storms, Tornadoes, Straight-line Winds, And Flooding, Incident Period: May 16, 2017 - May 20, 2017, FEMA Id: 4324, Natural disaster type: Storm, Tornado, Flood, Wind
- Oklahoma Severe Storms, Tornadoes, And Flooding, Incident Period: April 28, 2017 - May 2, 2017, FEMA Id: 4315, Natural disaster type: Storm, Tornado, Flood
- Oklahoma Severe Winter Storms and Flooding, Incident Period: December 26, 2015 to January 05, 2016, Major Disaster (Presidential) Declared DR-4256: February 10, 2016, FEMA Id: 4256, Natural disaster type: Winter Storm, Flood
- Oklahoma Severe Storms, Tornadoes, Straight-line Winds, and Flooding, Incident Period: May 05, 2015 to June 22, 2015, Major Disaster (Presidential) Declared DR-4222: May 26, 2015, FEMA Id: 4222, Natural disaster type: Storm, Tornado, Flood, Wind
- Oklahoma Severe Storms, Tornadoes, Straight-line Winds, and Flooding, Incident Period: May 22, 2011 to May 25, 2011, Major Disaster (Presidential) Declared DR-1989: June 06, 2011, FEMA Id: 1989, Natural disaster type: Storm, Tornado, Flood, Wind
- Oklahoma Severe Storms and Flooding, Incident Period: April 21, 2011 to April 28, 2011, Major Disaster (Presidential) Declared DR-1988: May 27, 2011, FEMA Id: 1988, Natural disaster type: Storm, Flood
- Oklahoma Severe Winter Storm, Incident Period: January 31, 2011 to February 05, 2011, Emergency Declared EM-3316: February 02, 2011, FEMA Id: 3316, Natural disaster type: Winter Storm
- Oklahoma Severe Winter Storm, Incident Period: January 28, 2010 to January 30, 2010, Major Disaster (Presidential) Declared DR-1883: March 05, 2010, FEMA Id: 1883, Natural disaster type: Winter Storm
- 17 other natural disasters have been reported since 1953.
The number of natural disasters in Delaware County (27) is a lot greater than the US average (15).
Major Disasters (Presidential) Declared: 18
Emergencies Declared: 5
Causes of natural disasters: Floods: 14, Storms: 14, Tornadoes: 11, Winter Storms: 11, Winds: 4, Hurricane: 1, Other: 1 (Note: some incidents may be assigned to more than one category).
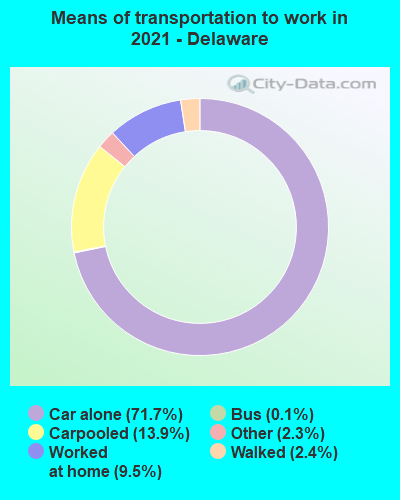
Means of transportation to work:
- Drove a car alone: 8,610 (70.2%)
- Carpooled: 1,569 (12.8%)
- Bus: 7 (0.1%)
- Long-distance train or commuter rail: 1 (0.0%)
- Taxicab, motorcycle, or other means: 255 (2.1%)
- Bicycle: 5 (0.0%)
- Walked: 288 (2.3%)
- Worked at home: 1,641 (13.4%)
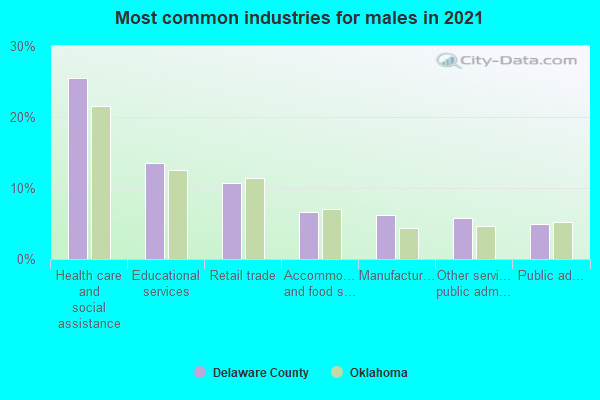
- Health care and social assistance (21%)
- Educational services (13%)
- Retail trade (12%)
- Manufacturing (7%)
- Accommodation and food services (6%)
- Other services, except public administration (5%)
- Professional, scientific, and technical services (5%)
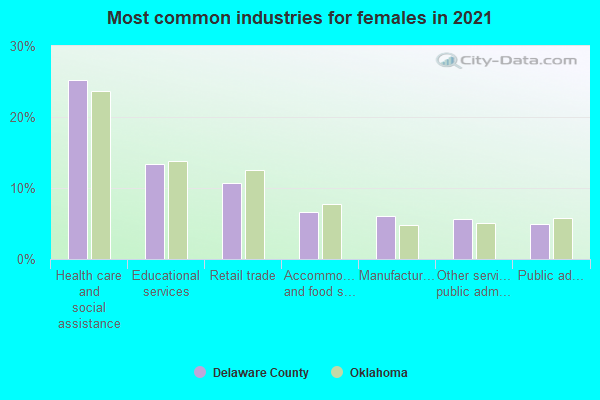
- Health care and social assistance (22%)
- Educational services (13%)
- Retail trade (12%)
- Manufacturing (7%)
- Accommodation and food services (6%)
- Other services, except public administration (6%)
- Professional, scientific, and technical services (5%)
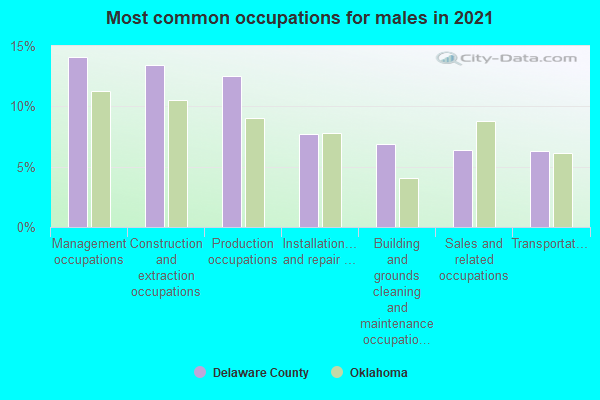
- Management occupations (16%)
- Construction and extraction occupations (13%)
- Production occupations (12%)
- Sales and related occupations (8%)
- Installation, maintenance, and repair occupations (8%)
- Transportation occupations (6%)
- Building and grounds cleaning and maintenance occupations (6%)

- Office and administrative support occupations (21%)
- Educational instruction, and library occupations (11%)
- Sales and related occupations (10%)
- Healthcare support occupations (7%)
- Management occupations (7%)
- Food preparation and serving related occupations (6%)
- Health diagnosing and treating practitioners and other technical occupations (5%)
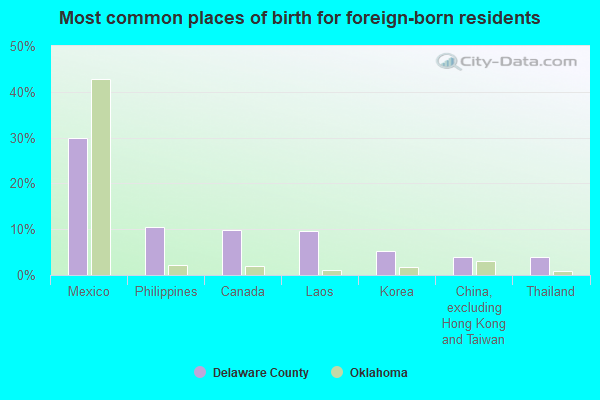
- Mexico (24%)
- Philippines (11%)
- Laos (8%)
- Canada (7%)
- Thailand (6%)
- Korea (6%)
- China, excluding Hong Kong and Taiwan (5%)
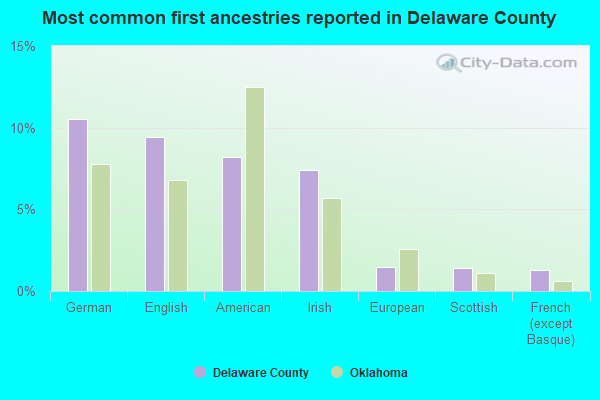
- English (10%)
- German (10%)
- American (10%)
- Irish (7%)
- European (2%)
- Scottish (1%)
- Scotch-Irish (1%)
People in group quarters in Delaware County, Oklahoma in 2010:
- 220 people in nursing facilities/skilled-nursing facilities
- 62 people in local jails and other municipal confinement facilities
- 39 people in group homes for juveniles (non-correctional)
- 23 people in group homes intended for adults
- 12 people in residential treatment centers for adults
People in group quarters in Delaware County, Oklahoma in 2000:
- 213 people in other group homes
- 190 people in nursing homes
- 40 people in homes for abused, dependent, and neglected children
- 34 people in other noninstitutional group quarters
- 27 people in local jails and other confinement facilities (including police lockups)
- 18 people in homes for the mentally retarded
- 6 people in homes or halfway houses for drug/alcohol abuse
- 2 people in unknown juvenile institutions
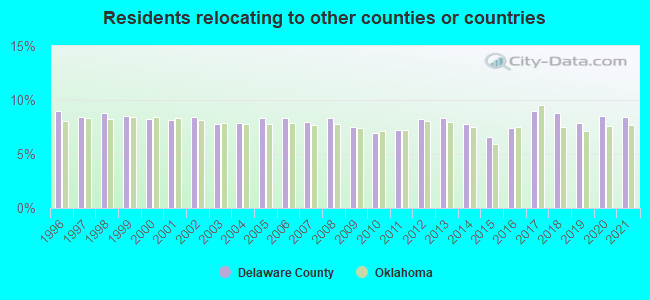
11.08% of this county's 2021 resident taxpayers lived in other counties in 2020 ($55,590 average adjusted gross income)
| Here: | 11.08% |
| Oklahoma average: | 8.28% |
10 or fewer of this county's residents moved from foreign countries.
4.62% relocated from other counties in Oklahoma ($21,271 average AGI)
6.46% relocated from other states ($34,319 average AGI)
Delaware County: 6.46% Oklahoma average: 3.37%

Top counties from which taxpayers relocated into this county between 2020 and 2021:
| from Benton County, AR | |
| from Tulsa County, OK | |
| from Ottawa County, OK | |
| from Mayes County, OK | |
| from Adair County, OK | |
| from Jasper County, MO | |
| from McDonald County, MO |
8.45% of this county's 2020 resident taxpayers moved to other counties in 2021 ($42,042 average adjusted gross income)
| Here: | 8.45% |
| Oklahoma average: | 7.66% |
10 or fewer of this county's residents moved to foreign countries.
4.15% relocated to other counties in Oklahoma ($20,342 average AGI)
4.30% relocated to other states ($21,700 average AGI)
Delaware County: 4.30% Oklahoma average: 2.72%
Top counties to which taxpayers relocated from this county between 2020 and 2021:
| to Benton County, AR | |
| to Ottawa County, OK | |
| to Tulsa County, OK | |
| to Mayes County, OK | |
| to Cherokee County, OK | |
| to Washington County, AR | |
| to Rogers County, OK |
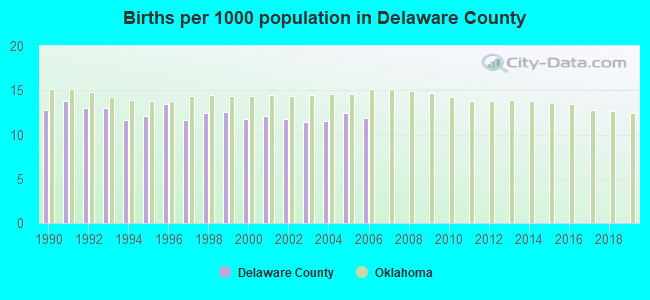
Births per 1000 population from 1990 to 1999: 12.6
Births per 1000 population from 2000 to 2006: 11.8
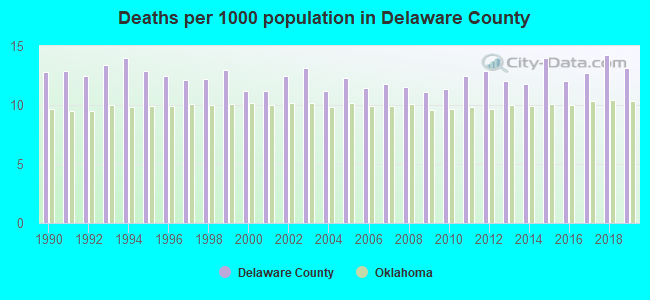
Deaths per 1000 population from 1990 to 1999: 12.8
Deaths per 1000 population from 2000 to 2009: 11.7
Deaths per 1000 population from 2010 to 2020: 13.0
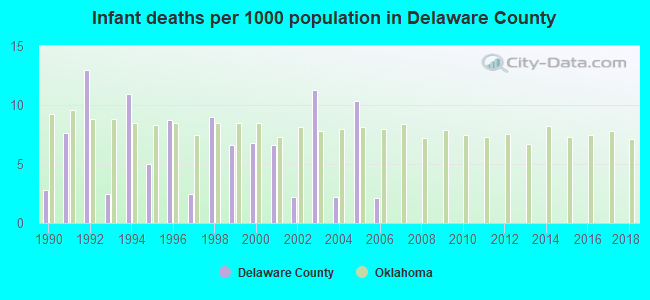
Infant deaths per 1000 live births from 1990 to 1999: 6.9
Infant deaths per 1000 live births from 2000 to 2006: 5.9
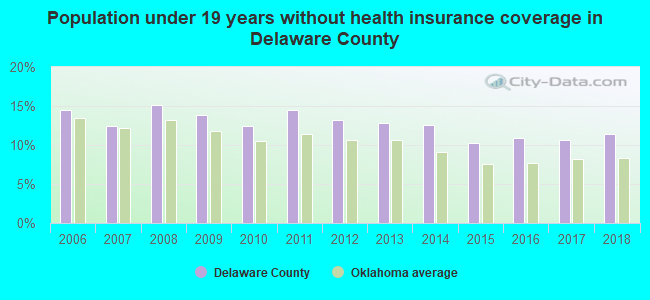
Persons under 19 years old without health insurance coverage in 2018: 11.4%
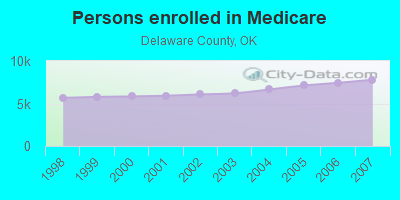
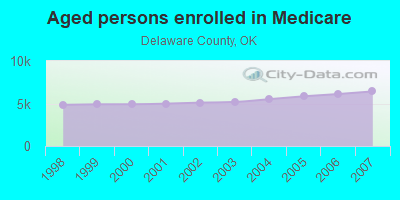
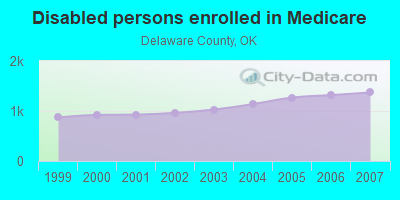
Persons enrolled in hospital insurance and/or supplemental medical insurance (Medicare) in July 1, 2007: 7,794 (6,423 aged, 1,371 disabled)
Children under 18 without health insurance coverage in 2007: 1,044 (11%)
Most common underlying causes of death in Delaware County, Oklahoma in 1999 - 2019:
- Atherosclerotic heart disease (855)
- Atherosclerotic cardiovascular disease, so described (739)
- Bronchus or lung, unspecified - Malignant neoplasms (730)
- Acute myocardial infarction, unspecified (580)
- Chronic obstructive pulmonary disease, unspecified (573)
- Stroke, not specified as haemorrhage or infarction (324)
- Alzheimer disease, unspecified (281)
- Unspecified dementia (192)
- Hypertensive heart disease without (congestive) heart failure (170)
- Congestive heart failure (128)
Population without health insurance coverage in 2000: 21%
Children under 18 without health insurance coverage in 2000: 18%
Short term general hospital admissions per 100,000 population in 2004: 8,959
Short term general hospital beds per 100,000 population in 2004: 128
Emergency room visits per 100,000 population in 2004: 34,952
General practice office based MDs per 100,000 population in 2005: 1,249
Medical specialist MDs per 100,000 population in 2005: 1,162
Dentists per 100,000 population in 1998: 15
Total births per 100,000 population, July 2005 - July 2006 : 23
Total deaths per 100,000 population, July 2005 - July 2006: 38
Suicides per 1,000,000 population from 2000 to 2006: 141.4. This is less than state average.
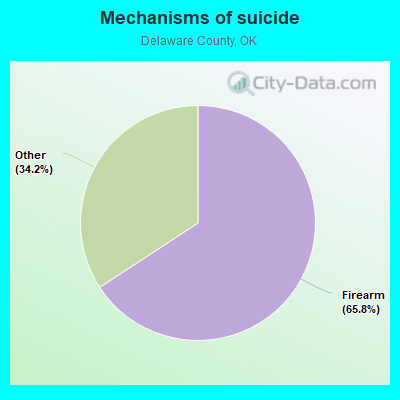
- Firearm - 93.0
- Other - 48.4
Household type by relationship:
Households: 41,297- Male householders: 8,130 (2,398 living alone), Female householders: 9,049 (2,600 living alone)
8,463 spouses (8,407 opposite-sex spouses), 1,084 unmarried partners, (1,057 opposite-sex unmarried partners), 9,339 children (8,523 natural, 197 adopted, 619 stepchildren), 1,881 grandchildren, 320 brothers or sisters, 550 parents, 23 foster children, 814 other relatives, 1,176 non-relatives
- In group quarters: 517
Size of family households: 6,245 2-persons, 1,976 3-persons, 1,601 4-persons, 875 5-persons, 244 6-persons, 340 7-or-more-persons.
Size of nonfamily households: 4,998 1-person, 828 2-persons, 42 3-persons, 3 4-persons, 22 5-persons, 1 6-persons, 15 7-or-more-persons.
4,131 married couples with children.
2,009 single-parent households (551 men, 1,458 women).
96.2% of residents of Delaware speak English at home.
1.8% of residents speak Spanish at home (70% speak English very well, 18% speak English well, 9% speak English not well, 4% don't speak English at all).
0.3% of residents speak other Indo-European language at home (47% speak English very well, 20% speak English well, 34% speak English not well).
1.0% of residents speak Asian or Pacific Island language at home (58% speak English very well, 27% speak English well, 8% speak English not well, 6% don't speak English at all).
1.0% of residents speak other language at home (83% speak English very well, 12% speak English well, 5% speak English not well).
In fiscal year 2004:
Federal Government expenditure: $200,377,000 ($5,126 per capita)
Department of Defense expenditure: $6,561,000
Federal direct payments to individuals for retirement and disability: $101,989,000
Federal other direct payments to individuals: $46,902,000
Federal direct payments not to individuals: $334,000
Federal grants: $45,101,000
Federal procurement contracts: $1,966,000 ($1,148,000 Department of Defense)
Federal salaries and wages: $4,086,000 ($0,000 Department of Defense)
Federal Government direct loans: $1,885,000
Federal guaranteed/insured loans: $22,602,000
Federal Government insurance: $11,258,000
Population change from April 1, 2000 to July 1, 2005:
Births: 2,274| Here: | 58 per 1000 residents |
| State: | 75 per 1000 residents |
Deaths: 2,462
| Here: | 63 per 1000 residents |
| State: | 52 per 1000 residents |
Net international migration: +94
| Here: | +2 per 1000 residents |
| State: | +10 per 1000 residents |
Net internal migration: +2,215
| Here: | |
| State: |
Total withdrawal of fresh water for public supply: 1.75 millions of gallons per day (30% from ground, 70% from surface)
| Here: | 5.8 |
| State: | 6.1 |
| Here: | 4.6 |
| State: | 4.5 |
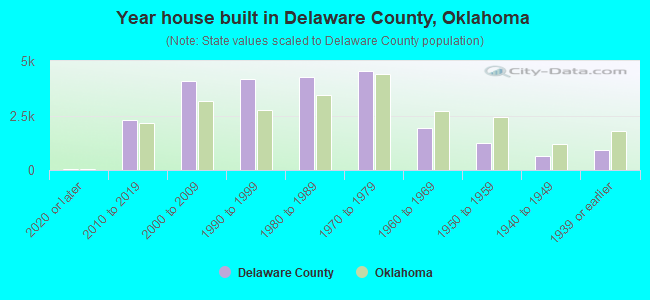
- Year house built in Delaware County, Oklahoma
- 552020 or later
- 2,5062010 to 2019
- 4,2502000 to 2009
- 4,0691990 to 1999
- 4,3161980 to 1989
- 4,4691970 to 1979
- 1,8531960 to 1969
- 1,0971950 to 1959
- 6551940 to 1949
- 8931939 or earlier
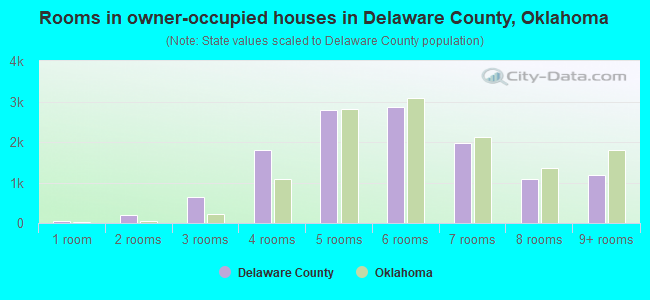
- Rooms in owner-occupied houses in Delaware County, Oklahoma
- 681 room
- 2522 rooms
- 8363 rooms
- 1,6704 rooms
- 2,8745 rooms
- 2,8616 rooms
- 1,9047 rooms
- 1,2088 rooms
- 1,2419+ rooms
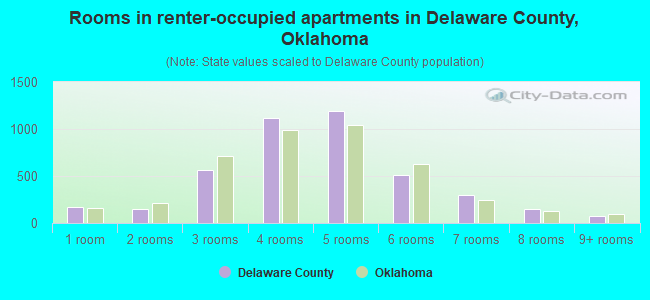
- Rooms in renter-occupied apartments in Delaware County, Oklahoma
- 1751 room
- 1322 rooms
- 6273 rooms
- 1,2184 rooms
- 1,0145 rooms
- 5896 rooms
- 3477 rooms
- 1448 rooms
- 979+ rooms
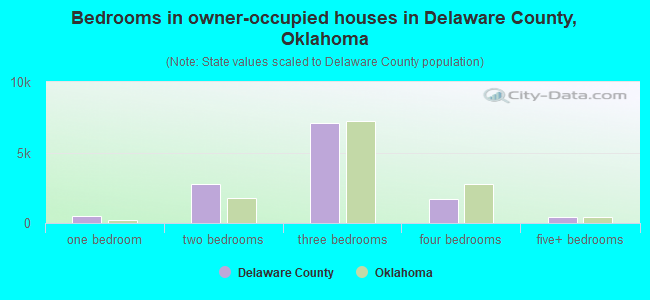
- Bedrooms in owner-occupied houses in Delaware County, Oklahoma
- 107no bedroom
- 6321 bedroom
- 2,6552 bedrooms
- 7,2733 bedrooms
- 1,6914 bedrooms
- 3985+ bedrooms
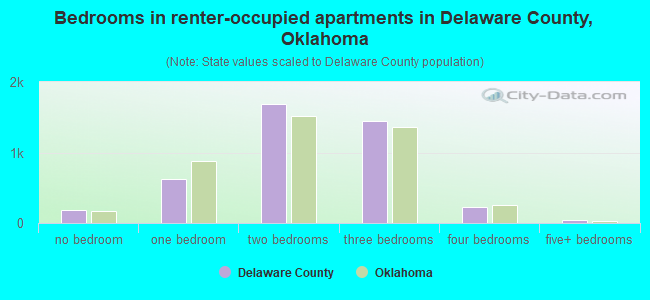
- Bedrooms in renter-occupied apartments in Delaware County, Oklahoma
- 198no bedroom
- 6371 bedroom
- 1,7702 bedrooms
- 1,4503 bedrooms
- 2764 bedrooms
- 355+ bedrooms
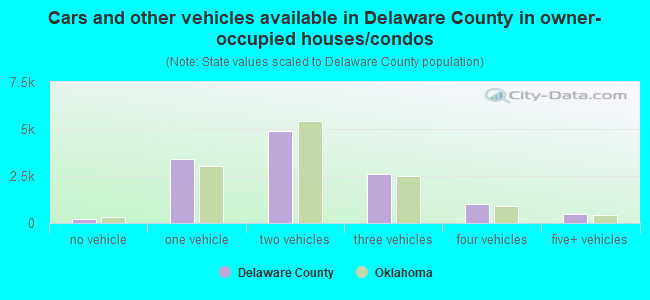
- Cars and other vehicles available in Delaware County in owner-occupied houses/condos
- 254no vehicle
- 3,1681 vehicle
- 5,2322 vehicles
- 2,6273 vehicles
- 9664 vehicles
- 5035+ vehicles
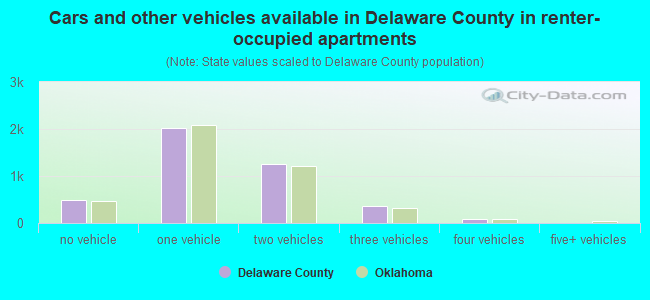
- Cars and other vehicles available in Delaware County in renter-occupied apartments
- 496no vehicle
- 2,1631 vehicle
- 1,2822 vehicles
- 3483 vehicles
- 904 vehicles
- 05+ vehicles
88.0% of Delaware County residents lived in the same house 1 years ago.
Out of people who lived in different houses, 30% lived in this county.
Out of people who lived in different counties, 41% lived in Oklahoma.
| Delaware County: | 88.0% |
| State average: | 85.5% |
Place of birth for U.S.-born residents:
- This state: 19,190
- Other state: 21,378
- Northeast: 726
- Midwest: 7,792
- South: 8,668
- West: 4,160
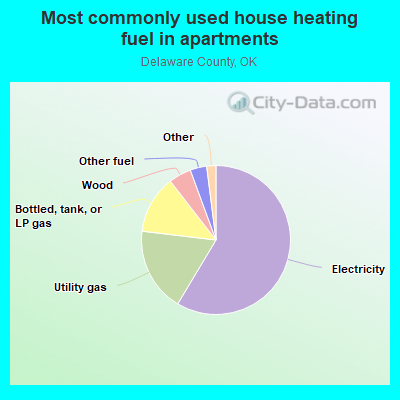
- 48.8%Electricity
- 21.4%Utility gas
- 16.9%Bottled, tank, or LP gas
- 8.8%Wood
- 3.8%Other fuel
- 0.1%Fuel oil, kerosene, etc.
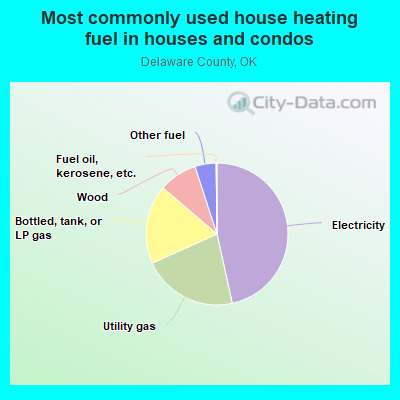
- 62.7%Electricity
- 16.2%Utility gas
- 12.1%Bottled, tank, or LP gas
- 4.1%Wood
- 3.4%Other fuel
- 0.8%Fuel oil, kerosene, etc.
- 0.5%No fuel used
- 0.2%Coal or coke
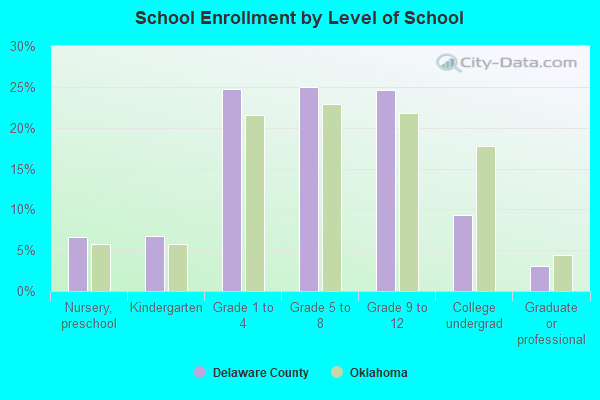
Private vs. public school enrollment:
| Here: | 10.9% |
| Oklahoma: | 11.7% |
| Here: | 11.1% |
| Oklahoma: | 11.7% |
| Here: | 18.0% |
| Oklahoma: | 19.3% |
Delaware County government finances - Expenditure in 2020:
- Construction - Regular Highways: $540,000
Toll Highways: $267,000
- Current Operations - Police Protection: $1,945,000
Police Protection: $1,097,000
Financial Administration: $766,000
Local Fire Protection: $394,000
Toll Highways: $260,000
Central Staff Services: $225,000
Financial Administration: $62,000
Judicial and Legal Services: $45,000
- Local Intergovernmental - Other: $401,000
- Miscellaneous - Interest Earnings: $88,000
- Other Capital Outlay - Local Fire Protection: $1,353,000
Regular Highways: $495,000
Police Protection: $49,000
- State Intergovernmental - Highways: $4,569,000
Highways: $3,177,000
General Local Government Support: $291,000
General Local Government Support: $227,000
- Tax - Property: $35,417,000
General Sales and Gross Receipts: $6,243,000
General Sales and Gross Receipts: $5,227,000
Property: $3,129,000
Motor Vehicle License: $103,000
Motor Vehicle License: $88,000
Delaware County government finances - Revenue in 2020:
- Construction - Regular Highways: $540,000
Toll Highways: $267,000
- Current Operations - Police Protection: $1,945,000
Police Protection: $1,097,000
Financial Administration: $766,000
Local Fire Protection: $394,000
Toll Highways: $260,000
Central Staff Services: $225,000
Financial Administration: $62,000
Judicial and Legal Services: $45,000
- Local Intergovernmental - Other: $401,000
- Miscellaneous - Interest Earnings: $88,000
- Other Capital Outlay - Local Fire Protection: $1,353,000
Regular Highways: $495,000
Police Protection: $49,000
- State Intergovernmental - Highways: $4,569,000
Highways: $3,177,000
General Local Government Support: $291,000
General Local Government Support: $227,000
- Tax - Property: $35,417,000
General Sales and Gross Receipts: $6,243,000
General Sales and Gross Receipts: $5,227,000
Property: $3,129,000
Motor Vehicle License: $103,000
Motor Vehicle License: $88,000
Delaware County government finances - Debt in 2020:
- Construction - Regular Highways: $540,000
Toll Highways: $267,000
- Current Operations - Police Protection: $1,945,000
Police Protection: $1,097,000
Financial Administration: $766,000
Local Fire Protection: $394,000
Toll Highways: $260,000
Central Staff Services: $225,000
Financial Administration: $62,000
Judicial and Legal Services: $45,000
- Local Intergovernmental - Other: $401,000
- Miscellaneous - Interest Earnings: $88,000
- Other Capital Outlay - Local Fire Protection: $1,353,000
Regular Highways: $495,000
Police Protection: $49,000
- State Intergovernmental - Highways: $4,569,000
Highways: $3,177,000
General Local Government Support: $291,000
General Local Government Support: $227,000
- Tax - Property: $35,417,000
General Sales and Gross Receipts: $6,243,000
General Sales and Gross Receipts: $5,227,000
Property: $3,129,000
Motor Vehicle License: $103,000
Motor Vehicle License: $88,000
Delaware County government finances - Cash and Securities in 2020:
- Construction - Regular Highways: $540,000
Toll Highways: $267,000
- Current Operations - Police Protection: $1,945,000
Police Protection: $1,097,000
Financial Administration: $766,000
Local Fire Protection: $394,000
Toll Highways: $260,000
Central Staff Services: $225,000
Financial Administration: $62,000
Judicial and Legal Services: $45,000
- Local Intergovernmental - Other: $401,000
- Miscellaneous - Interest Earnings: $88,000
- Other Capital Outlay - Local Fire Protection: $1,353,000
Regular Highways: $495,000
Police Protection: $49,000
- State Intergovernmental - Highways: $4,569,000
Highways: $3,177,000
General Local Government Support: $291,000
General Local Government Support: $227,000
- Tax - Property: $35,417,000
General Sales and Gross Receipts: $6,243,000
General Sales and Gross Receipts: $5,227,000
Property: $3,129,000
Motor Vehicle License: $103,000
Motor Vehicle License: $88,000
Supplemental Security Income (SSI) in 2006:
- Total number of recipients: 988
- Number of aged recipients: 103
- Number of blind and disabled recipients: 885
- Number of recipients under 18: 152
- Number of recipients between 18 and 64: 611
- Number of recipients older than 64: 225
- Number of recipients also receiving OASDI: 397
- Amount of payments (thousands of dollars): 405
| Most common first names in Delaware County, OK among deceased individuals | ||
| Name | Count | Lived (average) |
|---|---|---|
| James | 261 | 71.5 years |
| John | 258 | 76.3 years |
| Mary | 230 | 78.8 years |
| William | 217 | 76.1 years |
| Robert | 170 | 71.3 years |
| Charles | 168 | 73.5 years |
| George | 114 | 77.7 years |
| Thomas | 83 | 72.7 years |
| Jack | 79 | 71.1 years |
| Roy | 78 | 73.8 years |
| Most common last names in Delaware County, OK among deceased individuals | ||
| Last name | Count | Lived (average) |
|---|---|---|
| Smith | 143 | 74.2 years |
| Johnson | 94 | 74.3 years |
| Jones | 83 | 75.7 years |
| Brown | 78 | 76.3 years |
| Williams | 76 | 75.6 years |
| Roberts | 61 | 77.0 years |
| Wilson | 60 | 76.5 years |
| Davis | 60 | 75.5 years |
| Jackson | 58 | 74.8 years |
| Miller | 56 | 74.2 years |
| Businesses in Delaware County, OK | ||||
| Name | Count | Name | Count | |
|---|---|---|---|---|
| AT&T | 1 | McDonald's | 2 | |
| AutoZone | 1 | New Balance | 1 | |
| Best Western | 1 | Nike | 2 | |
| Blockbuster | 1 | Pizza Hut | 2 | |
| Burger King | 1 | RadioShack | 1 | |
| Chevrolet | 1 | SAS Shoes | 1 | |
| Curves | 1 | SONIC Drive-In | 2 | |
| Dairy Queen | 1 | Sears | 1 | |
| FedEx | 1 | Subway | 4 | |
| H&R Block | 2 | Taco Bell | 1 | |
| Jones New York | 1 | True Value | 1 | |
| KFC | 1 | U-Haul | 4 | |
| Kincaid | 1 | UPS | 2 | |
| La-Z-Boy | 1 | Vans | 1 | |
| Lane Furniture | 2 | Walgreens | 1 | |
| Lowe's | 1 | Walmart | 2 | |
| MasterBrand Cabinets | 1 | YMCA | 1 | |