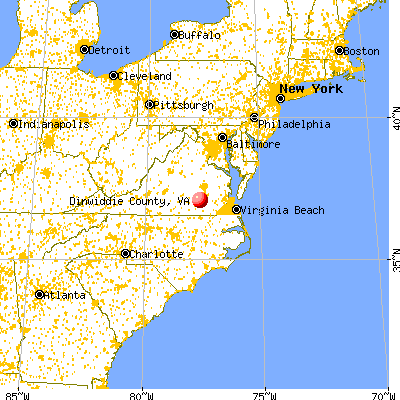
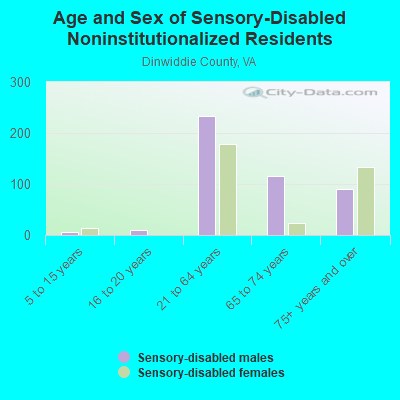
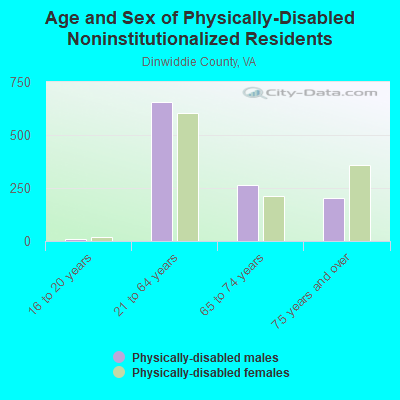
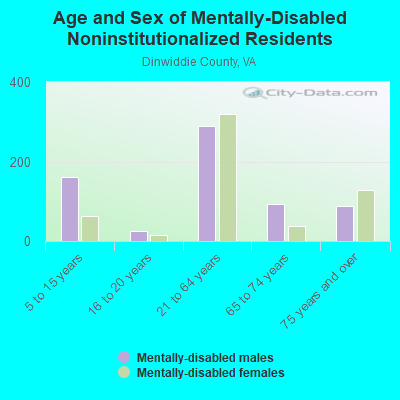
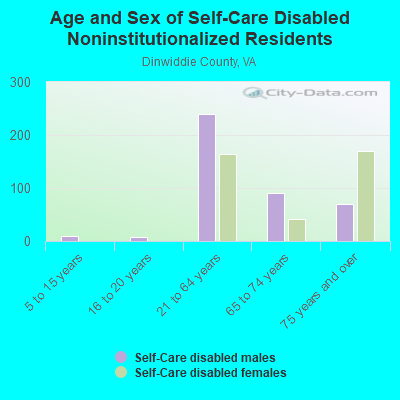
Dinwiddie County, Virginia (VA)
County owner-occupied free and clear houses and condos in 2010: 2,434
County owner-occupied houses and condos in 2000: 7,215
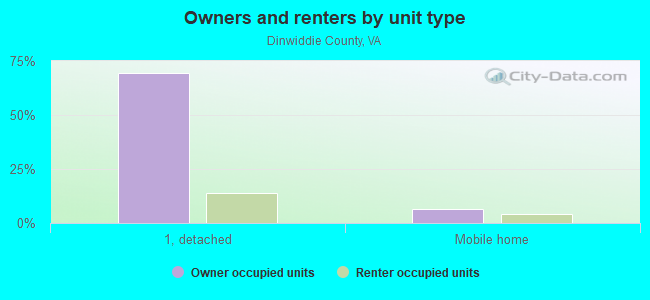
Renter-occupied apartments: 2,400 (it was 1,892 in 2000)
| % of renters here: | 21% |
| State: | 33% |
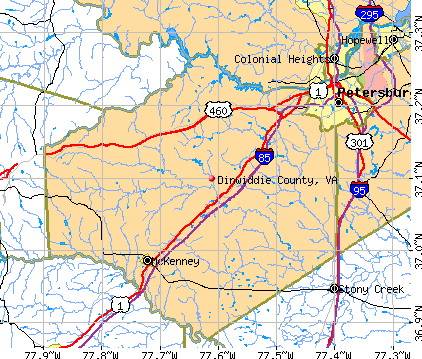
Land area: 504 sq. mi.
Water area: 3.3 sq. mi.
Population density: 56 people per square mile (average).
Industries providing employment: Educational, health and social services (22.7%), Retail trade (13.4%), Manufacturing (11.5%).
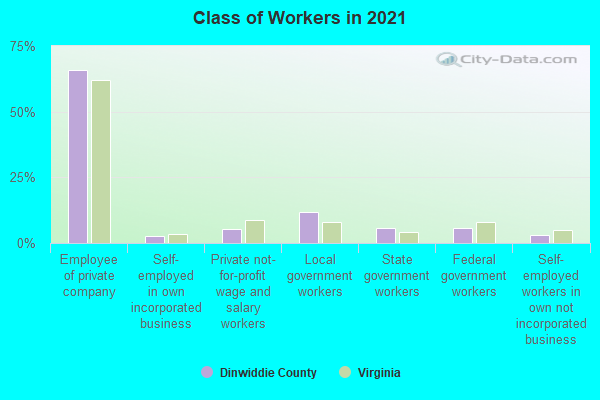
Type of workers:
- Private wage or salary: 73%
- Government: 23%
- Self-employed, not incorporated: 4%
- Unpaid family work: 0%
- OSM Map
- General Map
- Google Map
- MSN Map

- 17,34262.1%White Non-Hispanic Alone
- 8,59730.8%Black Non-Hispanic Alone
- 1,1584.1%Hispanic or Latino
- 3971.4%Two or more races
- 2200.8%Asian alone
- 2090.7%Some other race alone
- 200.07%Native Hawaiian and Other
Pacific Islander alone - 50.02%American Indian and Alaska Native alone

| Median resident age: | 43.7 years |
| Virginia median age: | 39.0 years |
| Males: 14,211 | |
| Females: 14,038 |

 | Petersburg, VA…? (12 replies) |
| Census Releases New CDPs for Virginia, 2020-2030 (5 replies) |
| Moving to/near Petersburg Virginia (3 replies) |
| School districts most likely to hire a first year teacher? (3 replies) |
| Worst county in Virginia *drum roll* (51 replies) |
| Hampton Roads Vs. Richmond (63 replies) |
| Dinwiddie County: | 2.0 people |
| Virginia: | 3 people |
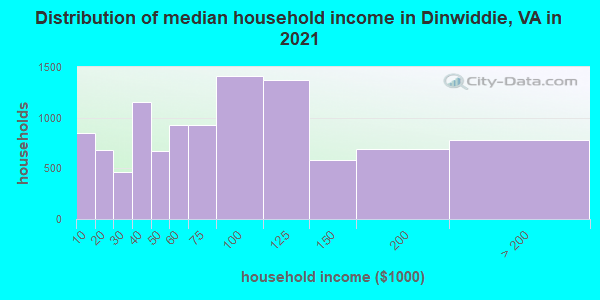
Estimated median household income in 2022: $76,007 ($41,582 in 1999)
| This county: | $76,007 |
| Virginia: | $85,873 |
Median contract rent in 2022 for apartments: $976 (lower quartile is $597, upper quartile is $1,148)
| This county: | $976 |
| State: | $1270 |
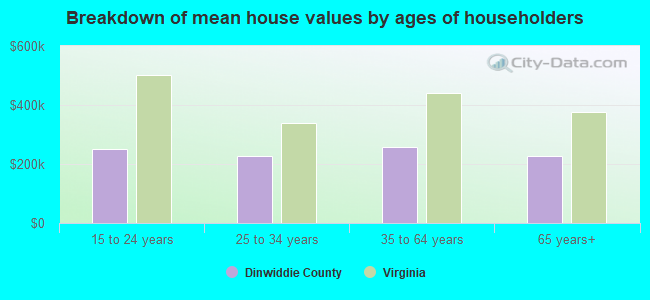
Estimated median house or condo value in 2022: $240,858 (it was $86,800 in 2000)
| Dinwiddie: | $240,858 |
| Virginia: | $365,700 |
Median monthly housing costs for homes and condos with a mortgage: $1,360
Median monthly housing costs for units without a mortgage: $446
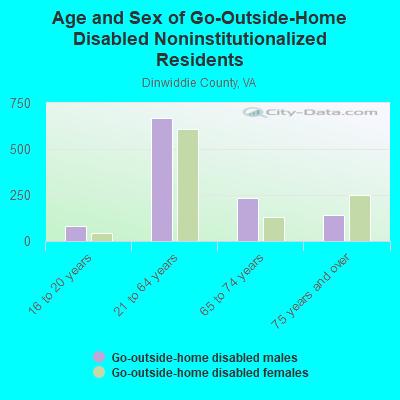
Institutionalized population: 327
Crime in 2021 (reported by the sheriff's office or county police, not the county total):
- Murders: 3
- Rapes: 6
- Robberies: 4
- Assaults: 70
- Burglaries: 33
- Thefts: 218
- Auto thefts: 15
Crime in 2020 (reported by the sheriff's office or county police, not the county total):
- Murders: 1
- Rapes: 7
- Robberies: 4
- Assaults: 58
- Burglaries: 48
- Thefts: 197
- Auto thefts: 13
Health of residents in Dinwiddie County based on CDC Behavioral Risk Factor Surveillance System Survey Questionnaires from 2013 to 2021:
General health status score of residents in this county from 1 (poor) to 5 (excellent) is 3.5. This is about average.73.5% of residents exercised in the past month. This is about average.
42.1% of residents smoked 100+ cigarettes in their lives. This is about average.
54.8% of adult residents drank alcohol in the past 30 days. This is less than average.
74.3% of residents visited a dentist within the past year. This is about average.
Average weight of males is 200 pounds. This is more than average.
Average weight of females is 167 pounds. This is more than average.
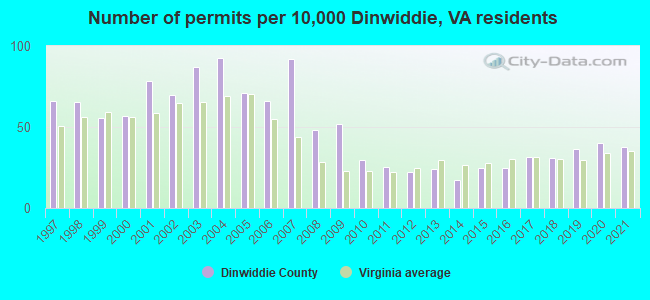
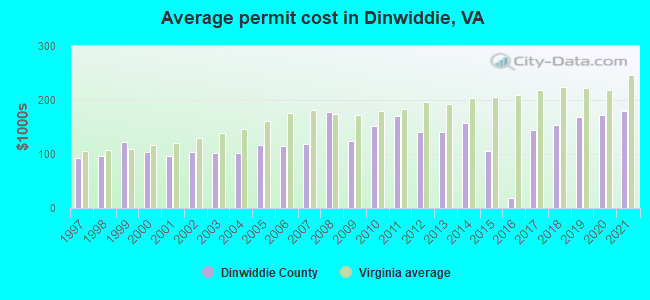
Single-family new house construction building permits:
- 2022: 84 buildings, average cost: $177,900
- 2021: 93 buildings, average cost: $180,400
- 2020: 99 buildings, average cost: $173,200
- 2019: 89 buildings, average cost: $168,500
- 2018: 75 buildings, average cost: $154,100
- 2017: 77 buildings, average cost: $143,900
- 2016: 61 buildings, average cost: $19,100
- 2015: 60 buildings, average cost: $104,600
- 2014: 42 buildings, average cost: $158,200
- 2013: 59 buildings, average cost: $140,900
- 2012: 54 buildings, average cost: $141,200
- 2011: 62 buildings, average cost: $170,700
- 2010: 72 buildings, average cost: $151,800
- 2009: 127 buildings, average cost: $125,000
- 2008: 118 buildings, average cost: $177,500
- 2007: 225 buildings, average cost: $118,500
- 2006: 162 buildings, average cost: $113,600
- 2005: 174 buildings, average cost: $117,200
- 2004: 227 buildings, average cost: $102,400
- 2003: 213 buildings, average cost: $102,300
- 2002: 171 buildings, average cost: $102,700
- 2001: 192 buildings, average cost: $96,700
- 2000: 140 buildings, average cost: $104,100
- 1999: 136 buildings, average cost: $122,200
- 1998: 160 buildings, average cost: $95,500
- 1997: 162 buildings, average cost: $92,100
Median real estate property taxes paid for housing units with mortgages in 2022: $1,447 (0.6%)
Median real estate property taxes paid for housing units with no mortgage in 2022: $1,484 (0.7%)


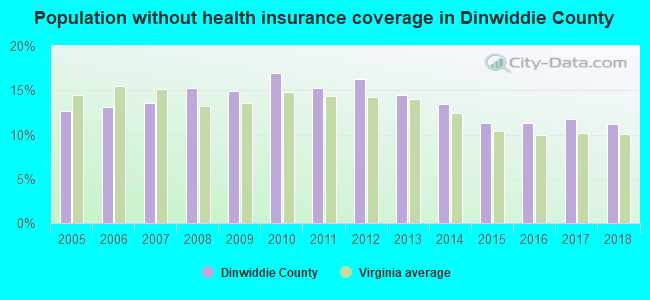
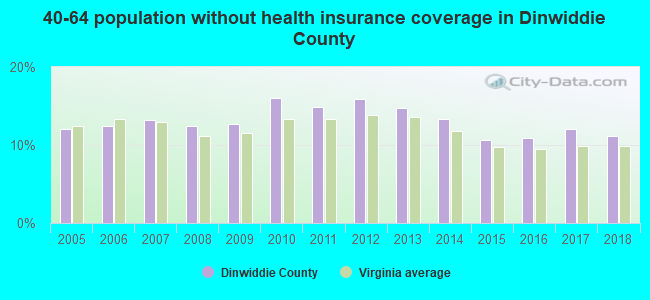
| Dinwiddie County: | 11.7% |
| Virginia: | 10.6% |
Median age of residents in 2022: 43.7 years old
(Males: 40.7 years old, Females: 45.7 years old)
(Median age for: White residents: 44.7 years old, Black residents: 45.1 years old, Asian residents: 40.5 years old, Hispanic or Latino residents: 27.1 years old, Other race residents: 28.7 years old)
Area name: Richmond, VA HUD Metro FMR Area
Fair market rent in 2006 for a 1-bedroom apartment in Dinwiddie County is $678 a month.
Fair market rent for a 2-bedroom apartment is $757 a month.
Fair market rent for a 3-bedroom apartment is $1010 a month.
Cities in this county include: McKenney.
Neighboring counties: Elk County, Kansas  , Montgomery County , Laurel County, Kentucky , Patrick County , Wythe County .
| Here: | 3.0% |
| Virginia: | 2.7% |
Current college students: 686
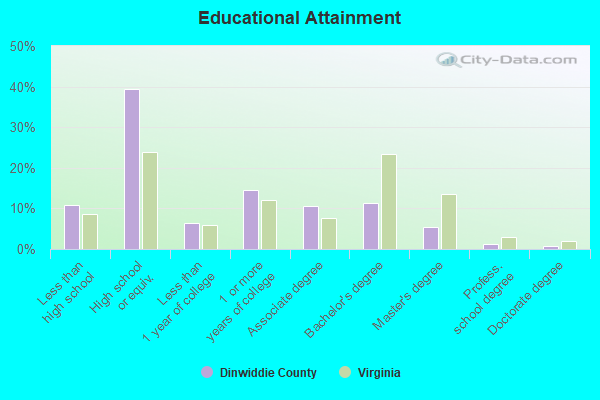
People 25 years of age or older with a high school degree or higher: 89.5%
People 25 years of age or older with a bachelor's degree or higher: 17.9%
Number of foreign born residents: 647 (46.5% naturalized citizens)
| Dinwiddie County: | 2.3% |
| Whole state: | 12.7% |
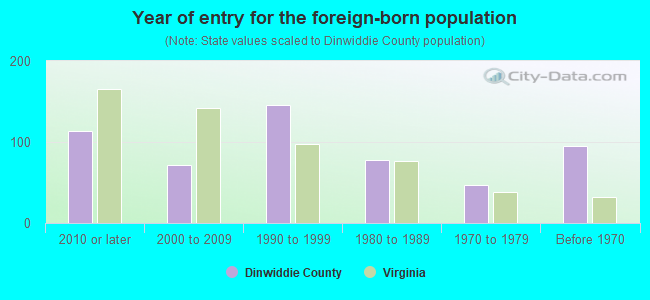
- Year of entry for the foreign-born population
- 1422010 or later
- 1162000 to 2009
- 1531990 to 1999
- 781980 to 1989
- 471970 to 1979
- 95Before 1970
Mean travel time to work (commute): minutes
Percentage of county residents living and working in this county: 100.5%
Housing units in structures:
- One, detached: 10,089
- One, attached: 18
- Two: 119
- 3 or 4: 111
- 5 to 9: 52
- 10 to 19: 240
- 50 or more: 22
- Mobile homes: 1,317
Housing units in Dinwiddie County with a mortgage: 5,648 (442 second mortgage, 0 home equity loan, 327 both second mortgage and home equity loan)
Houses without a mortgage: 262
| Here: | 1.9% with mortgage |
| State: | 97.2% with mortgage |
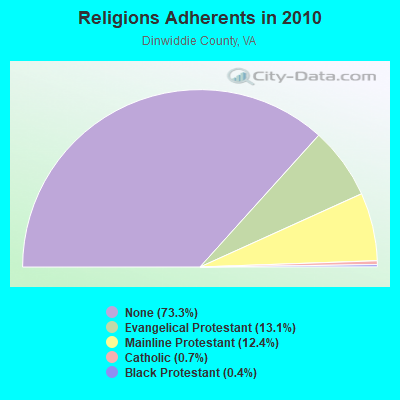
Religion statistics for Dinwiddie County
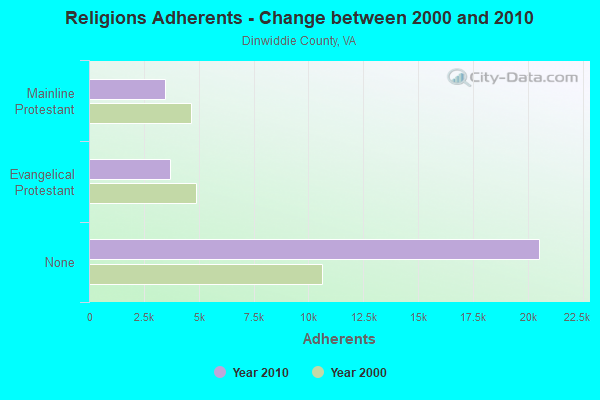
| Religion | Adherents | Congregations |
|---|---|---|
| Evangelical Protestant | 3,678 | 20 |
| Mainline Protestant | 3,485 | 22 |
| Catholic | 186 | 1 |
| Black Protestant | 120 | 2 |
| Other | 2 | - |
| None | 20,530 | - |
Source: Clifford Grammich, Kirk Hadaway, Richard Houseal, Dale E.Jones, Alexei Krindatch, Richie Stanley and Richard H.Taylor. 2012. 2010 U.S.Religion Census: Religious Congregations & Membership Study. Association of Statisticians of American Religious Bodies. Jones, Dale E., et al. 2002. Congregations and Membership in the United States 2000. Nashville, TN: Glenmary Research Center.
Food Environment Statistics:
| Dinwiddie County: | 2.72 / 10,000 pop. |
| State: | 2.03 / 10,000 pop. |
| This county: | 0.39 / 10,000 pop. |
| Virginia: | 1.43 / 10,000 pop. |
| Dinwiddie County: | 7.01 / 10,000 pop. |
| Virginia: | 4.03 / 10,000 pop. |
| This county: | 2.72 / 10,000 pop. |
| State: | 7.65 / 10,000 pop. |
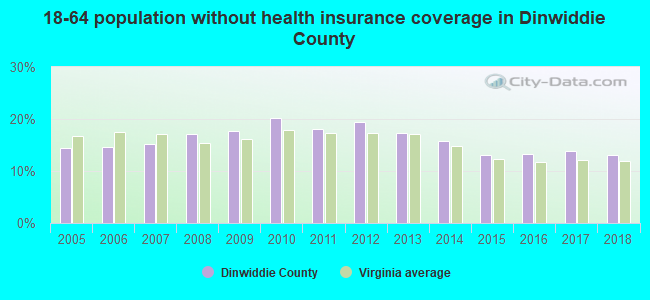
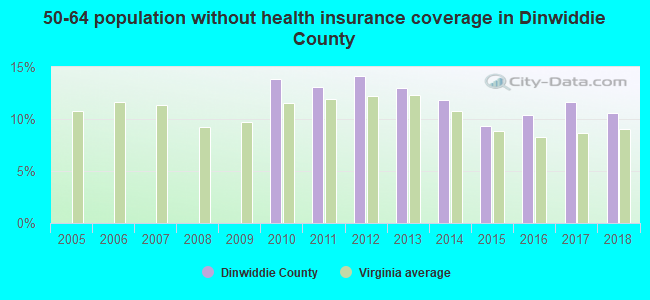
| Dinwiddie County: | 11.8% |
| Virginia: | 9.3% |
| Dinwiddie County: | 31.0% |
| State: | 26.7% |
| Here: | 12.5% |
| State: | 18.6% |
Agriculture in Dinwiddie County:
Average size of farms: 256 acresAverage value of agricultural products sold per farm: $40,707
Average value of crops sold per acre for harvested cropland: $273.40
The value of nursery, greenhouse, floriculture, and sod as a percentage of the total market value of agricultural products sold: 0.37%
The value of livestock, poultry, and their products as a percentage of the total market value of agricultural products sold: 35.72%
Average total farm production expenses per farm: $37,869
Harvested cropland as a percentage of land in farms: 37.38%
Irrigated harvested cropland as a percentage of land in farms: 3.17%
Average market value of all machinery and equipment per farm: $43,146
The percentage of farms operated by a family or individual: 91.69%
Average age of principal farm operators: 57 years
Average number of cattle and calves per 100 acres of all land in farms: 7.45
Milk cows as a percentage of all cattle and calves: 9.38%
Corn for grain: 2686 harvested acres
All wheat for grain: 2812 harvested acres
Upland cotton: 5915 harvested acres
Soybeans for beans: 12286 harvested acres
Vegetables: 147 harvested acres
Earthquake activity:
Dinwiddie County-area historical earthquake activity is significantly above Virginia state average. It is 53% smaller than the overall U.S. average.On 8/23/2011 at 17:51:04, a magnitude 5.8 (5.8 MW, Depth: 3.7 mi, Class: Moderate, Intensity: VI - VII) earthquake occurred 58.9 miles away from Dinwiddie County center
On 12/9/2003 at 20:59:14, a magnitude 4.5 (4.5 MB, 4.5 LG, Class: Light, Intensity: IV - V) earthquake occurred 37.4 miles away from the county center
On 12/9/2003 at 20:59:18, a magnitude 4.5 (4.5 ML, Depth: 6.2 mi) earthquake occurred 53.9 miles away from the county center
On 8/25/2011 at 05:07:52, a magnitude 4.5 (4.5 ML, Depth: 4.2 mi) earthquake occurred 61.9 miles away from the county center
On 8/9/2020 at 12:07:37, a magnitude 5.1 (5.1 MW, Depth: 4.7 mi) earthquake occurred 197.5 miles away from Dinwiddie County center
On 8/24/2011 at 00:04:36, a magnitude 4.2 (4.2 ML) earthquake occurred 59.5 miles away from the county center
Magnitude types: regional Lg-wave magnitude (LG), body-wave magnitude (MB), local magnitude (ML), moment magnitude (MW)
Most recent natural disasters:
- Virginia Covid-19 Pandemic, Incident Period: January 20, 2020, Major Disaster (Presidential) Declared DR-4512-VA: April 2, 2020, FEMA Id: 4512, Natural disaster type: Other
- Virginia Tropical Storm Michael, Incident Period: October 9, 2018 - October 16, 2018, FEMA Id: 4411, Natural disaster type: Tropical Storm
- Virginia Hurricane Sandy, Incident Period: October 26, 2012 to November 01, 2012, Emergency Declared EM-3359: October 29, 2012, FEMA Id: 3359, Natural disaster type: Hurricane
- Virginia Severe Storms and Straight-line Winds, Incident Period: June 29, 2012 to July 01, 2012, Major Disaster (Presidential) Declared DR-4072: July 27, 2012, FEMA Id: 4072, Natural disaster type: Storm, Wind
- Virginia Hurricane Irene, Incident Period: August 26, 2011 to August 28, 2011, Major Disaster (Presidential) Declared DR-4024: September 03, 2011, FEMA Id: 4024, Natural disaster type: Hurricane
- Virginia Severe Storms and Flooding, Including Severe Storms and Flooding Associated with Tropical Depression Ernesto, Incident Period: August 29, 2006 to September 07, 2006, Major Disaster (Presidential) Declared DR-1661: September 22, 2006, FEMA Id: 1661, Natural disaster type: Storm, Flood, Tropical Depression
- Virginia Hurricane Katrina Evacuation, Incident Period: August 29, 2005 to October 01, 2005, Emergency Declared EM-3240: September 12, 2005, FEMA Id: 3240, Natural disaster type: Hurricane
- Virginia Severe Storms, Flooding and Tornadoes Associated with Tropical Depression Gaston, Incident Period: August 30, 2004 to September 08, 2004, Major Disaster (Presidential) Declared DR-1544: September 03, 2004, FEMA Id: 1544, Natural disaster type: Storm, Tornado, Flood, Tropical Depression
- Virginia Hurricane Isabel, Incident Period: September 18, 2003 to October 01, 2003, Major Disaster (Presidential) Declared DR-1491: September 18, 2003, FEMA Id: 1491, Natural disaster type: Hurricane
- Virginia Winter Storm, Incident Period: January 25, 2000 to January 30, 2000, Major Disaster (Presidential) Declared DR-1318: February 28, 2000, FEMA Id: 1318, Natural disaster type: Winter Storm
- 8 other natural disasters have been reported since 1953.
The number of natural disasters in Dinwiddie County (18) is near the US average (15).
Major Disasters (Presidential) Declared: 12
Emergencies Declared: 5
Causes of natural disasters: Hurricanes: 6, Storms: 5, Floods: 4, Droughts: 2, Tropical Depressions: 2, Winter Storms: 2, Blizzard: 1, Ice Storm: 1, Tornado: 1, Tropical Storm: 1, Wind: 1, Other: 1 (Note: some incidents may be assigned to more than one category).
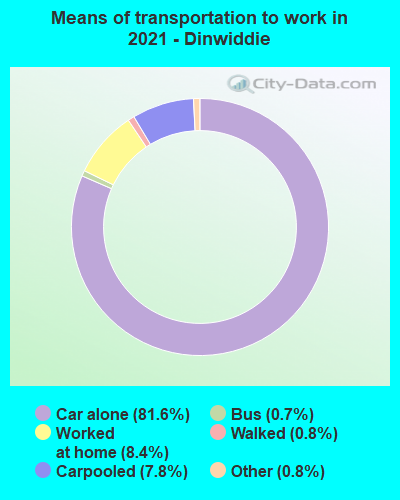
Means of transportation to work:
- Drove a car alone: 7,953 (74.8%)
- Carpooled: 757 (7.1%)
- Bus: 56 (0.5%)
- Long-distance train or commuter rail: 20 (0.2%)
- Taxicab, motorcycle, or other means: 104 (1.0%)
- Walked: 90 (0.8%)
- Worked at home: 1,557 (14.6%)
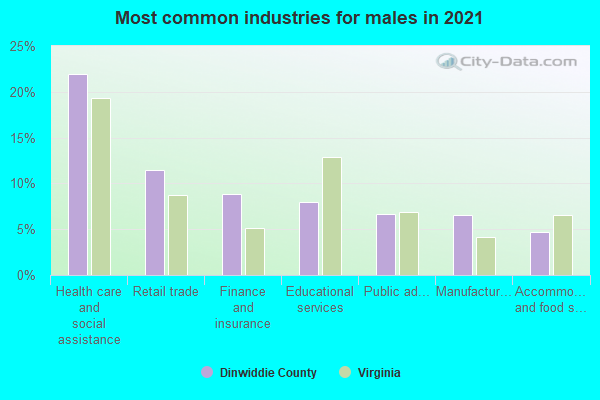
- Health care and social assistance (22%)
- Retail trade (11%)
- Educational services (9%)
- Finance and insurance (8%)
- Public administration (8%)
- Manufacturing (5%)
- Other services, except public administration (5%)
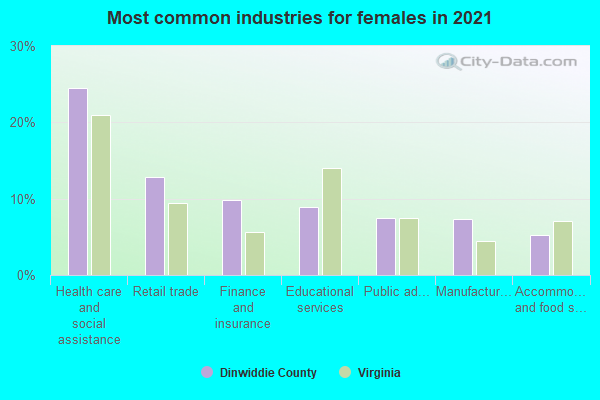
- Health care and social assistance (25%)
- Retail trade (13%)
- Educational services (10%)
- Finance and insurance (9%)
- Public administration (9%)
- Manufacturing (6%)
- Other services, except public administration (5%)
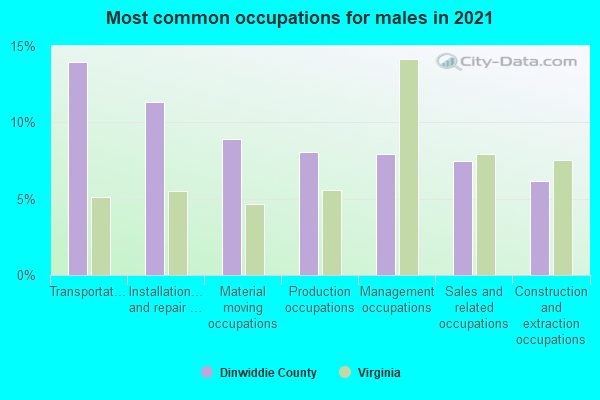
- Transportation occupations (13%)
- Production occupations (10%)
- Installation, maintenance, and repair occupations (9%)
- Construction and extraction occupations (9%)
- Sales and related occupations (8%)
- Management occupations (8%)
- Material moving occupations (6%)
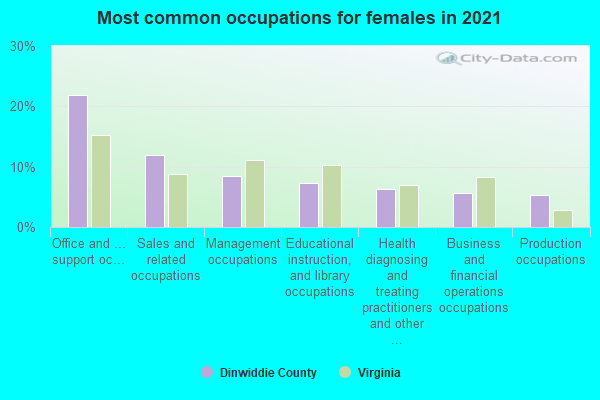
- Office and administrative support occupations (22%)
- Sales and related occupations (10%)
- Management occupations (9%)
- Educational instruction, and library occupations (8%)
- Health diagnosing and treating practitioners and other technical occupations (8%)
- Business and financial operations occupations (6%)
- Healthcare support occupations (5%)

- Germany (23%)
- Honduras (19%)
- Bolivia (12%)
- Mexico (6%)
- Philippines (6%)
- Thailand (5%)
- Poland (5%)
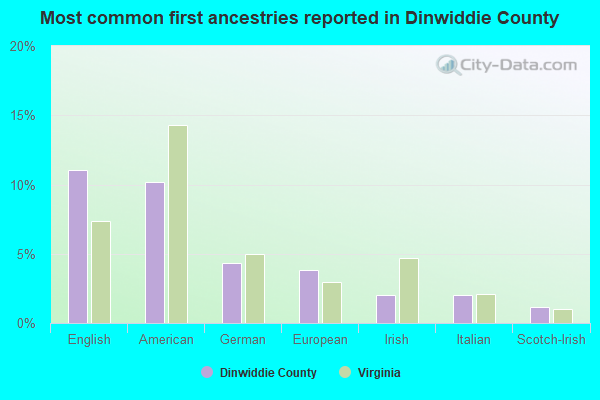
- English (13%)
- American (11%)
- German (4%)
- Irish (3%)
- Italian (2%)
- European (2%)
- African (2%)
People in group quarters in Dinwiddie County, Virginia in 2010:
- 353 people in residential treatment centers for adults
- 211 people in mental (psychiatric) hospitals and psychiatric units in other hospitals
- 201 people in college/university student housing
- 55 people in correctional residential facilities
- 55 people in nursing facilities/skilled-nursing facilities
- 38 people in group homes intended for adults
- 6 people in group homes for juveniles (non-correctional)
People in group quarters in Dinwiddie County, Virginia in 2000:
- 765 people in mental (psychiatric) hospitals or wards
- 113 people in state prisons
- 61 people in schools, hospitals, or wards for the intellectually disabled
- 59 people in other noninstitutional group quarters
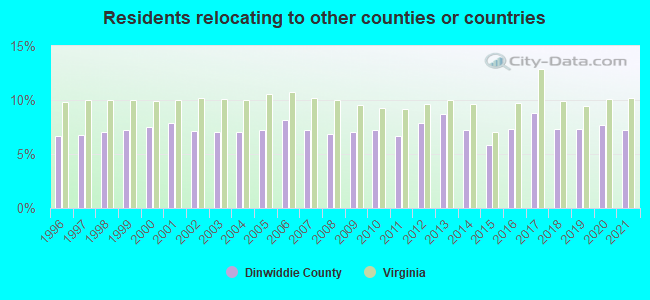
8.30% of this county's 2021 resident taxpayers lived in other counties in 2020 ($52,340 average adjusted gross income)
| Here: | 8.30% |
| Virginia average: | 10.16% |
10 or fewer of this county's residents moved from foreign countries.
7.12% relocated from other counties in Virginia ($44,259 average AGI)
1.18% relocated from other states ($8,082 average AGI)
Dinwiddie County: 1.18% Virginia average: 3.91%

Top counties from which taxpayers relocated into this county between 2020 and 2021:
| from Chesterfield County, VA | |
| from Petersburg city, VA | |
| from Prince George County, VA | |
| from Colonial Heights city, VA | |
| from Hopewell city, VA | |
| from Henrico County, VA | |
| from Richmond city, VA |
7.26% of this county's 2020 resident taxpayers moved to other counties in 2021 ($45,038 average adjusted gross income)
| Here: | 7.26% |
| Virginia average: | 10.20% |
10 or fewer of this county's residents moved to foreign countries.
6.18% relocated to other counties in Virginia ($36,754 average AGI)
1.08% relocated to other states ($8,282 average AGI)
Dinwiddie County: 1.08% Virginia average: 3.98%
Top counties to which taxpayers relocated from this county between 2020 and 2021:
| to Chesterfield County, VA | |
| to Petersburg city, VA | |
| to Prince George County, VA | |
| to Colonial Heights city, VA | |
| to Hopewell city, VA | |
| to Richmond city, VA | |
| to Henrico County, VA |
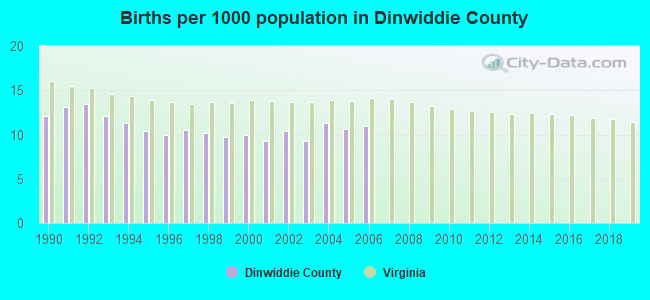
Births per 1000 population from 1990 to 1999: 11.3
Births per 1000 population from 2000 to 2006: 10.3
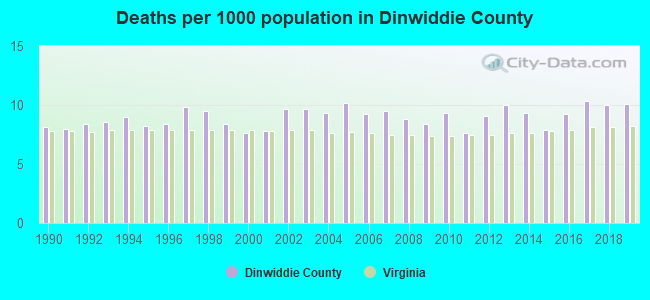
Deaths per 1000 population from 1990 to 1999: 8.6
Deaths per 1000 population from 2000 to 2009: 9.0
Deaths per 1000 population from 2010 to 2020: 9.5
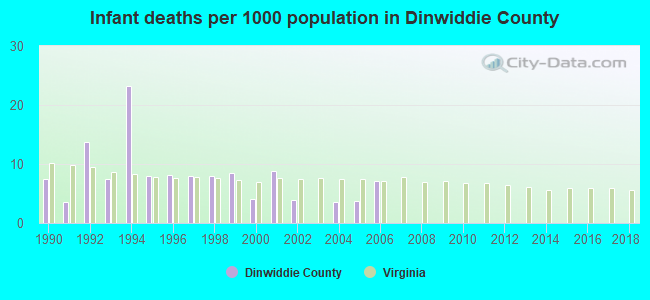
Infant deaths per 1000 live births from 1990 to 1999: 9.6
Infant deaths per 1000 live births from 2000 to 2006: 4.5
Persons under 19 years old without health insurance coverage in 2018: 5.6%

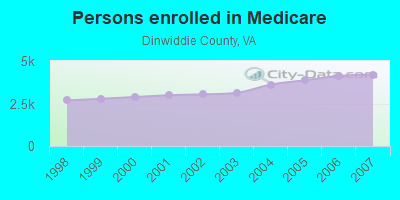
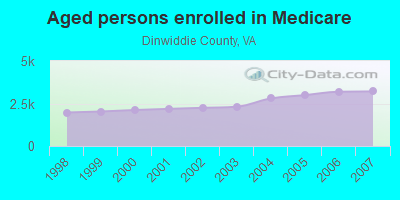
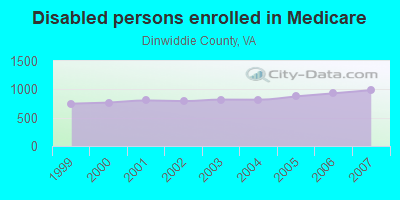
Persons enrolled in hospital insurance and/or supplemental medical insurance (Medicare) in July 1, 2007: 4,197 (3,211 aged, 986 disabled)
Children under 18 without health insurance coverage in 2007: 531 (9%)
Most common underlying causes of death in Dinwiddie County, Virginia in 1999 - 2019:
- Bronchus or lung, unspecified - Malignant neoplasms (403)
- Atherosclerotic heart disease (307)
- Acute myocardial infarction, unspecified (168)
- Chronic obstructive pulmonary disease, unspecified (120)
- Unspecified dementia (83)
- Stroke, not specified as haemorrhage or infarction (41)
- Congestive heart failure (32)
- Septicaemia, unspecified (12)
- Colon, unspecified - Malignant neoplasms (11)
- Unspecified diabetes mellitus, without complications (10)
Population without health insurance coverage in 2000: 10%
Children under 18 without health insurance coverage in 2000: 6%
Medical specialist MDs per 100,000 population in 2005: 953
Dentists per 100,000 population in 1998: 4
Total births per 100,000 population, July 2005 - July 2006 : 8
Total deaths per 100,000 population, July 2005 - July 2006: 16
Limited-service eating places per 100,000 population in 2005 : 4
Crimes per 100,000 population in 1996: 1
Suicides per 1,000,000 population from 2000 to 2006: 183.8. This is more than state average.
Household type by relationship:
Households: 28,249- Male householders: 4,682 (1,158 living alone), Female householders: 6,046 (1,418 living alone)
5,599 spouses (5,592 opposite-sex spouses), 768 unmarried partners, (743 opposite-sex unmarried partners), 6,886 children (6,318 natural, 139 adopted, 425 stepchildren), 1,068 grandchildren, 363 brothers or sisters, 412 parents, 8 foster children, 771 other relatives, 754 non-relatives
- In group quarters: 841
Size of family households: 3,487 2-persons, 1,791 3-persons, 1,190 4-persons, 546 5-persons, 340 6-persons, 73 7-or-more-persons.
Size of nonfamily households: 2,577 1-person, 600 2-persons, 117 3-persons.
2,908 married couples with children.
1,465 single-parent households (436 men, 1,029 women).
95.8% of residents of Dinwiddie speak English at home.
2.4% of residents speak Spanish at home (65% speak English very well, 14% speak English well, 21% speak English not well).
1.0% of residents speak other Indo-European language at home (78% speak English very well, 12% speak English well, 9% speak English not well).
0.4% of residents speak Asian or Pacific Island language at home (50% speak English very well, 50% speak English not well).
0.1% of residents speak other language at home (93% speak English very well, 7% speak English well).
In fiscal year 2004:
Federal Government expenditure: $109,635,000 ($4,355 per capita)
Department of Defense expenditure: $4,741,000
Federal direct payments to individuals for retirement and disability: $59,015,000
Federal other direct payments to individuals: $21,515,000
Federal direct payments not to individuals: $2,080,000
Federal grants: $19,274,000
Federal procurement contracts: $5,151,000 ($293,000 Department of Defense)
Federal salaries and wages: $2,599,000 ($41,000 Department of Defense)
Federal Government direct loans: $648,000
Federal guaranteed/insured loans: $30,399,000
Federal Government insurance: $6,629,000
Population change from April 1, 2000 to July 1, 2005:
Births: 1,275| Here: | 50 per 1000 residents |
| State: | 70 per 1000 residents |
Deaths: 1,176
| Here: | 46 per 1000 residents |
| State: | 40 per 1000 residents |
Net international migration: +39
| Here: | +2 per 1000 residents |
| State: | +18 per 1000 residents |
Net internal migration: +778
| Here: | +31 per 1000 residents |
| State: | +14 per 1000 residents |
Total withdrawal of fresh water for public supply: 0.00 millions of gallons per day (all from surface)
| Here: | 6.4 |
| State: | 7.0 |
| Here: | 5.2 |
| State: | 4.3 |
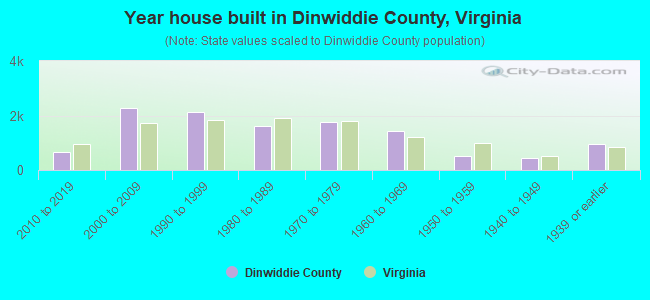
- Year house built in Dinwiddie County, Virginia
- 732020 or later
- 8022010 to 2019
- 2,0412000 to 2009
- 2,3181990 to 1999
- 1,8111980 to 1989
- 1,6651970 to 1979
- 1,3021960 to 1969
- 4991950 to 1959
- 3921940 to 1949
- 9041939 or earlier
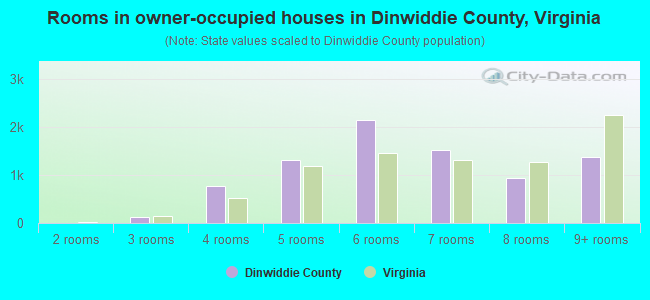
- Rooms in owner-occupied houses in Dinwiddie County, Virginia
- 521 room
- 02 rooms
- 993 rooms
- 8014 rooms
- 1,3195 rooms
- 2,0986 rooms
- 1,7067 rooms
- 1,2168 rooms
- 1,1979+ rooms
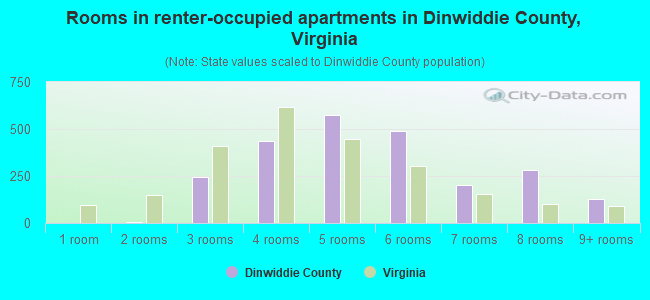
- Rooms in renter-occupied apartments in Dinwiddie County, Virginia
- 01 room
- 172 rooms
- 2293 rooms
- 4024 rooms
- 5875 rooms
- 4226 rooms
- 1937 rooms
- 2398 rooms
- 1319+ rooms
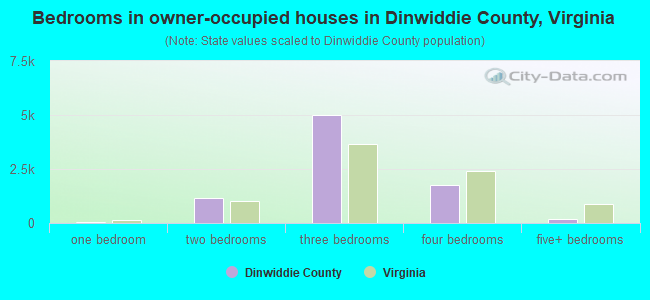
- Bedrooms in owner-occupied houses in Dinwiddie County, Virginia
- 84no bedroom
- 501 bedroom
- 9662 bedrooms
- 5,1833 bedrooms
- 2,0124 bedrooms
- 1825+ bedrooms
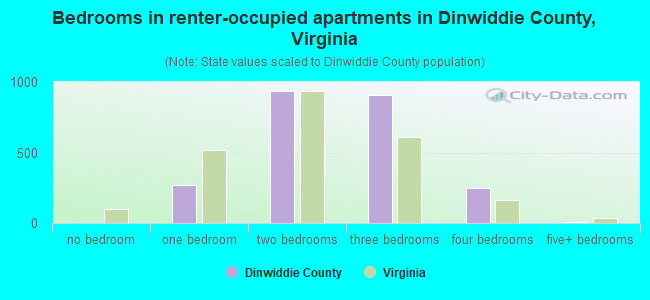
- Bedrooms in renter-occupied apartments in Dinwiddie County, Virginia
- 0no bedroom
- 3111 bedroom
- 9002 bedrooms
- 7853 bedrooms
- 2424 bedrooms
- 05+ bedrooms
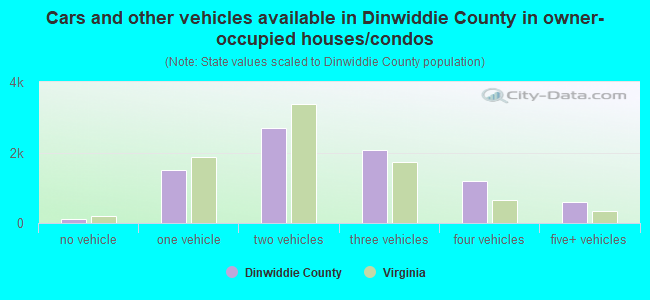
- Cars and other vehicles available in Dinwiddie County in owner-occupied houses/condos
- 99no vehicle
- 1,4111 vehicle
- 2,6642 vehicles
- 2,3793 vehicles
- 1,1744 vehicles
- 7005+ vehicles
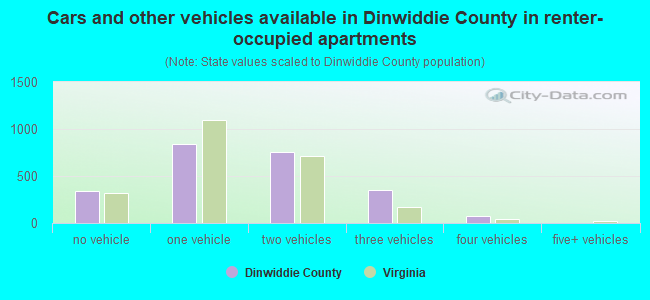
- Cars and other vehicles available in Dinwiddie County in renter-occupied apartments
- 209no vehicle
- 9081 vehicle
- 6612 vehicles
- 3473 vehicles
- 874 vehicles
- 325+ vehicles
90.4% of Dinwiddie County residents lived in the same house 1 years ago.
Out of people who lived in different houses, 18% lived in this county.
Out of people who lived in different counties, 88% lived in Virginia.
| Dinwiddie County: | 90.4% |
| State average: | 86.6% |
Place of birth for U.S.-born residents:
- This state: 20,476
- Other state: 6,581
- Northeast: 2,039
- Midwest: 1,016
- South: 2,847
- West: 671


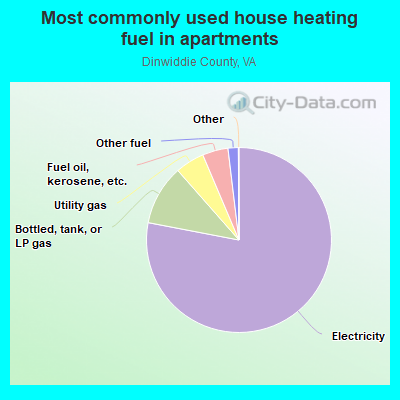
- 74.0%Electricity
- 10.3%Bottled, tank, or LP gas
- 5.5%Utility gas
- 4.6%Fuel oil, kerosene, etc.
- 3.3%Wood
- 1.2%No fuel used
- 0.8%Other fuel
- 0.2%Solar energy
- 78.5%Electricity
- 11.0%Bottled, tank, or LP gas
- 4.0%Fuel oil, kerosene, etc.
- 3.6%Utility gas
- 1.6%Other fuel
- 1.3%Wood
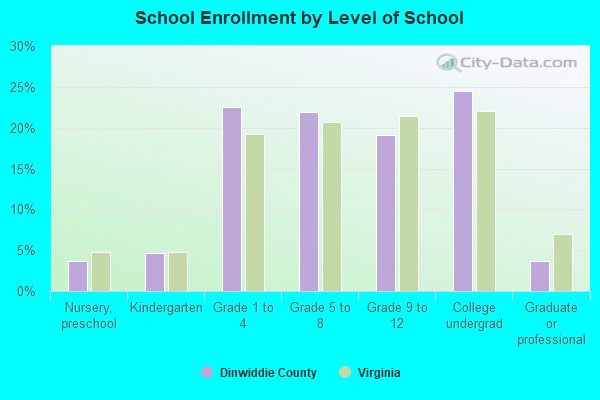
Private vs. public school enrollment:
| Here: | 13.1% |
| Virginia: | 13.2% |
| Here: | 13.5% |
| Virginia: | 10.2% |
| Here: | 29.4% |
| Virginia: | 18.7% |
Dinwiddie County government finances - Expenditure in 2018:
- Bond Funds - Cash and Securities: $8,679,000
Cash and Securities: $7,083,000
- Charges - Other: $967,000
Other: $954,000
Sewerage: $636,000
Sewerage: $588,000
Elementary and Secondary Education School Lunch: $416,000
Elementary and Secondary Education School Lunch: $308,000
Elementary and Secondary Education - Other: $207,000
Parks and Recreation: $201,000
Elementary and Secondary Education - Other: $140,000
Parks and Recreation: $116,000
Solid Waste Management: $115,000
Solid Waste Management: $77,000
Elementary and Secondary Education School Tuition and Transportation: $13,000
Elementary and Secondary Education School Tuition and Transportation: $7,000
- Construction - General Public Buildings: $16,119,000
Elementary and Secondary Education: $280,000
Sewerage: $134,000
Central Staff Services: $131,000
Elementary and Secondary Education: $123,000
Sewerage: $121,000
Solid Waste Management: $96,000
Local Fire Protection: $13,000
- Current Operations - Elementary and Secondary Education: $49,308,000
Elementary and Secondary Education: $45,891,000
Police Protection: $6,180,000
Police Protection: $6,075,000
Public Welfare - Other: $4,907,000
Public Welfare - Other: $4,617,000
Health - Other: $3,859,000
Health - Other: $3,274,000
General Public Buildings: $2,800,000
Housing and Community Development: $2,128,000
Financial Administration: $2,122,000
General Public Buildings: $2,079,000
Correctional Institutions: $2,062,000
Central Staff Services: $2,024,000
Central Staff Services: $2,004,000
Financial Administration: $1,982,000
Correctional Institutions: $1,888,000
Solid Waste Management: $1,588,000
Solid Waste Management: $1,366,000
Housing and Community Development: $1,207,000
Parks and Recreation: $1,033,000
Judicial and Legal Services: $885,000
Parks and Recreation: $862,000
Judicial and Legal Services: $851,000
Local Fire Protection: $750,000
Local Fire Protection: $626,000
Corrections - Other: $471,000
Corrections - Other: $393,000
Libraries: $287,000
Protective Inspection and Regulation - Other: $286,000
Libraries: $274,000
Protective Inspection and Regulation - Other: $263,000
Sewerage: $255,000
Natural Resources - Other: $132,000
Natural Resources - Other: $125,000
Sewerage: $105,000
Regular Highways: $45,000
Regular Highways: $44,000
- Federal Intergovernmental - Public Welfare: $1,451,000
Public Welfare: $1,391,000
Other: $454,000
Education: $377,000
General Local Government Support: $184,000
Education: $158,000
Other: $8,000
General Local Government Support: $1,000
- General - Interest on Debt: $2,756,000
Interest on Debt: $2,698,000
- Intergovernmental to Local - Other - Elementary and Secondary Education: $770,000
Other - Elementary and Secondary Education: $742,000
- Local Intergovernmental - Education: $763,000
Education: $112,000
- Long Term Debt - Outstanding Unspecified Public Purpose: $68,343,000
Outstanding Unspecified Public Purpose: $63,847,000
Beginning Outstanding - Unspecified Public Purpose: $63,550,000
Beginning Outstanding - Unspecified Public Purpose: $45,643,000
Issue, Unspecified Public Purpose: $23,231,000
Issue, Unspecified Public Purpose: $9,925,000
Retired Unspecified Public Purpose: $5,132,000
Retired Unspecified Public Purpose: $5,026,000
- Miscellaneous - General Revenue - Other: $900,000
Fines and Forfeits: $856,000
General Revenue - Other: $748,000
Fines and Forfeits: $621,000
Interest Earnings: $349,000
Interest Earnings: $349,000
Rents: $109,000
Donations From Private Sources: $97,000
Rents: $30,000
Sale of Property: $10,000
- Other Capital Outlay - Police Protection: $2,033,000
Elementary and Secondary Education: $1,642,000
Elementary and Secondary Education: $950,000
Local Fire Protection: $699,000
General Public Building: $405,000
Local Fire Protection: $181,000
Police Protection: $144,000
Judicial and Legal Services: $138,000
Parks and Recreation: $43,000
Central Staff Services: $27,000
Financial Administration: $3,000
- Other Funds - Cash and Securities: $36,252,000
Cash and Securities: $23,092,000
- State Intergovernmental - Education: $34,269,000
Education: $31,387,000
General Local Government Support: $6,952,000
General Local Government Support: $4,677,000
Other: $4,019,000
Other: $2,248,000
Public Welfare: $825,000
Public Welfare: $794,000
- Tax - Property: $34,516,000
Property: $31,285,000
General Sales and Gross Receipts: $2,244,000
General Sales and Gross Receipts: $1,900,000
Occupation and Business License - Other: $1,084,000
Other Selective Sales: $993,000
Other Selective Sales: $954,000
Occupation and Business License - Other: $943,000
Public Utilities Sales: $782,000
Public Utilities Sales: $775,000
Motor Vehicle License: $577,000
Motor Vehicle License: $548,000
Documentary and Stock Transfer: $481,000
Documentary and Stock Transfer: $345,000
Other License: $334,000
Other License: $324,000
Amusements Sales: $33,000
Amusements Sales: $18,000
- Total Salaries and Wages: $29,327,000
: $27,272,000
Dinwiddie County government finances - Revenue in 2018:
- Bond Funds - Cash and Securities: $8,679,000
Cash and Securities: $7,083,000
- Charges - Other: $967,000
Other: $954,000
Sewerage: $636,000
Sewerage: $588,000
Elementary and Secondary Education School Lunch: $416,000
Elementary and Secondary Education School Lunch: $308,000
Elementary and Secondary Education - Other: $207,000
Parks and Recreation: $201,000
Elementary and Secondary Education - Other: $140,000
Parks and Recreation: $116,000
Solid Waste Management: $115,000
Solid Waste Management: $77,000
Elementary and Secondary Education School Tuition and Transportation: $13,000
Elementary and Secondary Education School Tuition and Transportation: $7,000
- Construction - General Public Buildings: $16,119,000
Elementary and Secondary Education: $280,000
Sewerage: $134,000
Central Staff Services: $131,000
Elementary and Secondary Education: $123,000
Sewerage: $121,000
Solid Waste Management: $96,000
Local Fire Protection: $13,000
- Current Operations - Elementary and Secondary Education: $49,308,000
Elementary and Secondary Education: $45,891,000
Police Protection: $6,180,000
Police Protection: $6,075,000
Public Welfare - Other: $4,907,000
Public Welfare - Other: $4,617,000
Health - Other: $3,859,000
Health - Other: $3,274,000
General Public Buildings: $2,800,000
Housing and Community Development: $2,128,000
Financial Administration: $2,122,000
General Public Buildings: $2,079,000
Correctional Institutions: $2,062,000
Central Staff Services: $2,024,000
Central Staff Services: $2,004,000
Financial Administration: $1,982,000
Correctional Institutions: $1,888,000
Solid Waste Management: $1,588,000
Solid Waste Management: $1,366,000
Housing and Community Development: $1,207,000
Parks and Recreation: $1,033,000
Judicial and Legal Services: $885,000
Parks and Recreation: $862,000
Judicial and Legal Services: $851,000
Local Fire Protection: $750,000
Local Fire Protection: $626,000
Corrections - Other: $471,000
Corrections - Other: $393,000
Libraries: $287,000
Protective Inspection and Regulation - Other: $286,000
Libraries: $274,000
Protective Inspection and Regulation - Other: $263,000
Sewerage: $255,000
Natural Resources - Other: $132,000
Natural Resources - Other: $125,000
Sewerage: $105,000
Regular Highways: $45,000
Regular Highways: $44,000
- Federal Intergovernmental - Public Welfare: $1,451,000
Public Welfare: $1,391,000
Other: $454,000
Education: $377,000
General Local Government Support: $184,000
Education: $158,000
Other: $8,000
General Local Government Support: $1,000
- General - Interest on Debt: $2,756,000
Interest on Debt: $2,698,000
- Intergovernmental to Local - Other - Elementary and Secondary Education: $770,000
Other - Elementary and Secondary Education: $742,000
- Local Intergovernmental - Education: $763,000
Education: $112,000
- Long Term Debt - Outstanding Unspecified Public Purpose: $68,343,000
Outstanding Unspecified Public Purpose: $63,847,000
Beginning Outstanding - Unspecified Public Purpose: $63,550,000
Beginning Outstanding - Unspecified Public Purpose: $45,643,000
Issue, Unspecified Public Purpose: $23,231,000
Issue, Unspecified Public Purpose: $9,925,000
Retired Unspecified Public Purpose: $5,132,000
Retired Unspecified Public Purpose: $5,026,000
- Miscellaneous - General Revenue - Other: $900,000
Fines and Forfeits: $856,000
General Revenue - Other: $748,000
Fines and Forfeits: $621,000
Interest Earnings: $349,000
Interest Earnings: $349,000
Rents: $109,000
Donations From Private Sources: $97,000
Rents: $30,000
Sale of Property: $10,000
- Other Capital Outlay - Police Protection: $2,033,000
Elementary and Secondary Education: $1,642,000
Elementary and Secondary Education: $950,000
Local Fire Protection: $699,000
General Public Building: $405,000
Local Fire Protection: $181,000
Police Protection: $144,000
Judicial and Legal Services: $138,000
Parks and Recreation: $43,000
Central Staff Services: $27,000
Financial Administration: $3,000
- Other Funds - Cash and Securities: $36,252,000
Cash and Securities: $23,092,000
- State Intergovernmental - Education: $34,269,000
Education: $31,387,000
General Local Government Support: $6,952,000
General Local Government Support: $4,677,000
Other: $4,019,000
Other: $2,248,000
Public Welfare: $825,000
Public Welfare: $794,000
- Tax - Property: $34,516,000
Property: $31,285,000
General Sales and Gross Receipts: $2,244,000
General Sales and Gross Receipts: $1,900,000
Occupation and Business License - Other: $1,084,000
Other Selective Sales: $993,000
Other Selective Sales: $954,000
Occupation and Business License - Other: $943,000
Public Utilities Sales: $782,000
Public Utilities Sales: $775,000
Motor Vehicle License: $577,000
Motor Vehicle License: $548,000
Documentary and Stock Transfer: $481,000
Documentary and Stock Transfer: $345,000
Other License: $334,000
Other License: $324,000
Amusements Sales: $33,000
Amusements Sales: $18,000
- Total Salaries and Wages: $29,327,000
: $27,272,000
Dinwiddie County government finances - Debt in 2018:
- Bond Funds - Cash and Securities: $8,679,000
Cash and Securities: $7,083,000
- Charges - Other: $967,000
Other: $954,000
Sewerage: $636,000
Sewerage: $588,000
Elementary and Secondary Education School Lunch: $416,000
Elementary and Secondary Education School Lunch: $308,000
Elementary and Secondary Education - Other: $207,000
Parks and Recreation: $201,000
Elementary and Secondary Education - Other: $140,000
Parks and Recreation: $116,000
Solid Waste Management: $115,000
Solid Waste Management: $77,000
Elementary and Secondary Education School Tuition and Transportation: $13,000
Elementary and Secondary Education School Tuition and Transportation: $7,000
- Construction - General Public Buildings: $16,119,000
Elementary and Secondary Education: $280,000
Sewerage: $134,000
Central Staff Services: $131,000
Elementary and Secondary Education: $123,000
Sewerage: $121,000
Solid Waste Management: $96,000
Local Fire Protection: $13,000
- Current Operations - Elementary and Secondary Education: $49,308,000
Elementary and Secondary Education: $45,891,000
Police Protection: $6,180,000
Police Protection: $6,075,000
Public Welfare - Other: $4,907,000
Public Welfare - Other: $4,617,000
Health - Other: $3,859,000
Health - Other: $3,274,000
General Public Buildings: $2,800,000
Housing and Community Development: $2,128,000
Financial Administration: $2,122,000
General Public Buildings: $2,079,000
Correctional Institutions: $2,062,000
Central Staff Services: $2,024,000
Central Staff Services: $2,004,000
Financial Administration: $1,982,000
Correctional Institutions: $1,888,000
Solid Waste Management: $1,588,000
Solid Waste Management: $1,366,000
Housing and Community Development: $1,207,000
Parks and Recreation: $1,033,000
Judicial and Legal Services: $885,000
Parks and Recreation: $862,000
Judicial and Legal Services: $851,000
Local Fire Protection: $750,000
Local Fire Protection: $626,000
Corrections - Other: $471,000
Corrections - Other: $393,000
Libraries: $287,000
Protective Inspection and Regulation - Other: $286,000
Libraries: $274,000
Protective Inspection and Regulation - Other: $263,000
Sewerage: $255,000
Natural Resources - Other: $132,000
Natural Resources - Other: $125,000
Sewerage: $105,000
Regular Highways: $45,000
Regular Highways: $44,000
- Federal Intergovernmental - Public Welfare: $1,451,000
Public Welfare: $1,391,000
Other: $454,000
Education: $377,000
General Local Government Support: $184,000
Education: $158,000
Other: $8,000
General Local Government Support: $1,000
- General - Interest on Debt: $2,756,000
Interest on Debt: $2,698,000
- Intergovernmental to Local - Other - Elementary and Secondary Education: $770,000
Other - Elementary and Secondary Education: $742,000
- Local Intergovernmental - Education: $763,000
Education: $112,000
- Long Term Debt - Outstanding Unspecified Public Purpose: $68,343,000
Outstanding Unspecified Public Purpose: $63,847,000
Beginning Outstanding - Unspecified Public Purpose: $63,550,000
Beginning Outstanding - Unspecified Public Purpose: $45,643,000
Issue, Unspecified Public Purpose: $23,231,000
Issue, Unspecified Public Purpose: $9,925,000
Retired Unspecified Public Purpose: $5,132,000
Retired Unspecified Public Purpose: $5,026,000
- Miscellaneous - General Revenue - Other: $900,000
Fines and Forfeits: $856,000
General Revenue - Other: $748,000
Fines and Forfeits: $621,000
Interest Earnings: $349,000
Interest Earnings: $349,000
Rents: $109,000
Donations From Private Sources: $97,000
Rents: $30,000
Sale of Property: $10,000
- Other Capital Outlay - Police Protection: $2,033,000
Elementary and Secondary Education: $1,642,000
Elementary and Secondary Education: $950,000
Local Fire Protection: $699,000
General Public Building: $405,000
Local Fire Protection: $181,000
Police Protection: $144,000
Judicial and Legal Services: $138,000
Parks and Recreation: $43,000
Central Staff Services: $27,000
Financial Administration: $3,000
- Other Funds - Cash and Securities: $36,252,000
Cash and Securities: $23,092,000
- State Intergovernmental - Education: $34,269,000
Education: $31,387,000
General Local Government Support: $6,952,000
General Local Government Support: $4,677,000
Other: $4,019,000
Other: $2,248,000
Public Welfare: $825,000
Public Welfare: $794,000
- Tax - Property: $34,516,000
Property: $31,285,000
General Sales and Gross Receipts: $2,244,000
General Sales and Gross Receipts: $1,900,000
Occupation and Business License - Other: $1,084,000
Other Selective Sales: $993,000
Other Selective Sales: $954,000
Occupation and Business License - Other: $943,000
Public Utilities Sales: $782,000
Public Utilities Sales: $775,000
Motor Vehicle License: $577,000
Motor Vehicle License: $548,000
Documentary and Stock Transfer: $481,000
Documentary and Stock Transfer: $345,000
Other License: $334,000
Other License: $324,000
Amusements Sales: $33,000
Amusements Sales: $18,000
- Total Salaries and Wages: $29,327,000
: $27,272,000
Dinwiddie County government finances - Cash and Securities in 2018:
- Bond Funds - Cash and Securities: $8,679,000
Cash and Securities: $7,083,000
- Charges - Other: $967,000
Other: $954,000
Sewerage: $636,000
Sewerage: $588,000
Elementary and Secondary Education School Lunch: $416,000
Elementary and Secondary Education School Lunch: $308,000
Elementary and Secondary Education - Other: $207,000
Parks and Recreation: $201,000
Elementary and Secondary Education - Other: $140,000
Parks and Recreation: $116,000
Solid Waste Management: $115,000
Solid Waste Management: $77,000
Elementary and Secondary Education School Tuition and Transportation: $13,000
Elementary and Secondary Education School Tuition and Transportation: $7,000
- Construction - General Public Buildings: $16,119,000
Elementary and Secondary Education: $280,000
Sewerage: $134,000
Central Staff Services: $131,000
Elementary and Secondary Education: $123,000
Sewerage: $121,000
Solid Waste Management: $96,000
Local Fire Protection: $13,000
- Current Operations - Elementary and Secondary Education: $49,308,000
Elementary and Secondary Education: $45,891,000
Police Protection: $6,180,000
Police Protection: $6,075,000
Public Welfare - Other: $4,907,000
Public Welfare - Other: $4,617,000
Health - Other: $3,859,000
Health - Other: $3,274,000
General Public Buildings: $2,800,000
Housing and Community Development: $2,128,000
Financial Administration: $2,122,000
General Public Buildings: $2,079,000
Correctional Institutions: $2,062,000
Central Staff Services: $2,024,000
Central Staff Services: $2,004,000
Financial Administration: $1,982,000
Correctional Institutions: $1,888,000
Solid Waste Management: $1,588,000
Solid Waste Management: $1,366,000
Housing and Community Development: $1,207,000
Parks and Recreation: $1,033,000
Judicial and Legal Services: $885,000
Parks and Recreation: $862,000
Judicial and Legal Services: $851,000
Local Fire Protection: $750,000
Local Fire Protection: $626,000
Corrections - Other: $471,000
Corrections - Other: $393,000
Libraries: $287,000
Protective Inspection and Regulation - Other: $286,000
Libraries: $274,000
Protective Inspection and Regulation - Other: $263,000
Sewerage: $255,000
Natural Resources - Other: $132,000
Natural Resources - Other: $125,000
Sewerage: $105,000
Regular Highways: $45,000
Regular Highways: $44,000
- Federal Intergovernmental - Public Welfare: $1,451,000
Public Welfare: $1,391,000
Other: $454,000
Education: $377,000
General Local Government Support: $184,000
Education: $158,000
Other: $8,000
General Local Government Support: $1,000
- General - Interest on Debt: $2,756,000
Interest on Debt: $2,698,000
- Intergovernmental to Local - Other - Elementary and Secondary Education: $770,000
Other - Elementary and Secondary Education: $742,000
- Local Intergovernmental - Education: $763,000
Education: $112,000
- Long Term Debt - Outstanding Unspecified Public Purpose: $68,343,000
Outstanding Unspecified Public Purpose: $63,847,000
Beginning Outstanding - Unspecified Public Purpose: $63,550,000
Beginning Outstanding - Unspecified Public Purpose: $45,643,000
Issue, Unspecified Public Purpose: $23,231,000
Issue, Unspecified Public Purpose: $9,925,000
Retired Unspecified Public Purpose: $5,132,000
Retired Unspecified Public Purpose: $5,026,000
- Miscellaneous - General Revenue - Other: $900,000
Fines and Forfeits: $856,000
General Revenue - Other: $748,000
Fines and Forfeits: $621,000
Interest Earnings: $349,000
Interest Earnings: $349,000
Rents: $109,000
Donations From Private Sources: $97,000
Rents: $30,000
Sale of Property: $10,000
- Other Capital Outlay - Police Protection: $2,033,000
Elementary and Secondary Education: $1,642,000
Elementary and Secondary Education: $950,000
Local Fire Protection: $699,000
General Public Building: $405,000
Local Fire Protection: $181,000
Police Protection: $144,000
Judicial and Legal Services: $138,000
Parks and Recreation: $43,000
Central Staff Services: $27,000
Financial Administration: $3,000
- Other Funds - Cash and Securities: $36,252,000
Cash and Securities: $23,092,000
- State Intergovernmental - Education: $34,269,000
Education: $31,387,000
General Local Government Support: $6,952,000
General Local Government Support: $4,677,000
Other: $4,019,000
Other: $2,248,000
Public Welfare: $825,000
Public Welfare: $794,000
- Tax - Property: $34,516,000
Property: $31,285,000
General Sales and Gross Receipts: $2,244,000
General Sales and Gross Receipts: $1,900,000
Occupation and Business License - Other: $1,084,000
Other Selective Sales: $993,000
Other Selective Sales: $954,000
Occupation and Business License - Other: $943,000
Public Utilities Sales: $782,000
Public Utilities Sales: $775,000
Motor Vehicle License: $577,000
Motor Vehicle License: $548,000
Documentary and Stock Transfer: $481,000
Documentary and Stock Transfer: $345,000
Other License: $334,000
Other License: $324,000
Amusements Sales: $33,000
Amusements Sales: $18,000
- Total Salaries and Wages: $29,327,000
: $27,272,000
Supplemental Security Income (SSI) in 2006:
- Total number of recipients: 745
- Number of aged recipients: 67
- Number of blind and disabled recipients: 678
- Number of recipients under 18: 163
- Number of recipients between 18 and 64: 457
- Number of recipients older than 64: 125
- Number of recipients also receiving OASDI: 256
- Amount of payments (thousands of dollars): 339
| Most common first names in Dinwiddie County, VA among deceased individuals | ||
| Name | Count | Lived (average) |
|---|---|---|
| John | 35 | 75.0 years |
| James | 30 | 66.2 years |
| William | 20 | 76.8 years |
| Mary | 18 | 71.6 years |
| Robert | 15 | 73.3 years |
| George | 14 | 77.0 years |
| Thomas | 14 | 74.9 years |
| Joseph | 11 | 68.4 years |
| Willie | 11 | 70.5 years |
| Paul | 11 | 70.5 years |
| Most common last names in Dinwiddie County, VA among deceased individuals | ||
| Last name | Count | Lived (average) |
|---|---|---|
| Williams | 18 | 70.6 years |
| Jones | 18 | 76.3 years |
| Coleman | 15 | 72.9 years |
| Doyle | 13 | 77.7 years |
| Johnson | 13 | 70.4 years |
| Tucker | 12 | 72.3 years |
| Wells | 12 | 77.2 years |
| Smith | 11 | 65.5 years |
| Roberts | 9 | 67.2 years |
| Cliborne | 9 | 78.2 years |
Businesses in Dinwiddie County, VA
- UPS: 1