Essex County, Virginia (VA)
County owner-occupied free and clear houses and condos in 2010: 1,233
County owner-occupied houses and condos in 2000: 3,086
Renter-occupied apartments: 1,279 (it was 909 in 2000)
| % of renters here: | 23% |
| State: | 33% |
Land area: 258 sq. mi.
Water area: 28.1 sq. mi.
Population density: 41 people per square mile (average).
Industries providing employment: Educational, health and social services (16.3%), Retail trade (14.7%), Manufacturing (14.5%), Professional, scientific, management, administrative, and waste management services (10.1%).
Type of workers:
- Private wage or salary: 79%
- Government: 11%
- Self-employed, not incorporated: 9%
- Unpaid family work: 0%
- OSM Map
- General Map
- Google Map
- MSN Map

- 5,63853.3%White Non-Hispanic Alone
- 3,97637.6%Black Non-Hispanic Alone
- 4914.6%Hispanic or Latino
- 3733.5%Two or more races
- 610.6%Asian alone
- 350.3%American Indian and Alaska Native alone
- 80.08%Some other race alone

| Median resident age: | 47.3 years |
| Virginia median age: | 39.0 years |
| Males: 5,023 | |
| Females: 5,651 |

 | Northern Neck Questions (7 replies) |
| Looking into Richmond area (7 replies) |
| Homeowner-roommate agreement (1 reply) |
| Nothern Neck Middle Peninsulla (7 replies) |
| Essex County: | 2.0 people |
| Virginia: | 3 people |
Estimated median household income in 2022: $51,509 ($37,395 in 1999)
| This county: | $51,509 |
| Virginia: | $85,873 |
Median contract rent in 2022 for apartments: $758 (lower quartile is $629, upper quartile is $824)
| This county: | $758 |
| State: | $1270 |
Estimated median house or condo value in 2022: $233,540 (it was $91,100 in 2000)
| Essex: | $233,540 |
| Virginia: | $365,700 |
Mean price in 2022:
Median monthly housing costs for homes and condos with a mortgage: $1,265Detached houses: $279,184
Here: $279,184 State: $472,865 Townhouses or other attached units: $265,815
Here: $265,815 State: $457,437 In 5-or-more-unit structures: $236,529
Here: $236,529 State: $382,551 Mobile homes: $140,160
Here: $140,160 State: $100,736
Median monthly housing costs for units without a mortgage: $469
Institutionalized population: 78
Crime in 2021 (reported by the sheriff's office or county police, not the county total):
- Murders: 0
- Rapes: 2
- Robberies: 0
- Assaults: 5
- Burglaries: 8
- Thefts: 23
- Auto thefts: 3
Crime in 2020 (reported by the sheriff's office or county police, not the county total):
- Murders: 0
- Rapes: 4
- Robberies: 1
- Assaults: 8
- Burglaries: 8
- Thefts: 8
- Auto thefts: 5
Single-family new house construction building permits:
- 2022: 41 buildings, average cost: $251,600
- 2021: 44 buildings, average cost: $167,000
- 2020: 36 buildings, average cost: $167,000
- 2019: 33 buildings, average cost: $167,000
- 2018: 40 buildings, average cost: $150,900
- 2017: 29 buildings, average cost: $131,500
- 2016: 24 buildings, average cost: $154,000
- 2015: 18 buildings, average cost: $162,600
- 2014: 14 buildings, average cost: $177,200
- 2013: 22 buildings, average cost: $151,500
- 2012: 23 buildings, average cost: $306,900
- 2011: 24 buildings, average cost: $163,800
- 2010: 25 buildings, average cost: $178,600
- 2009: 29 buildings, average cost: $104,300
- 2008: 55 buildings, average cost: $129,500
- 2007: 114 buildings, average cost: $170,800
- 2006: 155 buildings, average cost: $158,300
- 2005: 152 buildings, average cost: $147,000
- 2004: 110 buildings, average cost: $130,800
- 2003: 76 buildings, average cost: $138,700
- 2002: 50 buildings, average cost: $109,200
- 2001: 57 buildings, average cost: $94,200
- 2000: 41 buildings, average cost: $140,400
- 1999: 67 buildings, average cost: $97,700
- 1998: 49 buildings, average cost: $93,300
- 1997: 43 buildings, average cost: $92,300


Median real estate property taxes paid for housing units with mortgages in 2022: $1,477 (0.6%)
Median real estate property taxes paid for housing units with no mortgage in 2022: $1,285 (0.5%)


| Essex County: | 18.1% |
| Virginia: | 10.6% |
Median age of residents in 2022: 47.3 years old
(Males: 47.2 years old, Females: 47.2 years old)
(Median age for: White residents: 53.8 years old, Black residents: 46.8 years old, American Indian residents: 13.8 years old, Asian residents: 43.7 years old, Hispanic or Latino residents: 18.8 years old)
Fair market rent in 2006 for a 1-bedroom apartment in Essex County is $479 a month.
Fair market rent for a 2-bedroom apartment is $590 a month.
Fair market rent for a 3-bedroom apartment is $803 a month.
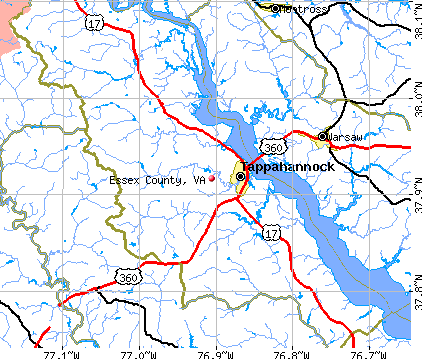
Cities in this county include: Tappahannock.
Neighboring counties: Lincoln County, Nevada  , Jefferson County, Missouri , Laclede County, Missouri , Pawnee County, Kansas , Mercer County, Kentucky .
| Here: | 3.9% |
| Virginia: | 2.7% |


Current college students: 311
People 25 years of age or older with a high school degree or higher: 82.6%
People 25 years of age or older with a bachelor's degree or higher: 15.3%
Number of foreign born residents: 140 (85.2% naturalized citizens)
| Essex County: | 1.3% |
| Whole state: | 12.7% |

- Year of entry for the foreign-born population
- 472010 or later
- 302000 to 2009
- 101990 to 1999
- 411980 to 1989
- 221970 to 1979
- 30Before 1970
Mean travel time to work (commute): ! minutes
Percentage of county residents living and working in this county: 98.0%
Housing units in structures:
- One, detached: 4,153
- One, attached: 174
- Two: 35
- 3 or 4: 83
- 5 to 9: 281
- 10 to 19: 49
- 20 to 49: 48
- 50 or more: 126
- Mobile homes: 877
Housing units in Essex County with a mortgage: 1,474 (214 second mortgage, 15 home equity loan, 153 both second mortgage and home equity loan)
Houses without a mortgage: 1
| Here: | 50.0% with mortgage |
| State: | 97.2% with mortgage |
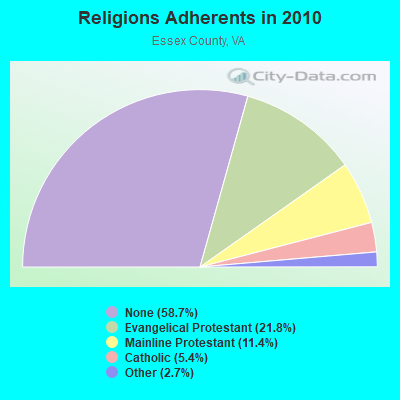
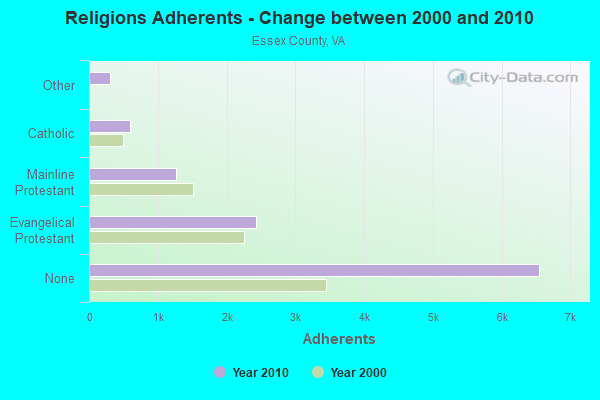
Religion statistics for Essex County
| Religion | Adherents | Congregations |
|---|---|---|
| Evangelical Protestant | 2,432 | 14 |
| Mainline Protestant | 1,268 | 10 |
| Catholic | 600 | 1 |
| Other | 301 | 1 |
| None | 6,550 | - |
Source: Clifford Grammich, Kirk Hadaway, Richard Houseal, Dale E.Jones, Alexei Krindatch, Richie Stanley and Richard H.Taylor. 2012. 2010 U.S.Religion Census: Religious Congregations & Membership Study. Association of Statisticians of American Religious Bodies. Jones, Dale E., et al. 2002. Congregations and Membership in the United States 2000. Nashville, TN: Glenmary Research Center.
Food Environment Statistics:
| Essex County: | 2.77 / 10,000 pop. |
| State: | 2.03 / 10,000 pop. |
| Here: | 0.92 / 10,000 pop. |
| Virginia: | 0.17 / 10,000 pop. |
| This county: | 1.85 / 10,000 pop. |
| Virginia: | 1.43 / 10,000 pop. |
| Essex County: | 5.54 / 10,000 pop. |
| Virginia: | 4.03 / 10,000 pop. |
| This county: | 12.01 / 10,000 pop. |
| State: | 7.65 / 10,000 pop. |
| Essex County: | 12.5% |
| Virginia: | 9.3% |
| Essex County: | 31.2% |
| State: | 26.7% |
| Here: | 21.4% |
| State: | 18.6% |
Agriculture in Essex County:
Average size of farms: 459 acresAverage value of agricultural products sold per farm: $63,759
Average value of crops sold per acre for harvested cropland: $228.40
The value of nursery, greenhouse, floriculture, and sod as a percentage of the total market value of agricultural products sold: 7.52%
The value of livestock, poultry, and their products as a percentage of the total market value of agricultural products sold: 4.76%
Average total farm production expenses per farm: $64,744
Harvested cropland as a percentage of land in farms: 57.95%
Irrigated harvested cropland as a percentage of land in farms: 0.73%
Average market value of all machinery and equipment per farm: $100,335
The percentage of farms operated by a family or individual: 90.55%
Average age of principal farm operators: 53 years
Average number of cattle and calves per 100 acres of all land in farms: 2.11
Corn for grain: 14342 harvested acres
All wheat for grain: 7487 harvested acres
Soybeans for beans: 17882 harvested acres
Vegetables: 20 harvested acres
Land in orchards: 56 acres
Earthquake activity:
Essex County-area historical earthquake activity is significantly above Virginia state average. It is 57% smaller than the overall U.S. average.On 8/23/2011 at 17:51:04, a magnitude 5.8 (5.8 MW, Depth: 3.7 mi, Class: Moderate, Intensity: VI - VII) earthquake occurred 56.2 miles away from Essex County center
On 8/25/2011 at 05:07:52, a magnitude 4.5 (4.5 ML, Depth: 4.2 mi, Class: Light, Intensity: IV - V) earthquake occurred 57.9 miles away from the county center
On 12/9/2003 at 20:59:14, a magnitude 4.5 (4.5 MB, 4.5 LG) earthquake occurred 59.1 miles away from the county center
On 12/9/2003 at 20:59:18, a magnitude 4.5 (4.5 ML, Depth: 6.2 mi) earthquake occurred 65.9 miles away from the county center
On 8/24/2011 at 00:04:36, a magnitude 4.2 (4.2 ML) earthquake occurred 57.2 miles away from Essex County center
On 8/9/2020 at 12:07:37, a magnitude 5.1 (5.1 MW, Depth: 4.7 mi) earthquake occurred 251.3 miles away from the county center
Magnitude types: regional Lg-wave magnitude (LG), body-wave magnitude (MB), local magnitude (ML), moment magnitude (MW)
Most recent natural disasters:
- Virginia Covid-19 Pandemic, Incident Period: January 20, 2020, Major Disaster (Presidential) Declared DR-4512-VA: April 2, 2020, FEMA Id: 4512, Natural disaster type: Other
- Virginia Tropical Storm Michael, Incident Period: October 9, 2018 - October 16, 2018, FEMA Id: 4411, Natural disaster type: Tropical Storm
- Virginia Hurricane Sandy, Incident Period: October 26, 2012 to November 01, 2012, Emergency Declared EM-3359: October 29, 2012, FEMA Id: 3359, Natural disaster type: Hurricane
- Virginia Remnants of Tropical Storm Lee, Incident Period: September 08, 2011 to September 09, 2011, Major Disaster (Presidential) Declared DR-4045: November 17, 2011, FEMA Id: 4045, Natural disaster type: Tropical Storm
- Virginia Hurricane Irene, Incident Period: August 26, 2011 to September 04, 2011, Emergency Declared EM-3329: August 26, 2011, FEMA Id: 3329, Natural disaster type: Hurricane
- Virginia Hurricane Irene, Incident Period: August 26, 2011 to August 28, 2011, Major Disaster (Presidential) Declared DR-4024: September 03, 2011, FEMA Id: 4024, Natural disaster type: Hurricane
- Virginia Severe Winter Storms and Snowstorms, Incident Period: February 05, 2010 to February 11, 2010, Major Disaster (Presidential) Declared DR-1905: April 27, 2010, FEMA Id: 1905, Natural disaster type: Snowstorm, Winter Storm
- Virginia Severe Storms and Flooding, Including Severe Storms and Flooding Associated with Tropical Depression Ernesto, Incident Period: August 29, 2006 to September 07, 2006, Major Disaster (Presidential) Declared DR-1661: September 22, 2006, FEMA Id: 1661, Natural disaster type: Storm, Flood, Tropical Depression
- Virginia Hurricane Katrina Evacuation, Incident Period: August 29, 2005 to October 01, 2005, Emergency Declared EM-3240: September 12, 2005, FEMA Id: 3240, Natural disaster type: Hurricane
- Virginia Hurricane Isabel, Incident Period: September 18, 2003 to October 01, 2003, Major Disaster (Presidential) Declared DR-1491: September 18, 2003, FEMA Id: 1491, Natural disaster type: Hurricane
- 10 other natural disasters have been reported since 1953.
The number of natural disasters in Essex County (20) is greater than the US average (15).
Major Disasters (Presidential) Declared: 14
Emergencies Declared: 5
Causes of natural disasters: Hurricanes: 7, Floods: 4, Storms: 4, Tropical Storms: 3, Winter Storms: 3, Blizzard: 1, Drought: 1, Ice Storm: 1, Snowstorm: 1, Tropical Depression: 1, Other: 1 (Note: some incidents may be assigned to more than one category).

Means of transportation to work:
- Drove a car alone: 2,560 (66.9%)
- Carpooled: 592 (15.5%)
- Bus: 16 (0.4%)
- Taxicab, motorcycle, or other means: 99 (2.6%)
- Walked: 64 (1.7%)
- Worked at home: 453 (11.8%)


- Retail trade (17%)
- Health care and social assistance (16%)
- Finance and insurance (9%)
- Manufacturing (9%)
- Educational services (8%)
- Public administration (7%)
- Other services, except public administration (5%)

- Retail trade (20%)
- Health care and social assistance (18%)
- Finance and insurance (11%)
- Manufacturing (10%)
- Educational services (10%)
- Public administration (8%)
- Other services, except public administration (6%)

- Construction and extraction occupations (23%)
- Management occupations (11%)
- Sales and related occupations (9%)
- Production occupations (8%)
- Transportation occupations (7%)
- Material moving occupations (7%)
- Architecture and engineering occupations (5%)

- Office and administrative support occupations (16%)
- Management occupations (16%)
- Sales and related occupations (12%)
- Healthcare support occupations (12%)
- Educational instruction, and library occupations (7%)
- Business and financial operations occupations (5%)
- Personal care and service occupations (5%)

- Afghanistan (29%)
- China, excluding Hong Kong and Taiwan (16%)
- Colombia (14%)
- Korea (10%)
- Oceania, n.e.c. (9%)
- United Kingdom, excluding England and Scotland (6%)
- El Salvador (6%)

- English (17%)
- American (12%)
- German (5%)
- Irish (3%)
- Italian (3%)
- Afghan (2%)
- Scottish (1%)


78 people in nursing facilities/skilled-nursing facilities
People in group quarters in Essex County, Virginia in 2000:
- 143 people in nursing homes
- 14 people in other noninstitutional group quarters
- 3 people in homes for the mentally retarded
7.69% of this county's 2021 resident taxpayers lived in other counties in 2020 ($57,431 average adjusted gross income)
| Here: | 7.69% |
| Virginia average: | 10.16% |
10 or fewer of this county's residents moved from foreign countries.
6.39% relocated from other counties in Virginia ($42,847 average AGI)
1.29% relocated from other states ($14,584 average AGI)
Essex County: 1.29% Virginia average: 3.91%

Top counties from which taxpayers relocated into this county between 2020 and 2021:
| from Richmond County, VA | |
| from King William County, VA | |
| from Henrico County, VA | |
| from Westmoreland County, VA |
6.80% of this county's 2020 resident taxpayers moved to other counties in 2021 ($54,650 average adjusted gross income)
| Here: | 6.80% |
| Virginia average: | 10.20% |
10 or fewer of this county's residents moved to foreign countries.
5.86% relocated to other counties in Virginia ($41,354 average AGI)
0.94% relocated to other states ($13,296 average AGI)
Essex County: 0.94% Virginia average: 3.98%

Top counties to which taxpayers relocated from this county between 2020 and 2021:
| to Hanover County, VA | |
| to Richmond County, VA | |
| to King and Queen County, VA |
Births per 1000 population from 1990 to 1999: 12.2
Births per 1000 population from 2000 to 2006: 11.6

Deaths per 1000 population from 1990 to 1999: 12.3
Deaths per 1000 population from 2000 to 2009: 12.3
Deaths per 1000 population from 2010 to 2020: 12.1

Infant deaths per 1000 live births from 1990 to 1999: 11.5
Infant deaths per 1000 live births from 2000 to 2006: 11.9

Persons under 19 years old without health insurance coverage in 2018: 5.8%


Persons enrolled in hospital insurance and/or supplemental medical insurance (Medicare) in July 1, 2007: 2,137 (1,765 aged, 372 disabled)
Children under 18 without health insurance coverage in 2007: 249 (10%)


Most common underlying causes of death in Essex County, Virginia in 1999 - 2019:
- Bronchus or lung, unspecified - Malignant neoplasms (99)
- Acute myocardial infarction, unspecified (68)
- Alzheimer disease, unspecified (11)
- Unspecified dementia (11)
- Chronic obstructive pulmonary disease, unspecified (10)
- Stroke, not specified as haemorrhage or infarction (10)
Population without health insurance coverage in 2000: 14%
Children under 18 without health insurance coverage in 2000: 10%
Short term general hospital admissions per 100,000 population in 2004: 20,263
Short term general hospital beds per 100,000 population in 2004: 271
Emergency room visits per 100,000 population in 2004: 184,496
General practice office based MDs per 100,000 population in 2005: 1,382
Medical specialist MDs per 100,000 population in 2005: 1,592
Dentists per 100,000 population in 1998: 10
Total births per 100,000 population, July 2005 - July 2006 : 88
Total deaths per 100,000 population, July 2005 - July 2006: 105
Limited-service eating places per 100,000 population in 2005 : 29
Household type by relationship:
Households: 10,674- Male householders: 1,758 (540 living alone), Female householders: 2,622 (956 living alone)
1,905 spouses (1,883 opposite-sex spouses), 353 unmarried partners, (338 opposite-sex unmarried partners), 2,671 children (2,603 natural, 20 adopted, 52 stepchildren), 474 grandchildren, 82 brothers or sisters, 236 parents, 0 foster children, 238 other relatives, 206 non-relatives
- In group quarters: 126
Size of family households: 1,516 2-persons, 672 3-persons, 262 4-persons, 168 5-persons, 102 6-persons.
Size of nonfamily households: 1,497 1-person, 153 2-persons, 11 3-persons.
694 married couples with children.
767 single-parent households (69 men, 698 women).
94.0% of residents of Essex speak English at home.
4.5% of residents speak Spanish at home (96% speak English very well, 2% speak English well, 2% don't speak English at all).
1.0% of residents speak other Indo-European language at home (69% speak English very well, 19% speak English well, 12% speak English not well).
0.7% of residents speak Asian or Pacific Island language at home (38% speak English very well, 49% speak English well, 13% speak English not well).
In fiscal year 2004:
Federal Government expenditure: $101,815,000 ($9,848 per capita)
Department of Defense expenditure: $35,185,000
Federal direct payments to individuals for retirement and disability: $30,913,000
Federal other direct payments to individuals: $17,561,000
Federal direct payments not to individuals: $5,420,000
Federal grants: $12,577,000
Federal procurement contracts: $33,815,000 ($33,437,000 Department of Defense)
Federal salaries and wages: $1,530,000 ($0,000 Department of Defense)
Federal Government direct loans: $1,240,000
Federal guaranteed/insured loans: $3,889,000
Federal Government insurance: $36,369,000
Population change from April 1, 2000 to July 1, 2005:
Births: 614| Here: | 59 per 1000 residents |
| State: | 70 per 1000 residents |
Deaths: 666
| Here: | 63 per 1000 residents |
| State: | 40 per 1000 residents |
Net international migration: +23
| Here: | +2 per 1000 residents |
| State: | +18 per 1000 residents |
Net internal migration: +553
| Here: | +53 per 1000 residents |
| State: | +14 per 1000 residents |

Total withdrawal of fresh water for public supply: 0.41 millions of gallons per day (all from ground)
| Here: | 6.2 |
| State: | 7.0 |
| Here: | 4.8 |
| State: | 4.3 |

- Year house built in Essex County, Virginia
- 42020 or later
- 2592010 to 2019
- 1,2212000 to 2009
- 7001990 to 1999
- 8161980 to 1989
- 8921970 to 1979
- 6501960 to 1969
- 4721950 to 1959
- 3541940 to 1949
- 4001939 or earlier

- Rooms in owner-occupied houses in Essex County, Virginia
- 81 room
- 02 rooms
- 1743 rooms
- 3524 rooms
- 5965 rooms
- 4536 rooms
- 5107 rooms
- 3788 rooms
- 4069+ rooms

- Rooms in renter-occupied apartments in Essex County, Virginia
- 411 room
- 112 rooms
- 3283 rooms
- 2084 rooms
- 4295 rooms
- 2086 rooms
- 1707 rooms
- 248 rooms
- 529+ rooms

- Bedrooms in owner-occupied houses in Essex County, Virginia
- 9no bedroom
- 1811 bedroom
- 4462 bedrooms
- 1,5243 bedrooms
- 5974 bedrooms
- 1205+ bedrooms

- Bedrooms in renter-occupied apartments in Essex County, Virginia
- 41no bedroom
- 1581 bedroom
- 6142 bedrooms
- 5973 bedrooms
- 674 bedrooms
- 05+ bedrooms

- Cars and other vehicles available in Essex County in owner-occupied houses/condos
- 75no vehicle
- 1,0201 vehicle
- 8062 vehicles
- 5833 vehicles
- 2474 vehicles
- 1635+ vehicles

- Cars and other vehicles available in Essex County in renter-occupied apartments
- 160no vehicle
- 7221 vehicle
- 4102 vehicles
- 1733 vehicles
- 104 vehicles
- 155+ vehicles
90.9% of Essex County residents lived in the same house 1 years ago.
Out of people who lived in different houses, 28% lived in this county.
Out of people who lived in different counties, 63% lived in Virginia.
| Essex County: | 90.9% |
| State average: | 86.6% |
Place of birth for U.S.-born residents:
- This state: 7,948
- Other state: 2,223
- Northeast: 830
- Midwest: 210
- South: 1,094
- West: 81


- 77.1%Electricity
- 10.7%Bottled, tank, or LP gas
- 7.6%Fuel oil, kerosene, etc.
- 2.2%Wood
- 1.8%Utility gas
- 0.4%No fuel used
- 0.2%Other fuel

- 74.4%Electricity
- 16.5%Fuel oil, kerosene, etc.
- 7.6%Bottled, tank, or LP gas
- 1.0%Utility gas
- 0.3%Wood
- 0.2%No fuel used
Private vs. public school enrollment:
| Here: | 21.8% |
| Virginia: | 13.2% |
| Here: | 14.0% |
| Virginia: | 10.2% |
| Here: | 6.3% |
| Virginia: | 18.7% |


Essex County government finances - Expenditure in 2020:
- Assistance and Subsidies - Public Welfare, Federal Categorical Assistance Programs: $1,522,000
Public Welfare, Federal Categorical Assistance Programs: $1,522,000
- Bond Funds - Cash and Securities: $18,242,000
- Charges - Other: $4,884,000
Elementary and Secondary Education School Lunch: $192,000
Elementary and Secondary Education School Lunch: $143,000
Parks and Recreation: $18,000
Elementary and Secondary Education - Other: $14,000
Parks and Recreation: $7,000
Elementary and Secondary Education - Other: $3,000
Elementary and Secondary Education School Tuition and Transportation: $3,000
Housing and Community Development: $1,000
- Construction - Elementary and Secondary Education: $1,778,000
Elementary and Secondary Education: $5,000
- Current Operations - Elementary and Secondary Education: $20,638,000
Elementary and Secondary Education: $18,546,000
Health - Other: $7,133,000
General - Other: $3,803,000
Public Welfare - Other: $2,461,000
Public Welfare - Other: $1,813,000
Police Protection: $1,772,000
Financial Administration: $1,254,000
Police Protection: $1,121,000
Correctional Institutions: $1,082,000
Central Staff Services: $936,000
Solid Waste Management: $859,000
Solid Waste Management: $711,000
Judicial and Legal Services: $703,000
General Public Buildings: $620,000
Financial Administration: $431,000
General Public Buildings: $361,000
Judicial and Legal Services: $358,000
Corrections - Other: $300,000
Libraries: $293,000
Libraries: $205,000
Central Staff Services: $180,000
Parks and Recreation: $158,000
Parks and Recreation: $136,000
Local Fire Protection: $127,000
Housing and Community Development: $111,000
Protective Inspection and Regulation - Other: $103,000
Local Fire Protection: $99,000
Corrections - Other: $95,000
Miscellaneous Commercial Activities - Other: $85,000
Natural Resources - Other: $21,000
Regular Highways: $8,000
Public Welfare, Vendor Payments for Other Purposes: $8,000
- Federal Intergovernmental - Public Welfare: $1,207,000
Health and Hospitals: $189,000
Education: $180,000
Other: $65,000
Education: $59,000
General Local Government Support: $9,000
- General - Interest on Debt: $372,000
Interest on Debt: $216,000
- Intergovernmental to Local - Other - Corrections: $1,293,000
Other - Elementary and Secondary Education: $552,000
Other - Elementary and Secondary Education: $468,000
Other - Air Transportation: $40,000
Other - Air Transportation: $34,000
Other - Transit Utilities: $21,000
Other - Health - Other: $16,000
Other - General - Other: $1,000
- Local Intergovernmental - Education: $681,000
Education: $576,000
Health and Hospitals: $32,000
- Long Term Debt - Beginning Outstanding - Unspecified Public Purpose: $9,311,000
Retired Unspecified Public Purpose: $7,752,000
Beginning Outstanding - Unspecified Public Purpose: $3,224,000
Outstanding Unspecified Public Purpose: $2,952,000
Outstanding Unspecified Public Purpose: $1,559,000
Retired Unspecified Public Purpose: $272,000
- Miscellaneous - General Revenue - Other: $570,000
Interest Earnings: $413,000
General Revenue - Other: $163,000
Fines and Forfeits: $85,000
Rents: $70,000
Interest Earnings: $40,000
Fines and Forfeits: $12,000
Sale of Property: $9,000
Sale of Property: $6,000
Donations From Private Sources: $5,000
- Other Capital Outlay - Elementary and Secondary Education: $773,000
Elementary and Secondary Education: $453,000
General - Other: $217,000
Health - Other: $163,000
Police Protection: $86,000
Local Fire Protection: $35,000
- Other Funds - Cash and Securities: $5,897,000
Cash and Securities: $2,987,000
- State Intergovernmental - Education: $12,179,000
Education: $11,649,000
Other: $1,785,000
Other: $1,348,000
Public Welfare: $1,201,000
Public Welfare: $756,000
Housing and Community Development: $152,000
- Tax - Property: $14,642,000
Property: $7,991,000
General Sales and Gross Receipts: $2,032,000
General Sales and Gross Receipts: $1,315,000
Public Utilities Sales: $378,000
Motor Vehicle License: $301,000
Public Utilities Sales: $258,000
Other: $123,000
Other License: $67,000
Other License: $59,000
Public Utility License: $6,000
Motor Vehicle License: $1,000
- Total Salaries and Wages: $12,453,000
: $10,092,000
Essex County government finances - Revenue in 2020:
- Assistance and Subsidies - Public Welfare, Federal Categorical Assistance Programs: $1,522,000
Public Welfare, Federal Categorical Assistance Programs: $1,522,000
- Bond Funds - Cash and Securities: $18,242,000
- Charges - Other: $4,884,000
Elementary and Secondary Education School Lunch: $192,000
Elementary and Secondary Education School Lunch: $143,000
Parks and Recreation: $18,000
Elementary and Secondary Education - Other: $14,000
Parks and Recreation: $7,000
Elementary and Secondary Education - Other: $3,000
Elementary and Secondary Education School Tuition and Transportation: $3,000
Housing and Community Development: $1,000
- Construction - Elementary and Secondary Education: $1,778,000
Elementary and Secondary Education: $5,000
- Current Operations - Elementary and Secondary Education: $20,638,000
Elementary and Secondary Education: $18,546,000
Health - Other: $7,133,000
General - Other: $3,803,000
Public Welfare - Other: $2,461,000
Public Welfare - Other: $1,813,000
Police Protection: $1,772,000
Financial Administration: $1,254,000
Police Protection: $1,121,000
Correctional Institutions: $1,082,000
Central Staff Services: $936,000
Solid Waste Management: $859,000
Solid Waste Management: $711,000
Judicial and Legal Services: $703,000
General Public Buildings: $620,000
Financial Administration: $431,000
General Public Buildings: $361,000
Judicial and Legal Services: $358,000
Corrections - Other: $300,000
Libraries: $293,000
Libraries: $205,000
Central Staff Services: $180,000
Parks and Recreation: $158,000
Parks and Recreation: $136,000
Local Fire Protection: $127,000
Housing and Community Development: $111,000
Protective Inspection and Regulation - Other: $103,000
Local Fire Protection: $99,000
Corrections - Other: $95,000
Miscellaneous Commercial Activities - Other: $85,000
Natural Resources - Other: $21,000
Regular Highways: $8,000
Public Welfare, Vendor Payments for Other Purposes: $8,000
- Federal Intergovernmental - Public Welfare: $1,207,000
Health and Hospitals: $189,000
Education: $180,000
Other: $65,000
Education: $59,000
General Local Government Support: $9,000
- General - Interest on Debt: $372,000
Interest on Debt: $216,000
- Intergovernmental to Local - Other - Corrections: $1,293,000
Other - Elementary and Secondary Education: $552,000
Other - Elementary and Secondary Education: $468,000
Other - Air Transportation: $40,000
Other - Air Transportation: $34,000
Other - Transit Utilities: $21,000
Other - Health - Other: $16,000
Other - General - Other: $1,000
- Local Intergovernmental - Education: $681,000
Education: $576,000
Health and Hospitals: $32,000
- Long Term Debt - Beginning Outstanding - Unspecified Public Purpose: $9,311,000
Retired Unspecified Public Purpose: $7,752,000
Beginning Outstanding - Unspecified Public Purpose: $3,224,000
Outstanding Unspecified Public Purpose: $2,952,000
Outstanding Unspecified Public Purpose: $1,559,000
Retired Unspecified Public Purpose: $272,000
- Miscellaneous - General Revenue - Other: $570,000
Interest Earnings: $413,000
General Revenue - Other: $163,000
Fines and Forfeits: $85,000
Rents: $70,000
Interest Earnings: $40,000
Fines and Forfeits: $12,000
Sale of Property: $9,000
Sale of Property: $6,000
Donations From Private Sources: $5,000
- Other Capital Outlay - Elementary and Secondary Education: $773,000
Elementary and Secondary Education: $453,000
General - Other: $217,000
Health - Other: $163,000
Police Protection: $86,000
Local Fire Protection: $35,000
- Other Funds - Cash and Securities: $5,897,000
Cash and Securities: $2,987,000
- State Intergovernmental - Education: $12,179,000
Education: $11,649,000
Other: $1,785,000
Other: $1,348,000
Public Welfare: $1,201,000
Public Welfare: $756,000
Housing and Community Development: $152,000
- Tax - Property: $14,642,000
Property: $7,991,000
General Sales and Gross Receipts: $2,032,000
General Sales and Gross Receipts: $1,315,000
Public Utilities Sales: $378,000
Motor Vehicle License: $301,000
Public Utilities Sales: $258,000
Other: $123,000
Other License: $67,000
Other License: $59,000
Public Utility License: $6,000
Motor Vehicle License: $1,000
- Total Salaries and Wages: $12,453,000
: $10,092,000
Essex County government finances - Debt in 2020:
- Assistance and Subsidies - Public Welfare, Federal Categorical Assistance Programs: $1,522,000
Public Welfare, Federal Categorical Assistance Programs: $1,522,000
- Bond Funds - Cash and Securities: $18,242,000
- Charges - Other: $4,884,000
Elementary and Secondary Education School Lunch: $192,000
Elementary and Secondary Education School Lunch: $143,000
Parks and Recreation: $18,000
Elementary and Secondary Education - Other: $14,000
Parks and Recreation: $7,000
Elementary and Secondary Education - Other: $3,000
Elementary and Secondary Education School Tuition and Transportation: $3,000
Housing and Community Development: $1,000
- Construction - Elementary and Secondary Education: $1,778,000
Elementary and Secondary Education: $5,000
- Current Operations - Elementary and Secondary Education: $20,638,000
Elementary and Secondary Education: $18,546,000
Health - Other: $7,133,000
General - Other: $3,803,000
Public Welfare - Other: $2,461,000
Public Welfare - Other: $1,813,000
Police Protection: $1,772,000
Financial Administration: $1,254,000
Police Protection: $1,121,000
Correctional Institutions: $1,082,000
Central Staff Services: $936,000
Solid Waste Management: $859,000
Solid Waste Management: $711,000
Judicial and Legal Services: $703,000
General Public Buildings: $620,000
Financial Administration: $431,000
General Public Buildings: $361,000
Judicial and Legal Services: $358,000
Corrections - Other: $300,000
Libraries: $293,000
Libraries: $205,000
Central Staff Services: $180,000
Parks and Recreation: $158,000
Parks and Recreation: $136,000
Local Fire Protection: $127,000
Housing and Community Development: $111,000
Protective Inspection and Regulation - Other: $103,000
Local Fire Protection: $99,000
Corrections - Other: $95,000
Miscellaneous Commercial Activities - Other: $85,000
Natural Resources - Other: $21,000
Regular Highways: $8,000
Public Welfare, Vendor Payments for Other Purposes: $8,000
- Federal Intergovernmental - Public Welfare: $1,207,000
Health and Hospitals: $189,000
Education: $180,000
Other: $65,000
Education: $59,000
General Local Government Support: $9,000
- General - Interest on Debt: $372,000
Interest on Debt: $216,000
- Intergovernmental to Local - Other - Corrections: $1,293,000
Other - Elementary and Secondary Education: $552,000
Other - Elementary and Secondary Education: $468,000
Other - Air Transportation: $40,000
Other - Air Transportation: $34,000
Other - Transit Utilities: $21,000
Other - Health - Other: $16,000
Other - General - Other: $1,000
- Local Intergovernmental - Education: $681,000
Education: $576,000
Health and Hospitals: $32,000
- Long Term Debt - Beginning Outstanding - Unspecified Public Purpose: $9,311,000
Retired Unspecified Public Purpose: $7,752,000
Beginning Outstanding - Unspecified Public Purpose: $3,224,000
Outstanding Unspecified Public Purpose: $2,952,000
Outstanding Unspecified Public Purpose: $1,559,000
Retired Unspecified Public Purpose: $272,000
- Miscellaneous - General Revenue - Other: $570,000
Interest Earnings: $413,000
General Revenue - Other: $163,000
Fines and Forfeits: $85,000
Rents: $70,000
Interest Earnings: $40,000
Fines and Forfeits: $12,000
Sale of Property: $9,000
Sale of Property: $6,000
Donations From Private Sources: $5,000
- Other Capital Outlay - Elementary and Secondary Education: $773,000
Elementary and Secondary Education: $453,000
General - Other: $217,000
Health - Other: $163,000
Police Protection: $86,000
Local Fire Protection: $35,000
- Other Funds - Cash and Securities: $5,897,000
Cash and Securities: $2,987,000
- State Intergovernmental - Education: $12,179,000
Education: $11,649,000
Other: $1,785,000
Other: $1,348,000
Public Welfare: $1,201,000
Public Welfare: $756,000
Housing and Community Development: $152,000
- Tax - Property: $14,642,000
Property: $7,991,000
General Sales and Gross Receipts: $2,032,000
General Sales and Gross Receipts: $1,315,000
Public Utilities Sales: $378,000
Motor Vehicle License: $301,000
Public Utilities Sales: $258,000
Other: $123,000
Other License: $67,000
Other License: $59,000
Public Utility License: $6,000
Motor Vehicle License: $1,000
- Total Salaries and Wages: $12,453,000
: $10,092,000
Essex County government finances - Cash and Securities in 2020:
- Assistance and Subsidies - Public Welfare, Federal Categorical Assistance Programs: $1,522,000
Public Welfare, Federal Categorical Assistance Programs: $1,522,000
- Bond Funds - Cash and Securities: $18,242,000
- Charges - Other: $4,884,000
Elementary and Secondary Education School Lunch: $192,000
Elementary and Secondary Education School Lunch: $143,000
Parks and Recreation: $18,000
Elementary and Secondary Education - Other: $14,000
Parks and Recreation: $7,000
Elementary and Secondary Education - Other: $3,000
Elementary and Secondary Education School Tuition and Transportation: $3,000
Housing and Community Development: $1,000
- Construction - Elementary and Secondary Education: $1,778,000
Elementary and Secondary Education: $5,000
- Current Operations - Elementary and Secondary Education: $20,638,000
Elementary and Secondary Education: $18,546,000
Health - Other: $7,133,000
General - Other: $3,803,000
Public Welfare - Other: $2,461,000
Public Welfare - Other: $1,813,000
Police Protection: $1,772,000
Financial Administration: $1,254,000
Police Protection: $1,121,000
Correctional Institutions: $1,082,000
Central Staff Services: $936,000
Solid Waste Management: $859,000
Solid Waste Management: $711,000
Judicial and Legal Services: $703,000
General Public Buildings: $620,000
Financial Administration: $431,000
General Public Buildings: $361,000
Judicial and Legal Services: $358,000
Corrections - Other: $300,000
Libraries: $293,000
Libraries: $205,000
Central Staff Services: $180,000
Parks and Recreation: $158,000
Parks and Recreation: $136,000
Local Fire Protection: $127,000
Housing and Community Development: $111,000
Protective Inspection and Regulation - Other: $103,000
Local Fire Protection: $99,000
Corrections - Other: $95,000
Miscellaneous Commercial Activities - Other: $85,000
Natural Resources - Other: $21,000
Regular Highways: $8,000
Public Welfare, Vendor Payments for Other Purposes: $8,000
- Federal Intergovernmental - Public Welfare: $1,207,000
Health and Hospitals: $189,000
Education: $180,000
Other: $65,000
Education: $59,000
General Local Government Support: $9,000
- General - Interest on Debt: $372,000
Interest on Debt: $216,000
- Intergovernmental to Local - Other - Corrections: $1,293,000
Other - Elementary and Secondary Education: $552,000
Other - Elementary and Secondary Education: $468,000
Other - Air Transportation: $40,000
Other - Air Transportation: $34,000
Other - Transit Utilities: $21,000
Other - Health - Other: $16,000
Other - General - Other: $1,000
- Local Intergovernmental - Education: $681,000
Education: $576,000
Health and Hospitals: $32,000
- Long Term Debt - Beginning Outstanding - Unspecified Public Purpose: $9,311,000
Retired Unspecified Public Purpose: $7,752,000
Beginning Outstanding - Unspecified Public Purpose: $3,224,000
Outstanding Unspecified Public Purpose: $2,952,000
Outstanding Unspecified Public Purpose: $1,559,000
Retired Unspecified Public Purpose: $272,000
- Miscellaneous - General Revenue - Other: $570,000
Interest Earnings: $413,000
General Revenue - Other: $163,000
Fines and Forfeits: $85,000
Rents: $70,000
Interest Earnings: $40,000
Fines and Forfeits: $12,000
Sale of Property: $9,000
Sale of Property: $6,000
Donations From Private Sources: $5,000
- Other Capital Outlay - Elementary and Secondary Education: $773,000
Elementary and Secondary Education: $453,000
General - Other: $217,000
Health - Other: $163,000
Police Protection: $86,000
Local Fire Protection: $35,000
- Other Funds - Cash and Securities: $5,897,000
Cash and Securities: $2,987,000
- State Intergovernmental - Education: $12,179,000
Education: $11,649,000
Other: $1,785,000
Other: $1,348,000
Public Welfare: $1,201,000
Public Welfare: $756,000
Housing and Community Development: $152,000
- Tax - Property: $14,642,000
Property: $7,991,000
General Sales and Gross Receipts: $2,032,000
General Sales and Gross Receipts: $1,315,000
Public Utilities Sales: $378,000
Motor Vehicle License: $301,000
Public Utilities Sales: $258,000
Other: $123,000
Other License: $67,000
Other License: $59,000
Public Utility License: $6,000
Motor Vehicle License: $1,000
- Total Salaries and Wages: $12,453,000
: $10,092,000
Supplemental Security Income (SSI) in 2006:
- Total number of recipients: 280
- Number of aged recipients: 44
- Number of blind and disabled recipients: 236
- Number of recipients under 18: 51
- Number of recipients between 18 and 64: 163
- Number of recipients older than 64: 66
- Number of recipients also receiving OASDI: 109
- Amount of payments (thousands of dollars): 120
| Most common first names in Essex County, VA among deceased individuals | ||
| Name | Count | Lived (average) |
|---|---|---|
| William | 81 | 70.5 years |
| James | 74 | 72.6 years |
| Mary | 68 | 78.9 years |
| John | 65 | 74.9 years |
| Robert | 54 | 72.8 years |
| George | 36 | 73.0 years |
| Charles | 32 | 74.7 years |
| Margaret | 28 | 78.8 years |
| Louise | 27 | 79.6 years |
| Virginia | 23 | 83.2 years |
| Most common last names in Essex County, VA among deceased individuals | ||
| Last name | Count | Lived (average) |
|---|---|---|
| Taylor | 48 | 77.4 years |
| Davis | 41 | 73.9 years |
| Johnson | 38 | 75.7 years |
| Brooks | 36 | 76.8 years |
| Smith | 29 | 75.5 years |
| Bareford | 25 | 80.1 years |
| Jones | 25 | 78.1 years |
| Bundy | 23 | 68.4 years |
| Schools | 20 | 73.7 years |
| Lewis | 16 | 83.0 years |
| Businesses in Essex County, VA | ||||
| Name | Count | Name | Count | |
|---|---|---|---|---|
| 7-Eleven | 1 | McDonald's | 1 | |
| Advance Auto Parts | 1 | Nike | 5 | |
| Applebee's | 1 | Pizza Hut | 1 | |
| AutoZone | 1 | Rite Aid | 1 | |
| Chevrolet | 1 | Sears | 1 | |
| Curves | 1 | Subway | 1 | |
| Domino's Pizza | 1 | Super 8 | 1 | |
| FedEx | 1 | Taco Bell | 1 | |
| H&R Block | 1 | U-Haul | 1 | |
| Holiday Inn | 1 | UPS | 1 | |
| KFC | 1 | Walmart | 1 | |
| Lowe's | 1 | Wendy's | 1 | |
| MasterBrand Cabinets | 5 | |||