Fluvanna County, Virginia (VA)
County owner-occupied free and clear houses and condos in 2010: 2,083
County owner-occupied houses and condos in 2000: 6,300
Renter-occupied apartments: 1,437 (it was 1,087 in 2000)
| % of renters here: | 15% |
| State: | 33% |
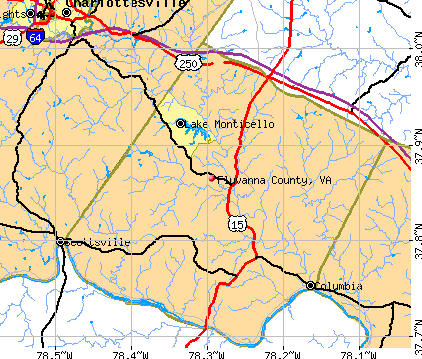
Land area: 287 sq. mi.
Water area: 2.8 sq. mi.
Population density: 96 people per square mile (average).
Industries providing employment: Educational, health and social services (33.5%), Retail trade (11.8%), Professional, scientific, management, administrative, and waste management services (11.6%).
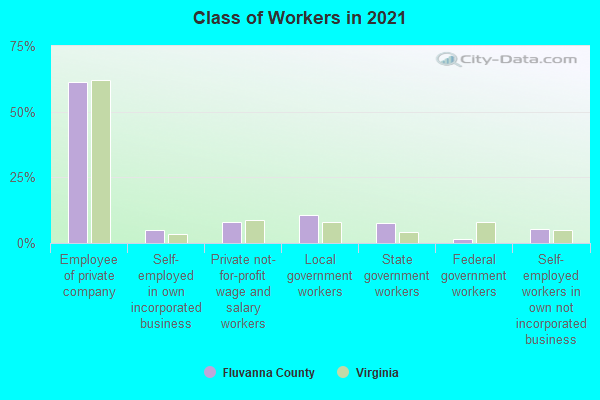
Type of workers:
- Private wage or salary: 74%
- Government: 21%
- Self-employed, not incorporated: 5%
- Unpaid family work: 0%
- OSM Map
- General Map
- Google Map
- MSN Map

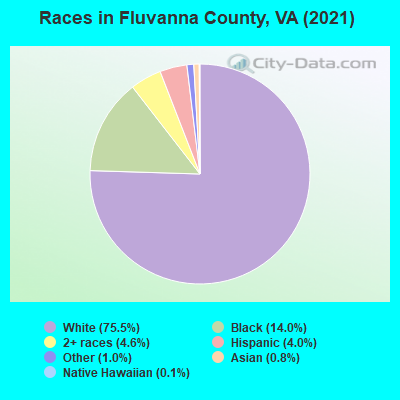
- 20,56774.7%White Non-Hispanic Alone
- 3,54312.9%Black Non-Hispanic Alone
- 1,6506.0%Two or more races
- 1,2014.4%Hispanic or Latino
- 2771.0%Some other race alone
- 2330.8%Asian alone
- 330.1%American Indian and Alaska Native alone
- 290.1%Native Hawaiian and Other
Pacific Islander alone
| Median resident age: | 43.4 years |
| Virginia median age: | 39.0 years |
| Males: 12,902 | |
| Females: 14,728 |

 | lake Monticello VA info needed please (10 replies) |
| Where to live? What about those great school scores? (18 replies) |
| Okay, just tell me where to live. (12 replies) |
| Are Charlottesville Property Values Stable? (4 replies) |
| Less expensive places to live near charlottesville (10 replies) |
| Halfway point to Richmond??? (5 replies) |
| Fluvanna County: | 2.0 people |
| Virginia: | 3 people |
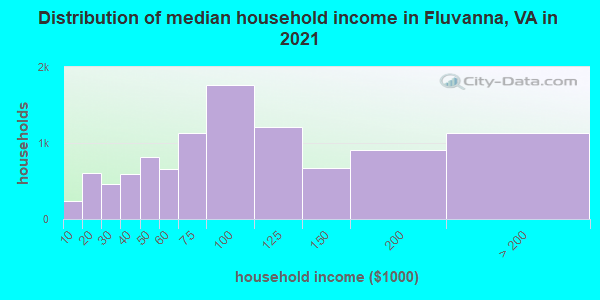
Estimated median household income in 2022: $89,334 ($46,372 in 1999)
| This county: | $89,334 |
| Virginia: | $85,873 |
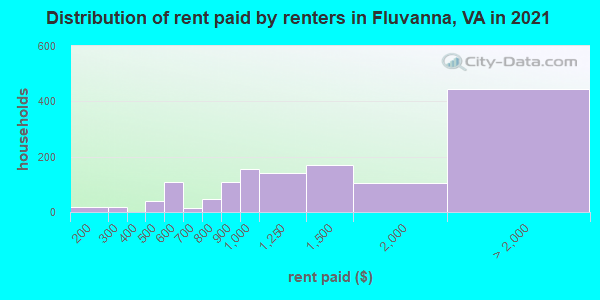
Median contract rent in 2022 for apartments: $1,114 (lower quartile is $780, upper quartile is $1,434)
| This county: | $1114 |
| State: | $1270 |
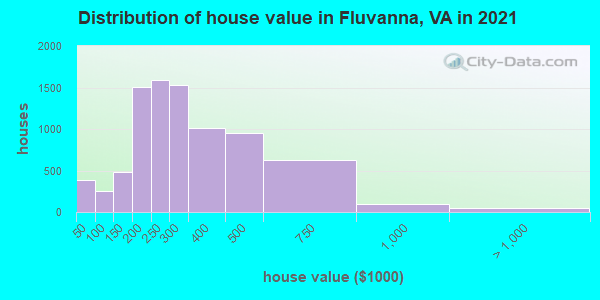
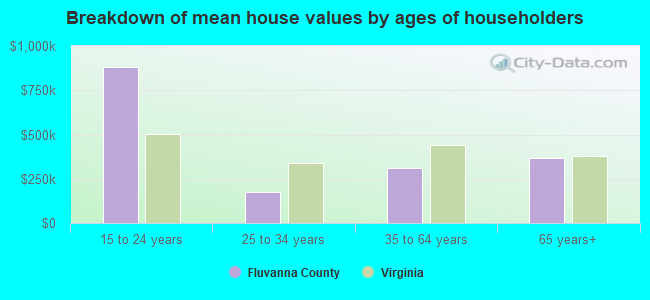
Estimated median house or condo value in 2022: $291,548 (it was $113,200 in 2000)
| Fluvanna: | $291,548 |
| Virginia: | $365,700 |
Mean price in 2022:
Median monthly housing costs for homes and condos with a mortgage: $1,584Detached houses: $376,505
Here: $376,505 State: $472,865 Townhouses or other attached units: $288,686
Here: $288,686 State: $457,437 In 2-unit structures: $346,272
Here: $346,272 State: $396,289 In 5-or-more-unit structures: $395,921
Here: $395,921 State: $382,551 Mobile homes: $162,489
Here: $162,489 State: $100,736
Median monthly housing costs for units without a mortgage: $556
Institutionalized population: 1,268
Crime in 2021 (reported by the sheriff's office or county police, not the county total):
- Murders: 0
- Rapes: 11
- Robberies: 1
- Assaults: 29
- Burglaries: 13
- Thefts: 102
- Auto thefts: 12
Crime in 2020 (reported by the sheriff's office or county police, not the county total):
- Murders: 0
- Rapes: 7
- Robberies: 2
- Assaults: 15
- Burglaries: 21
- Thefts: 73
- Auto thefts: 13
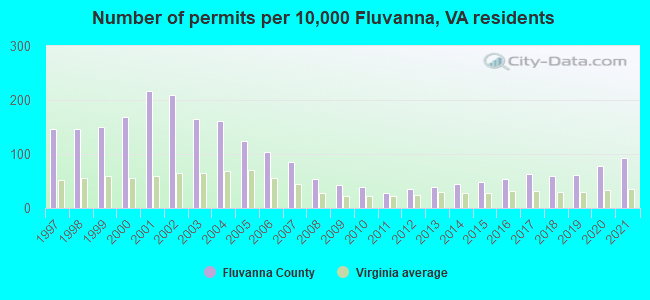
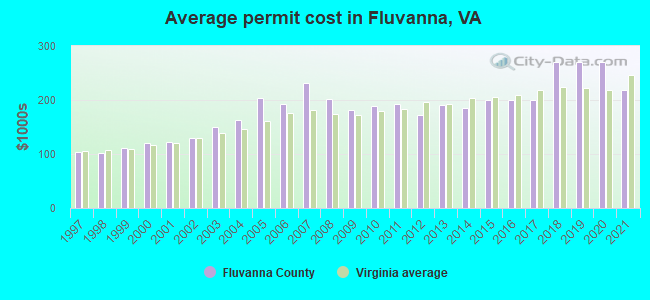
Single-family new house construction building permits:
- 2022: 169 buildings, average cost: $171,300
- 2021: 184 buildings, average cost: $217,500
- 2020: 155 buildings, average cost: $270,700
- 2019: 123 buildings, average cost: $270,700
- 2018: 121 buildings, average cost: $270,700
- 2017: 127 buildings, average cost: $200,400
- 2016: 109 buildings, average cost: $200,400
- 2015: 99 buildings, average cost: $200,400
- 2014: 88 buildings, average cost: $186,400
- 2013: 76 buildings, average cost: $189,600
- 2012: 73 buildings, average cost: $171,600
- 2011: 57 buildings, average cost: $191,600
- 2010: 79 buildings, average cost: $187,600
- 2009: 84 buildings, average cost: $181,300
- 2008: 106 buildings, average cost: $201,600
- 2007: 172 buildings, average cost: $230,900
- 2006: 206 buildings, average cost: $192,300
- 2005: 248 buildings, average cost: $202,700
- 2004: 323 buildings, average cost: $163,200
- 2003: 330 buildings, average cost: $149,700
- 2002: 420 buildings, average cost: $129,900
- 2001: 434 buildings, average cost: $123,200
- 2000: 336 buildings, average cost: $120,000
- 1999: 300 buildings, average cost: $112,400
- 1998: 293 buildings, average cost: $101,500
- 1997: 295 buildings, average cost: $103,400
Median real estate property taxes paid for housing units with mortgages in 2022: $1,597 (0.6%)
Median real estate property taxes paid for housing units with no mortgage in 2022: $2,368 (0.7%)
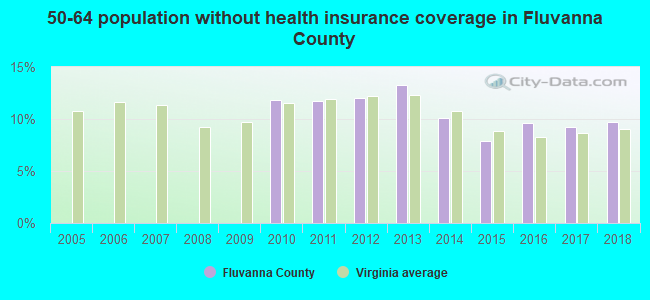
| Fluvanna County: | 6.4% |
| Virginia: | 10.6% |
Median age of residents in 2022: 43.4 years old
(Males: 42.7 years old, Females: 44.0 years old)
(Median age for: White residents: 46.7 years old, Black residents: 40.6 years old, American Indian residents: 40.7 years old, Asian residents: 38.4 years old, Hispanic or Latino residents: 30.3 years old, Other race residents: 35.9 years old)
Area name: Charlottesville, VA MSA
Fair market rent in 2006 for a 1-bedroom apartment in Fluvanna County is $643 a month.
Fair market rent for a 2-bedroom apartment is $761 a month.
Fair market rent for a 3-bedroom apartment is $986 a month.
Cities in this county include: Lake Monticello, Palmyra, Columbia.
Neighboring counties: Crawford County, Missouri  , Daviess County, Kentucky , San Francisco County, California , King and Queen County
  , Staunton city
  .
.
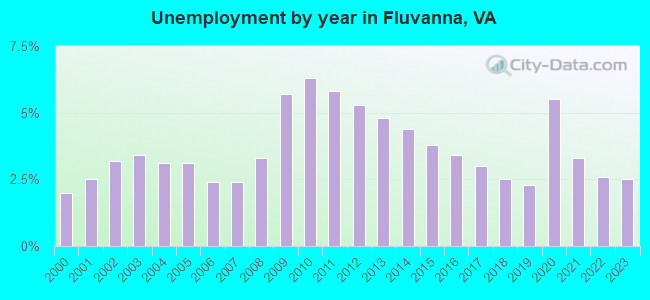
| Here: | 2.2% |
| Virginia: | 2.7% |
Current college students: 827
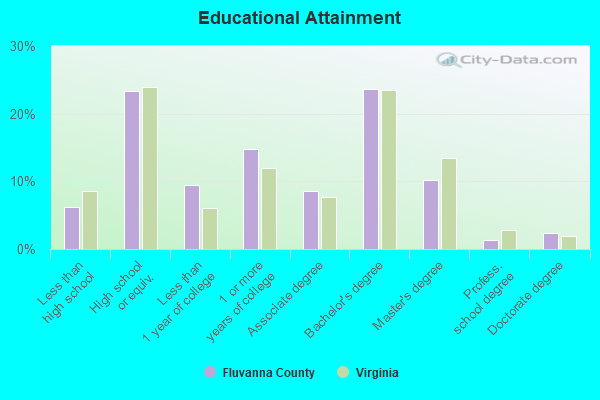
People 25 years of age or older with a high school degree or higher: 93.3%
People 25 years of age or older with a bachelor's degree or higher: 35.8%
Number of foreign born residents: 855 (83.4% naturalized citizens)
| Fluvanna County: | 3.1% |
| Whole state: | 12.7% |
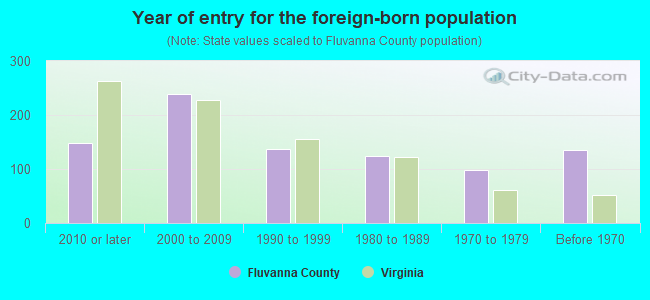
- Year of entry for the foreign-born population
- 1312010 or later
- 2342000 to 2009
- 1771990 to 1999
- 1241980 to 1989
- 981970 to 1979
- 136Before 1970
Mean travel time to work (commute): minutes
Percentage of county residents living and working in this county: 100.1%

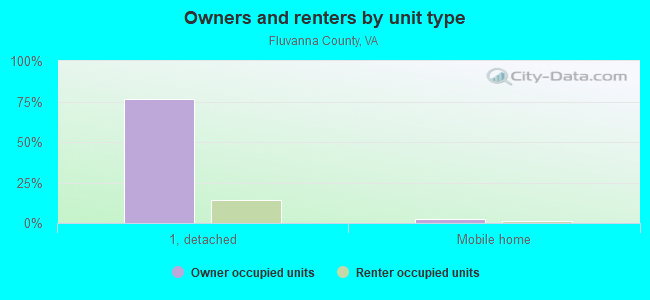
Housing units in structures:
- One, detached: 10,198
- One, attached: 248
- Two: 22
- 3 or 4: 7
- 5 to 9: 46
- 10 to 19: 200
- Mobile homes: 618
Housing units in Fluvanna County with a mortgage: 6,310 (625 second mortgage, 0 home equity loan, 446 both second mortgage and home equity loan)
Houses without a mortgage: 59
| Here: | 9.2% with mortgage |
| State: | 97.2% with mortgage |
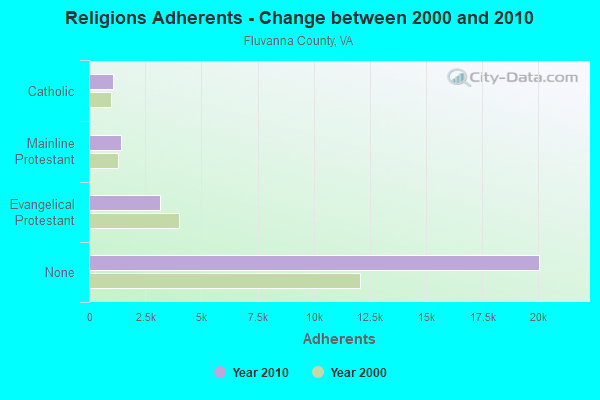
Religion statistics for Fluvanna County
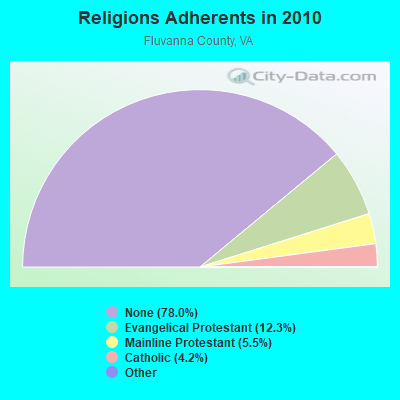
| Religion | Adherents | Congregations |
|---|---|---|
| Evangelical Protestant | 3,153 | 11 |
| Mainline Protestant | 1,412 | 12 |
| Catholic | 1,070 | 1 |
| Other | 7 | 1 |
| Orthodox | 3 | 1 |
| None | 20,046 | - |
Source: Clifford Grammich, Kirk Hadaway, Richard Houseal, Dale E.Jones, Alexei Krindatch, Richie Stanley and Richard H.Taylor. 2012. 2010 U.S.Religion Census: Religious Congregations & Membership Study. Association of Statisticians of American Religious Bodies. Jones, Dale E., et al. 2002. Congregations and Membership in the United States 2000. Nashville, TN: Glenmary Research Center.
Food Environment Statistics:
| Fluvanna County: | 1.98 / 10,000 pop. |
| State: | 2.03 / 10,000 pop. |
| Fluvanna County: | 2.77 / 10,000 pop. |
| Virginia: | 4.03 / 10,000 pop. |
| This county: | 4.36 / 10,000 pop. |
| State: | 7.65 / 10,000 pop. |
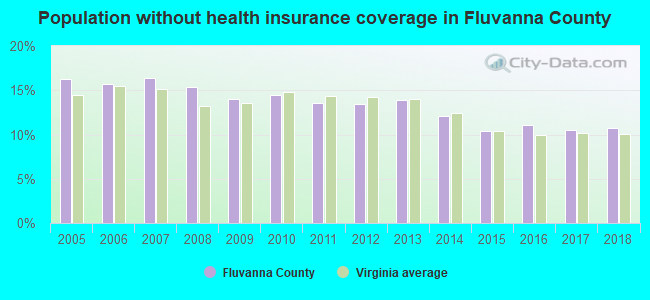
| Fluvanna County: | 10.3% |
| Virginia: | 9.3% |
| Fluvanna County: | 28.5% |
| State: | 26.7% |
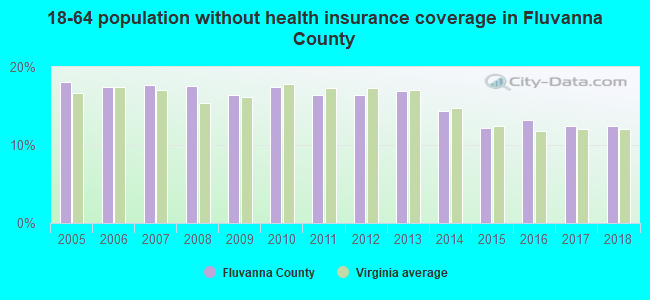
| Here: | 14.8% |
| State: | 18.6% |
Agriculture in Fluvanna County:
Average size of farms: 184 acresAverage value of agricultural products sold per farm: $12,606
Average value of crops sold per acre for harvested cropland: $66.86
The value of nursery, greenhouse, floriculture, and sod as a percentage of the total market value of agricultural products sold: 0.68%
The value of livestock, poultry, and their products as a percentage of the total market value of agricultural products sold: 78.29%
Average total farm production expenses per farm: $16,122
Harvested cropland as a percentage of land in farms: 22.21%
Irrigated harvested cropland as a percentage of land in farms: 0.42%
Average market value of all machinery and equipment per farm: $44,052
The percentage of farms operated by a family or individual: 95.12%
Average age of principal farm operators: 58 years
Average number of cattle and calves per 100 acres of all land in farms: 13.18
Milk cows as a percentage of all cattle and calves: 0.09%
Corn for grain: 1040 harvested acres
All wheat for grain: 445 harvested acres
Vegetables: 35 harvested acres
Land in orchards: 22 acres
Earthquake activity:
Fluvanna County-area historical earthquake activity is significantly above Virginia state average. It is 47% smaller than the overall U.S. average.On 8/23/2011 at 17:51:04, a magnitude 5.8 (5.8 MW, Depth: 3.7 mi, Class: Moderate, Intensity: VI - VII) earthquake occurred 19.8 miles away from Fluvanna County center
On 12/9/2003 at 20:59:18, a magnitude 4.5 (4.5 ML, Depth: 6.2 mi, Class: Light, Intensity: IV - V) earthquake occurred 12.3 miles away from the county center
On 8/25/2011 at 05:07:52, a magnitude 4.5 (4.5 ML, Depth: 4.2 mi) earthquake occurred 18.8 miles away from the county center
On 12/9/2003 at 20:59:14, a magnitude 4.5 (4.5 MB, 4.5 LG) earthquake occurred 28.8 miles away from the county center
On 8/9/2020 at 12:07:37, a magnitude 5.1 (5.1 MW, Depth: 4.7 mi) earthquake occurred 181.7 miles away from Fluvanna County center
On 8/24/2011 at 00:04:36, a magnitude 4.2 (4.2 ML) earthquake occurred 18.9 miles away from the county center
Magnitude types: regional Lg-wave magnitude (LG), body-wave magnitude (MB), local magnitude (ML), moment magnitude (MW)
Most recent natural disasters:
- Virginia Covid-19 Pandemic, Incident Period: January 20, 2020, Major Disaster (Presidential) Declared DR-4512-VA: April 2, 2020, FEMA Id: 4512, Natural disaster type: Other
- Virginia Tropical Storm Michael, Incident Period: October 9, 2018 - October 16, 2018, FEMA Id: 4411, Natural disaster type: Tropical Storm
- Virginia Hurricane Sandy, Incident Period: October 26, 2012 to November 01, 2012, Emergency Declared EM-3359: October 29, 2012, FEMA Id: 3359, Natural disaster type: Hurricane
- Virginia Severe Storms and Straight-line Winds, Incident Period: June 29, 2012 to July 01, 2012, Major Disaster (Presidential) Declared DR-4072: July 27, 2012, FEMA Id: 4072, Natural disaster type: Storm, Wind
- Virginia Earthquake, Incident Period: August 23, 2011 to October 25, 2011, Major Disaster (Presidential) Declared DR-4042: November 04, 2011, FEMA Id: 4042, Natural disaster type: Earthquake
- Virginia Severe Winter Storms and Snowstorms, Incident Period: February 05, 2010 to February 11, 2010, Major Disaster (Presidential) Declared DR-1905: April 27, 2010, FEMA Id: 1905, Natural disaster type: Snowstorm, Winter Storm
- Virginia Hurricane Katrina Evacuation, Incident Period: August 29, 2005 to October 01, 2005, Emergency Declared EM-3240: September 12, 2005, FEMA Id: 3240, Natural disaster type: Hurricane
- Virginia Hurricane Isabel, Incident Period: September 18, 2003 to October 01, 2003, Major Disaster (Presidential) Declared DR-1491: September 18, 2003, FEMA Id: 1491, Natural disaster type: Hurricane
- Virginia Winter Storm, Incident Period: January 25, 2000 to January 30, 2000, Major Disaster (Presidential) Declared DR-1318: February 28, 2000, FEMA Id: 1318, Natural disaster type: Winter Storm
- Virginia Hurricane Fran, Incident Period: September 05, 1996 to September 23, 1996, Major Disaster (Presidential) Declared DR-1135: September 06, 1996, FEMA Id: 1135, Natural disaster type: Hurricane
- 9 other natural disasters have been reported since 1953.
The number of natural disasters in Fluvanna County (19) is greater than the US average (15).
Major Disasters (Presidential) Declared: 14
Emergencies Declared: 4
Causes of natural disasters: Storms: 6, Floods: 4, Hurricanes: 4, Winter Storms: 4, Ice Storms: 2, Tropical Storms: 2, Blizzard: 1, Drought: 1, Earthquake: 1, Snowstorm: 1, Wind: 1, Other: 1 (Note: some incidents may be assigned to more than one category).
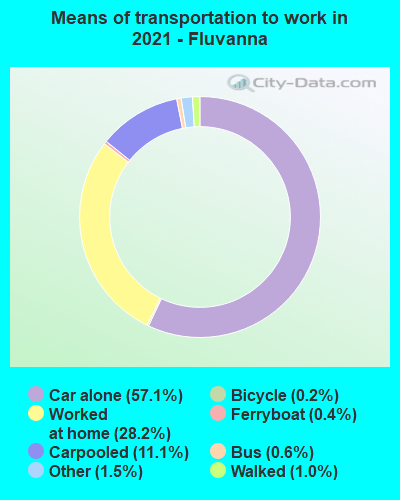
Means of transportation to work:
- Drove a car alone: 3,152 (54.4%)
- Carpooled: 657 (11.3%)
- Bus: 22 (0.4%)
- Ferryboat: 19 (0.3%)
- Taxicab, motorcycle, or other means: 131 (2.3%)
- Bicycle: 7 (0.1%)
- Walked: 60 (1.0%)
- Worked at home: 2,042 (35.2%)
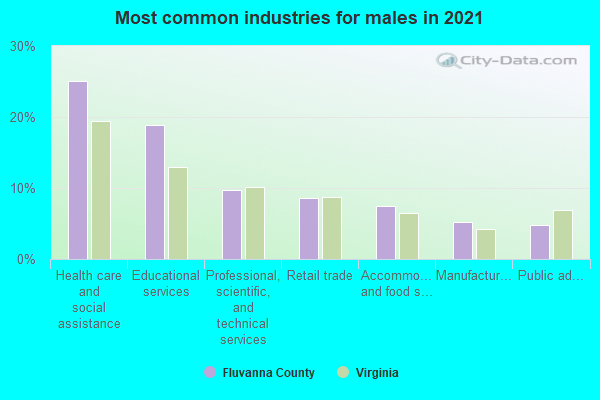
- Health care and social assistance (25%)
- Educational services (18%)
- Retail trade (10%)
- Professional, scientific, and technical services (9%)
- Accommodation and food services (5%)
- Public administration (5%)
- Other services, except public administration (4%)
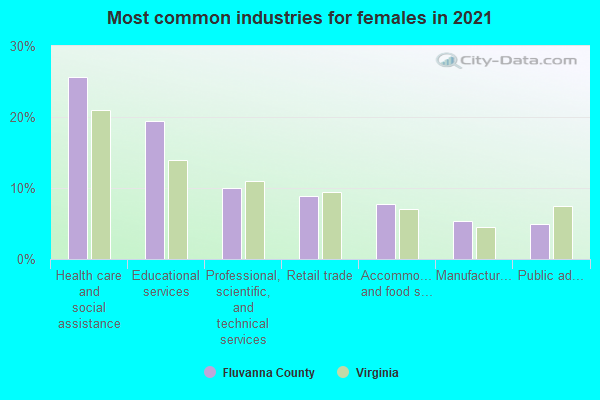
- Health care and social assistance (27%)
- Educational services (19%)
- Retail trade (11%)
- Professional, scientific, and technical services (9%)
- Accommodation and food services (6%)
- Public administration (5%)
- Other services, except public administration (5%)
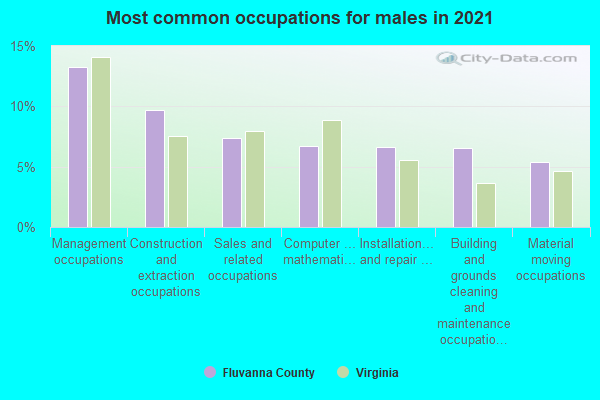
- Management occupations (12%)
- Construction and extraction occupations (12%)
- Sales and related occupations (7%)
- Building and grounds cleaning and maintenance occupations (7%)
- Installation, maintenance, and repair occupations (6%)
- Computer and mathematical occupations (6%)
- Production occupations (5%)
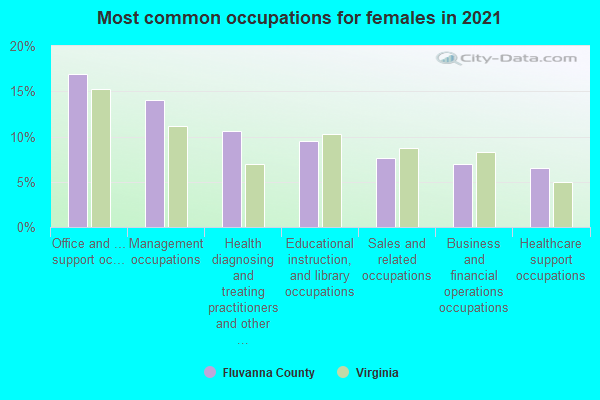
- Office and administrative support occupations (19%)
- Management occupations (12%)
- Health diagnosing and treating practitioners and other technical occupations (10%)
- Educational instruction, and library occupations (9%)
- Business and financial operations occupations (9%)
- Sales and related occupations (8%)
- Healthcare support occupations (6%)
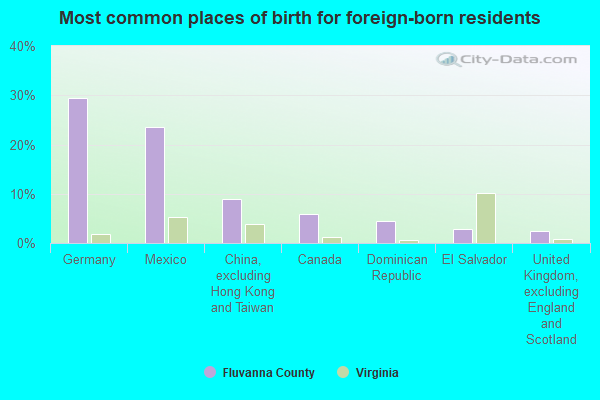
- Germany (19%)
- Mexico (17%)
- Dominican Republic (9%)
- China, excluding Hong Kong and Taiwan (8%)
- Korea (6%)
- Canada (5%)
- Other Eastern Europe (5%)
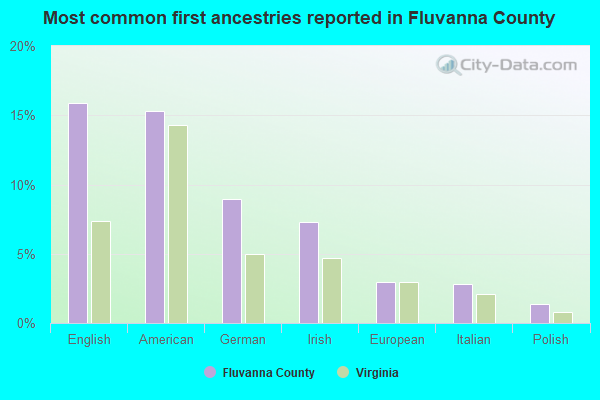
- American (14%)
- English (13%)
- Irish (9%)
- German (8%)
- European (3%)
- Italian (3%)
- Scottish (1%)
People in group quarters in Fluvanna County, Virginia in 2010:
- 1,218 people in state prisons
- 50 people in nursing facilities/skilled-nursing facilities
- 4 people in workers' group living quarters and job corps centers
People in group quarters in Fluvanna County, Virginia in 2000:
- 870 people in state prisons
- 59 people in nursing homes
- 2 people in homes for the physically handicapped
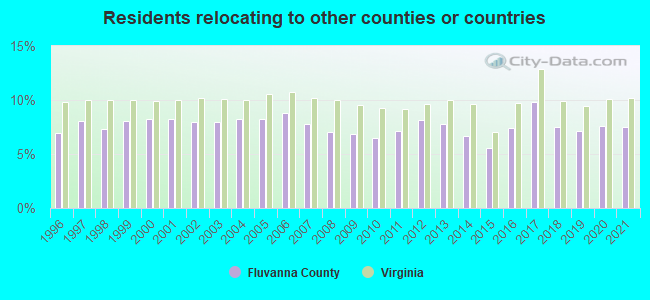
10.33% of this county's 2021 resident taxpayers lived in other counties in 2020 ($70,528 average adjusted gross income)
| Here: | 10.33% |
| Virginia average: | 10.16% |
10 or fewer of this county's residents moved from foreign countries.
7.58% relocated from other counties in Virginia ($47,991 average AGI)
2.75% relocated from other states ($22,536 average AGI)
Fluvanna County: 2.75% Virginia average: 3.91%

Top counties from which taxpayers relocated into this county between 2020 and 2021:
| from Albemarle County, VA | |
| from Charlottesville city, VA | |
| from Louisa County, VA | |
| from Fairfax County, VA | |
| from Henrico County, VA | |
| from Orange County, VA | |
| from Greene County, VA |
7.49% of this county's 2020 resident taxpayers moved to other counties in 2021 ($60,103 average adjusted gross income)
| Here: | 7.49% |
| Virginia average: | 10.20% |
10 or fewer of this county's residents moved to foreign countries.
5.63% relocated to other counties in Virginia ($43,634 average AGI)
1.86% relocated to other states ($16,469 average AGI)
Fluvanna County: 1.86% Virginia average: 3.98%
Top counties to which taxpayers relocated from this county between 2020 and 2021:
| to Albemarle County, VA | |
| to Louisa County, VA | |
| to Charlottesville city, VA | |
| to Buckingham County, VA | |
| to Richmond city, VA | |
| to Henrico County, VA |
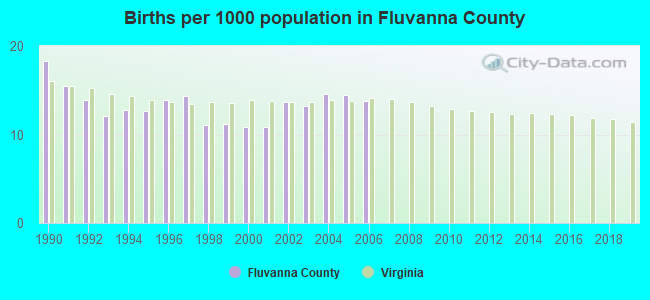
Births per 1000 population from 1990 to 1999: 13.6
Births per 1000 population from 2000 to 2006: 13.1
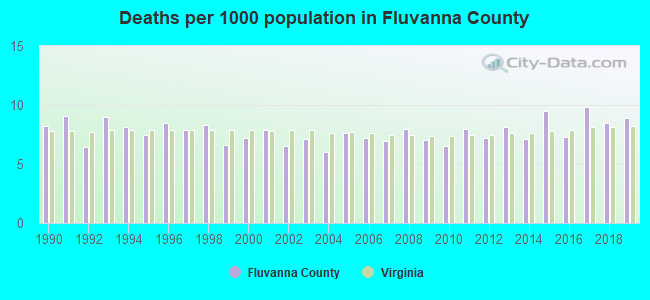
Deaths per 1000 population from 1990 to 1999: 8.0
Deaths per 1000 population from 2000 to 2009: 7.1
Deaths per 1000 population from 2010 to 2020: 8.2
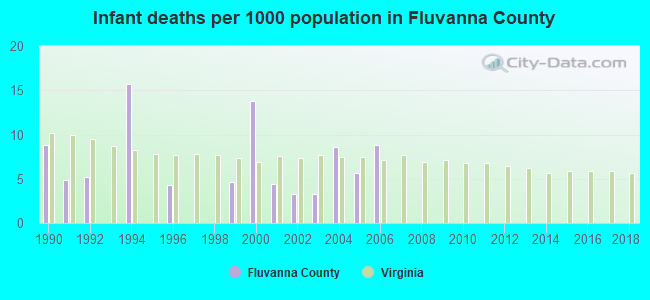
Infant deaths per 1000 live births from 1990 to 1999: 4.3
Infant deaths per 1000 live births from 2000 to 2006: 6.8
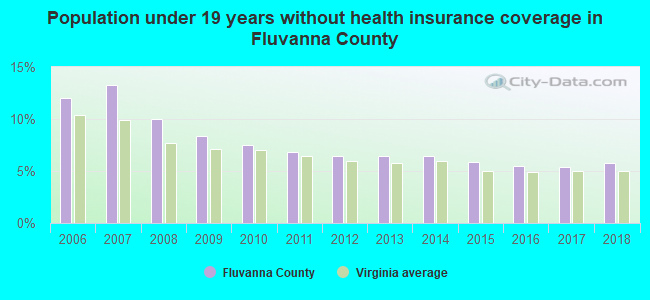
Persons under 19 years old without health insurance coverage in 2018: 5.8%
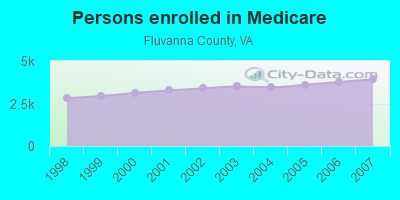
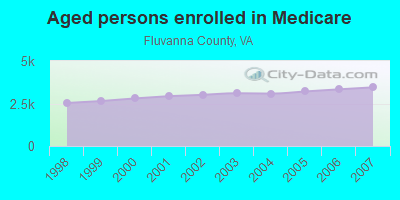
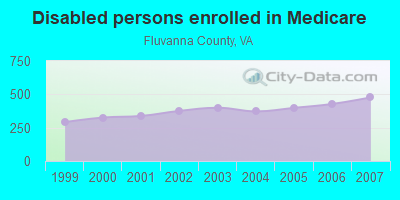
Persons enrolled in hospital insurance and/or supplemental medical insurance (Medicare) in July 1, 2007: 3,927 (3,450 aged, 477 disabled)
Children under 18 without health insurance coverage in 2007: 771 (13%)
Most common underlying causes of death in Fluvanna County, Virginia in 1999 - 2019:
- Bronchus or lung, unspecified - Malignant neoplasms (250)
- Atherosclerotic heart disease (119)
- Acute myocardial infarction, unspecified (104)
- Unspecified dementia (69)
- Chronic obstructive pulmonary disease, unspecified (33)
- Alzheimer disease, unspecified (29)
- Congestive heart failure (20)
- Pneumonia, unspecified (10)
- Septicaemia, unspecified (10)
- Stroke, not specified as haemorrhage or infarction (10)
Population without health insurance coverage in 2000: 9%
Children under 18 without health insurance coverage in 2000: 8%
Medical specialist MDs per 100,000 population in 2005: 485
Dentists per 100,000 population in 1998: 4
Total births per 100,000 population, July 2005 - July 2006 : 5
Total deaths per 100,000 population, July 2005 - July 2006: 20
Limited-service eating places per 100,000 population in 2005 : 16
Household type by relationship:
Households: 27,630- Male householders: 4,931 (1,104 living alone), Female householders: 5,549 (1,317 living alone)
6,030 spouses (6,005 opposite-sex spouses), 581 unmarried partners, (565 opposite-sex unmarried partners), 6,599 children (5,914 natural, 195 adopted, 477 stepchildren), 671 grandchildren, 240 brothers or sisters, 421 parents, 305 foster children, 563 other relatives, 414 non-relatives
- In group quarters: 1,267
Size of family households: 3,713 2-persons, 1,494 3-persons, 1,229 4-persons, 684 5-persons, 249 6-persons, 228 7-or-more-persons.
Size of nonfamily households: 2,421 1-person, 380 2-persons, 71 3-persons.
3,329 married couples with children.
885 single-parent households (293 men, 592 women).
94.7% of residents of Fluvanna speak English at home.
2.7% of residents speak Spanish at home (77% speak English very well, 18% speak English well, 6% speak English not well).
1.6% of residents speak other Indo-European language at home (84% speak English very well, 13% speak English well, 3% speak English not well).
0.8% of residents speak Asian or Pacific Island language at home (40% speak English very well, 44% speak English well, 16% speak English not well).
In fiscal year 2004:
Federal Government expenditure: $95,370,000 ($4,034 per capita)
Department of Defense expenditure: $8,557,000
Federal direct payments to individuals for retirement and disability: $63,319,000
Federal other direct payments to individuals: $16,981,000
Federal direct payments not to individuals: $217,000
Federal grants: $11,470,000
Federal procurement contracts: $750,000 ($19,000 Department of Defense)
Federal salaries and wages: $2,633,000 ($0,000 Department of Defense)
Federal Government direct loans: $752,000
Federal guaranteed/insured loans: $23,596,000
Federal Government insurance: $3,801,000
Population change from April 1, 2000 to July 1, 2005:
Births: 1,490| Here: | 60 per 1000 residents |
| State: | 70 per 1000 residents |
Deaths: 821
| Here: | 33 per 1000 residents |
| State: | 40 per 1000 residents |
Net international migration: +33
| Here: | +1 per 1000 residents |
| State: | +18 per 1000 residents |
Net internal migration: +4,036
| Here: | +163 per 1000 residents |
| State: | +14 per 1000 residents |
Total withdrawal of fresh water for public supply: 0.67 millions of gallons per day (30% from ground, 70% from surface)
| Here: | 6.5 |
| State: | 7.0 |
| Here: | 4.9 |
| State: | 4.3 |
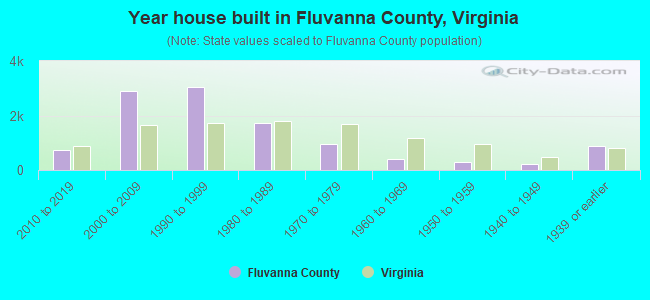
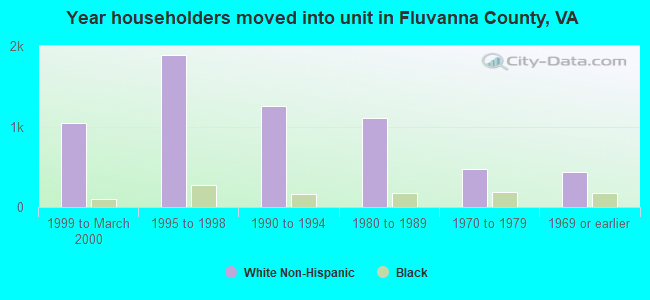
- Year house built in Fluvanna County, Virginia
- 612020 or later
- 8862010 to 2019
- 2,8532000 to 2009
- 3,1001990 to 1999
- 1,7261980 to 1989
- 8571970 to 1979
- 4511960 to 1969
- 3281950 to 1959
- 2261940 to 1949
- 7631939 or earlier
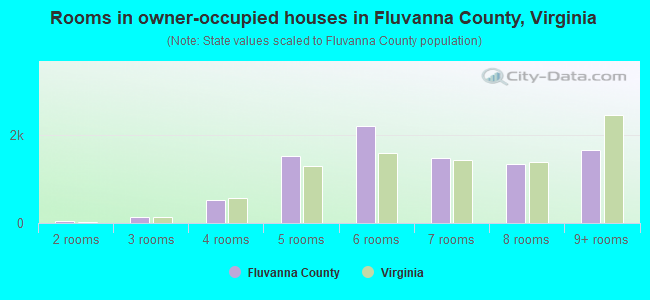
- Rooms in owner-occupied houses in Fluvanna County, Virginia
- 01 room
- 542 rooms
- 1213 rooms
- 5594 rooms
- 1,7065 rooms
- 2,1706 rooms
- 1,3397 rooms
- 1,5568 rooms
- 1,8049+ rooms
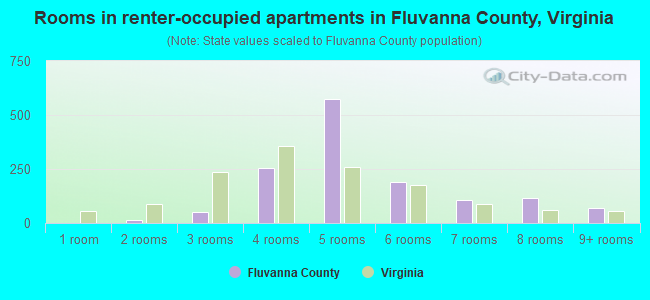
- Rooms in renter-occupied apartments in Fluvanna County, Virginia
- 01 room
- 122 rooms
- 143 rooms
- 2894 rooms
- 5295 rooms
- 1476 rooms
- 477 rooms
- 1018 rooms
- 229+ rooms
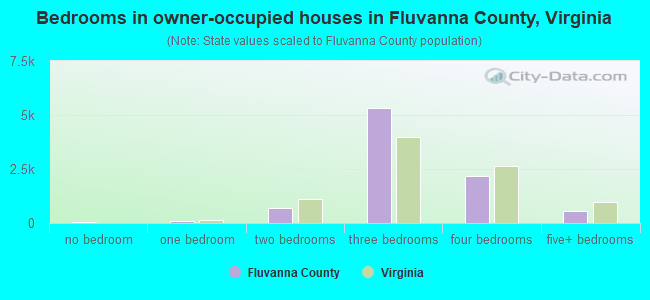
- Bedrooms in owner-occupied houses in Fluvanna County, Virginia
- 74no bedroom
- 1461 bedroom
- 6312 bedrooms
- 5,5763 bedrooms
- 2,2324 bedrooms
- 7015+ bedrooms
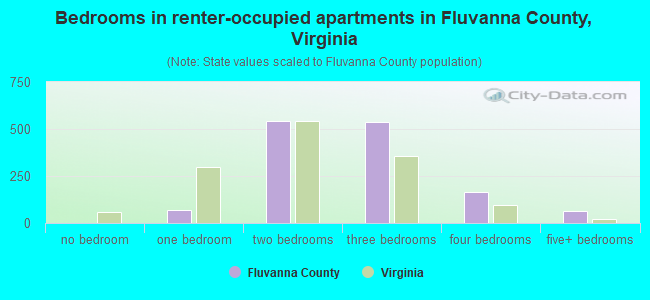
- Bedrooms in renter-occupied apartments in Fluvanna County, Virginia
- 0no bedroom
- 541 bedroom
- 5132 bedrooms
- 4733 bedrooms
- 1274 bedrooms
- 85+ bedrooms
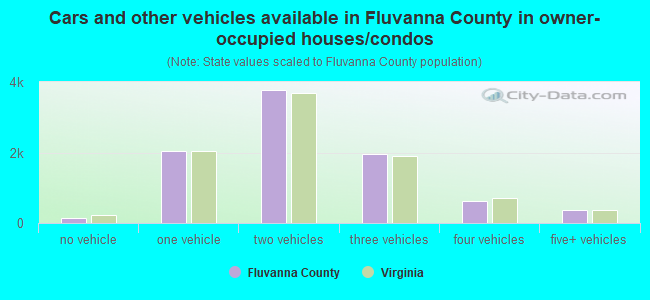
- Cars and other vehicles available in Fluvanna County in owner-occupied houses/condos
- 206no vehicle
- 2,0071 vehicle
- 4,1332 vehicles
- 1,9253 vehicles
- 6684 vehicles
- 3975+ vehicles
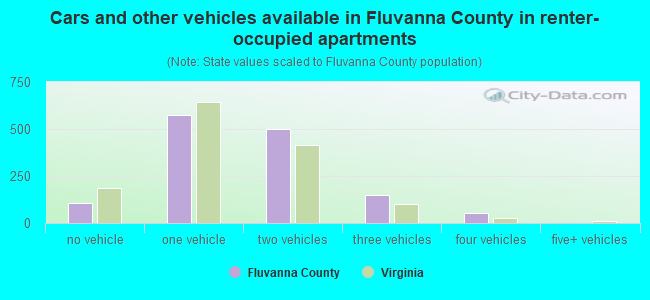
- Cars and other vehicles available in Fluvanna County in renter-occupied apartments
- 86no vehicle
- 4531 vehicle
- 4582 vehicles
- 1193 vehicles
- 634 vehicles
- 05+ vehicles
89.8% of Fluvanna County residents lived in the same house 1 years ago.
Out of people who lived in different houses, 6% lived in this county.
Out of people who lived in different counties, 78% lived in Virginia.
| Fluvanna County: | 89.8% |
| State average: | 86.6% |
Place of birth for U.S.-born residents:
- This state: 15,066
- Other state: 11,253
- Northeast: 4,934
- Midwest: 1,796
- South: 3,055
- West: 1,479
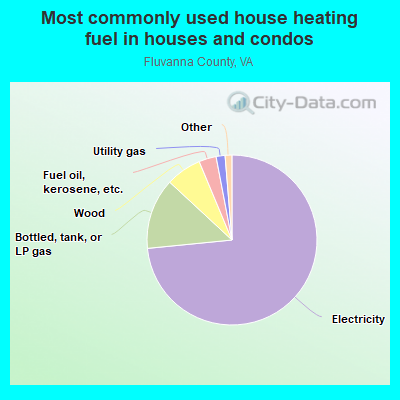
- 76.2%Electricity
- 11.4%Bottled, tank, or LP gas
- 6.6%Wood
- 3.8%Fuel oil, kerosene, etc.
- 1.0%Utility gas
- 0.5%Other fuel
- 0.3%Solar energy
- 0.3%No fuel used
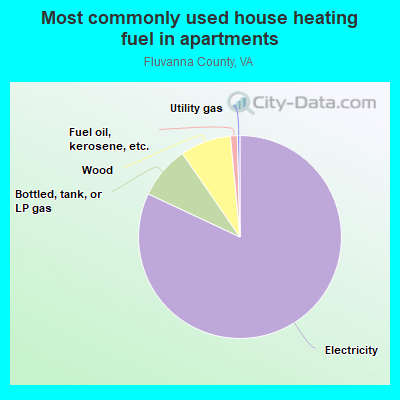
- 80.4%Electricity
- 8.7%Bottled, tank, or LP gas
- 8.2%Wood
- 2.2%Fuel oil, kerosene, etc.
- 0.5%Utility gas
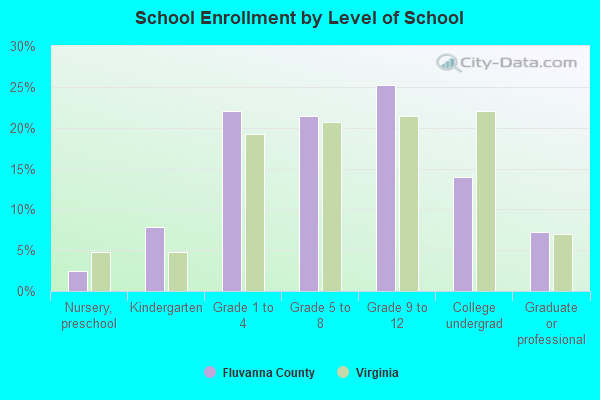
Private vs. public school enrollment:
| Here: | 26.4% |
| Virginia: | 13.2% |
| Here: | 7.3% |
| Virginia: | 10.2% |
| Here: | 18.9% |
| Virginia: | 18.7% |
Fluvanna County government finances - Expenditure in 2020:
- Bond Funds - Cash and Securities: $8,619,000
- Charges - Elementary and Secondary Education School Lunch: $757,000
Other: $572,000
Solid Waste Management: $121,000
Parks and Recreation: $107,000
Solid Waste Management: $82,000
Parks and Recreation: $76,000
Sewerage: $42,000
Elementary and Secondary Education School Tuition and Transportation: $42,000
Elementary and Secondary Education - Other: $14,000
Elementary and Secondary Education - Other: $13,000
Elementary and Secondary Education School Tuition and Transportation: $11,000
- Construction - General Public Buildings: $1,225,000
- Current Operations - Elementary and Secondary Education: $39,832,000
Elementary and Secondary Education: $38,448,000
Public Welfare - Other: $5,784,000
Public Welfare - Other: $5,211,000
Police Protection: $3,556,000
Police Protection: $2,708,000
General Public Buildings: $1,645,000
Local Fire Protection: $1,623,000
Central Staff Services: $1,619,000
General - Other: $1,493,000
Financial Administration: $1,420,000
Correctional Institutions: $1,396,000
Financial Administration: $1,216,000
Judicial and Legal Services: $1,181,000
Judicial and Legal Services: $1,141,000
Local Fire Protection: $1,055,000
Central Staff Services: $1,005,000
Health - Other: $924,000
General Public Buildings: $774,000
Parks and Recreation: $477,000
Parks and Recreation: $461,000
Libraries: $441,000
Libraries: $363,000
Water Utilities: $340,000
Solid Waste Management: $310,000
Sewerage: $303,000
Protective Inspection and Regulation - Other: $287,000
Health - Other: $278,000
Solid Waste Management: $198,000
Protective Inspection and Regulation - Other: $187,000
General - Other: $26,000
Housing and Community Development: $7,000
- Federal Intergovernmental - Public Welfare: $1,090,000
Education: $204,000
Education: $145,000
Other: $38,000
Housing and Community Development: $22,000
- General - Interest on Debt: $3,058,000
- Intergovernmental to Local - Other - Correctional Institutions: $1,243,000
Other - Elementary and Secondary Education: $994,000
Other - Elementary and Secondary Education: $905,000
- Local Intergovernmental - Education: $1,955,000
Education: $1,738,000
- Long Term Debt - Beginning Outstanding - Unspecified Public Purpose: $97,731,000
Outstanding Unspecified Public Purpose: $93,987,000
Outstanding Unspecified Public Purpose: $91,373,000
Beginning Outstanding - Unspecified Public Purpose: $90,638,000
Issue, Unspecified Public Purpose: $7,654,000
Retired Unspecified Public Purpose: $6,358,000
Retired Unspecified Public Purpose: $4,305,000
Beginning Outstanding - Public Debt for Private Purpose: $1,154,000
Outstanding Nonguaranteed - Industrial Revenue: $1,055,000
Retired Nonguaranteed - Public Debt for Private Purpose: $98,000
- Miscellaneous - General Revenue - Other: $588,000
Interest Earnings: $142,000
General Revenue - Other: $114,000
Rents: $80,000
Fines and Forfeits: $52,000
Rents: $51,000
Interest Earnings: $40,000
Donations From Private Sources: $2,000
- Other Capital Outlay - Police Protection: $2,232,000
Elementary and Secondary Education: $579,000
Elementary and Secondary Education: $295,000
Central Staff Services: $105,000
Parks and Recreation: $17,000
- Other Funds - Cash and Securities: $25,405,000
Cash and Securities: $20,663,000
- Revenue - Water Utilities: $366,000
- Sinking Funds - Cash and Securities: $1,115,000
- State Intergovernmental - Education: $23,230,000
Education: $21,778,000
General Local Government Support: $3,925,000
Public Welfare: $2,407,000
Other: $2,379,000
Other: $2,159,000
Public Welfare: $1,493,000
- Tax - Property: $40,500,000
Property: $33,035,000
General Sales and Gross Receipts: $2,209,000
General Sales and Gross Receipts: $1,697,000
Public Utilities Sales: $1,126,000
Motor Vehicle License: $895,000
Motor Vehicle License: $734,000
Public Utilities Sales: $573,000
Other: $433,000
Other: $430,000
Other License: $326,000
Motor Fuels Sales: $40,000
Death and Gift: $5,000
- Total Salaries and Wages: $25,074,000
: $24,157,000
- Water Utilities - Interest on Debt: $322,000
Interest on Debt: $21,000
Fluvanna County government finances - Revenue in 2020:
- Bond Funds - Cash and Securities: $8,619,000
- Charges - Elementary and Secondary Education School Lunch: $757,000
Other: $572,000
Solid Waste Management: $121,000
Parks and Recreation: $107,000
Solid Waste Management: $82,000
Parks and Recreation: $76,000
Sewerage: $42,000
Elementary and Secondary Education School Tuition and Transportation: $42,000
Elementary and Secondary Education - Other: $14,000
Elementary and Secondary Education - Other: $13,000
Elementary and Secondary Education School Tuition and Transportation: $11,000
- Construction - General Public Buildings: $1,225,000
- Current Operations - Elementary and Secondary Education: $39,832,000
Elementary and Secondary Education: $38,448,000
Public Welfare - Other: $5,784,000
Public Welfare - Other: $5,211,000
Police Protection: $3,556,000
Police Protection: $2,708,000
General Public Buildings: $1,645,000
Local Fire Protection: $1,623,000
Central Staff Services: $1,619,000
General - Other: $1,493,000
Financial Administration: $1,420,000
Correctional Institutions: $1,396,000
Financial Administration: $1,216,000
Judicial and Legal Services: $1,181,000
Judicial and Legal Services: $1,141,000
Local Fire Protection: $1,055,000
Central Staff Services: $1,005,000
Health - Other: $924,000
General Public Buildings: $774,000
Parks and Recreation: $477,000
Parks and Recreation: $461,000
Libraries: $441,000
Libraries: $363,000
Water Utilities: $340,000
Solid Waste Management: $310,000
Sewerage: $303,000
Protective Inspection and Regulation - Other: $287,000
Health - Other: $278,000
Solid Waste Management: $198,000
Protective Inspection and Regulation - Other: $187,000
General - Other: $26,000
Housing and Community Development: $7,000
- Federal Intergovernmental - Public Welfare: $1,090,000
Education: $204,000
Education: $145,000
Other: $38,000
Housing and Community Development: $22,000
- General - Interest on Debt: $3,058,000
- Intergovernmental to Local - Other - Correctional Institutions: $1,243,000
Other - Elementary and Secondary Education: $994,000
Other - Elementary and Secondary Education: $905,000
- Local Intergovernmental - Education: $1,955,000
Education: $1,738,000
- Long Term Debt - Beginning Outstanding - Unspecified Public Purpose: $97,731,000
Outstanding Unspecified Public Purpose: $93,987,000
Outstanding Unspecified Public Purpose: $91,373,000
Beginning Outstanding - Unspecified Public Purpose: $90,638,000
Issue, Unspecified Public Purpose: $7,654,000
Retired Unspecified Public Purpose: $6,358,000
Retired Unspecified Public Purpose: $4,305,000
Beginning Outstanding - Public Debt for Private Purpose: $1,154,000
Outstanding Nonguaranteed - Industrial Revenue: $1,055,000
Retired Nonguaranteed - Public Debt for Private Purpose: $98,000
- Miscellaneous - General Revenue - Other: $588,000
Interest Earnings: $142,000
General Revenue - Other: $114,000
Rents: $80,000
Fines and Forfeits: $52,000
Rents: $51,000
Interest Earnings: $40,000
Donations From Private Sources: $2,000
- Other Capital Outlay - Police Protection: $2,232,000
Elementary and Secondary Education: $579,000
Elementary and Secondary Education: $295,000
Central Staff Services: $105,000
Parks and Recreation: $17,000
- Other Funds - Cash and Securities: $25,405,000
Cash and Securities: $20,663,000
- Revenue - Water Utilities: $366,000
- Sinking Funds - Cash and Securities: $1,115,000
- State Intergovernmental - Education: $23,230,000
Education: $21,778,000
General Local Government Support: $3,925,000
Public Welfare: $2,407,000
Other: $2,379,000
Other: $2,159,000
Public Welfare: $1,493,000
- Tax - Property: $40,500,000
Property: $33,035,000
General Sales and Gross Receipts: $2,209,000
General Sales and Gross Receipts: $1,697,000
Public Utilities Sales: $1,126,000
Motor Vehicle License: $895,000
Motor Vehicle License: $734,000
Public Utilities Sales: $573,000
Other: $433,000
Other: $430,000
Other License: $326,000
Motor Fuels Sales: $40,000
Death and Gift: $5,000
- Total Salaries and Wages: $25,074,000
: $24,157,000
- Water Utilities - Interest on Debt: $322,000
Interest on Debt: $21,000
Fluvanna County government finances - Debt in 2020:
- Bond Funds - Cash and Securities: $8,619,000
- Charges - Elementary and Secondary Education School Lunch: $757,000
Other: $572,000
Solid Waste Management: $121,000
Parks and Recreation: $107,000
Solid Waste Management: $82,000
Parks and Recreation: $76,000
Sewerage: $42,000
Elementary and Secondary Education School Tuition and Transportation: $42,000
Elementary and Secondary Education - Other: $14,000
Elementary and Secondary Education - Other: $13,000
Elementary and Secondary Education School Tuition and Transportation: $11,000
- Construction - General Public Buildings: $1,225,000
- Current Operations - Elementary and Secondary Education: $39,832,000
Elementary and Secondary Education: $38,448,000
Public Welfare - Other: $5,784,000
Public Welfare - Other: $5,211,000
Police Protection: $3,556,000
Police Protection: $2,708,000
General Public Buildings: $1,645,000
Local Fire Protection: $1,623,000
Central Staff Services: $1,619,000
General - Other: $1,493,000
Financial Administration: $1,420,000
Correctional Institutions: $1,396,000
Financial Administration: $1,216,000
Judicial and Legal Services: $1,181,000
Judicial and Legal Services: $1,141,000
Local Fire Protection: $1,055,000
Central Staff Services: $1,005,000
Health - Other: $924,000
General Public Buildings: $774,000
Parks and Recreation: $477,000
Parks and Recreation: $461,000
Libraries: $441,000
Libraries: $363,000
Water Utilities: $340,000
Solid Waste Management: $310,000
Sewerage: $303,000
Protective Inspection and Regulation - Other: $287,000
Health - Other: $278,000
Solid Waste Management: $198,000
Protective Inspection and Regulation - Other: $187,000
General - Other: $26,000
Housing and Community Development: $7,000
- Federal Intergovernmental - Public Welfare: $1,090,000
Education: $204,000
Education: $145,000
Other: $38,000
Housing and Community Development: $22,000
- General - Interest on Debt: $3,058,000
- Intergovernmental to Local - Other - Correctional Institutions: $1,243,000
Other - Elementary and Secondary Education: $994,000
Other - Elementary and Secondary Education: $905,000
- Local Intergovernmental - Education: $1,955,000
Education: $1,738,000
- Long Term Debt - Beginning Outstanding - Unspecified Public Purpose: $97,731,000
Outstanding Unspecified Public Purpose: $93,987,000
Outstanding Unspecified Public Purpose: $91,373,000
Beginning Outstanding - Unspecified Public Purpose: $90,638,000
Issue, Unspecified Public Purpose: $7,654,000
Retired Unspecified Public Purpose: $6,358,000
Retired Unspecified Public Purpose: $4,305,000
Beginning Outstanding - Public Debt for Private Purpose: $1,154,000
Outstanding Nonguaranteed - Industrial Revenue: $1,055,000
Retired Nonguaranteed - Public Debt for Private Purpose: $98,000
- Miscellaneous - General Revenue - Other: $588,000
Interest Earnings: $142,000
General Revenue - Other: $114,000
Rents: $80,000
Fines and Forfeits: $52,000
Rents: $51,000
Interest Earnings: $40,000
Donations From Private Sources: $2,000
- Other Capital Outlay - Police Protection: $2,232,000
Elementary and Secondary Education: $579,000
Elementary and Secondary Education: $295,000
Central Staff Services: $105,000
Parks and Recreation: $17,000
- Other Funds - Cash and Securities: $25,405,000
Cash and Securities: $20,663,000
- Revenue - Water Utilities: $366,000
- Sinking Funds - Cash and Securities: $1,115,000
- State Intergovernmental - Education: $23,230,000
Education: $21,778,000
General Local Government Support: $3,925,000
Public Welfare: $2,407,000
Other: $2,379,000
Other: $2,159,000
Public Welfare: $1,493,000
- Tax - Property: $40,500,000
Property: $33,035,000
General Sales and Gross Receipts: $2,209,000
General Sales and Gross Receipts: $1,697,000
Public Utilities Sales: $1,126,000
Motor Vehicle License: $895,000
Motor Vehicle License: $734,000
Public Utilities Sales: $573,000
Other: $433,000
Other: $430,000
Other License: $326,000
Motor Fuels Sales: $40,000
Death and Gift: $5,000
- Total Salaries and Wages: $25,074,000
: $24,157,000
- Water Utilities - Interest on Debt: $322,000
Interest on Debt: $21,000
Fluvanna County government finances - Cash and Securities in 2020:
- Bond Funds - Cash and Securities: $8,619,000
- Charges - Elementary and Secondary Education School Lunch: $757,000
Other: $572,000
Solid Waste Management: $121,000
Parks and Recreation: $107,000
Solid Waste Management: $82,000
Parks and Recreation: $76,000
Sewerage: $42,000
Elementary and Secondary Education School Tuition and Transportation: $42,000
Elementary and Secondary Education - Other: $14,000
Elementary and Secondary Education - Other: $13,000
Elementary and Secondary Education School Tuition and Transportation: $11,000
- Construction - General Public Buildings: $1,225,000
- Current Operations - Elementary and Secondary Education: $39,832,000
Elementary and Secondary Education: $38,448,000
Public Welfare - Other: $5,784,000
Public Welfare - Other: $5,211,000
Police Protection: $3,556,000
Police Protection: $2,708,000
General Public Buildings: $1,645,000
Local Fire Protection: $1,623,000
Central Staff Services: $1,619,000
General - Other: $1,493,000
Financial Administration: $1,420,000
Correctional Institutions: $1,396,000
Financial Administration: $1,216,000
Judicial and Legal Services: $1,181,000
Judicial and Legal Services: $1,141,000
Local Fire Protection: $1,055,000
Central Staff Services: $1,005,000
Health - Other: $924,000
General Public Buildings: $774,000
Parks and Recreation: $477,000
Parks and Recreation: $461,000
Libraries: $441,000
Libraries: $363,000
Water Utilities: $340,000
Solid Waste Management: $310,000
Sewerage: $303,000
Protective Inspection and Regulation - Other: $287,000
Health - Other: $278,000
Solid Waste Management: $198,000
Protective Inspection and Regulation - Other: $187,000
General - Other: $26,000
Housing and Community Development: $7,000
- Federal Intergovernmental - Public Welfare: $1,090,000
Education: $204,000
Education: $145,000
Other: $38,000
Housing and Community Development: $22,000
- General - Interest on Debt: $3,058,000
- Intergovernmental to Local - Other - Correctional Institutions: $1,243,000
Other - Elementary and Secondary Education: $994,000
Other - Elementary and Secondary Education: $905,000
- Local Intergovernmental - Education: $1,955,000
Education: $1,738,000
- Long Term Debt - Beginning Outstanding - Unspecified Public Purpose: $97,731,000
Outstanding Unspecified Public Purpose: $93,987,000
Outstanding Unspecified Public Purpose: $91,373,000
Beginning Outstanding - Unspecified Public Purpose: $90,638,000
Issue, Unspecified Public Purpose: $7,654,000
Retired Unspecified Public Purpose: $6,358,000
Retired Unspecified Public Purpose: $4,305,000
Beginning Outstanding - Public Debt for Private Purpose: $1,154,000
Outstanding Nonguaranteed - Industrial Revenue: $1,055,000
Retired Nonguaranteed - Public Debt for Private Purpose: $98,000
- Miscellaneous - General Revenue - Other: $588,000
Interest Earnings: $142,000
General Revenue - Other: $114,000
Rents: $80,000
Fines and Forfeits: $52,000
Rents: $51,000
Interest Earnings: $40,000
Donations From Private Sources: $2,000
- Other Capital Outlay - Police Protection: $2,232,000
Elementary and Secondary Education: $579,000
Elementary and Secondary Education: $295,000
Central Staff Services: $105,000
Parks and Recreation: $17,000
- Other Funds - Cash and Securities: $25,405,000
Cash and Securities: $20,663,000
- Revenue - Water Utilities: $366,000
- Sinking Funds - Cash and Securities: $1,115,000
- State Intergovernmental - Education: $23,230,000
Education: $21,778,000
General Local Government Support: $3,925,000
Public Welfare: $2,407,000
Other: $2,379,000
Other: $2,159,000
Public Welfare: $1,493,000
- Tax - Property: $40,500,000
Property: $33,035,000
General Sales and Gross Receipts: $2,209,000
General Sales and Gross Receipts: $1,697,000
Public Utilities Sales: $1,126,000
Motor Vehicle License: $895,000
Motor Vehicle License: $734,000
Public Utilities Sales: $573,000
Other: $433,000
Other: $430,000
Other License: $326,000
Motor Fuels Sales: $40,000
Death and Gift: $5,000
- Total Salaries and Wages: $25,074,000
: $24,157,000
- Water Utilities - Interest on Debt: $322,000
Interest on Debt: $21,000
Supplemental Security Income (SSI) in 2006:
- Total number of recipients: 224
- Number of aged recipients: 47
- Number of blind and disabled recipients: 177
- Number of recipients under 18: 29
- Number of recipients between 18 and 64: 123
- Number of recipients older than 64: 72
- Number of recipients also receiving OASDI: 104
- Amount of payments (thousands of dollars): 81
| Most common first names in Fluvanna County, VA among deceased individuals | ||
| Name | Count | Lived (average) |
|---|---|---|
| John | 52 | 74.0 years |
| James | 49 | 72.3 years |
| William | 48 | 76.3 years |
| Robert | 37 | 72.2 years |
| Mary | 24 | 80.8 years |
| Charles | 22 | 76.6 years |
| George | 22 | 77.9 years |
| Thomas | 20 | 73.5 years |
| Frank | 19 | 77.9 years |
| Joseph | 19 | 75.5 years |
| Most common last names in Fluvanna County, VA among deceased individuals | ||
| Last name | Count | Lived (average) |
|---|---|---|
| Payne | 25 | 79.0 years |
| Jackson | 20 | 73.0 years |
| Anderson | 18 | 74.8 years |
| Parrish | 17 | 85.0 years |
| Martin | 17 | 73.8 years |
| Brown | 17 | 75.6 years |
| White | 17 | 77.8 years |
| Thomas | 16 | 77.2 years |
| Johnson | 15 | 74.6 years |
| Smith | 15 | 79.4 years |
| Businesses in Fluvanna County, VA | ||||
| Name | Count | Name | Count | |
|---|---|---|---|---|
| CVS | 1 | Papa John's Pizza | 1 | |
| Dunkin Donuts | 2 | U-Haul | 1 | |
| FedEx | 2 | UPS | 1 | |
| MasterBrand Cabinets | 3 | |||