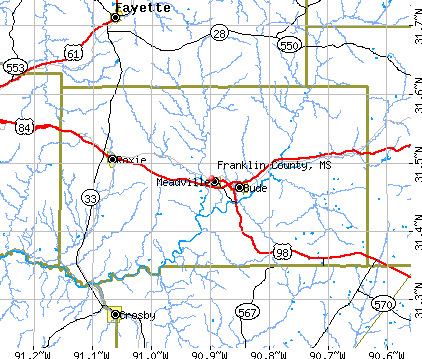
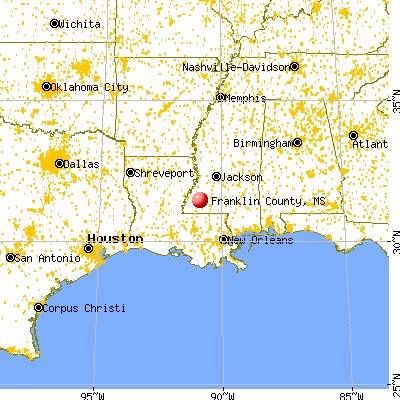
Franklin County, Mississippi (MS)
County owner-occupied free and clear houses and condos in 2010: 1,525
County owner-occupied houses and condos in 2000: 2,764
Renter-occupied apartments: 570 (it was 447 in 2000)
| % of renters here: | 14% |
| State: | 30% |
Land area: 565 sq. mi.
Water area: 2.1 sq. mi.
Population density: 14 people per square mile (low).
Industries providing employment: Educational, health and social services (22.4%), Agriculture,forestry,fishing and hunting, and mining (12.7%), Manufacturing (10.8%), Retail trade (10.8%).
Type of workers:
- Private wage or salary: 82%
- Government: 15%
- Self-employed, not incorporated: 3%
- Unpaid family work: 0%
- OSM Map
- General Map
- Google Map
- MSN Map

- 4,72962.2%White Non-Hispanic Alone
- 2,68435.3%Black Non-Hispanic Alone
- 1602.1%Two or more races
- 210.3%Some other race alone
- 100.1%American Indian and Alaska Native alone
- 20.03%Hispanic or Latino

| Median resident age: | 43.6 years |
| Mississippi median age: | 38.9 years |
| Males: 3,839 | |
| Females: 3,802 |

 | News, The county where no one's gay (53 replies) |
| Living in or around Natchez... (11 replies) |
| Is Mississippi particularly welcoming to Northerners? (82 replies) |
| Are there intergrated neighborhoods in Mississippi? (68 replies) |
| Fellow Mississippians (27 replies) |
| Franklin County: | 2.0 people |
| Mississippi: | 3 people |
Estimated median household income in 2022: $43,721 ($24,885 in 1999)
| This county: | $43,721 |
| Mississippi: | $52,719 |
Median contract rent in 2022 for apartments: $394
| This county: | $394 |
| State: | $656 |
Estimated median house or condo value in 2022: $103,526 (it was $44,300 in 2000)
| Franklin: | $103,526 |
| Mississippi: | $162,500 |
Mean price in 2022:
Median monthly housing costs for homes and condos with a mortgage: $1,114Detached houses: $199,672
Here: $199,672 State: $226,494 Mobile homes: $67,984
Here: $67,984 State: $73,695
Median monthly housing costs for units without a mortgage: $323
Institutionalized population: 67
Crime in 2013 (reported by the sheriff's office or county police, not the county total):
- Murders: 1
- Rapes: 0
- Robberies: 1
- Assaults: 7
- Burglaries: 22
- Thefts: 18
- Auto thefts: 5
Crime in 2012 (reported by the sheriff's office or county police, not the county total):
- Murders: 1
- Rapes: 1
- Robberies: 3
- Assaults: 15
- Burglaries: 49
- Thefts: 7
- Auto thefts: 7
Single-family new house construction building permits:
- 2022: 0 buildings
- 2021: 0 buildings
- 2020: 0 buildings
- 2019: 0 buildings
- 2018: 0 buildings
- 2017: 0 buildings
- 2016: 0 buildings
- 2015: 0 buildings
- 2014: 0 buildings
- 2013: 0 buildings
- 2012: 0 buildings
- 2011: 0 buildings
- 2010: 0 buildings
- 2009: 0 buildings
- 2008: 1 building, cost: $195,000
- 2007: 0 buildings
- 2006: 0 buildings
- 2005: 0 buildings
- 2004: 0 buildings
- 2003: 1 building, cost: $235,000
- 2002: 1 building, cost: $235,000
- 2001: 0 buildings
- 2000: 2 buildings, average cost: $225,000
- 1999: 0 buildings
- 1998: 0 buildings
- 1997: 0 buildings


Median real estate property taxes paid for housing units with mortgages in 2022: $615 (0.6%)
Median real estate property taxes paid for housing units with no mortgage in 2022: $518 (0.5%)


| Franklin County: | 23.7% |
| Mississippi: | 19.1% |
Median age of residents in 2022: 43.6 years old
(Males: 41.5 years old, Females: 44.7 years old)
(Median age for: White residents: 47.6 years old, Black residents: 38.9 years old, Other race residents: 44.5 years old)
Fair market rent in 2006 for a 1-bedroom apartment in Franklin County is $409 a month.
Fair market rent for a 2-bedroom apartment is $455 a month.
Fair market rent for a 3-bedroom apartment is $550 a month.
Neighboring counties: Avoyelles Parish, Louisiana  , Ben Hill County, Georgia
  , Henry County, Alabama , Walthall County
  , McLennan County, Texas
  , San Saba County, Texas .
| Here: | 4.1% |
| Mississippi: | 2.6% |


Current college students: 235
People 25 years of age or older with a high school degree or higher: 84.3%
People 25 years of age or older with a bachelor's degree or higher: 16.5%
Number of foreign born residents: 9 (28.1% naturalized citizens)
| Franklin County: | 0.1% |
| Whole state: | 2.2% |

- Year of entry for the foreign-born population
- 82010 or later
- 32000 to 2009
- 01990 to 1999
- 21980 to 1989
- 141970 to 1979
- 10Before 1970
Mean travel time to work (commute): $ minutes
Percentage of county residents living and working in this county: 83.5%
Housing units in structures:
- One, detached: 3,194
- One, attached: 50
- Two: 32
- 3 or 4: 11
- 5 to 9: 30
- 20 or more: 6
- Mobile homes: 1,029
- Boats, RVs, vans, etc.: 13
Housing units in Franklin County with a mortgage: 584 (112 second mortgage, 0 home equity loan, 37 both second mortgage and home equity loan)
Houses without a mortgage: 27
| Here: | 95.6% with mortgage |
| State: | 97.5% with mortgage |
Religion statistics for Franklin County
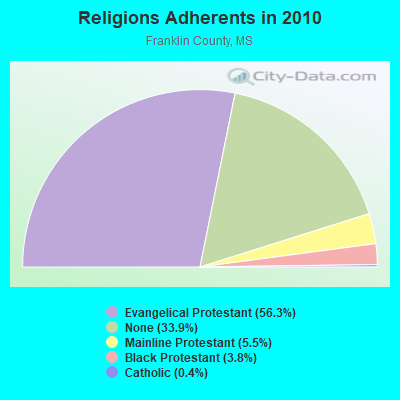
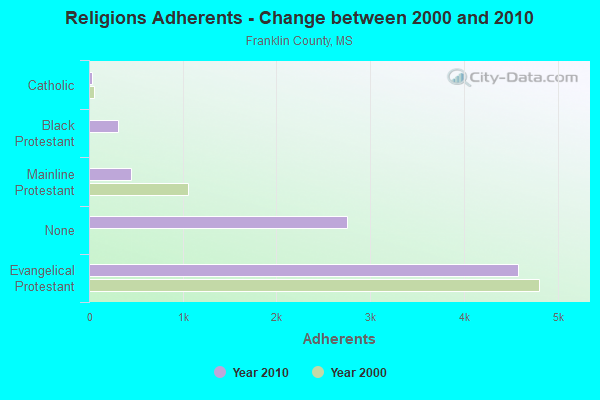
| Religion | Adherents | Congregations |
|---|---|---|
| Evangelical Protestant | 4,572 | 27 |
| Mainline Protestant | 449 | 8 |
| Black Protestant | 312 | 2 |
| Catholic | 32 | 1 |
| None | 2,753 | - |
Source: Clifford Grammich, Kirk Hadaway, Richard Houseal, Dale E.Jones, Alexei Krindatch, Richie Stanley and Richard H.Taylor. 2012. 2010 U.S.Religion Census: Religious Congregations & Membership Study. Association of Statisticians of American Religious Bodies. Jones, Dale E., et al. 2002. Congregations and Membership in the United States 2000. Nashville, TN: Glenmary Research Center.
Food Environment Statistics:
| Franklin County: | 1.20 / 10,000 pop. |
| State: | 2.08 / 10,000 pop. |
| This county: | 1.20 / 10,000 pop. |
| Mississippi: | 0.80 / 10,000 pop. |
| Franklin County: | 7.23 / 10,000 pop. |
| Mississippi: | 6.36 / 10,000 pop. |
| This county: | 2.41 / 10,000 pop. |
| State: | 5.03 / 10,000 pop. |
| Franklin County: | 12.6% |
| Mississippi: | 12.3% |
| Franklin County: | 37.5% |
| State: | 33.1% |
| Here: | 13.8% |
| State: | 14.4% |
Agriculture in Franklin County:
Average size of farms: 214 acresAverage value of agricultural products sold per farm: $17,832
Average value of crops sold per acre for harvested cropland: $91.99
The value of livestock, poultry, and their products as a percentage of the total market value of agricultural products sold: 88.22%
Average total farm production expenses per farm: $14,554
Harvested cropland as a percentage of land in farms: 10.70%
Average market value of all machinery and equipment per farm: $29,059
The percentage of farms operated by a family or individual: 96.15%
Average age of principal farm operators: 58 years
Average number of cattle and calves per 100 acres of all land in farms: 14.48
Corn for grain: 1212 harvested acres
Land in orchards: 9 acres
Earthquake activity:
Franklin County-area historical earthquake activity is significantly above Mississippi state average. It is 172% greater than the overall U.S. average.On 10/24/1997 at 08:35:17, a magnitude 4.9 (4.8 MB, 4.2 MS, 4.9 LG, Depth: 6.2 mi, Class: Light, Intensity: IV - V) earthquake occurred 215.8 miles away from Franklin County center
On 5/17/2012 at 08:12:00, a magnitude 4.8 (4.8 MW, Depth: 3.1 mi) earthquake occurred 206.5 miles away from the county center
On 1/18/1999 at 07:00:53, a magnitude 4.8 (4.8 MB, 4.0 LG, Depth: 0.6 mi) earthquake occurred 251.1 miles away from the county center
On 3/25/1976 at 00:41:20, a magnitude 5.0 (4.9 MB, 5.0 LG, Class: Moderate, Intensity: VI - VII) earthquake occurred 289.7 miles away from the county center
On 11/7/2004 at 11:20:21, a magnitude 4.3 (4.3 MW, Depth: 3.1 mi) earthquake occurred 191.9 miles away from Franklin County center
On 1/21/1982 at 00:33:54, a magnitude 4.7 (4.5 MB, 4.7 LG, 4.5 LG) earthquake occurred 266.5 miles away from the county center
Magnitude types: regional Lg-wave magnitude (LG), body-wave magnitude (MB), surface-wave magnitude (MS), moment magnitude (MW)
Most recent natural disasters:
- Mississippi Covid-19 Pandemic, Incident Period: January 20, 2020, FEMA Id: 4528, Natural disaster type: Other
- Mississippi Hurricane Isaac, Incident Period: August 26, 2012 to September 11, 2012, Major Disaster (Presidential) Declared DR-4081: August 29, 2012, FEMA Id: 4081, Natural disaster type: Hurricane
- Mississippi Hurricane Gustav, Incident Period: August 28, 2008 to September 08, 2008, Major Disaster (Presidential) Declared DR-1794: September 22, 2008, FEMA Id: 1794, Natural disaster type: Hurricane
- Mississippi Hurricane Katrina, Incident Period: August 29, 2005 to October 14, 2005, Major Disaster (Presidential) Declared DR-1604: August 29, 2005, FEMA Id: 1604, Natural disaster type: Hurricane
- Mississippi Severe Storms, Tornadoes and Flooding, Incident Period: April 06, 2003 to April 25, 2003, Major Disaster (Presidential) Declared DR-1459: April 24, 2003, FEMA Id: 1459, Natural disaster type: Storm, Tornado, Flood
- Mississippi Tornadoes and Severe Storms, Incident Period: February 16, 2001 to March 15, 2001, Major Disaster (Presidential) Declared DR-1360: February 23, 2001, FEMA Id: 1360, Natural disaster type: Storm, Tornado
- Mississippi SEVERE STORMS, FLOODING, TORNADOES, Incident Period: April 16, 1983, Major Disaster (Presidential) Declared DR-678: April 16, 1983, FEMA Id: 678, Natural disaster type: Storm, Tornado, Flood
- Mississippi Drought and Freezing, Incident Period: February 22, 1977, Emergency Declared EM-3032: February 22, 1977, FEMA Id: 3032, Natural disaster type: Freeze, Drought
- Mississippi Heavy Rains, Flooding, Incident Period: April 18, 1974, Major Disaster (Presidential) Declared DR-430: April 18, 1974, FEMA Id: 430, Natural disaster type: Flood, Heavy Rain
- Mississippi Heavy Rains, Tornadoes, Flooding, Incident Period: March 27, 1973, Major Disaster (Presidential) Declared DR-368: March 27, 1973, FEMA Id: 368, Natural disaster type: Tornado, Flood, Heavy Rain
- 2 other natural disasters have been reported since 1953.
The number of natural disasters in Franklin County (12) is smaller than the US average (15).
Major Disasters (Presidential) Declared: 10
Emergencies Declared: 1
Causes of natural disasters: Floods: 5, Hurricanes: 4, Tornadoes: 4, Heavy Rains: 3, Storms: 3, Drought: 1, Freeze: 1, Other: 1 (Note: some incidents may be assigned to more than one category).

Means of transportation to work:
- Drove a car alone: 1,222 (87.6%)
- Carpooled: 92 (6.6%)
- Taxicab, motorcycle, or other means: 19 (1.4%)
- Walked: 8 (0.6%)
- Worked at home: 36 (2.6%)


- Educational services (20%)
- Health care and social assistance (18%)
- Retail trade (11%)
- Manufacturing (10%)
- Finance and insurance (10%)
- Administrative and support and waste management services (8%)
- Other services, except public administration (5%)

- Educational services (20%)
- Health care and social assistance (19%)
- Retail trade (12%)
- Manufacturing (10%)
- Finance and insurance (10%)
- Administrative and support and waste management services (9%)
- Other services, except public administration (6%)

- Construction and extraction occupations (16%)
- Transportation occupations (13%)
- Management occupations (11%)
- Material moving occupations (10%)
- Food preparation and serving related occupations (8%)
- Production occupations (8%)
- Office and administrative support occupations (6%)

- Office and administrative support occupations (23%)
- Management occupations (16%)
- Educational instruction, and library occupations (15%)
- Health technologists and technicians (8%)
- Building and grounds cleaning and maintenance occupations (7%)
- Sales and related occupations (6%)
- Healthcare support occupations (5%)

- Yemen (60%)
- Sudan (30%)
- Norway (0%)
- Sweden (0%)
- United Kingdom, excluding England and Scotland (0%)
- England (0%)
- Scotland (0%)

- American (13%)
- English (8%)
- Scottish (5%)
- Irish (3%)
- European (2%)
- Scotch-Irish (1%)
- German (1%)


10 people in local jails and other municipal confinement facilities
People in group quarters in Franklin County, Mississippi in 2000:
- 67 people in nursing homes
- 14 people in other noninstitutional group quarters
- 8 people in mental (psychiatric) hospitals or wards
- 2 people in local jails and other confinement facilities (including police lockups)
- 2 people in hospitals or wards for drug/alcohol abuse
5.18% of this county's 2021 resident taxpayers lived in other counties in 2020 ($46,832 average adjusted gross income)
| Here: | 5.18% |
| Mississippi average: | 6.85% |
10 or fewer of this county's residents moved from foreign countries.
3.44% relocated from other counties in Mississippi ($30,438 average AGI)
1.74% relocated from other states ($16,387 average AGI)
Franklin County: 1.74% Mississippi average: 2.80%

Top counties from which taxpayers relocated into this county between 2020 and 2021:
| from Lincoln County, MS |
5.46% of this county's 2020 resident taxpayers moved to other counties in 2021 ($44,103 average adjusted gross income)
| Here: | 5.46% |
| Mississippi average: | 7.03% |
10 or fewer of this county's residents moved to foreign countries.
4.18% relocated to other counties in Mississippi ($32,966 average AGI)
1.28% relocated to other states ($11,138 average AGI)
Franklin County: 1.28% Mississippi average: 2.99%

Top counties to which taxpayers relocated from this county between 2020 and 2021:
| to Lincoln County, MS |
Births per 1000 population from 1990 to 1999: 13.9
Births per 1000 population from 2000 to 2006: 13.0

Deaths per 1000 population from 1990 to 1999: 12.3
Deaths per 1000 population from 2000 to 2009: 10.7
Deaths per 1000 population from 2010 to 2020: 13.3

Infant deaths per 1000 live births from 1990 to 1999: 10.7
Infant deaths per 1000 live births from 2000 to 2006: 9.0

Persons under 19 years old without health insurance coverage in 2018: 5.0%


Persons enrolled in hospital insurance and/or supplemental medical insurance (Medicare) in July 1, 2007: 1,567 (1,191 aged, 376 disabled)
Children under 18 without health insurance coverage in 2007: 319 (16%)


Most common underlying causes of death in Franklin County, Mississippi in 1999 - 2019:
- Heart failure, unspecified (300)
- Atherosclerotic heart disease (21)
- Bronchus or lung, unspecified - Malignant neoplasms (11)
- Chronic obstructive pulmonary disease, unspecified (11)
- Unspecified diabetes mellitus, without complications (10)
Population without health insurance coverage in 2000: 18%
Children under 18 without health insurance coverage in 2000: 13%
Short term general hospital admissions per 100,000 population in 2004: 10,510
Short term general hospital beds per 100,000 population in 2004: 428
Emergency room visits per 100,000 population in 2004: 49,649
General practice office based MDs per 100,000 population in 2005: 1,129
Medical specialist MDs per 100,000 population in 2005: 1,403
Total births per 100,000 population, July 2005 - July 2006 : 12
Total deaths per 100,000 population, July 2005 - July 2006: 24
Crimes per 100,000 population in 1996: 1
Household type by relationship:
Households: 7,641- Male householders: 1,178 (231 living alone), Female householders: 1,871 (493 living alone)
1,406 spouses (1,395 opposite-sex spouses), 116 unmarried partners, (83 opposite-sex unmarried partners), 2,359 children (2,239 natural, 83 adopted, 44 stepchildren), 368 grandchildren, 62 brothers or sisters, 59 parents, 0 foster children, 103 other relatives, 55 non-relatives
- In group quarters: 91
Size of family households: 1,187 2-persons, 458 3-persons, 340 4-persons, 192 5-persons, 43 6-persons, 5 7-or-more-persons.
Size of nonfamily households: 723 1-person, 84 2-persons, 10 3-persons.
909 married couples with children.
506 single-parent households (80 men, 426 women).
100.0% of residents of Franklin speak English at home.
0.1% of residents speak other Indo-European language at home (100% speak English very well).
0.1% of residents speak other language at home (100% speak English well).
In fiscal year 2004:
Federal Government expenditure: $51,817,000 ($6,161 per capita)
Department of Defense expenditure: $483,000
Federal direct payments to individuals for retirement and disability: $21,361,000
Federal other direct payments to individuals: $11,940,000
Federal direct payments not to individuals: $179,000
Federal grants: $12,325,000
Federal procurement contracts: $2,977,000 ($0,000 Department of Defense)
Federal salaries and wages: $3,035,000 ($0,000 Department of Defense)
Federal Government direct loans: $0,000
Federal guaranteed/insured loans: $807,000
Federal Government insurance: $101,000
Population change from April 1, 2000 to July 1, 2005:
Births: 613| Here: | 73 per 1000 residents |
| State: | 78 per 1000 residents |
Deaths: 466
| Here: | 55 per 1000 residents |
| State: | 51 per 1000 residents |
Net international migration: -1
| Here: | |
| State: |
Net internal migration: -169
| Here: | |
| State: |

Total withdrawal of fresh water for public supply: 0.90 millions of gallons per day (all from ground)
| Here: | 5.6 |
| State: | 6.3 |
| Here: | 5.4 |
| State: | 4.8 |

- Year house built in Franklin County, Mississippi
- 52020 or later
- 5032010 to 2019
- 5112000 to 2009
- 3801990 to 1999
- 9221980 to 1989
- 8311970 to 1979
- 2621960 to 1969
- 4101950 to 1959
- 1781940 to 1949
- 3101939 or earlier

- Rooms in owner-occupied houses in Franklin County, Mississippi
- 201 room
- 152 rooms
- 463 rooms
- 3284 rooms
- 6935 rooms
- 5676 rooms
- 2257 rooms
- 1988 rooms
- 2369+ rooms

- Rooms in renter-occupied apartments in Franklin County, Mississippi
- 241 room
- 92 rooms
- 543 rooms
- 1904 rooms
- 835 rooms
- 1346 rooms
- 1787 rooms
- 428 rooms
- 69+ rooms

- Bedrooms in owner-occupied houses in Franklin County, Mississippi
- 21no bedroom
- 1101 bedroom
- 3872 bedrooms
- 1,4843 bedrooms
- 2624 bedrooms
- 485+ bedrooms

- Bedrooms in renter-occupied apartments in Franklin County, Mississippi
- 25no bedroom
- 991 bedroom
- 2882 bedrooms
- 2133 bedrooms
- 854 bedrooms
- 05+ bedrooms

- Cars and other vehicles available in Franklin County in owner-occupied houses/condos
- 64no vehicle
- 6821 vehicle
- 9732 vehicles
- 4343 vehicles
- 1104 vehicles
- 725+ vehicles

- Cars and other vehicles available in Franklin County in renter-occupied apartments
- 39no vehicle
- 4741 vehicle
- 1182 vehicles
- 623 vehicles
- 274 vehicles
- 15+ vehicles
93.5% of Franklin County residents lived in the same house 1 years ago.
Out of people who lived in different houses, 41% lived in this county.
Out of people who lived in different counties, 83% lived in Mississippi.
| Franklin County: | 93.5% |
| State average: | 88.9% |
Place of birth for U.S.-born residents:
- This state: 6,470
- Other state: 1,117
- Northeast: 23
- Midwest: 130
- South: 888
- West: 68


- 60.7%Electricity
- 17.3%Bottled, tank, or LP gas
- 17.1%Utility gas
- 4.9%Wood

- 43.8%Electricity
- 34.6%Utility gas
- 20.5%Bottled, tank, or LP gas
- 1.1%No fuel used
Private vs. public school enrollment:
| Here: | 0.7% |
| Mississippi: | 16.1% |
| Here: | 14.5% |
| Mississippi: | 14.6% |
| Here: | 0.9% |
| Mississippi: | 12.8% |


Franklin County government finances - Expenditure in 2018:
- Charges - Solid Waste Management: $420,000
Other: $106,000
Sewerage: $36,000
- Current Operations - Regular Highways: $2,968,000
Financial Administration: $1,160,000
Police Protection: $916,000
Solid Waste Management: $634,000
Central Staff Services: $295,000
Health - Other: $290,000
Judicial and Legal Services: $276,000
Local Fire Protection: $128,000
Correctional Institutions: $128,000
General Public Buildings: $110,000
Natural Resources - Other: $73,000
Sewerage: $49,000
General - Other: $7,000
Parks and Recreation: $6,000
- General - Interest on Debt: $47,000
- Intergovernmental to Local - Other - Other Higher Education: $433,000
- Long Term Debt - Beginning Outstanding - Unspecified Public Purpose: $708,000
Outstanding Unspecified Public Purpose: $637,000
Retired Unspecified Public Purpose: $71,000
- Miscellaneous - Interest Earnings: $456,000
General Revenue - Other: $296,000
Fines and Forfeits: $242,000
- Other Capital Outlay - General - Other: $20,000
- Other Funds - Cash and Securities: $11,534,000
- State Intergovernmental - General Local Government Support: $1,222,000
Other: $1,040,000
Highways: $133,000
- Tax - Property: $2,929,000
Other License: $104,000
- Total Salaries and Wages: $311,000
Franklin County government finances - Revenue in 2018:
- Charges - Solid Waste Management: $420,000
Other: $106,000
Sewerage: $36,000
- Current Operations - Regular Highways: $2,968,000
Financial Administration: $1,160,000
Police Protection: $916,000
Solid Waste Management: $634,000
Central Staff Services: $295,000
Health - Other: $290,000
Judicial and Legal Services: $276,000
Local Fire Protection: $128,000
Correctional Institutions: $128,000
General Public Buildings: $110,000
Natural Resources - Other: $73,000
Sewerage: $49,000
General - Other: $7,000
Parks and Recreation: $6,000
- General - Interest on Debt: $47,000
- Intergovernmental to Local - Other - Other Higher Education: $433,000
- Long Term Debt - Beginning Outstanding - Unspecified Public Purpose: $708,000
Outstanding Unspecified Public Purpose: $637,000
Retired Unspecified Public Purpose: $71,000
- Miscellaneous - Interest Earnings: $456,000
General Revenue - Other: $296,000
Fines and Forfeits: $242,000
- Other Capital Outlay - General - Other: $20,000
- Other Funds - Cash and Securities: $11,534,000
- State Intergovernmental - General Local Government Support: $1,222,000
Other: $1,040,000
Highways: $133,000
- Tax - Property: $2,929,000
Other License: $104,000
- Total Salaries and Wages: $311,000
Franklin County government finances - Debt in 2018:
- Charges - Solid Waste Management: $420,000
Other: $106,000
Sewerage: $36,000
- Current Operations - Regular Highways: $2,968,000
Financial Administration: $1,160,000
Police Protection: $916,000
Solid Waste Management: $634,000
Central Staff Services: $295,000
Health - Other: $290,000
Judicial and Legal Services: $276,000
Local Fire Protection: $128,000
Correctional Institutions: $128,000
General Public Buildings: $110,000
Natural Resources - Other: $73,000
Sewerage: $49,000
General - Other: $7,000
Parks and Recreation: $6,000
- General - Interest on Debt: $47,000
- Intergovernmental to Local - Other - Other Higher Education: $433,000
- Long Term Debt - Beginning Outstanding - Unspecified Public Purpose: $708,000
Outstanding Unspecified Public Purpose: $637,000
Retired Unspecified Public Purpose: $71,000
- Miscellaneous - Interest Earnings: $456,000
General Revenue - Other: $296,000
Fines and Forfeits: $242,000
- Other Capital Outlay - General - Other: $20,000
- Other Funds - Cash and Securities: $11,534,000
- State Intergovernmental - General Local Government Support: $1,222,000
Other: $1,040,000
Highways: $133,000
- Tax - Property: $2,929,000
Other License: $104,000
- Total Salaries and Wages: $311,000
Franklin County government finances - Cash and Securities in 2018:
- Charges - Solid Waste Management: $420,000
Other: $106,000
Sewerage: $36,000
- Current Operations - Regular Highways: $2,968,000
Financial Administration: $1,160,000
Police Protection: $916,000
Solid Waste Management: $634,000
Central Staff Services: $295,000
Health - Other: $290,000
Judicial and Legal Services: $276,000
Local Fire Protection: $128,000
Correctional Institutions: $128,000
General Public Buildings: $110,000
Natural Resources - Other: $73,000
Sewerage: $49,000
General - Other: $7,000
Parks and Recreation: $6,000
- General - Interest on Debt: $47,000
- Intergovernmental to Local - Other - Other Higher Education: $433,000
- Long Term Debt - Beginning Outstanding - Unspecified Public Purpose: $708,000
Outstanding Unspecified Public Purpose: $637,000
Retired Unspecified Public Purpose: $71,000
- Miscellaneous - Interest Earnings: $456,000
General Revenue - Other: $296,000
Fines and Forfeits: $242,000
- Other Capital Outlay - General - Other: $20,000
- Other Funds - Cash and Securities: $11,534,000
- State Intergovernmental - General Local Government Support: $1,222,000
Other: $1,040,000
Highways: $133,000
- Tax - Property: $2,929,000
Other License: $104,000
- Total Salaries and Wages: $311,000
Supplemental Security Income (SSI) in 2006:
- Total number of recipients: 400
- Number of aged recipients: 51
- Number of blind and disabled recipients: 349
- Number of recipients under 18: 80
- Number of recipients between 18 and 64: 225
- Number of recipients older than 64: 95
- Number of recipients also receiving OASDI: 163
- Amount of payments (thousands of dollars): 166
| Most common first names in Franklin County, MS among deceased individuals | ||
| Name | Count | Lived (average) |
|---|---|---|
| James | 72 | 68.2 years |
| John | 61 | 75.6 years |
| Mary | 50 | 77.9 years |
| Willie | 49 | 76.5 years |
| William | 44 | 71.6 years |
| Robert | 37 | 74.0 years |
| Charles | 26 | 62.3 years |
| Thomas | 23 | 68.2 years |
| Henry | 21 | 73.1 years |
| George | 21 | 75.4 years |
| Most common last names in Franklin County, MS among deceased individuals | ||
| Last name | Count | Lived (average) |
|---|---|---|
| Smith | 75 | 71.8 years |
| Jones | 69 | 74.2 years |
| Jackson | 47 | 76.3 years |
| Brown | 42 | 69.8 years |
| Wilkinson | 38 | 77.3 years |
| Temple | 37 | 76.2 years |
| Hunt | 32 | 71.7 years |
| Halford | 29 | 74.1 years |
| Adams | 28 | 76.3 years |
| Lee | 27 | 76.9 years |
Businesses in Franklin County, MS
- U-Haul: 1