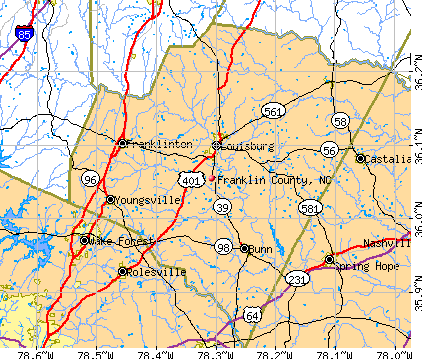
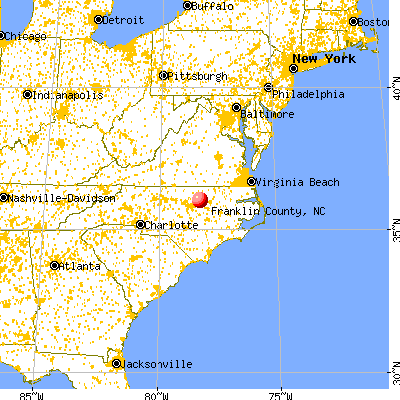
Franklin County, North Carolina (NC)
County owner-occupied free and clear houses and condos in 2010: 5,270
County owner-occupied houses and condos in 2000: 13,880
Renter-occupied apartments: 5,994 (it was 3,963 in 2000)
| % of renters here: | 22% |
| State: | 33% |
Land area: 492 sq. mi.
Water area: 2.6 sq. mi.
Population density: 151 people per square mile (average).
Industries providing employment: Educational, health and social services (19.3%), Retail trade (13.8%), Professional, scientific, management, administrative, and waste management services (12.7%), Construction (11.1%), Manufacturing (10.7%).
Type of workers:
- Private wage or salary: 80%
- Government: 15%
- Self-employed, not incorporated: 5%
- Unpaid family work: 0%
- OSM Map
- General Map
- Google Map
- MSN Map

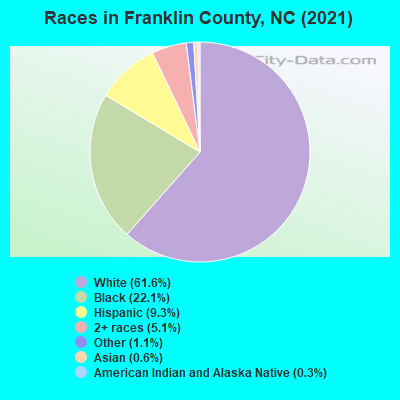
- 43,78161.6%White Non-Hispanic Alone
- 16,32223.0%Black Non-Hispanic Alone
- 6,9339.8%Hispanic or Latino
- 3,0484.3%Two or more races
- 4770.7%Asian alone
- 2940.4%Some other race alone
- 2110.3%American Indian and Alaska Native alone
| Median resident age: | 40.2 years |
| North Carolina median age: | 39.2 years |
| Males: 35,176 | |
| Females: 39,363 |

 | Franklin County Development and Growth (16 replies) |
| 2022 NC County Census Estimates (110 replies) |
| Upscale Single story homes nestled among other mostly single story homes, ~3,000 sf up. Where? (199 replies) |
| Lake Royale for retirees? (12 replies) |
| Which town outside of Wake, Durham, and Orange has the brightest future? (81 replies) |
| Triangle Population (36 replies) |
| Franklin County: | 2.0 people |
| North Carolina: | 2 people |
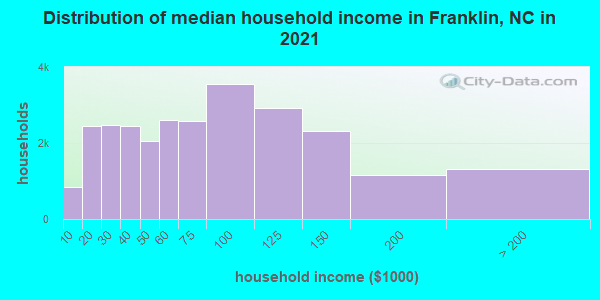
Estimated median household income in 2022: $73,182 ($38,968 in 1999)
| This county: | $73,182 |
| North Carolina: | $67,481 |
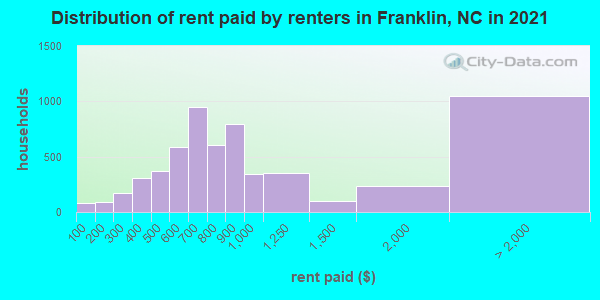
Median contract rent in 2022 for apartments: $681 (lower quartile is $494, upper quartile is $904)
| This county: | $681 |
| State: | $945 |
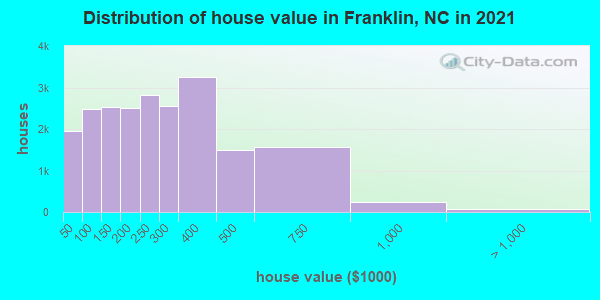
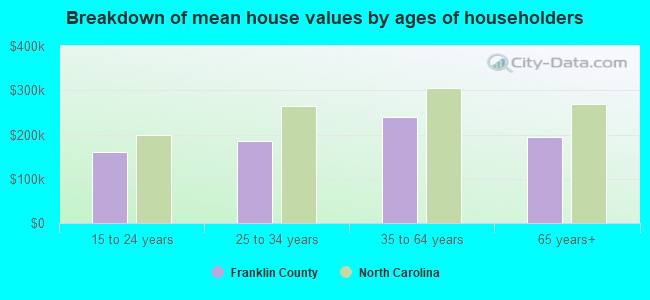
Estimated median house or condo value in 2022: $267,900 (it was $85,600 in 2000)
| Franklin: | $267,900 |
| North Carolina: | $280,600 |
Mean price in 2022:
Median monthly housing costs for homes and condos with a mortgage: $1,393Detached houses: $300,436
Here: $300,436 State: $375,326 Townhouses or other attached units: $412,083
Here: $412,083 State: $317,935 Mobile homes: $106,402
Here: $106,402 State: $124,933 Occupied boats, RVs, vans, etc.: $37,986
Here: $37,986 State: $107,261
Median monthly housing costs for units without a mortgage: $470
Institutionalized population: 1,051
Crime in 2021 (reported by the sheriff's office or county police, not the county total):
- Murders: 5
- Rapes: 19
- Robberies: 6
- Assaults: 83
- Burglaries: 145
- Thefts: 415
- Auto thefts: 40
Crime in 2020 (reported by the sheriff's office or county police, not the county total):
- Murders: 3
- Rapes: 9
- Robberies: 7
- Assaults: 87
- Burglaries: 142
- Thefts: 345
- Auto thefts: 44
Health of residents in Franklin County based on CDC Behavioral Risk Factor Surveillance System Survey Questionnaires from 2013 to 2021:
General health status score of residents in this county from 1 (poor) to 5 (excellent) is 3.6. This is better than average.79.1% of residents exercised in the past month. This is about average.
35.9% of residents smoked 100+ cigarettes in their lives. This is less than average.
55.9% of adult residents drank alcohol in the past 30 days. This is less than average.
70.9% of residents visited a dentist within the past year. This is about average.
Average weight of males is 194 pounds. This is about average.
Average weight of females is 164 pounds. This is about average.
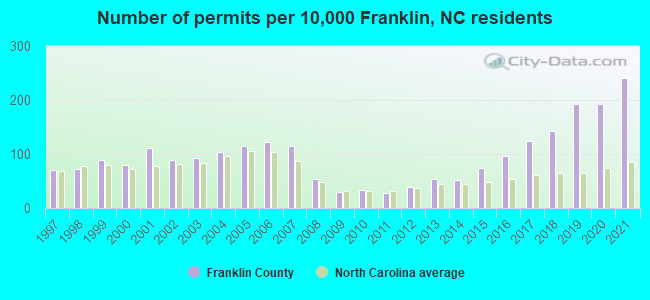
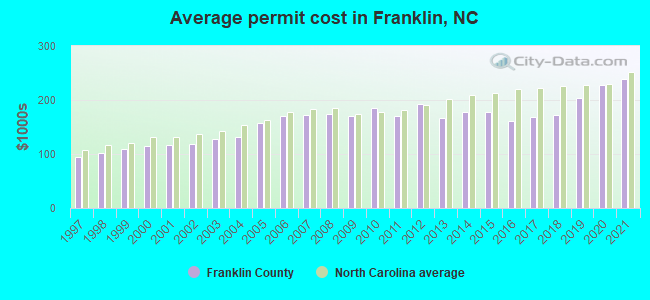
Single-family new house construction building permits:
- 2022: 945 buildings, average cost: $256,200
- 2021: 1141 buildings, average cost: $238,200
- 2020: 913 buildings, average cost: $227,700
- 2019: 914 buildings, average cost: $202,500
- 2018: 674 buildings, average cost: $171,900
- 2017: 588 buildings, average cost: $168,100
- 2016: 457 buildings, average cost: $161,600
- 2015: 353 buildings, average cost: $176,500
- 2014: 242 buildings, average cost: $177,700
- 2013: 254 buildings, average cost: $166,100
- 2012: 182 buildings, average cost: $191,500
- 2011: 126 buildings, average cost: $171,400
- 2010: 158 buildings, average cost: $186,100
- 2009: 141 buildings, average cost: $170,900
- 2008: 253 buildings, average cost: $173,900
- 2007: 544 buildings, average cost: $171,900
- 2006: 580 buildings, average cost: $170,300
- 2005: 539 buildings, average cost: $157,800
- 2004: 488 buildings, average cost: $131,200
- 2003: 435 buildings, average cost: $126,900
- 2002: 416 buildings, average cost: $117,800
- 2001: 528 buildings, average cost: $116,300
- 2000: 372 buildings, average cost: $114,400
- 1999: 417 buildings, average cost: $108,900
- 1998: 347 buildings, average cost: $100,900
- 1997: 331 buildings, average cost: $95,300
Median real estate property taxes paid for housing units with mortgages in 2022: $1,837 (0.6%)
Median real estate property taxes paid for housing units with no mortgage in 2022: $1,340 (0.8%)
| Franklin County: | 8.8% |
| North Carolina: | 12.8% |
Median age of residents in 2022: 40.2 years old
(Males: 39.8 years old, Females: 40.8 years old)
(Median age for: White residents: 43.2 years old, Black residents: 38.9 years old, American Indian residents: 54.8 years old, Asian residents: 55.9 years old, Hispanic or Latino residents: 24.2 years old, Other race residents: 24.5 years old)
Area name: Raleigh-Cary, NC MSA
Fair market rent in 2006 for a 1-bedroom apartment in Franklin County is $734 a month.
Fair market rent for a 2-bedroom apartment is $817 a month.
Fair market rent for a 3-bedroom apartment is $1027 a month.
Cities in this county include: Louisburg, Franklinton, Youngsville, Bunn, Centerville.
Neighboring counties: Colfax County, New Mexico  , McKinley County, New Mexico , Chatham County
  , Sandoval County, New Mexico , Woods County, Oklahoma , Southampton County, Virginia
  .
.
| Here: | 3.2% |
| North Carolina: | 3.2% |

Current college students: 1,802
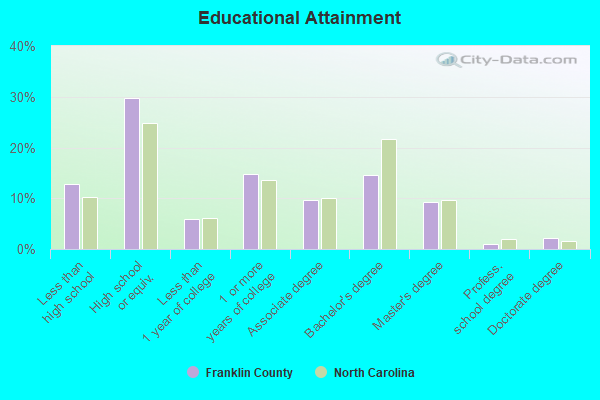
People 25 years of age or older with a high school degree or higher: 88.2%
People 25 years of age or older with a bachelor's degree or higher: 28.0%
Number of foreign born residents: 3,270 (36.2% naturalized citizens)
| Franklin County: | 4.4% |
| Whole state: | 8.6% |
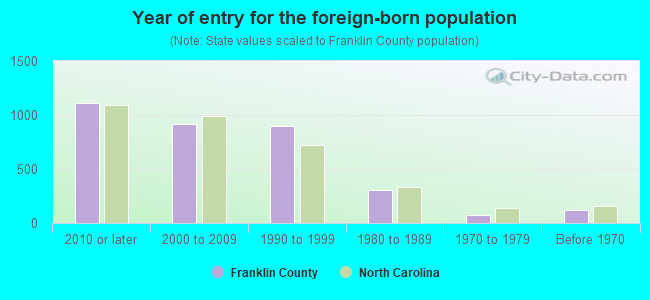
- Year of entry for the foreign-born population
- 1,0502010 or later
- 9572000 to 2009
- 7801990 to 1999
- 3081980 to 1989
- 781970 to 1979
- 125Before 1970
Mean travel time to work (commute): % minutes
Percentage of county residents living and working in this county: 99.6%

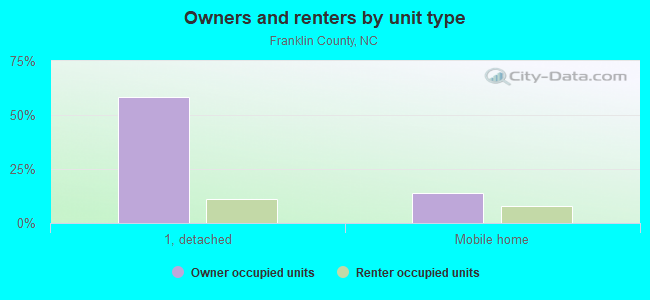
Housing units in structures:
- One, detached: 21,681
- One, attached: 269
- Two: 301
- 3 or 4: 179
- 5 to 9: 203
- 10 to 19: 253
- 20 to 49: 187
- 50 or more: 130
- Mobile homes: 7,034
- Boats, RVs, vans, etc.: 87
Housing units in Franklin County with a mortgage: 13,914 (1,214 second mortgage, 44 home equity loan, 1,002 both second mortgage and home equity loan)
Houses without a mortgage: 181
| Here: | 6.7% with mortgage |
| State: | 97.0% with mortgage |
Religion statistics for Franklin County
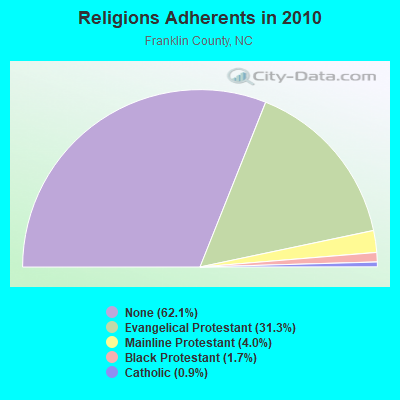
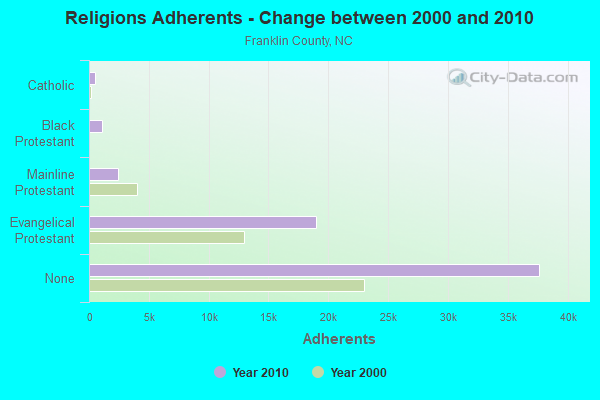
| Religion | Adherents | Congregations |
|---|---|---|
| Evangelical Protestant | 18,951 | 61 |
| Mainline Protestant | 2,447 | 19 |
| Black Protestant | 1,049 | 7 |
| Catholic | 521 | 1 |
| Other | 7 | 2 |
| None | 37,644 | - |
Source: Clifford Grammich, Kirk Hadaway, Richard Houseal, Dale E.Jones, Alexei Krindatch, Richie Stanley and Richard H.Taylor. 2012. 2010 U.S.Religion Census: Religious Congregations & Membership Study. Association of Statisticians of American Religious Bodies. Jones, Dale E., et al. 2002. Congregations and Membership in the United States 2000. Nashville, TN: Glenmary Research Center.
Food Environment Statistics:
| Franklin County: | 2.45 / 10,000 pop. |
| State: | 2.05 / 10,000 pop. |
| This county: | 0.53 / 10,000 pop. |
| North Carolina: | 0.92 / 10,000 pop. |
| Franklin County: | 5.96 / 10,000 pop. |
| North Carolina: | 4.75 / 10,000 pop. |
| This county: | 2.45 / 10,000 pop. |
| State: | 7.57 / 10,000 pop. |
| Franklin County: | 10.1% |
| North Carolina: | 9.8% |
| Franklin County: | 29.8% |
| State: | 28.3% |
| Here: | 21.2% |
| State: | 15.6% |
Agriculture in Franklin County:
Average size of farms: 224 acresAverage value of agricultural products sold per farm: $70,198
Average value of crops sold per acre for harvested cropland: $782.91
The value of livestock, poultry, and their products as a percentage of the total market value of agricultural products sold: 34.52%
Average total farm production expenses per farm: $70,783
Harvested cropland as a percentage of land in farms: 26.24%
Irrigated harvested cropland as a percentage of land in farms: 12.23%
Average market value of all machinery and equipment per farm: $63,042
The percentage of farms operated by a family or individual: 91.46%
Average age of principal farm operators: 58 years
Average number of cattle and calves per 100 acres of all land in farms: 7.90
Milk cows as a percentage of all cattle and calves: 0.04%
Corn for grain: 1516 harvested acres
All wheat for grain: 5002 harvested acres
Soybeans for beans: 12638 harvested acres
Vegetables: 624 harvested acres
Land in orchards: 73 acres
Earthquake activity:
Franklin County-area historical earthquake activity is significantly above North Carolina state average. It is 50% smaller than the overall U.S. average.On 8/23/2011 at 17:51:04, a magnitude 5.8 (5.8 MW, Depth: 3.7 mi, Class: Moderate, Intensity: VI - VII) earthquake occurred 130.0 miles away from Franklin County center
On 8/9/2020 at 12:07:37, a magnitude 5.1 (5.1 MW, Depth: 4.7 mi) earthquake occurred 158.0 miles away from the county center
On 12/9/2003 at 20:59:14, a magnitude 4.5 (4.5 MB, 4.5 LG, Class: Light, Intensity: IV - V) earthquake occurred 108.4 miles away from the county center
On 12/9/2003 at 20:59:18, a magnitude 4.5 (4.5 ML, Depth: 6.2 mi) earthquake occurred 119.6 miles away from the county center
On 8/25/2011 at 05:07:52, a magnitude 4.5 (4.5 ML, Depth: 4.2 mi) earthquake occurred 132.3 miles away from Franklin County center
On 8/24/2011 at 00:04:36, a magnitude 4.2 (4.2 ML) earthquake occurred 130.2 miles away from the county center
Magnitude types: regional Lg-wave magnitude (LG), body-wave magnitude (MB), local magnitude (ML), moment magnitude (MW)
Most recent natural disasters:
- North Carolina Covid-19 Pandemic, Incident Period: January 20, 2020, FEMA Id: 4487, Natural disaster type: Other
- North Carolina Hurricane Matthew, Incident Period: October 04, 2016 to October 24, 2016, Emergency Declared EM-3380: October 07, 2016, FEMA Id: 3380, Natural disaster type: Hurricane
- North Carolina Hurricane Matthew, Incident Period: October 04, 2016 to October 24, 2016, Major Disaster (Presidential) Declared DR-4285: October 10, 2016, FEMA Id: 4285, Natural disaster type: Hurricane
- North Carolina Hurricane Katrina Evacuation, Incident Period: August 29, 2005 to October 01, 2005, Emergency Declared EM-3222: September 05, 2005, FEMA Id: 3222, Natural disaster type: Hurricane
- North Carolina Hurricane Isabel, Incident Period: September 18, 2003 to September 26, 2003, Major Disaster (Presidential) Declared DR-1490: September 18, 2003, FEMA Id: 1490, Natural disaster type: Hurricane
- North Carolina Severe Ice Storm, Incident Period: December 04, 2002 to December 06, 2002, Major Disaster (Presidential) Declared DR-1448: December 12, 2002, FEMA Id: 1448, Natural disaster type: Ice Storm
- North Carolina Winter Storm, Incident Period: January 24, 2000 to February 01, 2000, Major Disaster (Presidential) Declared DR-1312: January 31, 2000, FEMA Id: 1312, Natural disaster type: Winter Storm
- North Carolina Hurricane Floyd & Irene, Incident Period: September 15, 1999 to November 02, 1999, Major Disaster (Presidential) Declared DR-1292: September 16, 1999, FEMA Id: 1292, Natural disaster type: Hurricane
- North Carolina Hurricane Floyd, Incident Period: September 15, 1999 to October 04, 1999, Emergency Declared EM-3146: September 15, 1999, FEMA Id: 3146, Natural disaster type: Hurricane
- North Carolina Hurricane Fran, Incident Period: September 05, 1996 to October 21, 1996, Major Disaster (Presidential) Declared DR-1134: September 06, 1996, FEMA Id: 1134, Natural disaster type: Hurricane
- 5 other natural disasters have been reported since 1953.
The number of natural disasters in Franklin County (15) is near the US average (15).
Major Disasters (Presidential) Declared: 8
Emergencies Declared: 6
Causes of natural disasters: Hurricanes: 7, Droughts: 2, Winter Storms: 2, Blizzard: 1, Freeze: 1, Ice Storm: 1, Snowfall: 1, Storm: 1, Tornado: 1, Other: 1 (Note: some incidents may be assigned to more than one category).
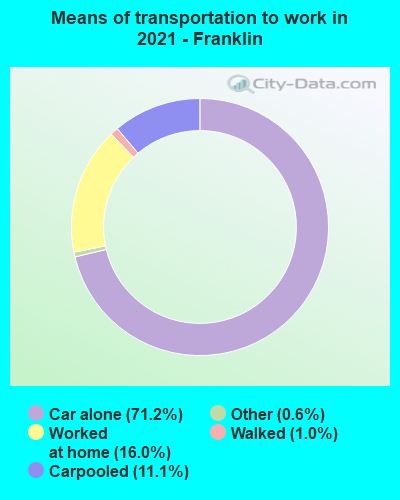
Means of transportation to work:
- Drove a car alone: 10,882 (65.5%)
- Carpooled: 1,794 (10.8%)
- Taxicab, motorcycle, or other means: 24 (0.1%)
- Walked: 124 (0.7%)
- Worked at home: 4,281 (25.8%)
- Health care and social assistance (18%)
- Retail trade (13%)
- Educational services (8%)
- Manufacturing (7%)
- Transportation and warehousing (5%)
- Administrative and support and waste management services (5%)
- Finance and insurance (5%)
- Health care and social assistance (22%)
- Retail trade (16%)
- Educational services (9%)
- Manufacturing (8%)
- Transportation and warehousing (6%)
- Administrative and support and waste management services (6%)
- Finance and insurance (6%)
- Management occupations (13%)
- Installation, maintenance, and repair occupations (12%)
- Construction and extraction occupations (12%)
- Sales and related occupations (10%)
- Food preparation and serving related occupations (7%)
- Office and administrative support occupations (6%)
- Computer and mathematical occupations (5%)
- Office and administrative support occupations (18%)
- Sales and related occupations (14%)
- Management occupations (11%)
- Health diagnosing and treating practitioners and other technical occupations (9%)
- Business and financial operations occupations (7%)
- Educational instruction, and library occupations (7%)
- Personal care and service occupations (6%)
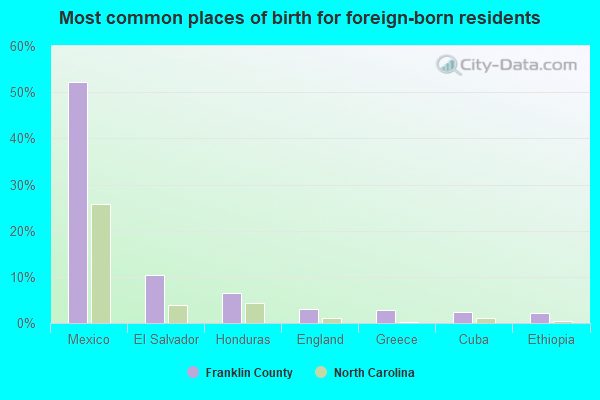
- Mexico (49%)
- Honduras (8%)
- England (5%)
- Germany (3%)
- Ethiopia (2%)
- Cuba (2%)
- Greece (1%)
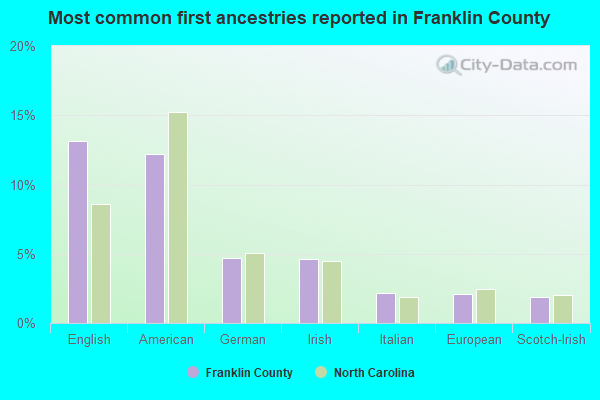
- English (13%)
- American (12%)
- German (6%)
- Irish (5%)
- Italian (2%)
- European (2%)
- Scotch-Irish (1%)
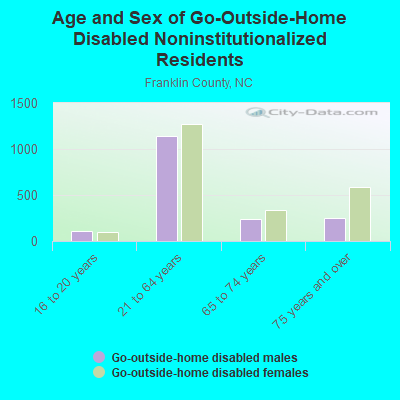
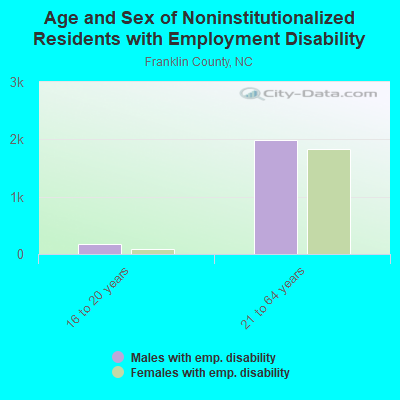
People in group quarters in Franklin County, North Carolina in 2010:
- 519 people in college/university student housing
- 473 people in state prisons
- 408 people in nursing facilities/skilled-nursing facilities
- 153 people in local jails and other municipal confinement facilities
- 41 people in group homes intended for adults
- 17 people in residential treatment centers for adults
- 12 people in workers' group living quarters and job corps centers
- 10 people in residential treatment centers for juveniles (non-correctional)
- 5 people in group homes for juveniles (non-correctional)
- 2 people in correctional residential facilities
People in group quarters in Franklin County, North Carolina in 2000:
- 386 people in state prisons
- 380 people in nursing homes
- 281 people in college dormitories (includes college quarters off campus)
- 96 people in other noninstitutional group quarters
- 94 people in local jails and other confinement facilities (including police lockups)
- 8 people in other group homes
- 6 people in homes for the mentally retarded
11.54% of this county's 2021 resident taxpayers lived in other counties in 2020 ($60,541 average adjusted gross income)
| Here: | 11.54% |
| North Carolina average: | 8.85% |
10 or fewer of this county's residents moved from foreign countries.
9.11% relocated from other counties in North Carolina ($46,395 average AGI)
2.43% relocated from other states ($14,146 average AGI)
Franklin County: 2.43% North Carolina average: 4.18%
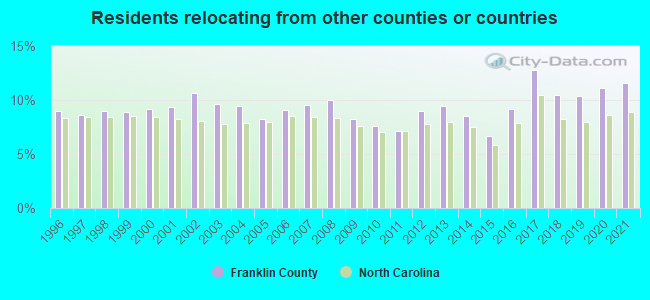
Top counties from which taxpayers relocated into this county between 2020 and 2021:
| from Wake County, NC | |
| from Vance County, NC | |
| from Granville County, NC | |
| from Durham County, NC | |
| from Nash County, NC | |
| from Johnston County, NC | |
| from Warren County, NC |
7.66% of this county's 2020 resident taxpayers moved to other counties in 2021 ($55,337 average adjusted gross income)
| Here: | 7.66% |
| North Carolina average: | 7.89% |
10 or fewer of this county's residents moved to foreign countries.
6.14% relocated to other counties in North Carolina ($43,873 average AGI)
1.51% relocated to other states ($11,464 average AGI)
Franklin County: 1.51% North Carolina average: 3.18%
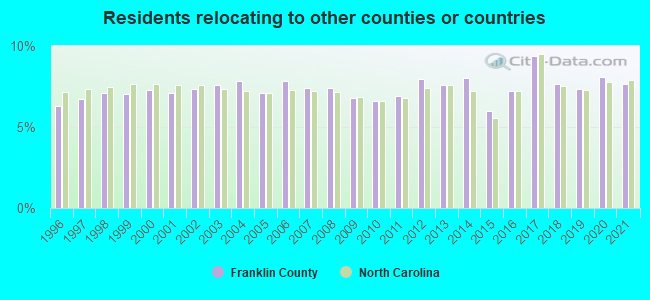
Top counties to which taxpayers relocated from this county between 2020 and 2021:
| to Wake County, NC | |
| to Granville County, NC | |
| to Nash County, NC | |
| to Vance County, NC | |
| to Johnston County, NC | |
| to Durham County, NC | |
| to Warren County, NC |
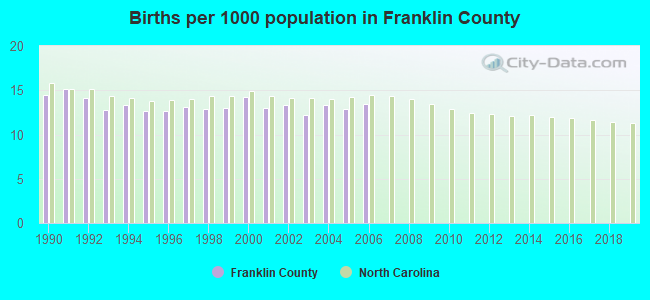
Births per 1000 population from 1990 to 1999: 13.4
Births per 1000 population from 2000 to 2006: 13.2
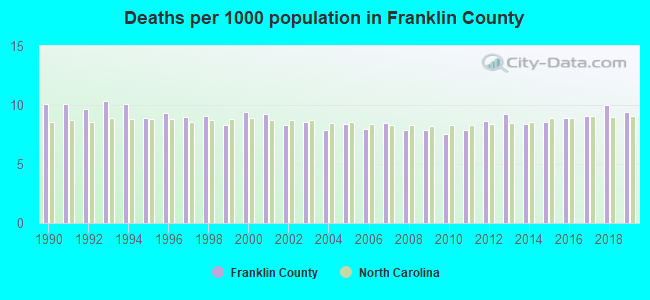
Deaths per 1000 population from 1990 to 1999: 9.5
Deaths per 1000 population from 2000 to 2009: 8.4
Deaths per 1000 population from 2010 to 2020: 8.9
Infant deaths per 1000 live births from 1990 to 1999: 10.9
Infant deaths per 1000 live births from 2000 to 2006: 7.9

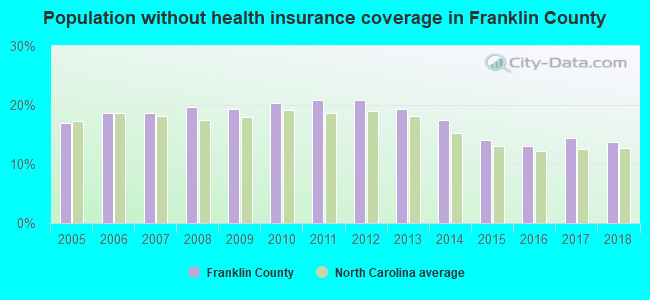
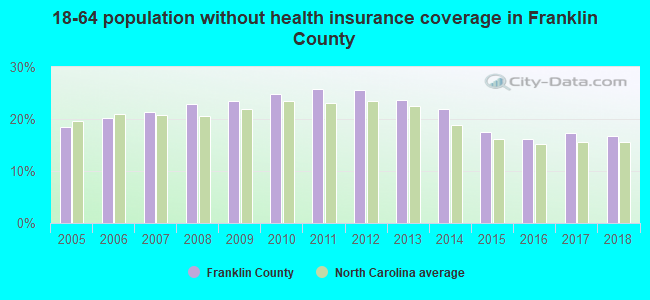
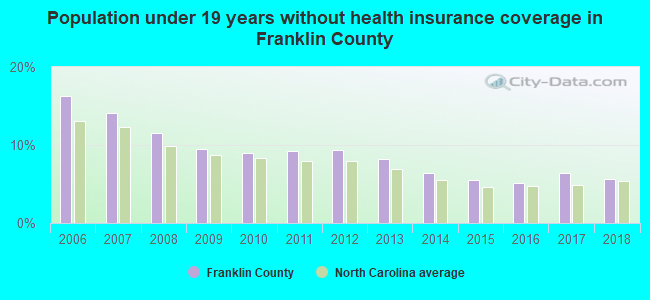
Persons under 19 years old without health insurance coverage in 2018: 5.7%
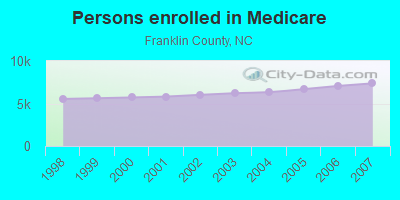
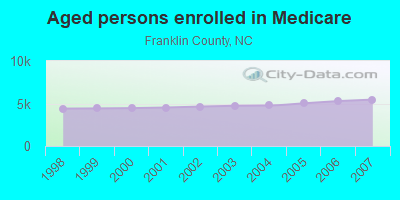
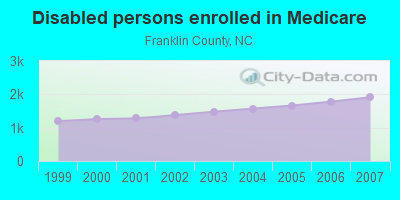
Persons enrolled in hospital insurance and/or supplemental medical insurance (Medicare) in July 1, 2007: 7,372 (5,460 aged, 1,912 disabled)
Children under 18 without health insurance coverage in 2007: 1,680 (11%)
Most common underlying causes of death in Franklin County, North Carolina in 1999 - 2019:
- Bronchus or lung, unspecified - Malignant neoplasms (756)
- Acute myocardial infarction, unspecified (558)
- Atherosclerotic heart disease (550)
- Chronic obstructive pulmonary disease, unspecified (427)
- Unspecified dementia (393)
- Stroke, not specified as haemorrhage or infarction (275)
- Congestive heart failure (160)
- Pneumonia, unspecified (157)
- Alzheimer disease, unspecified (130)
- Atherosclerotic cardiovascular disease, so described (95)
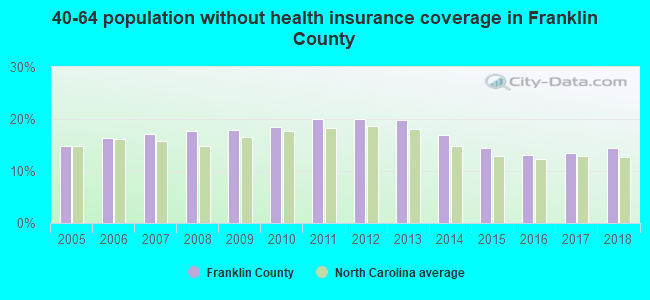
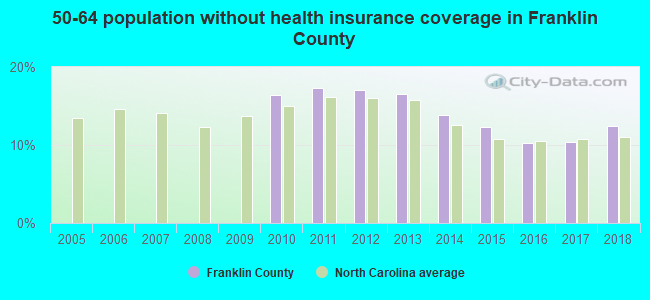
Population without health insurance coverage in 2000: 14%
Children under 18 without health insurance coverage in 2000: 12%
Short term general hospital admissions per 100,000 population in 2004: 4,897
Short term general hospital beds per 100,000 population in 2004: 105
Emergency room visits per 100,000 population in 2004: 37,227
General practice office based MDs per 100,000 population in 2005: 1,372
Medical specialist MDs per 100,000 population in 2005: 748
Dentists per 100,000 population in 1998: 7
Total births per 100,000 population, July 2005 - July 2006 : 16
Total deaths per 100,000 population, July 2005 - July 2006: 33
Limited-service eating places per 100,000 population in 2005 : 11
Beer, wine & liquor stores per 100,000 population in 2005: 1
Suicides per 1,000,000 population from 2000 to 2006: 146.7. This is more than state average.
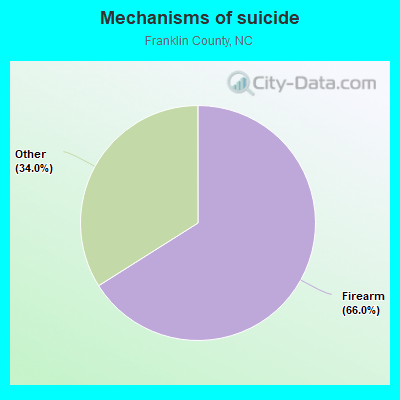
- Firearm - 96.9
- Other - 49.8
Household type by relationship:
Households: 74,539- Male householders: 13,906 (3,499 living alone), Female householders: 13,897 (4,203 living alone)
14,646 spouses (14,646 opposite-sex spouses), 1,643 unmarried partners, (1,581 opposite-sex unmarried partners), 23,165 children (21,567 natural, 0 adopted, 1,598 stepchildren), 502 grandchildren, 1,350 brothers or sisters, 2,056 parents, 0 foster children, 378 other relatives, 1,598 non-relatives
- In group quarters: 1,398
Size of family households: 8,473 2-persons, 3,966 3-persons, 5,033 4-persons, 984 5-persons, 449 6-persons, 54 7-or-more-persons.
Size of nonfamily households: 7,702 1-person, 1,054 2-persons, 88 3-persons.
9,795 married couples with children.
5,208 single-parent households (997 men, 4,211 women).
91.6% of residents of Franklin speak English at home.
6.3% of residents speak Spanish at home (56% speak English very well, 21% speak English well, 15% speak English not well, 9% don't speak English at all).
0.9% of residents speak other Indo-European language at home (79% speak English very well, 21% speak English well).
0.4% of residents speak Asian or Pacific Island language at home (61% speak English very well, 26% speak English well, 13% speak English not well).
0.5% of residents speak other language at home (77% speak English very well, 23% speak English well).
In fiscal year 2004:
Federal Government expenditure: $222,805,000 ($4,163 per capita)
Department of Defense expenditure: $5,894,000
Federal direct payments to individuals for retirement and disability: $97,556,000
Federal other direct payments to individuals: $49,405,000
Federal direct payments not to individuals: $1,997,000
Federal grants: $66,700,000
Federal procurement contracts: $1,829,000 ($231,000 Department of Defense)
Federal salaries and wages: $5,318,000 ($1,114,000 Department of Defense)
Federal Government direct loans: $930,000
Federal guaranteed/insured loans: $38,938,000
Federal Government insurance: $21,197,000
Population change from April 1, 2000 to July 1, 2005:
Births: 3,451| Here: | 63 per 1000 residents |
| State: | 72 per 1000 residents |
Deaths: 2,301
| Here: | 42 per 1000 residents |
| State: | 44 per 1000 residents |
Net international migration: +757
| Here: | +14 per 1000 residents |
| State: | +18 per 1000 residents |
Net internal migration: +5,324
| Here: | +98 per 1000 residents |
| State: | +27 per 1000 residents |
Total withdrawal of fresh water for public supply: 2.34 millions of gallons per day (12% from ground, 88% from surface)
| Here: | 6.4 |
| State: | 6.4 |
| Here: | 4.7 |
| State: | 4.4 |
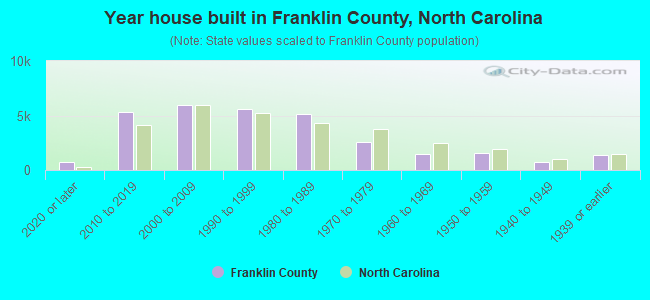
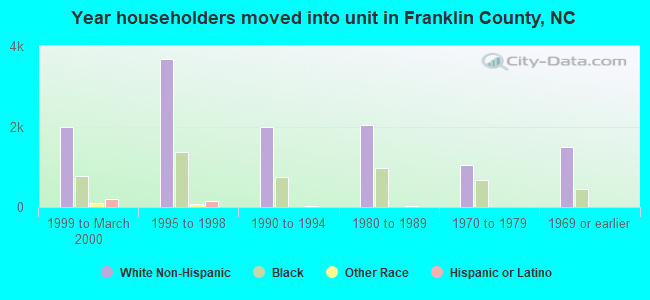
- Year house built in Franklin County, North Carolina
- 1,8592020 or later
- 6,4792010 to 2019
- 6,1902000 to 2009
- 5,2901990 to 1999
- 3,9301980 to 1989
- 2,2101970 to 1979
- 1,8161960 to 1969
- 1,2941950 to 1959
- 9251940 to 1949
- 1,7011939 or earlier
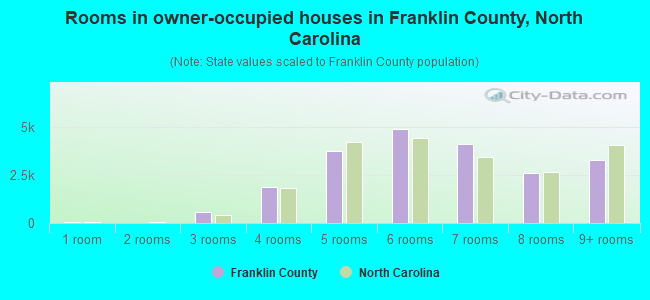
- Rooms in owner-occupied houses in Franklin County, North Carolina
- 1041 room
- 542 rooms
- 4383 rooms
- 1,4024 rooms
- 3,4755 rooms
- 6,2206 rooms
- 5,4867 rooms
- 3,0778 rooms
- 2,3379+ rooms
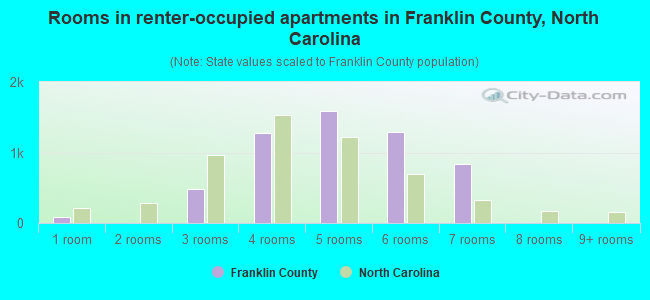
- Rooms in renter-occupied apartments in Franklin County, North Carolina
- 01 room
- 42 rooms
- 1,0273 rooms
- 1,3204 rooms
- 1,1865 rooms
- 7886 rooms
- 2957 rooms
- 4148 rooms
- 1769+ rooms
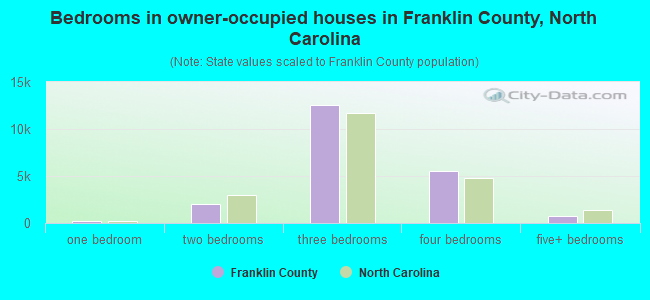
- Bedrooms in owner-occupied houses in Franklin County, North Carolina
- 104no bedroom
- 2151 bedroom
- 1,2242 bedrooms
- 15,9693 bedrooms
- 4,7964 bedrooms
- 2855+ bedrooms

- Bedrooms in renter-occupied apartments in Franklin County, North Carolina
- 11no bedroom
- 5481 bedroom
- 1,9732 bedrooms
- 2,1853 bedrooms
- 4934 bedrooms
- 05+ bedrooms
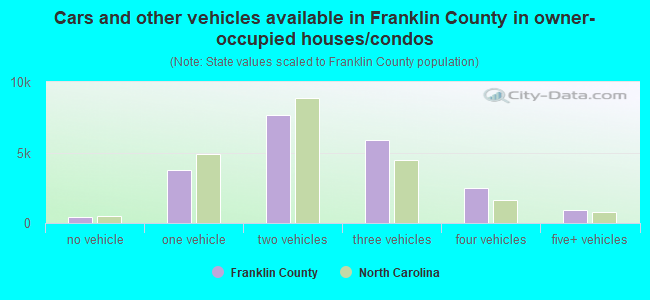
- Cars and other vehicles available in Franklin County in owner-occupied houses/condos
- 491no vehicle
- 5,2531 vehicle
- 10,6672 vehicles
- 3,8663 vehicles
- 1,6864 vehicles
- 6305+ vehicles
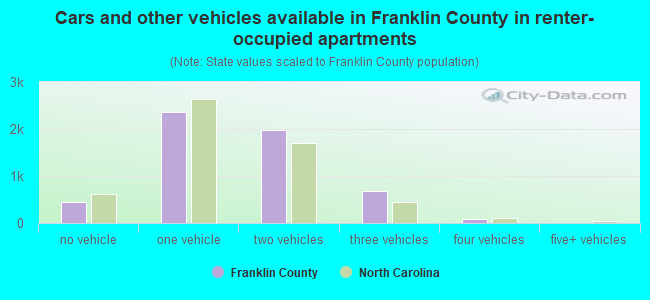
- Cars and other vehicles available in Franklin County in renter-occupied apartments
- 674no vehicle
- 1,9511 vehicle
- 1,1892 vehicles
- 8033 vehicles
- 1904 vehicles
- 4035+ vehicles
90.7% of Franklin County residents lived in the same house 1 years ago.
Out of people who lived in different houses, 23% lived in this county.
Out of people who lived in different counties, 75% lived in North Carolina.
| Franklin County: | 90.7% |
| State average: | 87.3% |
Place of birth for U.S.-born residents:
- This state: 47,113
- Other state: 23,310
- Northeast: 7,679
- Midwest: 3,324
- South: 9,877
- West: 2,430
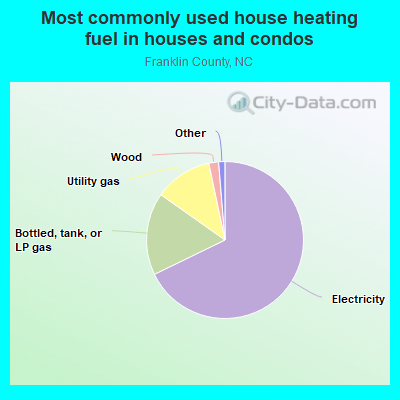
- 66.5%Electricity
- 17.6%Bottled, tank, or LP gas
- 13.0%Utility gas
- 1.7%Wood
- 0.7%Fuel oil, kerosene, etc.
- 0.4%No fuel used
- 0.1%Solar energy
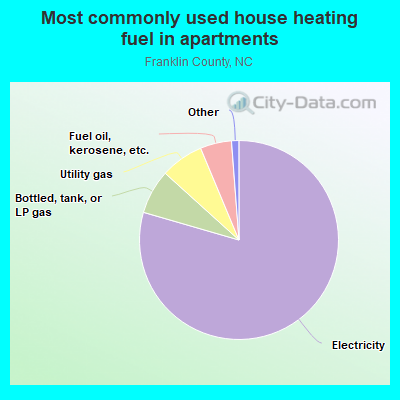
- 84.4%Electricity
- 7.3%Bottled, tank, or LP gas
- 4.8%Utility gas
- 2.4%Fuel oil, kerosene, etc.
- 0.9%Wood
- 0.2%No fuel used
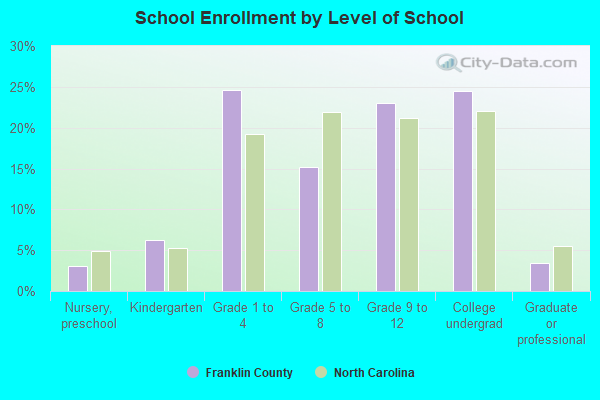
Private vs. public school enrollment:
| Here: | 20.1% |
| North Carolina: | 13.8% |
| Here: | 19.5% |
| North Carolina: | 11.9% |
| Here: | 21.6% |
| North Carolina: | 19.3% |

Franklin County government finances - Expenditure in 2018:
- Charges - Sewerage: $2,160,000
Sewerage: $1,972,000
Elementary and Secondary Education School Lunch: $1,408,000
Elementary and Secondary Education School Lunch: $740,000
Elementary and Secondary Education School Tuition and Transportation: $281,000
Elementary and Secondary Education School Tuition and Transportation: $252,000
Elementary and Secondary Education - Other: $47,000
Elementary and Secondary Education - Other: $44,000
Miscellaneous Commercial Activities: $4,000
Miscellaneous Commercial Activities: $4,000
- Construction - Elementary and Secondary Education: $1,714,000
Elementary and Secondary Education: $1,132,000
- Current Operations - Elementary and Secondary Education: $81,204,000
Elementary and Secondary Education: $77,472,000
Police Protection: $1,455,000
Police Protection: $1,445,000
Water Utilities: $1,213,000
Sewerage: $1,213,000
Sewerage: $1,179,000
Water Utilities: $1,179,000
Local Fire Protection: $710,000
Local Fire Protection: $682,000
Central Staff Services: $456,000
Regular Highways: $431,000
Central Staff Services: $373,000
Regular Highways: $344,000
General Public Buildings: $325,000
General Public Buildings: $321,000
Housing and Community Development: $259,000
Financial Administration: $212,000
Financial Administration: $179,000
Housing and Community Development: $92,000
Judicial and Legal Services: $88,000
Parks and Recreation: $81,000
Parks and Recreation: $79,000
Judicial and Legal Services: $72,000
General - Other: $55,000
General - Other: $46,000
Transit Utilities: $30,000
Transit Utilities: $15,000
- Federal Intergovernmental - Education: $567,000
Education: $434,000
Other: $68,000
- General - Interest on Debt: $1,739,000
Interest on Debt: $1,693,000
- Intergovernmental to Local - Other - Elementary and Secondary Education: $308,000
Other - Elementary and Secondary Education: $210,000
- Local Intergovernmental - Other: $2,000
Other: $2,000
- Long Term Debt - Beginning Outstanding - Unspecified Public Purpose: $9,672,000
Outstanding Unspecified Public Purpose: $8,719,000
Beginning Outstanding - Unspecified Public Purpose: $8,347,000
Outstanding Unspecified Public Purpose: $7,561,000
Retired Unspecified Public Purpose: $953,000
Retired Unspecified Public Purpose: $786,000
- Miscellaneous - General Revenue - Other: $1,166,000
General Revenue - Other: $467,000
Donations From Private Sources: $212,000
Fines and Forfeits: $193,000
Fines and Forfeits: $185,000
Interest Earnings: $77,000
Rents: $45,000
Donations From Private Sources: $40,000
Interest Earnings: $20,000
Sale of Property: $15,000
Rents: $12,000
Sale of Property: $1,000
- Other Capital Outlay - Elementary and Secondary Education: $384,000
Central Staff Services: $179,000
Regular Highways: $163,000
Local Fire Protection: $94,000
Police Protection: $77,000
Elementary and Secondary Education: $76,000
Police Protection: $35,000
Regular Highways: $23,000
General - Other: $12,000
- Other Funds - Cash and Securities: $12,741,000
Cash and Securities: $10,027,000
- Revenue - Water Utilities: $2,033,000
Water Utilities: $1,880,000
- State Intergovernmental - Education: $63,860,000
Education: $60,805,000
General Local Government Support: $502,000
General Local Government Support: $471,000
Highways: $211,000
Highways: $130,000
Other: $4,000
Other: $1,000
- Tax - Property: $22,350,000
Property: $17,765,000
General Sales and Gross Receipts: $964,000
Other License: $869,000
Other License: $836,000
General Sales and Gross Receipts: $759,000
Other Selective Sales: $109,000
Motor Vehicle License: $27,000
Motor Vehicle License: $26,000
Occupation and Business License - Other: $7,000
Occupation and Business License - Other: $6,000
Other Selective Sales: $4,000
- Total Salaries and Wages: $48,975,000
: $46,160,000
- Water Utilities - Interest on Debt: $100,000
Interest on Debt: $90,000
Franklin County government finances - Revenue in 2018:
- Charges - Sewerage: $2,160,000
Sewerage: $1,972,000
Elementary and Secondary Education School Lunch: $1,408,000
Elementary and Secondary Education School Lunch: $740,000
Elementary and Secondary Education School Tuition and Transportation: $281,000
Elementary and Secondary Education School Tuition and Transportation: $252,000
Elementary and Secondary Education - Other: $47,000
Elementary and Secondary Education - Other: $44,000
Miscellaneous Commercial Activities: $4,000
Miscellaneous Commercial Activities: $4,000
- Construction - Elementary and Secondary Education: $1,714,000
Elementary and Secondary Education: $1,132,000
- Current Operations - Elementary and Secondary Education: $81,204,000
Elementary and Secondary Education: $77,472,000
Police Protection: $1,455,000
Police Protection: $1,445,000
Water Utilities: $1,213,000
Sewerage: $1,213,000
Sewerage: $1,179,000
Water Utilities: $1,179,000
Local Fire Protection: $710,000
Local Fire Protection: $682,000
Central Staff Services: $456,000
Regular Highways: $431,000
Central Staff Services: $373,000
Regular Highways: $344,000
General Public Buildings: $325,000
General Public Buildings: $321,000
Housing and Community Development: $259,000
Financial Administration: $212,000
Financial Administration: $179,000
Housing and Community Development: $92,000
Judicial and Legal Services: $88,000
Parks and Recreation: $81,000
Parks and Recreation: $79,000
Judicial and Legal Services: $72,000
General - Other: $55,000
General - Other: $46,000
Transit Utilities: $30,000
Transit Utilities: $15,000
- Federal Intergovernmental - Education: $567,000
Education: $434,000
Other: $68,000
- General - Interest on Debt: $1,739,000
Interest on Debt: $1,693,000
- Intergovernmental to Local - Other - Elementary and Secondary Education: $308,000
Other - Elementary and Secondary Education: $210,000
- Local Intergovernmental - Other: $2,000
Other: $2,000
- Long Term Debt - Beginning Outstanding - Unspecified Public Purpose: $9,672,000
Outstanding Unspecified Public Purpose: $8,719,000
Beginning Outstanding - Unspecified Public Purpose: $8,347,000
Outstanding Unspecified Public Purpose: $7,561,000
Retired Unspecified Public Purpose: $953,000
Retired Unspecified Public Purpose: $786,000
- Miscellaneous - General Revenue - Other: $1,166,000
General Revenue - Other: $467,000
Donations From Private Sources: $212,000
Fines and Forfeits: $193,000
Fines and Forfeits: $185,000
Interest Earnings: $77,000
Rents: $45,000
Donations From Private Sources: $40,000
Interest Earnings: $20,000
Sale of Property: $15,000
Rents: $12,000
Sale of Property: $1,000
- Other Capital Outlay - Elementary and Secondary Education: $384,000
Central Staff Services: $179,000
Regular Highways: $163,000
Local Fire Protection: $94,000
Police Protection: $77,000
Elementary and Secondary Education: $76,000
Police Protection: $35,000
Regular Highways: $23,000
General - Other: $12,000
- Other Funds - Cash and Securities: $12,741,000
Cash and Securities: $10,027,000
- Revenue - Water Utilities: $2,033,000
Water Utilities: $1,880,000
- State Intergovernmental - Education: $63,860,000
Education: $60,805,000
General Local Government Support: $502,000
General Local Government Support: $471,000
Highways: $211,000
Highways: $130,000
Other: $4,000
Other: $1,000
- Tax - Property: $22,350,000
Property: $17,765,000
General Sales and Gross Receipts: $964,000
Other License: $869,000
Other License: $836,000
General Sales and Gross Receipts: $759,000
Other Selective Sales: $109,000
Motor Vehicle License: $27,000
Motor Vehicle License: $26,000
Occupation and Business License - Other: $7,000
Occupation and Business License - Other: $6,000
Other Selective Sales: $4,000
- Total Salaries and Wages: $48,975,000
: $46,160,000
- Water Utilities - Interest on Debt: $100,000
Interest on Debt: $90,000
Franklin County government finances - Debt in 2018:
- Charges - Sewerage: $2,160,000
Sewerage: $1,972,000
Elementary and Secondary Education School Lunch: $1,408,000
Elementary and Secondary Education School Lunch: $740,000
Elementary and Secondary Education School Tuition and Transportation: $281,000
Elementary and Secondary Education School Tuition and Transportation: $252,000
Elementary and Secondary Education - Other: $47,000
Elementary and Secondary Education - Other: $44,000
Miscellaneous Commercial Activities: $4,000
Miscellaneous Commercial Activities: $4,000
- Construction - Elementary and Secondary Education: $1,714,000
Elementary and Secondary Education: $1,132,000
- Current Operations - Elementary and Secondary Education: $81,204,000
Elementary and Secondary Education: $77,472,000
Police Protection: $1,455,000
Police Protection: $1,445,000
Water Utilities: $1,213,000
Sewerage: $1,213,000
Sewerage: $1,179,000
Water Utilities: $1,179,000
Local Fire Protection: $710,000
Local Fire Protection: $682,000
Central Staff Services: $456,000
Regular Highways: $431,000
Central Staff Services: $373,000
Regular Highways: $344,000
General Public Buildings: $325,000
General Public Buildings: $321,000
Housing and Community Development: $259,000
Financial Administration: $212,000
Financial Administration: $179,000
Housing and Community Development: $92,000
Judicial and Legal Services: $88,000
Parks and Recreation: $81,000
Parks and Recreation: $79,000
Judicial and Legal Services: $72,000
General - Other: $55,000
General - Other: $46,000
Transit Utilities: $30,000
Transit Utilities: $15,000
- Federal Intergovernmental - Education: $567,000
Education: $434,000
Other: $68,000
- General - Interest on Debt: $1,739,000
Interest on Debt: $1,693,000
- Intergovernmental to Local - Other - Elementary and Secondary Education: $308,000
Other - Elementary and Secondary Education: $210,000
- Local Intergovernmental - Other: $2,000
Other: $2,000
- Long Term Debt - Beginning Outstanding - Unspecified Public Purpose: $9,672,000
Outstanding Unspecified Public Purpose: $8,719,000
Beginning Outstanding - Unspecified Public Purpose: $8,347,000
Outstanding Unspecified Public Purpose: $7,561,000
Retired Unspecified Public Purpose: $953,000
Retired Unspecified Public Purpose: $786,000
- Miscellaneous - General Revenue - Other: $1,166,000
General Revenue - Other: $467,000
Donations From Private Sources: $212,000
Fines and Forfeits: $193,000
Fines and Forfeits: $185,000
Interest Earnings: $77,000
Rents: $45,000
Donations From Private Sources: $40,000
Interest Earnings: $20,000
Sale of Property: $15,000
Rents: $12,000
Sale of Property: $1,000
- Other Capital Outlay - Elementary and Secondary Education: $384,000
Central Staff Services: $179,000
Regular Highways: $163,000
Local Fire Protection: $94,000
Police Protection: $77,000
Elementary and Secondary Education: $76,000
Police Protection: $35,000
Regular Highways: $23,000
General - Other: $12,000
- Other Funds - Cash and Securities: $12,741,000
Cash and Securities: $10,027,000
- Revenue - Water Utilities: $2,033,000
Water Utilities: $1,880,000
- State Intergovernmental - Education: $63,860,000
Education: $60,805,000
General Local Government Support: $502,000
General Local Government Support: $471,000
Highways: $211,000
Highways: $130,000
Other: $4,000
Other: $1,000
- Tax - Property: $22,350,000
Property: $17,765,000
General Sales and Gross Receipts: $964,000
Other License: $869,000
Other License: $836,000
General Sales and Gross Receipts: $759,000
Other Selective Sales: $109,000
Motor Vehicle License: $27,000
Motor Vehicle License: $26,000
Occupation and Business License - Other: $7,000
Occupation and Business License - Other: $6,000
Other Selective Sales: $4,000
- Total Salaries and Wages: $48,975,000
: $46,160,000
- Water Utilities - Interest on Debt: $100,000
Interest on Debt: $90,000
Franklin County government finances - Cash and Securities in 2018:
- Charges - Sewerage: $2,160,000
Sewerage: $1,972,000
Elementary and Secondary Education School Lunch: $1,408,000
Elementary and Secondary Education School Lunch: $740,000
Elementary and Secondary Education School Tuition and Transportation: $281,000
Elementary and Secondary Education School Tuition and Transportation: $252,000
Elementary and Secondary Education - Other: $47,000
Elementary and Secondary Education - Other: $44,000
Miscellaneous Commercial Activities: $4,000
Miscellaneous Commercial Activities: $4,000
- Construction - Elementary and Secondary Education: $1,714,000
Elementary and Secondary Education: $1,132,000
- Current Operations - Elementary and Secondary Education: $81,204,000
Elementary and Secondary Education: $77,472,000
Police Protection: $1,455,000
Police Protection: $1,445,000
Water Utilities: $1,213,000
Sewerage: $1,213,000
Sewerage: $1,179,000
Water Utilities: $1,179,000
Local Fire Protection: $710,000
Local Fire Protection: $682,000
Central Staff Services: $456,000
Regular Highways: $431,000
Central Staff Services: $373,000
Regular Highways: $344,000
General Public Buildings: $325,000
General Public Buildings: $321,000
Housing and Community Development: $259,000
Financial Administration: $212,000
Financial Administration: $179,000
Housing and Community Development: $92,000
Judicial and Legal Services: $88,000
Parks and Recreation: $81,000
Parks and Recreation: $79,000
Judicial and Legal Services: $72,000
General - Other: $55,000
General - Other: $46,000
Transit Utilities: $30,000
Transit Utilities: $15,000
- Federal Intergovernmental - Education: $567,000
Education: $434,000
Other: $68,000
- General - Interest on Debt: $1,739,000
Interest on Debt: $1,693,000
- Intergovernmental to Local - Other - Elementary and Secondary Education: $308,000
Other - Elementary and Secondary Education: $210,000
- Local Intergovernmental - Other: $2,000
Other: $2,000
- Long Term Debt - Beginning Outstanding - Unspecified Public Purpose: $9,672,000
Outstanding Unspecified Public Purpose: $8,719,000
Beginning Outstanding - Unspecified Public Purpose: $8,347,000
Outstanding Unspecified Public Purpose: $7,561,000
Retired Unspecified Public Purpose: $953,000
Retired Unspecified Public Purpose: $786,000
- Miscellaneous - General Revenue - Other: $1,166,000
General Revenue - Other: $467,000
Donations From Private Sources: $212,000
Fines and Forfeits: $193,000
Fines and Forfeits: $185,000
Interest Earnings: $77,000
Rents: $45,000
Donations From Private Sources: $40,000
Interest Earnings: $20,000
Sale of Property: $15,000
Rents: $12,000
Sale of Property: $1,000
- Other Capital Outlay - Elementary and Secondary Education: $384,000
Central Staff Services: $179,000
Regular Highways: $163,000
Local Fire Protection: $94,000
Police Protection: $77,000
Elementary and Secondary Education: $76,000
Police Protection: $35,000
Regular Highways: $23,000
General - Other: $12,000
- Other Funds - Cash and Securities: $12,741,000
Cash and Securities: $10,027,000
- Revenue - Water Utilities: $2,033,000
Water Utilities: $1,880,000
- State Intergovernmental - Education: $63,860,000
Education: $60,805,000
General Local Government Support: $502,000
General Local Government Support: $471,000
Highways: $211,000
Highways: $130,000
Other: $4,000
Other: $1,000
- Tax - Property: $22,350,000
Property: $17,765,000
General Sales and Gross Receipts: $964,000
Other License: $869,000
Other License: $836,000
General Sales and Gross Receipts: $759,000
Other Selective Sales: $109,000
Motor Vehicle License: $27,000
Motor Vehicle License: $26,000
Occupation and Business License - Other: $7,000
Occupation and Business License - Other: $6,000
Other Selective Sales: $4,000
- Total Salaries and Wages: $48,975,000
: $46,160,000
- Water Utilities - Interest on Debt: $100,000
Interest on Debt: $90,000
Supplemental Security Income (SSI) in 2006:
- Total number of recipients: 1,456
- Number of aged recipients: 246
- Number of blind and disabled recipients: 1,210
- Number of recipients under 18: 217
- Number of recipients between 18 and 64: 754
- Number of recipients older than 64: 485
- Number of recipients also receiving OASDI: 718
- Amount of payments (thousands of dollars): 573
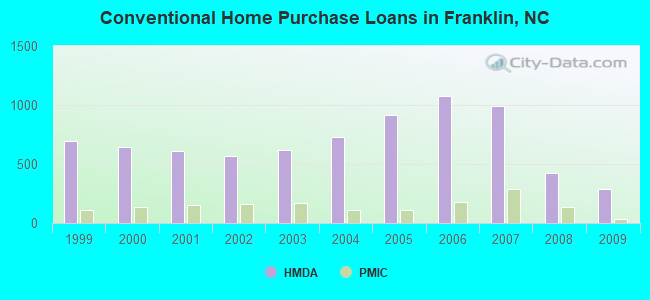
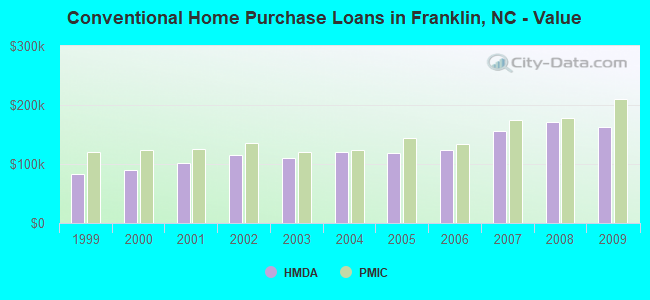
| Home Mortgage Disclosure Act Aggregated Statistics For Year 2009 (Based on 8 full tracts) | ||||||||||||||
| A) FHA, FSA/RHS & VA Home Purchase Loans | B) Conventional Home Purchase Loans | C) Refinancings | D) Home Improvement Loans | E) Loans on Dwellings For 5+ Families | F) Non-occupant Loans on < 5 Family Dwellings (A B C & D) | G) Loans On Manufactured Home Dwelling (A B C & D) | ||||||||
|---|---|---|---|---|---|---|---|---|---|---|---|---|---|---|
| Number | Average Value | Number | Average Value | Number | Average Value | Number | Average Value | Number | Average Value | Number | Average Value | Number | Average Value | |
| LOANS ORIGINATED | 291 | $159,113 | 287 | $163,254 | 1,045 | $162,507 | 35 | $69,943 | 0 | $0 | 102 | $122,255 | 92 | $74,261 |
| APPLICATIONS APPROVED, NOT ACCEPTED | 19 | $164,895 | 12 | $141,667 | 82 | $154,841 | 7 | $52,857 | 0 | $0 | 10 | $174,700 | 10 | $57,700 |
| APPLICATIONS DENIED | 50 | $129,480 | 61 | $118,656 | 406 | $156,653 | 65 | $29,185 | 1 | $160,000 | 25 | $137,720 | 78 | $76,064 |
| APPLICATIONS WITHDRAWN | 38 | $151,579 | 43 | $127,674 | 292 | $156,863 | 6 | $26,500 | 0 | $0 | 20 | $121,300 | 25 | $87,480 |
| FILES CLOSED FOR INCOMPLETENESS | 7 | $147,714 | 15 | $130,733 | 82 | $165,049 | 2 | $68,000 | 0 | $0 | 2 | $148,000 | 4 | $89,000 |
| Private Mortgage Insurance Companies Aggregated Statistics For Year 2009 (Based on 8 full tracts) | ||||||
| A) Conventional Home Purchase Loans | B) Refinancings | C) Non-occupant Loans on < 5 Family Dwellings (A & B) | ||||
|---|---|---|---|---|---|---|
| Number | Average Value | Number | Average Value | Number | Average Value | |
| LOANS ORIGINATED | 37 | $209,324 | 40 | $203,125 | 2 | $151,500 |
| APPLICATIONS APPROVED, NOT ACCEPTED | 15 | $221,267 | 17 | $212,118 | 2 | $213,000 |
| APPLICATIONS DENIED | 7 | $162,714 | 11 | $272,182 | 2 | $132,000 |
| APPLICATIONS WITHDRAWN | 4 | $148,250 | 2 | $232,000 | 0 | $0 |
| FILES CLOSED FOR INCOMPLETENESS | 0 | $0 | 0 | $0 | 0 | $0 |
| Most common first names in Franklin County, NC among deceased individuals | ||
| Name | Count | Lived (average) |
|---|---|---|
| James | 336 | 71.2 years |
| Mary | 255 | 76.9 years |
| William | 254 | 72.2 years |
| John | 229 | 74.5 years |
| Robert | 191 | 69.5 years |
| Willie | 161 | 73.7 years |
| Annie | 161 | 81.3 years |
| Joseph | 119 | 68.7 years |
| George | 118 | 72.9 years |
| Thomas | 78 | 71.0 years |
| Most common last names in Franklin County, NC among deceased individuals | ||
| Last name | Count | Lived (average) |
|---|---|---|
| Perry | 304 | 75.3 years |
| Williams | 199 | 71.0 years |
| Harris | 160 | 74.2 years |
| Alston | 142 | 72.1 years |
| Jones | 140 | 72.1 years |
| Davis | 132 | 76.2 years |
| Gupton | 112 | 75.5 years |
| Smith | 108 | 75.5 years |
| Johnson | 98 | 77.9 years |
| Pearce | 96 | 76.8 years |
| Businesses in Franklin County, NC | ||||
| Name | Count | Name | Count | |
|---|---|---|---|---|
| Ace Hardware | 1 | Nike | 1 | |
| Advance Auto Parts | 2 | Pizza Hut | 1 | |
| AutoZone | 1 | RadioShack | 1 | |
| Burger King | 1 | Rite Aid | 1 | |
| CVS | 1 | Rue21 | 1 | |
| Curves | 2 | Sears | 1 | |
| Dairy Queen | 1 | Sprint Nextel | 1 | |
| Days Inn | 1 | Subway | 4 | |
| Domino's Pizza | 2 | Taco Bell | 1 | |
| Dunkin Donuts | 2 | U-Haul | 3 | |
| FedEx | 2 | U.S. Cellular | 1 | |
| Ford | 1 | UPS | 2 | |
| H&R Block | 1 | Waffle House | 1 | |
| Jones New York | 1 | Walgreens | 1 | |
| KFC | 1 | Walmart | 1 | |
| McDonald's | 1 | |||