Garrard County, Kentucky (KY)
County owner-occupied free and clear houses and condos in 2010: 1,767
County owner-occupied houses and condos in 2000: 4,385
Renter-occupied apartments: 1,490 (it was 1,356 in 2000)
| % of renters here: | 24% |
| State: | 31% |
Land area: 231 sq. mi.
Water area: 2.7 sq. mi.
Population density: 74 people per square mile (average).
Industries providing employment: Educational, health and social services (25.4%), Manufacturing (14.4%).
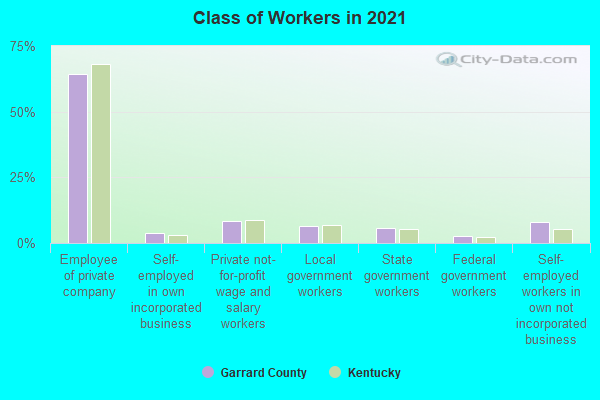
Type of workers:
- Private wage or salary: 76%
- Government: 18%
- Self-employed, not incorporated: 6%
- Unpaid family work: 0%
- OSM Map
- General Map
- Google Map
- MSN Map

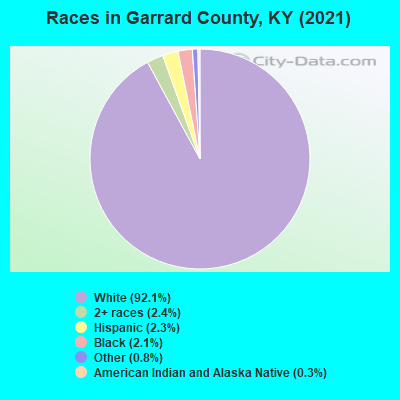
- 15,74591.7%White Non-Hispanic Alone
- 4372.5%Hispanic or Latino
- 3892.3%Black Non-Hispanic Alone
- 3882.3%Two or more races
- 1661.0%Some other race alone
- 440.3%American Indian and Alaska Native alone
| Median resident age: | 43.8 years |
| Kentucky median age: | 39.4 years |
| Males: 8,440 | |
| Females: 8,770 |

 | Where in KY would be best for what we're looking for? (23 replies) |
| Looking at Danville, KY as a retirement spot (43 replies) |
| Home Prices in Central Kentucky (21 replies) |
| Is Lexington Boring? Things to do Outdoors, Without Driving an Hour Away (15 replies) |
| Coming home. Looking for a homestead? (4 replies) |
| Help moving around Lexington (2 replies) |
| Garrard County: | 2.0 people |
| Kentucky: | 2 people |
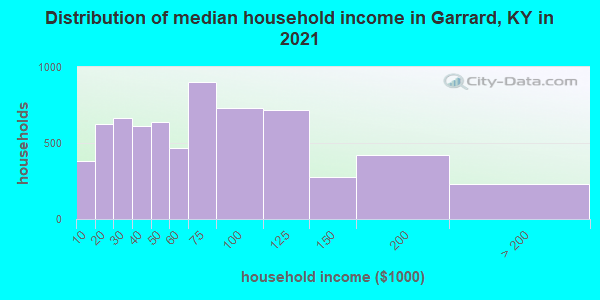
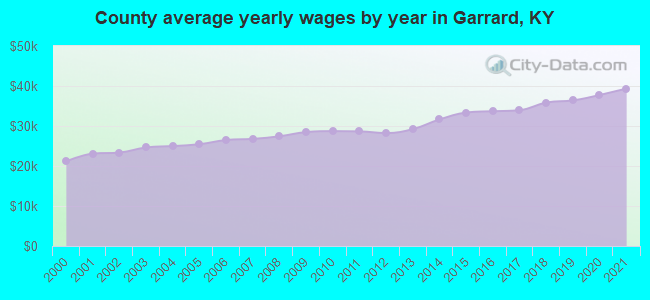
Estimated median household income in 2022: $57,447 ($34,284 in 1999)
| This county: | $57,447 |
| Kentucky: | $59,341 |
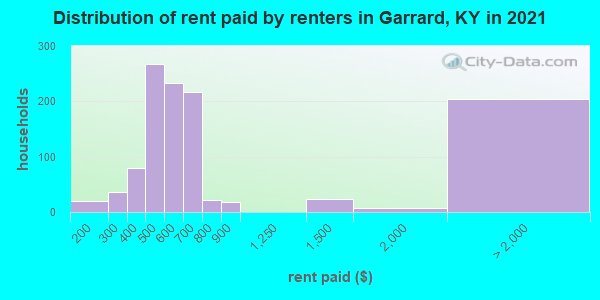
Median contract rent in 2022 for apartments: $599 (lower quartile is $489, upper quartile is $718)
| This county: | $599 |
| State: | $702 |
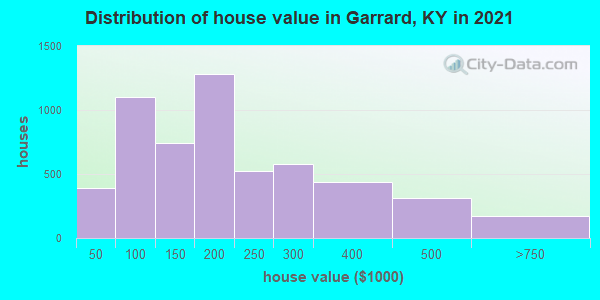
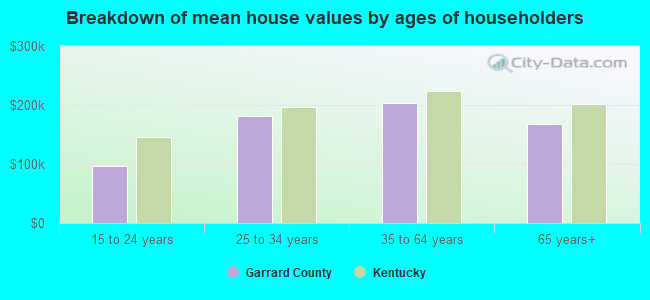
Estimated median house or condo value in 2022: $189,424 (it was $80,500 in 2000)
| Garrard: | $189,424 |
| Kentucky: | $196,300 |
Mean price in 2022:
Median monthly housing costs for homes and condos with a mortgage: $1,190Detached houses: $238,115
Here: $238,115 State: $256,452 Mobile homes: $84,167
Here: $84,167 State: $84,635
Median monthly housing costs for units without a mortgage: $429
Institutionalized population: 95
Crime in 2021 (reported by the sheriff's office or county police, not the county total):
- Murders: 0
- Rapes: 0
- Robberies: 0
- Assaults: 0
- Burglaries: 0
- Thefts: 0
- Auto thefts: 0
Crime in 2020 (reported by the sheriff's office or county police, not the county total):
- Murders: 0
- Rapes: 0
- Robberies: 0
- Assaults: 5
- Burglaries: 13
- Thefts: 30
- Auto thefts: 11
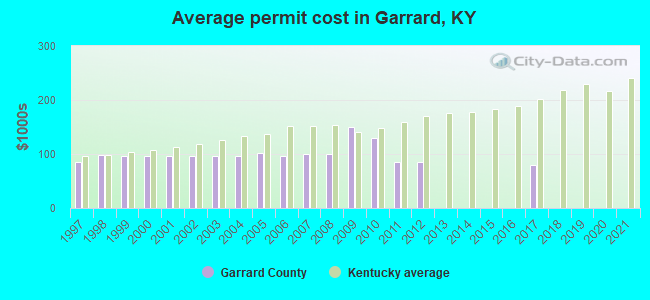
Single-family new house construction building permits:
- 2022: 0 buildings
- 2021: 0 buildings
- 2020: 0 buildings
- 2019: 0 buildings
- 2018: 0 buildings
- 2017: 5 buildings, average cost: $80,000
- 2016: 0 buildings
- 2015: 0 buildings
- 2014: 0 buildings
- 2013: 0 buildings
- 2012: 1 building, cost: $85,000
- 2011: 1 building, cost: $85,000
- 2010: 1 building, cost: $130,000
- 2009: 6 buildings, average cost: $150,000
- 2008: 2 buildings, average cost: $100,000
- 2007: 9 buildings, average cost: $100,000
- 2006: 10 buildings, average cost: $96,000
- 2005: 15 buildings, average cost: $102,400
- 2004: 12 buildings, average cost: $96,600
- 2003: 11 buildings, average cost: $96,600
- 2002: 10 buildings, average cost: $96,600
- 2001: 9 buildings, average cost: $96,600
- 2000: 9 buildings, average cost: $96,600
- 1999: 10 buildings, average cost: $96,600
- 1998: 14 buildings, average cost: $99,400
- 1997: 29 buildings, average cost: $85,900

Median real estate property taxes paid for housing units with mortgages in 2022: $1,524 (0.7%)
Median real estate property taxes paid for housing units with no mortgage in 2022: $1,180 (0.7%)
| Garrard County: | 16.0% |
| Kentucky: | 16.5% |
Median age of residents in 2022: 43.8 years old
(Males: 44.4 years old, Females: 43.3 years old)
(Median age for: White residents: 44.8 years old, Black residents: 35.7 years old, American Indian residents: 50.2 years old, Hispanic or Latino residents: 38.9 years old, Other race residents: 41.1 years old)
Fair market rent in 2006 for a 1-bedroom apartment in Garrard County is $407 a month.
Fair market rent for a 2-bedroom apartment is $488 a month.
Fair market rent for a 3-bedroom apartment is $583 a month.
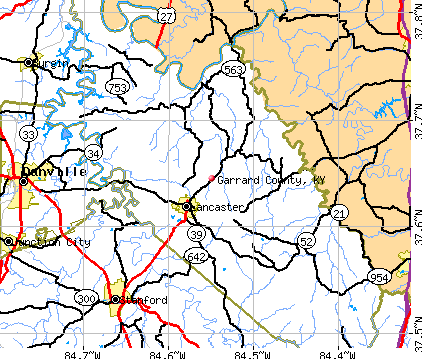
Cities in this county include: Bryantsville, Lancaster, Paint Lick.
Neighboring counties: Alameda County, California  , Fresno County, California , Campbell County, Virginia
  , Randolph County, Illinois , St. Francois County, Missouri , Union County .
| Here: | 3.6% |
| Kentucky: | 3.8% |

Current college students: 476
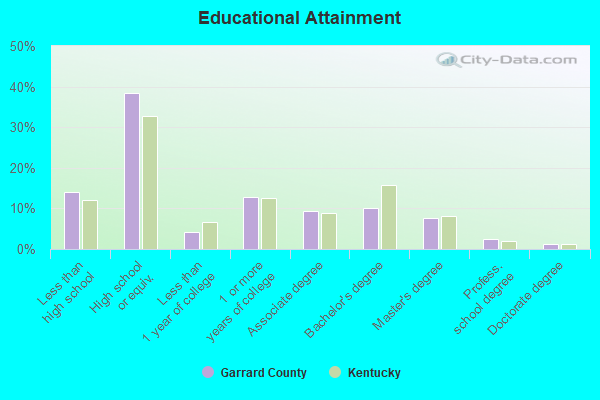
People 25 years of age or older with a high school degree or higher: 84.9%
People 25 years of age or older with a bachelor's degree or higher: 19.9%
Number of foreign born residents: 466 (39.4% naturalized citizens)
| Garrard County: | 2.7% |
| Whole state: | 4.0% |
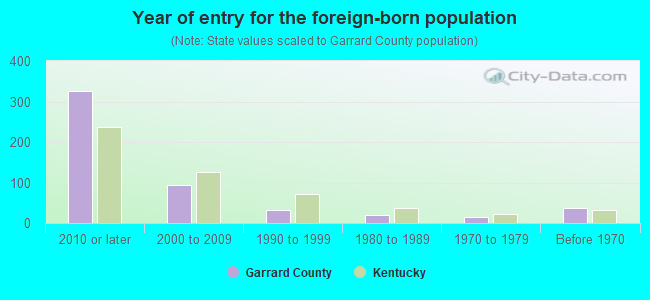
- Year of entry for the foreign-born population
- 2402010 or later
- 642000 to 2009
- 241990 to 1999
- 201980 to 1989
- 141970 to 1979
- 37Before 1970
Mean travel time to work (commute): " minutes
Percentage of county residents living and working in this county: 98.3%

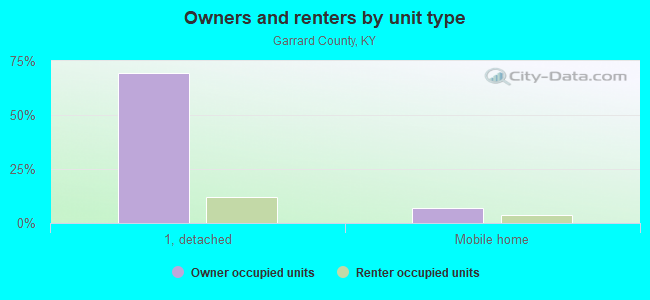
Housing units in structures:
- One, detached: 6,036
- One, attached: 76
- Two: 196
- 3 or 4: 145
- 5 to 9: 68
- 10 to 19: 5
- 50 or more: 8
- Mobile homes: 781
Housing units in Garrard County with a mortgage: 3,376 (405 second mortgage, 30 home equity loan, 285 both second mortgage and home equity loan)
Houses without a mortgage: 70
| Here: | 4.1% with mortgage |
| State: | 96.8% with mortgage |
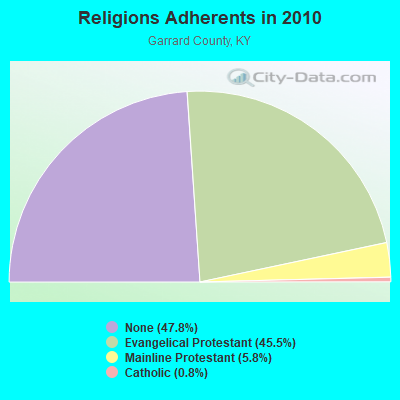
Religion statistics for Garrard County
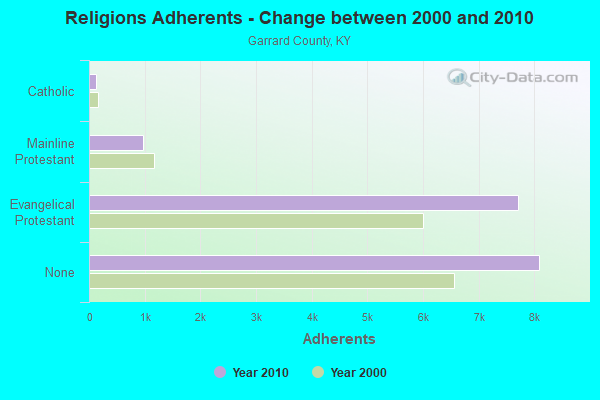
| Religion | Adherents | Congregations |
|---|---|---|
| Evangelical Protestant | 7,702 | 22 |
| Mainline Protestant | 973 | 11 |
| Catholic | 131 | 1 |
| Other | 15 | - |
| None | 8,091 | - |
Source: Clifford Grammich, Kirk Hadaway, Richard Houseal, Dale E.Jones, Alexei Krindatch, Richie Stanley and Richard H.Taylor. 2012. 2010 U.S.Religion Census: Religious Congregations & Membership Study. Association of Statisticians of American Religious Bodies. Jones, Dale E., et al. 2002. Congregations and Membership in the United States 2000. Nashville, TN: Glenmary Research Center.
Food Environment Statistics:
| Garrard County: | 2.35 / 10,000 pop. |
| State: | 2.19 / 10,000 pop. |
| This county: | 0.59 / 10,000 pop. |
| Kentucky: | 0.74 / 10,000 pop. |
| Garrard County: | 2.94 / 10,000 pop. |
| Kentucky: | 4.36 / 10,000 pop. |
| This county: | 1.77 / 10,000 pop. |
| State: | 5.74 / 10,000 pop. |
| Garrard County: | 11.7% |
| Kentucky: | 11.0% |
| Garrard County: | 30.7% |
| State: | 30.0% |
| Here: | 17.6% |
| State: | 15.9% |
Agriculture in Garrard County:
Average size of farms: 137 acresAverage value of agricultural products sold per farm: $24,281
Average value of crops sold per acre for harvested cropland: $184.26
The value of nursery, greenhouse, floriculture, and sod as a percentage of the total market value of agricultural products sold: 0.85%
The value of livestock, poultry, and their products as a percentage of the total market value of agricultural products sold: 70.62%
Average total farm production expenses per farm: $21,272
Harvested cropland as a percentage of land in farms: 28.16%
Irrigated harvested cropland as a percentage of land in farms: 0.12%
Average market value of all machinery and equipment per farm: $47,562
The percentage of farms operated by a family or individual: 89.81%
Average age of principal farm operators: 56 years
Average number of cattle and calves per 100 acres of all land in farms: 31.41
Milk cows as a percentage of all cattle and calves: 3.05%
Corn for grain: 1297 harvested acres
All wheat for grain: 414 harvested acres
Vegetables: 11 harvested acres
Land in orchards: 11 acres
Earthquake activity:
Garrard County-area historical earthquake activity is significantly above Kentucky state average. It is 81% greater than the overall U.S. average.On 7/27/1980 at 18:52:21, a magnitude 5.2 (5.1 MB, 4.7 MS, 5.0 UK, 5.2 UK, Class: Moderate, Intensity: VI - VII) earthquake occurred 51.0 miles away from Garrard County center
On 4/18/2008 at 09:36:59, a magnitude 5.4 (5.1 MB, 4.8 MS, 5.4 MW, 5.2 MW) earthquake occurred 190.1 miles away from the county center
On 9/7/1988 at 02:28:09, a magnitude 4.6 (4.5 MB, 4.6 LG, Class: Light, Intensity: IV - V) earthquake occurred 50.4 miles away from the county center
On 4/18/2008 at 09:36:59, a magnitude 5.2 (5.2 MW, Depth: 8.9 mi) earthquake occurred 190.1 miles away from the county center
On 6/18/2002 at 17:37:15, a magnitude 5.0 (4.3 MB, 4.6 MW, 5.0 LG) earthquake occurred 178.0 miles away from Garrard County center
On 6/10/1987 at 23:48:54, a magnitude 5.1 (4.9 MB, 4.4 MS, 4.6 MS, 5.1 LG) earthquake occurred 198.6 miles away from the county center
Magnitude types: regional Lg-wave magnitude (LG), body-wave magnitude (MB), surface-wave magnitude (MS), moment magnitude (MW)
Most recent natural disasters:
- Kentucky Covid-19 Pandemic, Incident Period: January 20, 2020, FEMA Id: 4497, Natural disaster type: Other
- Kentucky Severe Storms, Flooding, Mudslides, and Tornadoes, Incident Period: May 01, 2010 to June 01, 2010, Major Disaster (Presidential) Declared DR-1912: May 11, 2010, FEMA Id: 1912, Natural disaster type: Storm, Tornado, Mudslide, Flood
- Kentucky Severe Winter Storm, Incident Period: January 27, 2009 to February 05, 2009, Emergency Declared EM-3302: January 28, 2009, FEMA Id: 3302, Natural disaster type: Winter Storm
- Kentucky Severe Winter Storm and Flooding, Incident Period: January 26, 2009 to February 13, 2009, Major Disaster (Presidential) Declared DR-1818: February 05, 2009, FEMA Id: 1818, Natural disaster type: Winter Storm, Flood
- Kentucky Hurricane Katrina Evacuation, Incident Period: August 29, 2005 to October 01, 2005, Emergency Declared EM-3231: September 10, 2005, FEMA Id: 3231, Natural disaster type: Hurricane
- Kentucky Severe Storms, Tornadoes, Flooding, and Mudslides, Incident Period: May 26, 2004 to June 18, 2004, Major Disaster (Presidential) Declared DR-1523: June 10, 2004, FEMA Id: 1523, Natural disaster type: Storm, Tornado, Mudslide, Flood
- Kentucky Severe Storms, Flooding, Mud and Rock Slides, and Tornadoes, Incident Period: May 04, 2003 to May 27, 2003, Major Disaster (Presidential) Declared DR-1471: June 03, 2003, FEMA Id: 1471, Natural disaster type: Storm, Tornado, Flood
- Kentucky Severe Winter Storm, Incident Period: February 04, 1998 to February 06, 1998, Major Disaster (Presidential) Declared DR-1207: March 03, 1998, FEMA Id: 1207, Natural disaster type: Winter Storm
- Kentucky Blizzard, Incident Period: January 05, 1996 to January 12, 1996, Major Disaster (Presidential) Declared DR-1089: January 13, 1996, FEMA Id: 1089, Natural disaster type: Blizzard
- Kentucky Severe Storm, Freezing Rain, Sleet, Snow, Incident Period: February 09, 1994 to February 11, 1994, Major Disaster (Presidential) Declared DR-1018: March 16, 1994, FEMA Id: 1018, Natural disaster type: Storm, Freeze, Snow
- 1 other natural disasters have been reported since 1953.
The number of natural disasters in Garrard County (11) is smaller than the US average (15).
Major Disasters (Presidential) Declared: 7
Emergencies Declared: 3
Causes of natural disasters: Floods: 4, Storms: 4, Winter Storms: 4, Tornadoes: 3, Mudslides: 2, Blizzard: 1, Freeze: 1, Hurricane: 1, Snow: 1, Snowfall: 1, Other: 1 (Note: some incidents may be assigned to more than one category).

Means of transportation to work:
- Drove a car alone: 1,892 (61.1%)
- Carpooled: 367 (11.8%)
- Taxicab, motorcycle, or other means: 14 (0.5%)
- Walked: 10 (0.3%)
- Worked at home: 1,009 (32.6%)
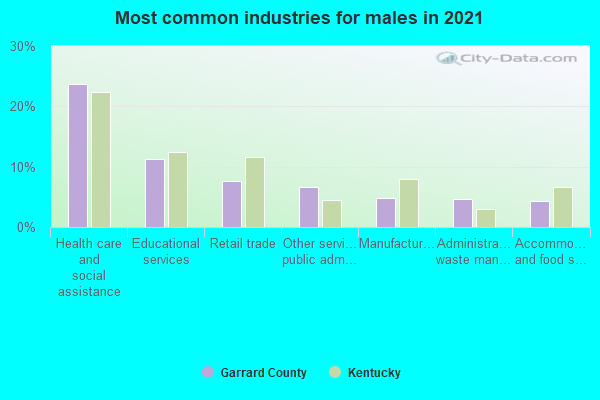
- Health care and social assistance (24%)
- Educational services (13%)
- Other services, except public administration (7%)
- Manufacturing (6%)
- Retail trade (6%)
- Administrative and support and waste management services (4%)
- Public administration (4%)
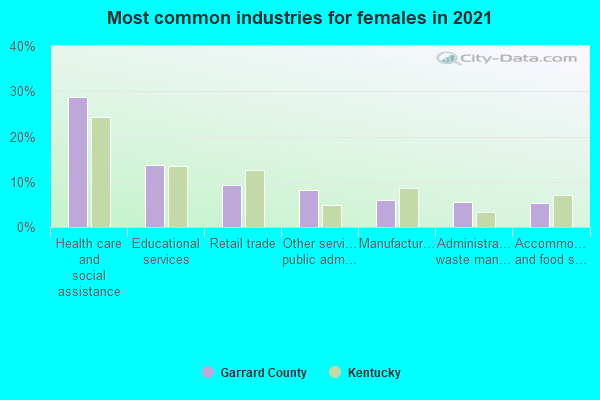
- Health care and social assistance (29%)
- Educational services (16%)
- Other services, except public administration (8%)
- Manufacturing (7%)
- Retail trade (7%)
- Administrative and support and waste management services (5%)
- Public administration (5%)
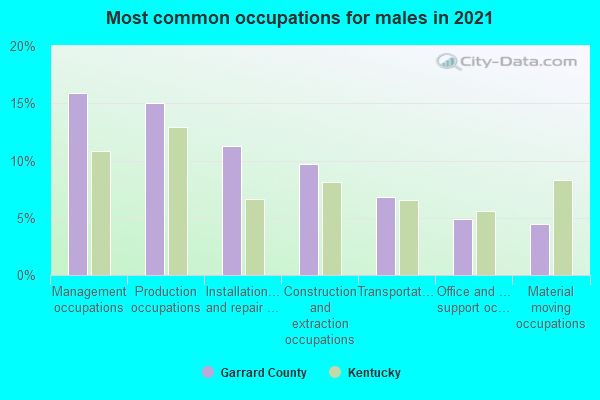
- Management occupations (15%)
- Production occupations (15%)
- Installation, maintenance, and repair occupations (10%)
- Construction and extraction occupations (9%)
- Transportation occupations (8%)
- Building and grounds cleaning and maintenance occupations (7%)
- Sales and related occupations (6%)
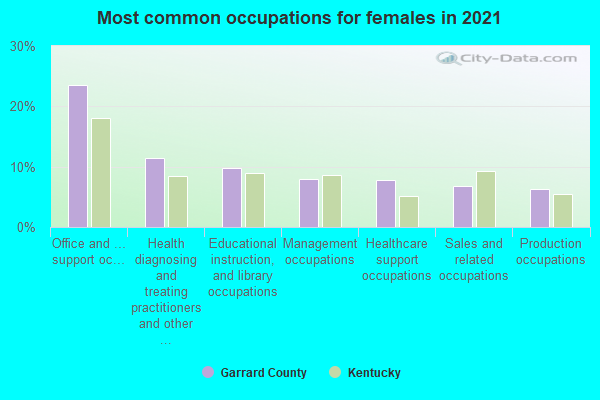
- Office and administrative support occupations (25%)
- Health diagnosing and treating practitioners and other technical occupations (11%)
- Educational instruction, and library occupations (10%)
- Management occupations (8%)
- Healthcare support occupations (8%)
- Production occupations (7%)
- Sales and related occupations (6%)

- Ukraine (40%)
- Argentina (36%)
- Brazil (9%)
- Mexico (7%)
- Thailand (4%)
- Guatemala (3%)
- Costa Rica (2%)
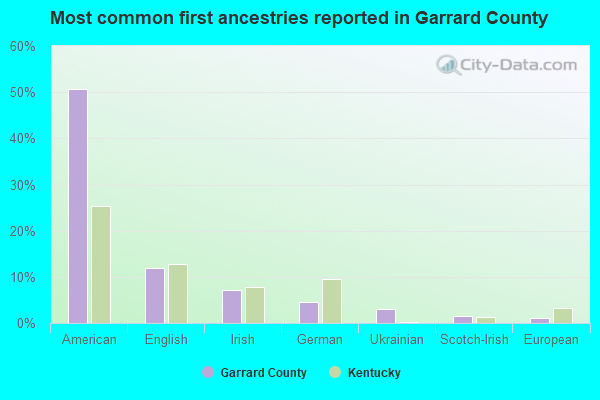
- American (54%)
- English (12%)
- Irish (6%)
- German (4%)
- European (2%)
- Brazilian (2%)
- Scotch-Irish (2%)
14 people in group homes intended for adults
People in group quarters in Garrard County, Kentucky in 2000:
- 92 people in nursing homes
- 4 people in agriculture workers' dormitories on farms
- 2 people in other group homes
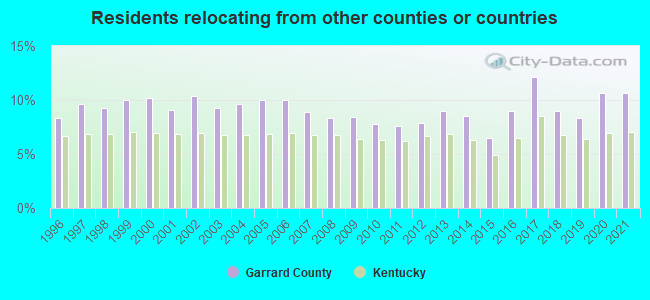
10.69% of this county's 2021 resident taxpayers lived in other counties in 2020 ($55,495 average adjusted gross income)
| Here: | 10.69% |
| Kentucky average: | 7.04% |
10 or fewer of this county's residents moved from foreign countries.
8.88% relocated from other counties in Kentucky ($45,770 average AGI)
1.81% relocated from other states ($9,725 average AGI)
Garrard County: 1.81% Kentucky average: 2.87%
Top counties from which taxpayers relocated into this county between 2020 and 2021:
| from Jessamine County, KY | |
| from Fayette County, KY | |
| from Madison County, KY | |
| from Boyle County, KY | |
| from Lincoln County, KY |
7.65% of this county's 2020 resident taxpayers moved to other counties in 2021 ($47,127 average adjusted gross income)
| Here: | 7.65% |
| Kentucky average: | 6.89% |
10 or fewer of this county's residents moved to foreign countries.
6.93% relocated to other counties in Kentucky ($41,694 average AGI)
0.72% relocated to other states ($5,430 average AGI)
Garrard County: 0.72% Kentucky average: 2.73%

Top counties to which taxpayers relocated from this county between 2020 and 2021:
| to Jessamine County, KY | |
| to Lincoln County, KY | |
| to Madison County, KY | |
| to Boyle County, KY | |
| to Fayette County, KY | |
| to Mercer County, KY |
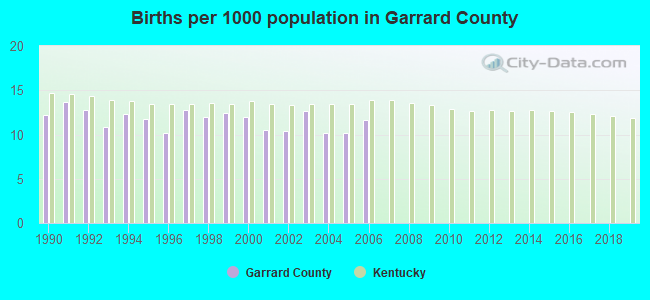
Births per 1000 population from 1990 to 1999: 12.1
Births per 1000 population from 2000 to 2006: 11.1
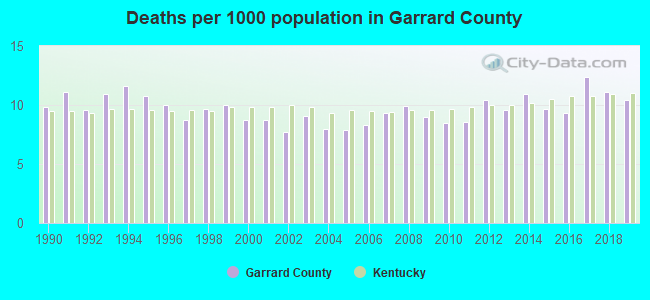
Deaths per 1000 population from 1990 to 1999: 10.2
Deaths per 1000 population from 2000 to 2009: 8.7
Deaths per 1000 population from 2010 to 2020: 10.4
Infant deaths per 1000 live births from 1990 to 1999: 6.7
Infant deaths per 1000 live births from 2000 to 2006: 6.5

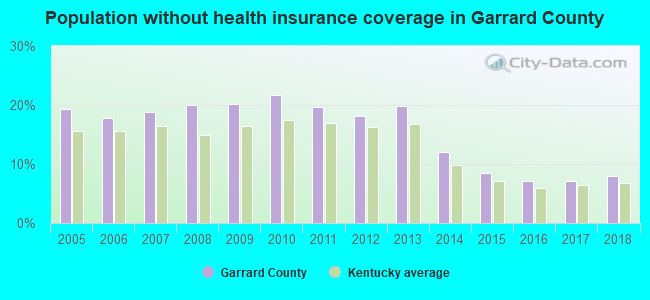
Persons under 19 years old without health insurance coverage in 2018: 4.5%

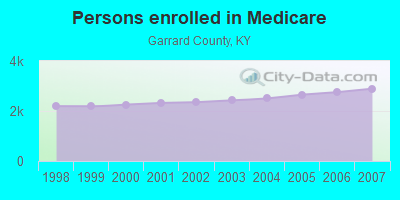
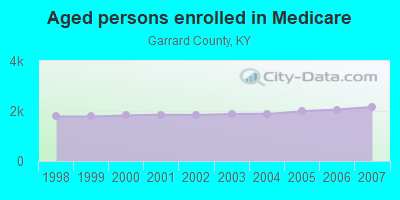
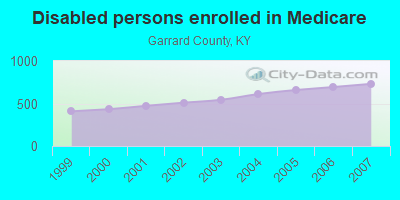
Persons enrolled in hospital insurance and/or supplemental medical insurance (Medicare) in July 1, 2007: 2,892 (2,161 aged, 731 disabled)
Children under 18 without health insurance coverage in 2007: 320 (8%)
Most common underlying causes of death in Garrard County, Kentucky in 1999 - 2019:
- Bronchus or lung, unspecified - Malignant neoplasms (258)
- Acute myocardial infarction, unspecified (160)
- Chronic obstructive pulmonary disease, unspecified (90)
- Atherosclerotic heart disease (48)
- Alzheimer disease, unspecified (27)
- Unspecified dementia (11)
Population without health insurance coverage in 2000: 14%
Children under 18 without health insurance coverage in 2000: 10%
Medical specialist MDs per 100,000 population in 2005: 820
Total births per 100,000 population, July 2005 - July 2006 : 36
Total deaths per 100,000 population, July 2005 - July 2006: 42
Crimes per 100,000 population in 1996: 1
Household type by relationship:
Households: 17,210- Male householders: 3,314 (787 living alone), Female householders: 3,383 (792 living alone)
3,842 spouses (3,831 opposite-sex spouses), 243 unmarried partners, (243 opposite-sex unmarried partners), 4,428 children (4,058 natural, 161 adopted, 209 stepchildren), 563 grandchildren, 137 brothers or sisters, 226 parents, 4 foster children, 312 other relatives, 570 non-relatives
- In group quarters: 125
Size of family households: 2,103 2-persons, 1,193 3-persons, 859 4-persons, 360 5-persons, 231 6-persons, 79 7-or-more-persons.
Size of nonfamily households: 1,580 1-person, 175 2-persons, 77 3-persons, 28 4-persons.
2,366 married couples with children.
702 single-parent households (114 men, 588 women).
95.9% of residents of Garrard speak English at home.
1.8% of residents speak Spanish at home (94% speak English very well, 6% speak English well).
2.1% of residents speak other Indo-European language at home (49% speak English very well, 31% speak English well, 19% speak English not well).
0.1% of residents speak Asian or Pacific Island language at home (100% speak English well).
In fiscal year 2004:
Federal Government expenditure: $68,940,000 ($4,265 per capita)
Department of Defense expenditure: $1,404,000
Federal direct payments to individuals for retirement and disability: $38,009,000
Federal other direct payments to individuals: $13,591,000
Federal direct payments not to individuals: $413,000
Federal grants: $14,566,000
Federal procurement contracts: $480,000 ($0,000 Department of Defense)
Federal salaries and wages: $1,880,000 ($0,000 Department of Defense)
Federal Government direct loans: $338,000
Federal guaranteed/insured loans: $8,111,000
Federal Government insurance: $3,210,000
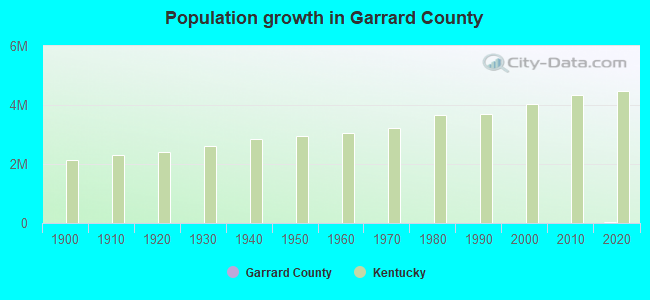
Population change from April 1, 2000 to July 1, 2005:
Births: 926| Here: | 56 per 1000 residents |
| State: | 69 per 1000 residents |
Deaths: 720
| Here: | 43 per 1000 residents |
| State: | 50 per 1000 residents |
Net international migration: +95
| Here: | +6 per 1000 residents |
| State: | +7 per 1000 residents |
Net internal migration: +1,513
| Here: | +91 per 1000 residents |
| State: | +8 per 1000 residents |
Total withdrawal of fresh water for public supply: 1.37 millions of gallons per day (all from surface)
| Here: | 6.2 |
| State: | 6.4 |
| Here: | 5.0 |
| State: | 4.4 |
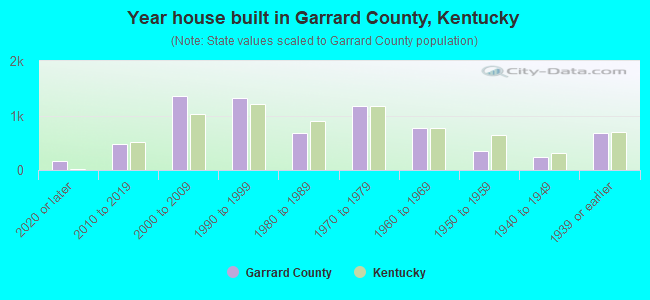
- Year house built in Garrard County, Kentucky
- 1522020 or later
- 6202010 to 2019
- 1,4152000 to 2009
- 1,3551990 to 1999
- 7461980 to 1989
- 1,0541970 to 1979
- 7621960 to 1969
- 3551950 to 1959
- 2041940 to 1949
- 6241939 or earlier
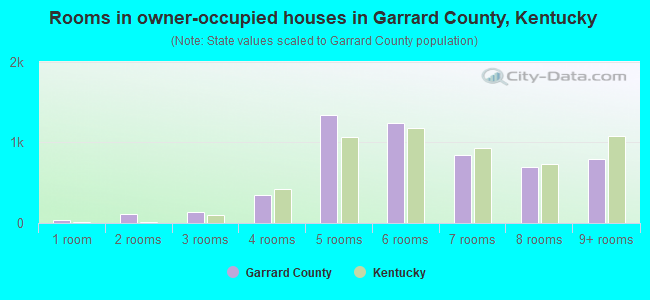
- Rooms in owner-occupied houses in Garrard County, Kentucky
- 201 room
- 1262 rooms
- 953 rooms
- 3304 rooms
- 1,2985 rooms
- 1,2486 rooms
- 7997 rooms
- 7318 rooms
- 8289+ rooms

- Rooms in renter-occupied apartments in Garrard County, Kentucky
- 131 room
- 02 rooms
- 1343 rooms
- 3224 rooms
- 3375 rooms
- 1836 rooms
- 1237 rooms
- 968 rooms
- 259+ rooms
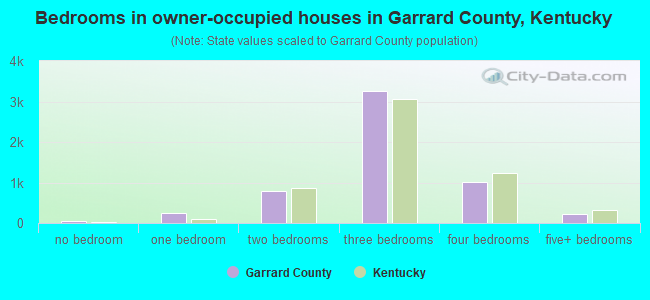
- Bedrooms in owner-occupied houses in Garrard County, Kentucky
- 19no bedroom
- 2221 bedroom
- 7302 bedrooms
- 3,2623 bedrooms
- 1,0804 bedrooms
- 1735+ bedrooms
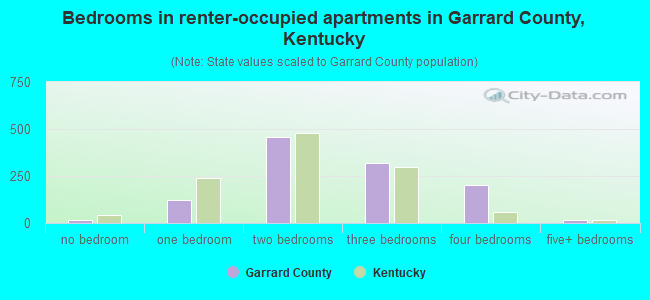
- Bedrooms in renter-occupied apartments in Garrard County, Kentucky
- 14no bedroom
- 1071 bedroom
- 5552 bedrooms
- 3473 bedrooms
- 2074 bedrooms
- 105+ bedrooms
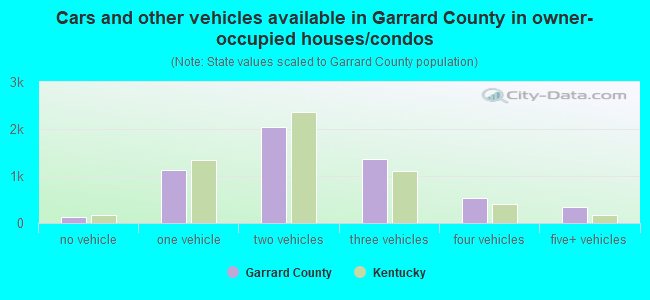
- Cars and other vehicles available in Garrard County in owner-occupied houses/condos
- 115no vehicle
- 1,1741 vehicle
- 2,0622 vehicles
- 1,3343 vehicles
- 4924 vehicles
- 2785+ vehicles
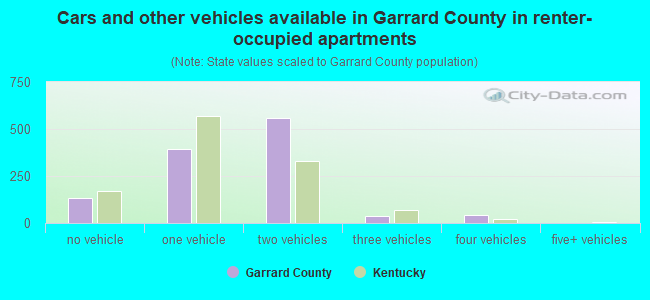
- Cars and other vehicles available in Garrard County in renter-occupied apartments
- 181no vehicle
- 4721 vehicle
- 4562 vehicles
- 793 vehicles
- 294 vehicles
- 265+ vehicles
91.4% of Garrard County residents lived in the same house 1 years ago.
Out of people who lived in different houses, 30% lived in this county.
Out of people who lived in different counties, 68% lived in Kentucky.
| Garrard County: | 91.4% |
| State average: | 87.2% |
Place of birth for U.S.-born residents:
- This state: 13,307
- Other state: 3,350
- Northeast: 502
- Midwest: 1,629
- South: 880
- West: 347
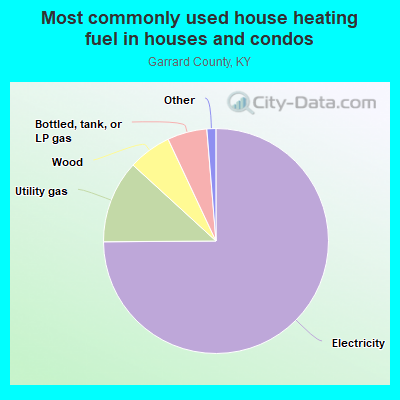
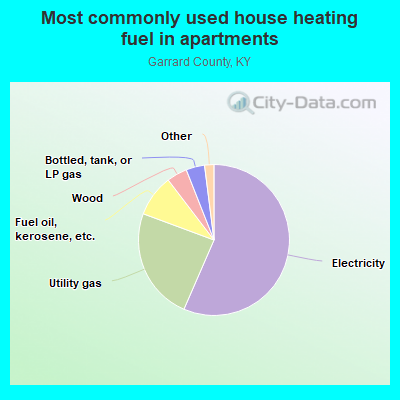
- 74.4%Electricity
- 11.8%Utility gas
- 6.4%Wood
- 6.0%Bottled, tank, or LP gas
- 0.5%Other fuel
- 0.4%Fuel oil, kerosene, etc.
- 0.3%Coal or coke
- 0.2%No fuel used
- 63.3%Electricity
- 21.6%Utility gas
- 7.6%Fuel oil, kerosene, etc.
- 3.7%Bottled, tank, or LP gas
- 2.0%Wood
- 1.0%Coal or coke
- 0.7%Other fuel
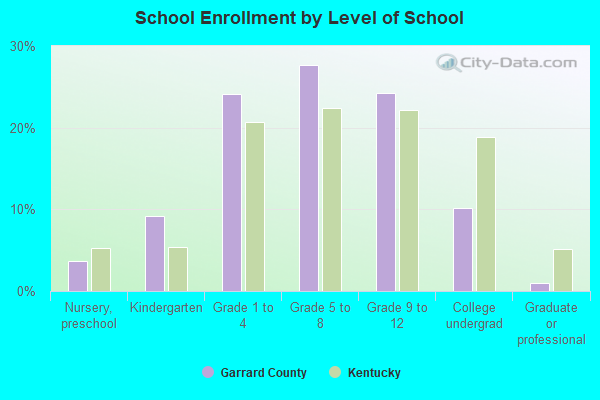
Private vs. public school enrollment:
| Here: | 14.4% |
| Kentucky: | 17.2% |
| Here: | 12.8% |
| Kentucky: | 15.2% |
| Here: | 5.4% |
| Kentucky: | 19.6% |

Garrard County government finances - Expenditure in 2017:
- Bond Funds - Cash and Securities: $223,000
- Charges - Other: $1,155,000
Hospital Public: $231,000
Solid Waste Management: $150,000
Parks and Recreation: $32,000
- Construction - Regular Highways: $72,000
- Current Operations - Health - Other: $1,979,000
General - Other: $1,412,000
Regular Highways: $1,180,000
Parks and Recreation: $732,000
General Public Buildings: $705,000
Central Staff Services: $351,000
Police Protection: $329,000
Solid Waste Management: $325,000
Judicial and Legal Services: $211,000
Financial Administration: $75,000
Correctional Institutions: $56,000
Protective Inspection and Regulation - Other: $4,000
Natural Resources - Other: $1,000
Public Welfare - Other: $1,000
- Federal Intergovernmental - Other: $1,138,000
Health and Hospitals: $273,000
- Intergovernmental to Local - Other - Correctional Institutions: $590,000
- Local Intergovernmental - Health and Hospitals: $350,000
Other: $5,000
- Long Term Debt - Beginning Outstanding - Unspecified Public Purpose: $15,683,000
Outstanding Unspecified Public Purpose: $14,485,000
Beginning Outstanding - Public Debt for Private Purpose: $3,289,000
Outstanding Nonguaranteed - Industrial Revenue: $3,184,000
Retired Unspecified Public Purpose: $1,198,000
Retired Nonguaranteed - Public Debt for Private Purpose: $105,000
- Miscellaneous - Donations From Private Sources: $118,000
Rents: $109,000
General Revenue - Other: $90,000
Interest Earnings: $1,000
- Other Capital Outlay - General - Other: $149,000
Regular Highways: $65,000
Solid Waste Management: $15,000
- Other Funds - Cash and Securities: $983,000
- Sinking Funds - Cash and Securities: $3,184,000
- State Intergovernmental - Highways: $1,160,000
Other: $730,000
Health and Hospitals: $249,000
General Local Government Support: $15,000
- Tax - Individual Income: $967,000
Property: $745,000
Public Utilities Sales: $66,000
Documentary and Stock Transfer: $63,000
Corporation License: $26,000
Occupation and Business License - Other: $15,000
Other License: $2,000
- Total Salaries and Wages: $1,849,000
Garrard County government finances - Revenue in 2017:
- Bond Funds - Cash and Securities: $223,000
- Charges - Other: $1,155,000
Hospital Public: $231,000
Solid Waste Management: $150,000
Parks and Recreation: $32,000
- Construction - Regular Highways: $72,000
- Current Operations - Health - Other: $1,979,000
General - Other: $1,412,000
Regular Highways: $1,180,000
Parks and Recreation: $732,000
General Public Buildings: $705,000
Central Staff Services: $351,000
Police Protection: $329,000
Solid Waste Management: $325,000
Judicial and Legal Services: $211,000
Financial Administration: $75,000
Correctional Institutions: $56,000
Protective Inspection and Regulation - Other: $4,000
Natural Resources - Other: $1,000
Public Welfare - Other: $1,000
- Federal Intergovernmental - Other: $1,138,000
Health and Hospitals: $273,000
- Intergovernmental to Local - Other - Correctional Institutions: $590,000
- Local Intergovernmental - Health and Hospitals: $350,000
Other: $5,000
- Long Term Debt - Beginning Outstanding - Unspecified Public Purpose: $15,683,000
Outstanding Unspecified Public Purpose: $14,485,000
Beginning Outstanding - Public Debt for Private Purpose: $3,289,000
Outstanding Nonguaranteed - Industrial Revenue: $3,184,000
Retired Unspecified Public Purpose: $1,198,000
Retired Nonguaranteed - Public Debt for Private Purpose: $105,000
- Miscellaneous - Donations From Private Sources: $118,000
Rents: $109,000
General Revenue - Other: $90,000
Interest Earnings: $1,000
- Other Capital Outlay - General - Other: $149,000
Regular Highways: $65,000
Solid Waste Management: $15,000
- Other Funds - Cash and Securities: $983,000
- Sinking Funds - Cash and Securities: $3,184,000
- State Intergovernmental - Highways: $1,160,000
Other: $730,000
Health and Hospitals: $249,000
General Local Government Support: $15,000
- Tax - Individual Income: $967,000
Property: $745,000
Public Utilities Sales: $66,000
Documentary and Stock Transfer: $63,000
Corporation License: $26,000
Occupation and Business License - Other: $15,000
Other License: $2,000
- Total Salaries and Wages: $1,849,000
Garrard County government finances - Debt in 2017:
- Bond Funds - Cash and Securities: $223,000
- Charges - Other: $1,155,000
Hospital Public: $231,000
Solid Waste Management: $150,000
Parks and Recreation: $32,000
- Construction - Regular Highways: $72,000
- Current Operations - Health - Other: $1,979,000
General - Other: $1,412,000
Regular Highways: $1,180,000
Parks and Recreation: $732,000
General Public Buildings: $705,000
Central Staff Services: $351,000
Police Protection: $329,000
Solid Waste Management: $325,000
Judicial and Legal Services: $211,000
Financial Administration: $75,000
Correctional Institutions: $56,000
Protective Inspection and Regulation - Other: $4,000
Natural Resources - Other: $1,000
Public Welfare - Other: $1,000
- Federal Intergovernmental - Other: $1,138,000
Health and Hospitals: $273,000
- Intergovernmental to Local - Other - Correctional Institutions: $590,000
- Local Intergovernmental - Health and Hospitals: $350,000
Other: $5,000
- Long Term Debt - Beginning Outstanding - Unspecified Public Purpose: $15,683,000
Outstanding Unspecified Public Purpose: $14,485,000
Beginning Outstanding - Public Debt for Private Purpose: $3,289,000
Outstanding Nonguaranteed - Industrial Revenue: $3,184,000
Retired Unspecified Public Purpose: $1,198,000
Retired Nonguaranteed - Public Debt for Private Purpose: $105,000
- Miscellaneous - Donations From Private Sources: $118,000
Rents: $109,000
General Revenue - Other: $90,000
Interest Earnings: $1,000
- Other Capital Outlay - General - Other: $149,000
Regular Highways: $65,000
Solid Waste Management: $15,000
- Other Funds - Cash and Securities: $983,000
- Sinking Funds - Cash and Securities: $3,184,000
- State Intergovernmental - Highways: $1,160,000
Other: $730,000
Health and Hospitals: $249,000
General Local Government Support: $15,000
- Tax - Individual Income: $967,000
Property: $745,000
Public Utilities Sales: $66,000
Documentary and Stock Transfer: $63,000
Corporation License: $26,000
Occupation and Business License - Other: $15,000
Other License: $2,000
- Total Salaries and Wages: $1,849,000
Garrard County government finances - Cash and Securities in 2017:
- Bond Funds - Cash and Securities: $223,000
- Charges - Other: $1,155,000
Hospital Public: $231,000
Solid Waste Management: $150,000
Parks and Recreation: $32,000
- Construction - Regular Highways: $72,000
- Current Operations - Health - Other: $1,979,000
General - Other: $1,412,000
Regular Highways: $1,180,000
Parks and Recreation: $732,000
General Public Buildings: $705,000
Central Staff Services: $351,000
Police Protection: $329,000
Solid Waste Management: $325,000
Judicial and Legal Services: $211,000
Financial Administration: $75,000
Correctional Institutions: $56,000
Protective Inspection and Regulation - Other: $4,000
Natural Resources - Other: $1,000
Public Welfare - Other: $1,000
- Federal Intergovernmental - Other: $1,138,000
Health and Hospitals: $273,000
- Intergovernmental to Local - Other - Correctional Institutions: $590,000
- Local Intergovernmental - Health and Hospitals: $350,000
Other: $5,000
- Long Term Debt - Beginning Outstanding - Unspecified Public Purpose: $15,683,000
Outstanding Unspecified Public Purpose: $14,485,000
Beginning Outstanding - Public Debt for Private Purpose: $3,289,000
Outstanding Nonguaranteed - Industrial Revenue: $3,184,000
Retired Unspecified Public Purpose: $1,198,000
Retired Nonguaranteed - Public Debt for Private Purpose: $105,000
- Miscellaneous - Donations From Private Sources: $118,000
Rents: $109,000
General Revenue - Other: $90,000
Interest Earnings: $1,000
- Other Capital Outlay - General - Other: $149,000
Regular Highways: $65,000
Solid Waste Management: $15,000
- Other Funds - Cash and Securities: $983,000
- Sinking Funds - Cash and Securities: $3,184,000
- State Intergovernmental - Highways: $1,160,000
Other: $730,000
Health and Hospitals: $249,000
General Local Government Support: $15,000
- Tax - Individual Income: $967,000
Property: $745,000
Public Utilities Sales: $66,000
Documentary and Stock Transfer: $63,000
Corporation License: $26,000
Occupation and Business License - Other: $15,000
Other License: $2,000
- Total Salaries and Wages: $1,849,000
Supplemental Security Income (SSI) in 2006:
- Total number of recipients: 629
- Number of aged recipients: 69
- Number of blind and disabled recipients: 560
- Number of recipients under 18: 98
- Number of recipients between 18 and 64: 384
- Number of recipients older than 64: 147
- Number of recipients also receiving OASDI: 247
- Amount of payments (thousands of dollars): 267
| Most common first names in Garrard County, KY among deceased individuals | ||
| Name | Count | Lived (average) |
|---|---|---|
| James | 96 | 73.0 years |
| William | 90 | 76.1 years |
| Mary | 88 | 78.1 years |
| Robert | 69 | 74.5 years |
| John | 65 | 76.0 years |
| Charles | 43 | 70.9 years |
| George | 41 | 74.1 years |
| Elizabeth | 31 | 79.5 years |
| Willie | 25 | 80.0 years |
| Clarence | 22 | 73.8 years |
| Most common last names in Garrard County, KY among deceased individuals | ||
| Last name | Count | Lived (average) |
|---|---|---|
| Ray | 70 | 76.5 years |
| Davis | 45 | 76.3 years |
| Clark | 42 | 76.5 years |
| Adams | 41 | 76.6 years |
| Naylor | 39 | 76.0 years |
| Sebastian | 33 | 82.2 years |
| Long | 33 | 76.4 years |
| Prewitt | 31 | 80.3 years |
| Murphy | 29 | 78.0 years |
| Anderson | 28 | 78.8 years |
| Businesses in Garrard County, KY | ||||
| Name | Count | Name | Count | |
|---|---|---|---|---|
| H&R Block | 1 | Subway | 1 | |
| McDonald's | 1 | U-Haul | 1 | |
| Nike | 1 | UPS | 1 | |
| Rite Aid | 1 | |||