Gasconade County, Missouri (MO)
County owner-occupied free and clear houses and condos in 2010: 2,136
County owner-occupied houses and condos in 2000: 4,955
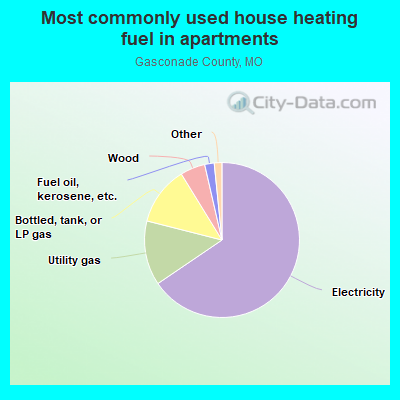
Renter-occupied apartments: 1,344 (it was 1,216 in 2000)
| % of renters here: | 20% |
| State: | 31% |
Land area: 521 sq. mi.
Water area: 5.4 sq. mi.
Population density: 29 people per square mile (low).
Industries providing employment: Manufacturing (22.0%), Educational, health and social services (19.7%), Retail trade (13.5%).
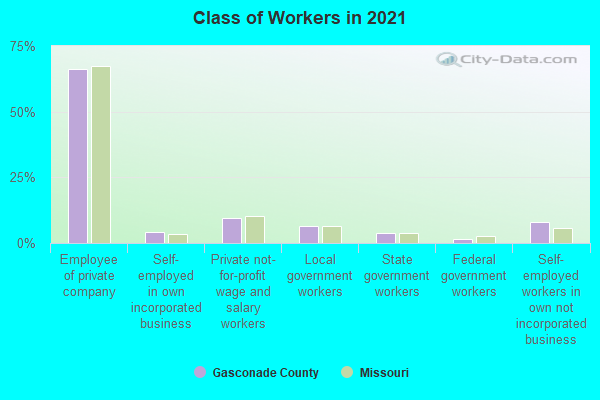
Type of workers:
- Private wage or salary: 79%
- Government: 12%
- Self-employed, not incorporated: 8%
- Unpaid family work: 0%
- OSM Map
- General Map
- Google Map
- MSN Map

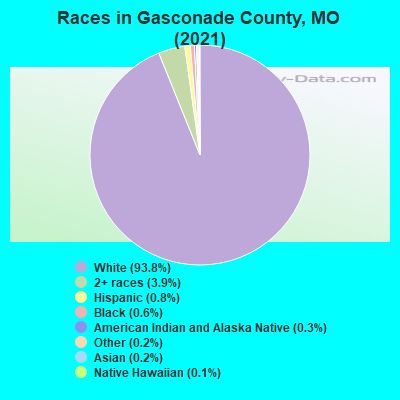
- 13,85793.6%White Non-Hispanic Alone
- 5884.0%Two or more races
- 1250.8%Hispanic or Latino
- 1230.8%Black Non-Hispanic Alone
- 560.4%Native Hawaiian and Other
Pacific Islander alone - 310.2%American Indian and Alaska Native alone
- 250.2%Asian alone
| Median resident age: | 46.7 years |
| Missouri median age: | 39.1 years |
| Males: 7,539 | |
| Females: 7,318 |

 | Is the ‘Midwesternness’ of Northern Missouri overstated? (99 replies) |
| Parts of Missouri that have an upstate NY feel/vibe? (22 replies) |
| Missouri Outlaw History (3407 replies) |
| Where in Missouri does the South begin? (507 replies) |
| Need suggestions for peaceful country setting/open spaces 2hr south of STL. (6 replies) |
| Where to move for pretty acreage within 1 1/2 hours of St. Louis (6 replies) |
| Gasconade County: | 2.0 people |
| Missouri: | 2 people |
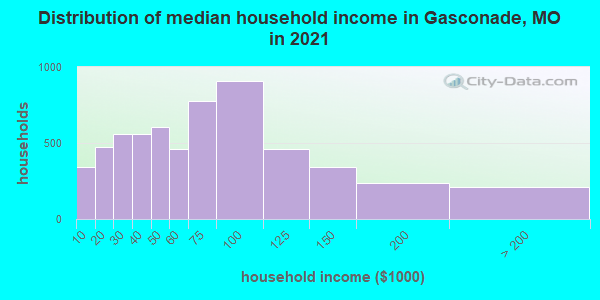
Estimated median household income in 2022: $61,584 ($35,047 in 1999)
| This county: | $61,584 |
| Missouri: | $64,811 |
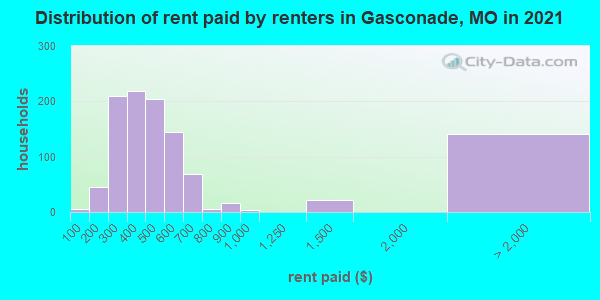
Median contract rent in 2022 for apartments: $461 (lower quartile is $306, upper quartile is $600)
| This county: | $461 |
| State: | $757 |
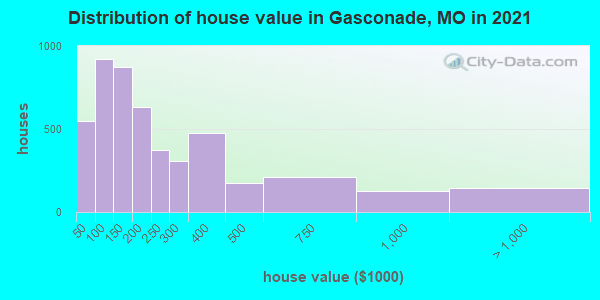
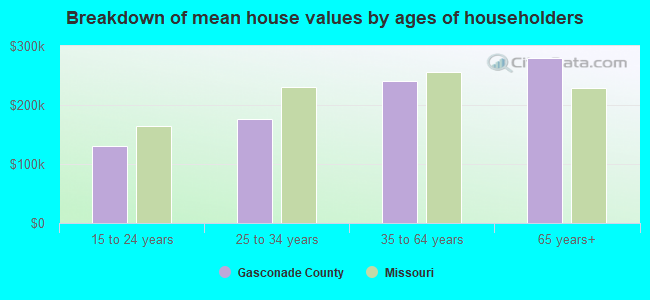
Estimated median house or condo value in 2022: $176,494 (it was $76,800 in 2000)
| Gasconade: | $176,494 |
| Missouri: | $221,200 |
Median monthly housing costs for homes and condos with a mortgage: $1,120
Median monthly housing costs for units without a mortgage: $422
Institutionalized population: 250
Crime in 2021 (reported by the sheriff's office or county police, not the county total):
- Murders: 0
- Rapes: 0
- Robberies: 0
- Assaults: 0
- Burglaries: 2
- Thefts: 8
- Auto thefts: 2
Crime in 2020 (reported by the sheriff's office or county police, not the county total):
- Murders: 0
- Rapes: 2
- Robberies: 2
- Assaults: 32
- Burglaries: 41
- Thefts: 58
- Auto thefts: 25
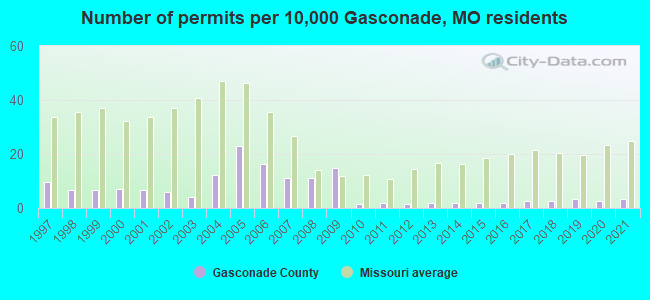
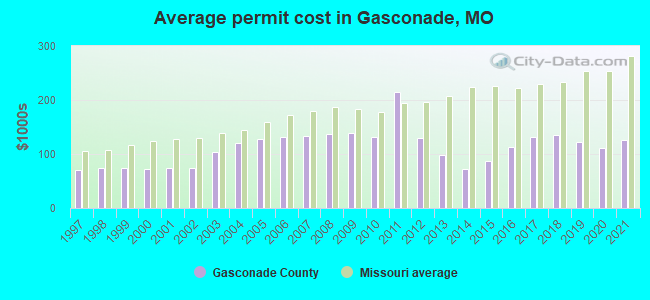
Single-family new house construction building permits:
- 2022: 3 buildings, average cost: $124,900
- 2021: 5 buildings, average cost: $126,400
- 2020: 4 buildings, average cost: $110,700
- 2019: 5 buildings, average cost: $122,000
- 2018: 4 buildings, average cost: $136,000
- 2017: 4 buildings, average cost: $131,900
- 2016: 3 buildings, average cost: $113,000
- 2015: 3 buildings, average cost: $87,200
- 2014: 3 buildings, average cost: $71,700
- 2013: 3 buildings, average cost: $97,700
- 2012: 2 buildings, average cost: $129,000
- 2011: 3 buildings, average cost: $214,200
- 2010: 2 buildings, average cost: $131,500
- 2009: 23 buildings, average cost: $137,700
- 2008: 17 buildings, average cost: $136,800
- 2007: 17 buildings, average cost: $133,500
- 2006: 25 buildings, average cost: $132,100
- 2005: 35 buildings, average cost: $127,500
- 2004: 19 buildings, average cost: $120,500
- 2003: 6 buildings, average cost: $103,800
- 2002: 9 buildings, average cost: $73,700
- 2001: 10 buildings, average cost: $73,700
- 2000: 11 buildings, average cost: $71,500
- 1999: 10 buildings, average cost: $73,700
- 1998: 10 buildings, average cost: $73,700
- 1997: 15 buildings, average cost: $71,300
Median real estate property taxes paid for housing units with mortgages in 2022: $1,239 (0.7%)
Median real estate property taxes paid for housing units with no mortgage in 2022: $1,170 (0.7%)
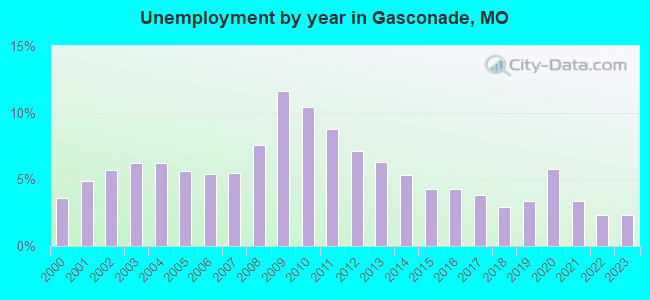
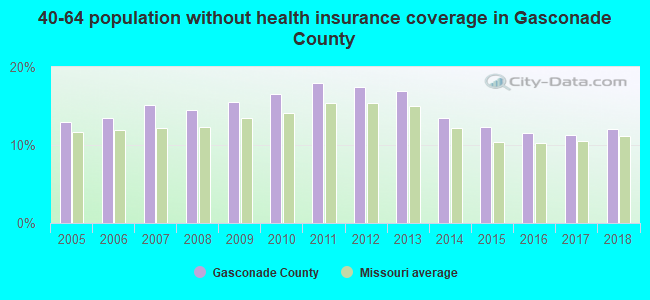
| Gasconade County: | 12.2% |
| Missouri: | 13.2% |
Median age of residents in 2022: 46.7 years old
(Males: 44.8 years old, Females: 48.0 years old)
(Median age for: White residents: 46.8 years old, Black residents: 60.8 years old, American Indian residents: 45.9 years old, Asian residents: 69.7 years old, Hispanic or Latino residents: 28.6 years old)
Fair market rent in 2006 for a 1-bedroom apartment in Gasconade County is $358 a month.
Fair market rent for a 2-bedroom apartment is $464 a month.
Fair market rent for a 3-bedroom apartment is $581 a month.
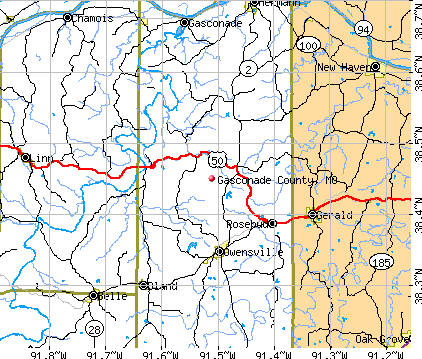
Cities in this county include: Hermann, Owensville, Bland, Rosebud, Gasconade, Morrison.
Neighboring counties: Arapahoe County, Colorado  , Arlington County, Virginia
  , Coffey County, Kansas , Jackson County, West Virginia , Mercer County, West Virginia , Dent County
  , Greene County, Virginia , James City County, Virginia , Upshur County, West Virginia .
| Here: | 2.5% |
| Missouri: | 2.8% |
Current college students: 322
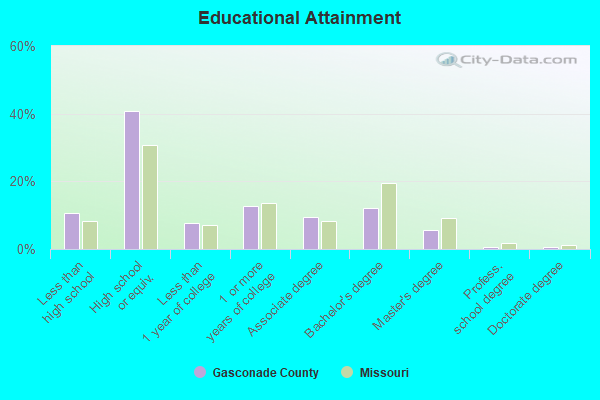
People 25 years of age or older with a high school degree or higher: 88.9%
People 25 years of age or older with a bachelor's degree or higher: 19.3%
Number of foreign born residents: 92 (81.5% naturalized citizens)
| Gasconade County: | 0.6% |
| Whole state: | 4.1% |
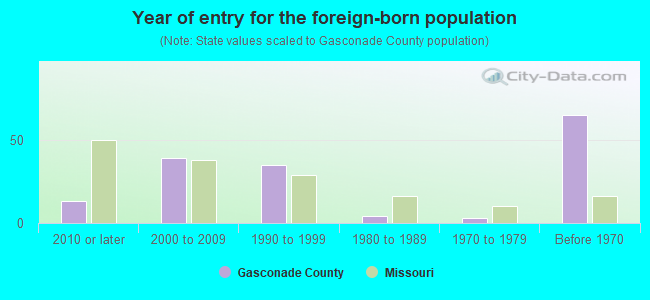
- Year of entry for the foreign-born population
- 142010 or later
- 132000 to 2009
- 251990 to 1999
- 41980 to 1989
- 31970 to 1979
- 65Before 1970
Mean travel time to work (commute): minutes
Percentage of county residents living and working in this county: 99.9%

Housing units in structures:
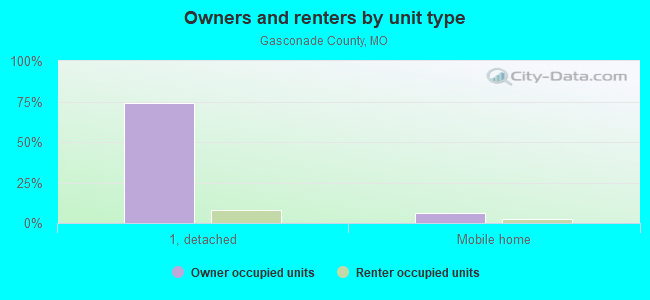
- One, detached: 6,014
- One, attached: 65
- Two: 137
- 3 or 4: 221
- 5 to 9: 187
- 10 to 19: 11
- 20 to 49: 37
- 50 or more: 18
- Mobile homes: 907
- Boats, RVs, vans, etc.: 36
Housing units in Gasconade County with a mortgage: 2,467 (227 second mortgage, 2 home equity loan, 196 both second mortgage and home equity loan)
Houses without a mortgage: 77
| Here: | 2.5% with mortgage |
| State: | 98.0% with mortgage |
Religion statistics for Gasconade County
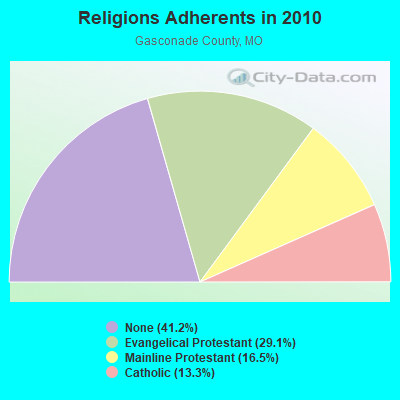
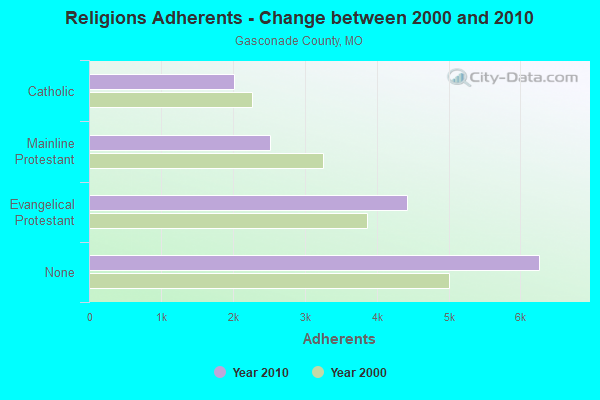
| Religion | Adherents | Congregations |
|---|---|---|
| Evangelical Protestant | 4,423 | 31 |
| Mainline Protestant | 2,512 | 15 |
| Catholic | 2,022 | 3 |
| Other | 1 | 1 |
| None | 6,264 | - |
Source: Clifford Grammich, Kirk Hadaway, Richard Houseal, Dale E.Jones, Alexei Krindatch, Richie Stanley and Richard H.Taylor. 2012. 2010 U.S.Religion Census: Religious Congregations & Membership Study. Association of Statisticians of American Religious Bodies. Jones, Dale E., et al. 2002. Congregations and Membership in the United States 2000. Nashville, TN: Glenmary Research Center.
Food Environment Statistics:
| Gasconade County: | 3.25 / 10,000 pop. |
| State: | 1.88 / 10,000 pop. |
| Gasconade County: | 7.16 / 10,000 pop. |
| Missouri: | 4.34 / 10,000 pop. |
| This county: | 14.97 / 10,000 pop. |
| State: | 7.37 / 10,000 pop. |
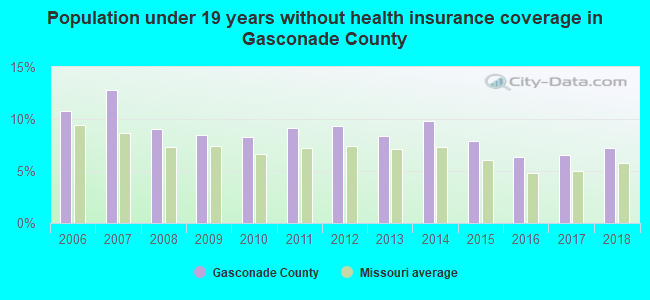
| Gasconade County: | 9.3% |
| Missouri: | 8.8% |
| Gasconade County: | 29.5% |
| State: | 29.6% |
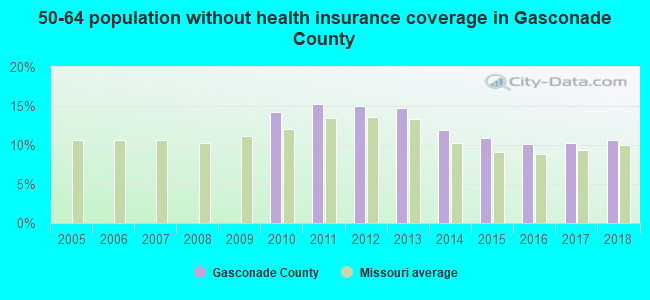
| Here: | 12.8% |
| State: | 13.5% |
Agriculture in Gasconade County:
Average size of farms: 253 acresAverage value of agricultural products sold per farm: $21,232
Average value of crops sold per acre for harvested cropland: $87.83
The value of nursery, greenhouse, floriculture, and sod as a percentage of the total market value of agricultural products sold: 2.58%
The value of livestock, poultry, and their products as a percentage of the total market value of agricultural products sold: 69.49%
Average total farm production expenses per farm: $18,813
Harvested cropland as a percentage of land in farms: 29.11%
Irrigated harvested cropland as a percentage of land in farms: 0.34%
Average market value of all machinery and equipment per farm: $55,493
The percentage of farms operated by a family or individual: 91.33%
Average age of principal farm operators: 57 years
Average number of cattle and calves per 100 acres of all land in farms: 16.43
Milk cows as a percentage of all cattle and calves: 1.82%
Corn for grain: 5256 harvested acres
All wheat for grain: 1771 harvested acres
Soybeans for beans: 12413 harvested acres
Vegetables: 36 harvested acres
Land in orchards: 180 acres
Earthquake activity:
Gasconade County-area historical earthquake activity is significantly above Missouri state average. It is 386% greater than the overall U.S. average.On 4/18/2008 at 09:36:59, a magnitude 5.4 (5.1 MB, 4.8 MS, 5.4 MW, 5.2 MW, Class: Moderate, Intensity: VI - VII) earthquake occurred 196.4 miles away from Gasconade County center
On 9/26/1990 at 13:18:51, a magnitude 5.0 (4.7 MB, 4.8 LG, 5.0 LG, Depth: 7.7 mi) earthquake occurred 139.8 miles away from the county center
On 4/18/2008 at 09:36:59, a magnitude 5.2 (5.2 MW, Depth: 8.9 mi) earthquake occurred 196.4 miles away from the county center
On 5/4/1991 at 01:18:54, a magnitude 5.0 (4.4 MB, 4.6 LG, 5.0 LG, Depth: 3.1 mi) earthquake occurred 160.0 miles away from the county center
On 9/3/2016 at 12:02:44, a magnitude 5.8 (5.8 MW, Depth: 3.5 mi) earthquake occurred 328.7 miles away from Gasconade County center
On 6/10/1987 at 23:48:54, a magnitude 5.1 (4.9 MB, 4.4 MS, 4.6 MS, 5.1 LG) earthquake occurred 197.7 miles away from the county center
Magnitude types: regional Lg-wave magnitude (LG), body-wave magnitude (MB), surface-wave magnitude (MS), moment magnitude (MW)
Most recent natural disasters:
- Missouri Covid-19 Pandemic, Incident Period: January 20, 2020, FEMA Id: 4490, Natural disaster type: Other
- Missouri Severe Storms, Tornadoes, And Flooding, Incident Period: April 29, 2019, FEMA Id: 4451, Natural disaster type: Storm, Tornado, Flood
- Missouri Severe Storms, Tornadoes, Straight-line Winds, And Flooding, Incident Period: April 28, 2017 - May 11, 2017, FEMA Id: 4317, Natural disaster type: Storm, Tornado, Flood, Wind
- Missouri Severe Storms, Tornadoes, Straight-line Winds, and Flooding, Incident Period: December 23, 2015 to January 09, 2016, Major Disaster (Presidential) Declared DR-4250: January 21, 2016, FEMA Id: 4250, Natural disaster type: Storm, Tornado, Flood, Wind
- Missouri Severe Storms, Tornadoes, Straight-line Winds, and Flooding, Incident Period: December 22, 2015 to January 09, 2016, Emergency Declared EM-3374: January 02, 2016, FEMA Id: 3374, Natural disaster type: Storm, Tornado, Flood, Wind
- Missouri Flooding, Incident Period: June 01, 2011 to August 01, 2011, Emergency Declared EM-3325: June 30, 2011, FEMA Id: 3325, Natural disaster type: Flood
- Missouri Severe Winter Storm, Incident Period: January 31, 2011 to February 05, 2011, Emergency Declared EM-3317: February 03, 2011, FEMA Id: 3317, Natural disaster type: Winter Storm
- Missouri Severe Winter Storm, Incident Period: January 26, 2009 to January 28, 2009, Emergency Declared EM-3303: January 30, 2009, FEMA Id: 3303, Natural disaster type: Winter Storm
- Missouri Severe Storms and Flooding, Incident Period: March 17, 2008 to May 09, 2008, Major Disaster (Presidential) Declared DR-1749: March 19, 2008, FEMA Id: 1749, Natural disaster type: Storm, Flood
- Missouri Severe Winter Storms, Incident Period: December 08, 2007 to December 15, 2007, Emergency Declared EM-3281: December 12, 2007, FEMA Id: 3281, Natural disaster type: Winter Storm
- 9 other natural disasters have been reported since 1953.
The number of natural disasters in Gasconade County (19) is greater than the US average (15).
Major Disasters (Presidential) Declared: 8
Emergencies Declared: 7
Causes of natural disasters: Floods: 12, Storms: 10, Tornadoes: 7, Winter Storms: 4, Winds: 3, Drought: 1, Flash Flood: 1, Heavy Rain: 1, Hurricane: 1, Other: 1 (Note: some incidents may be assigned to more than one category).
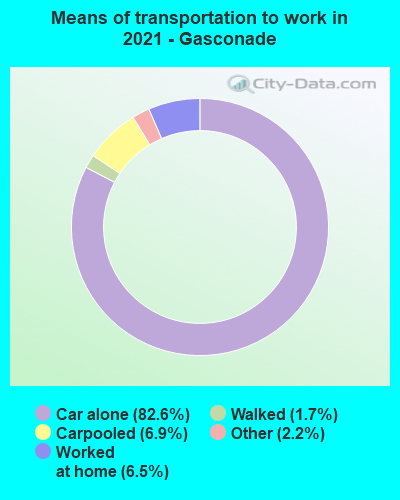
Means of transportation to work:
- Drove a car alone: 4,799 (81.5%)
- Carpooled: 418 (7.1%)
- Bus: 2 (0.0%)
- Taxicab, motorcycle, or other means: 92 (1.6%)
- Walked: 71 (1.2%)
- Worked at home: 432 (7.3%)
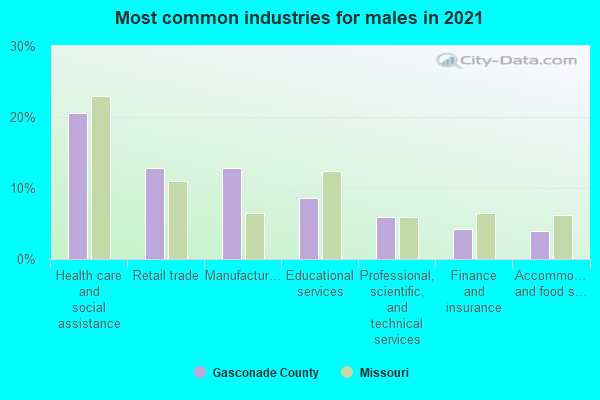
- Health care and social assistance (21%)
- Manufacturing (13%)
- Retail trade (12%)
- Educational services (9%)
- Finance and insurance (6%)
- Professional, scientific, and technical services (5%)
- Accommodation and food services (5%)
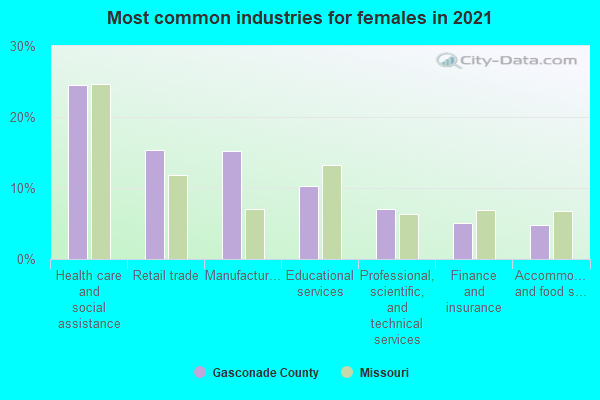
- Health care and social assistance (25%)
- Manufacturing (16%)
- Retail trade (14%)
- Educational services (11%)
- Finance and insurance (7%)
- Professional, scientific, and technical services (6%)
- Accommodation and food services (5%)
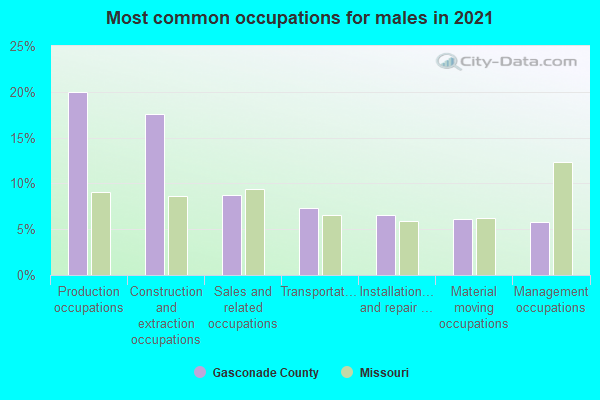
- Production occupations (19%)
- Construction and extraction occupations (17%)
- Management occupations (11%)
- Sales and related occupations (8%)
- Material moving occupations (7%)
- Transportation occupations (6%)
- Installation, maintenance, and repair occupations (5%)
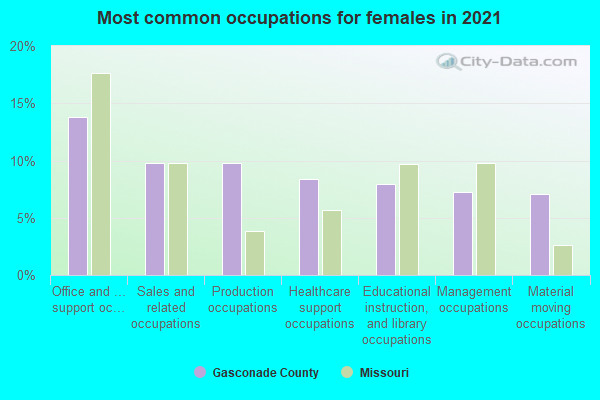
- Office and administrative support occupations (15%)
- Business and financial operations occupations (10%)
- Healthcare support occupations (9%)
- Production occupations (9%)
- Educational instruction, and library occupations (8%)
- Sales and related occupations (7%)
- Material moving occupations (7%)
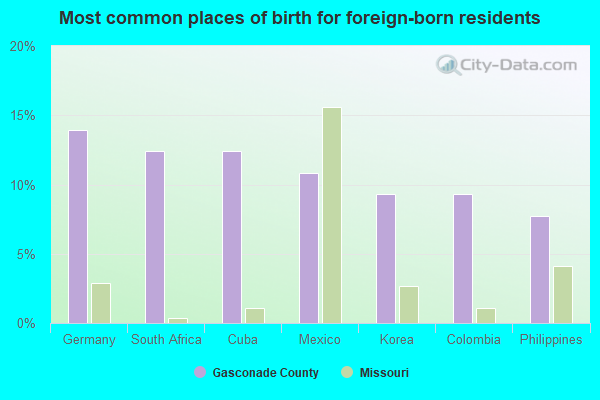
- Philippines (18%)
- Cuba (16%)
- Mexico (14%)
- Israel (11%)
- Korea (10%)
- Germany (10%)
- Netherlands (10%)
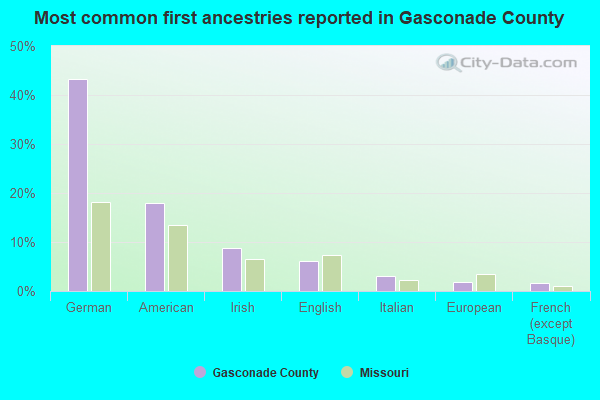
- German (41%)
- American (22%)
- Irish (7%)
- English (7%)
- Italian (3%)
- European (2%)
- Polish (2%)
People in group quarters in Gasconade County, Missouri in 2010:
- 246 people in nursing facilities/skilled-nursing facilities
- 2 people in hospitals with patients who have no usual home elsewhere
- 2 people in in-patient hospice facilities
People in group quarters in Gasconade County, Missouri in 2000:
- 287 people in nursing homes
- 13 people in other noninstitutional group quarters
- 7 people in other group homes
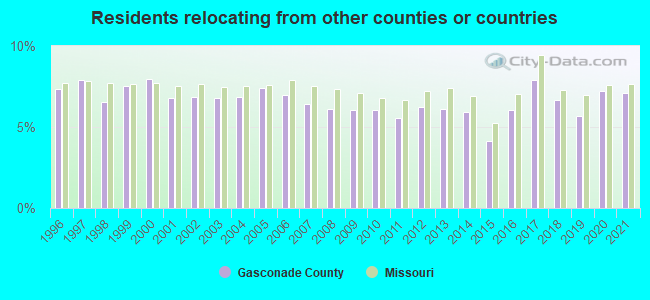
7.10% of this county's 2021 resident taxpayers lived in other counties in 2020 ($46,781 average adjusted gross income)
| Here: | 7.10% |
| Missouri average: | 7.67% |
10 or fewer of this county's residents moved from foreign countries.
6.17% relocated from other counties in Missouri ($38,073 average AGI)
0.94% relocated from other states ($8,708 average AGI)
Gasconade County: 0.94% Missouri average: 3.04%
Top counties from which taxpayers relocated into this county between 2020 and 2021:
| from Franklin County, MO | |
| from St. Charles County, MO | |
| from Maries County, MO | |
| from St. Louis County, MO | |
| from Crawford County, MO | |
| from Osage County, MO |
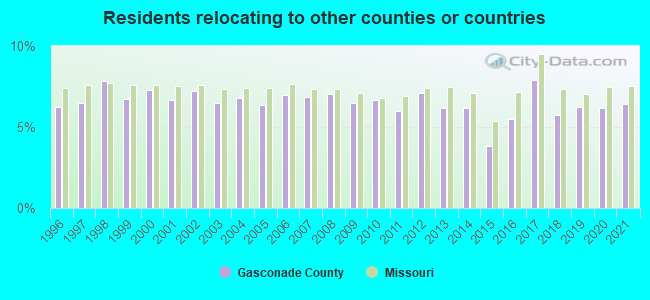
6.41% of this county's 2020 resident taxpayers moved to other counties in 2021 ($42,837 average adjusted gross income)
| Here: | 6.41% |
| Missouri average: | 7.51% |
10 or fewer of this county's residents moved to foreign countries.
5.52% relocated to other counties in Missouri ($36,614 average AGI)
0.89% relocated to other states ($6,223 average AGI)
Gasconade County: 0.89% Missouri average: 2.88%
Top counties to which taxpayers relocated from this county between 2020 and 2021:
| to Franklin County, MO | |
| to Maries County, MO |
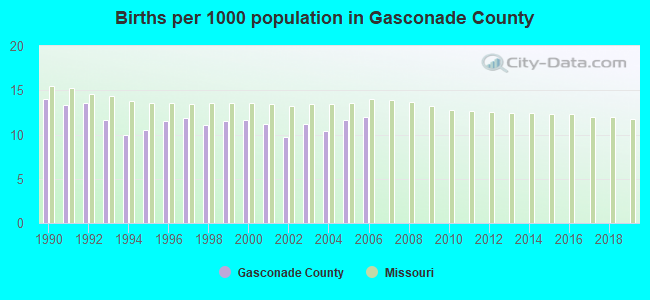
Births per 1000 population from 1990 to 1999: 11.9
Births per 1000 population from 2000 to 2006: 11.1
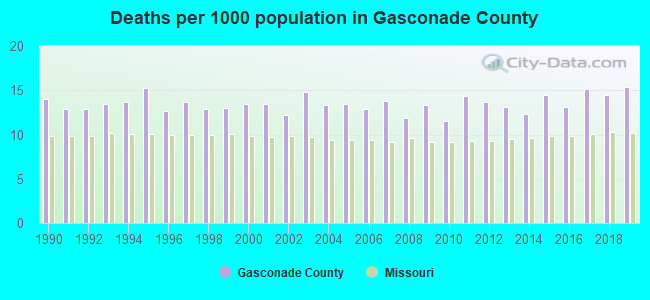
Deaths per 1000 population from 1990 to 1999: 13.4
Deaths per 1000 population from 2000 to 2009: 13.3
Deaths per 1000 population from 2010 to 2020: 14.2
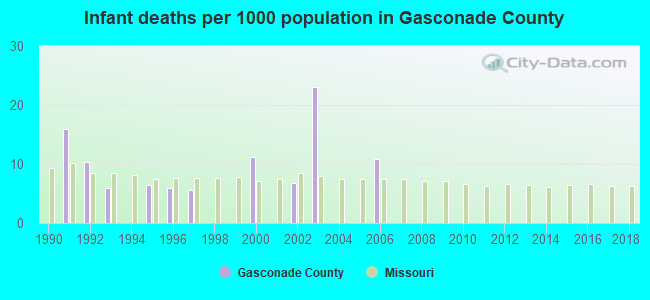
Infant deaths per 1000 live births from 1990 to 1999: 5.0
Infant deaths per 1000 live births from 2000 to 2006: 7.4
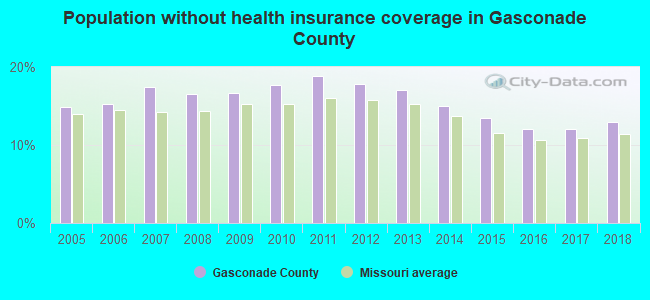
Persons under 19 years old without health insurance coverage in 2018: 7.2%
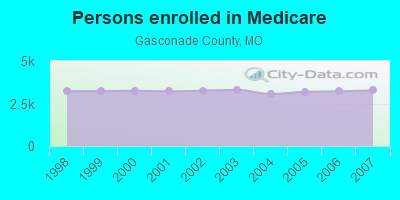
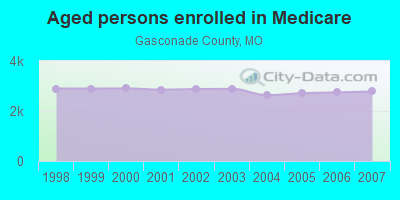
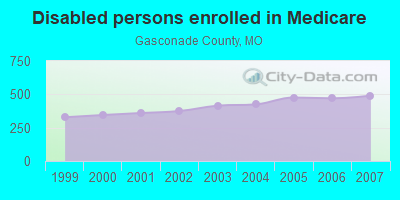
Persons enrolled in hospital insurance and/or supplemental medical insurance (Medicare) in July 1, 2007: 3,273 (2,783 aged, 490 disabled)
Children under 18 without health insurance coverage in 2007: 420 (12%)
Most common underlying causes of death in Gasconade County, Missouri in 1999 - 2019:
- Atherosclerotic heart disease (337)
- Acute myocardial infarction, unspecified (298)
- Bronchus or lung, unspecified - Malignant neoplasms (170)
- Stroke, not specified as haemorrhage or infarction (141)
- Chronic obstructive pulmonary disease, unspecified (97)
- Alzheimer disease, unspecified (70)
- Unspecified dementia (69)
- Congestive heart failure (41)
- Atherosclerotic cardiovascular disease, so described (10)
- Pneumonia, unspecified (10)
Population without health insurance coverage in 2000: 9%
Children under 18 without health insurance coverage in 2000: 8%
Short term general hospital admissions per 100,000 population in 2004: 2,754
Short term general hospital beds per 100,000 population in 2004: 160
Emergency room visits per 100,000 population in 2004: 16,103
General practice office based MDs per 100,000 population in 2005: 781
Medical specialist MDs per 100,000 population in 2005: 1,512
Dentists per 100,000 population in 1998: 6
Total births per 100,000 population, July 2005 - July 2006 : 20
Total deaths per 100,000 population, July 2005 - July 2006: 64
Limited-service eating places per 100,000 population in 2005 : 6
Household type by relationship:
Households: 14,857- Male householders: 2,993 (947 living alone), Female householders: 3,129 (812 living alone)
3,222 spouses (3,204 opposite-sex spouses), 461 unmarried partners, (400 opposite-sex unmarried partners), 3,764 children (3,500 natural, 54 adopted, 213 stepchildren), 321 grandchildren, 67 brothers or sisters, 54 parents, 14 foster children, 142 other relatives, 435 non-relatives
- In group quarters: 244
Size of family households: 1,969 2-persons, 917 3-persons, 595 4-persons, 319 5-persons, 120 6-persons, 81 7-or-more-persons.
Size of nonfamily households: 1,756 1-person, 340 2-persons, 22 3-persons.
1,868 married couples with children.
706 single-parent households (282 men, 424 women).
98.6% of residents of Gasconade speak English at home.
0.8% of residents speak Spanish at home (60% speak English very well, 16% speak English well, 24% speak English not well).
0.4% of residents speak other Indo-European language at home (100% speak English very well).
0.2% of residents speak Asian or Pacific Island language at home (74% speak English well, 26% don't speak English at all).
0.1% of residents speak other language at home (100% speak English very well).
In fiscal year 2004:
Federal Government expenditure: $84,071,000 ($5,385 per capita)
Department of Defense expenditure: $2,157,000
Federal direct payments to individuals for retirement and disability: $45,731,000
Federal other direct payments to individuals: $21,580,000
Federal direct payments not to individuals: $916,000
Federal grants: $12,581,000
Federal procurement contracts: $671,000 ($41,000 Department of Defense)
Federal salaries and wages: $2,591,000 ($127,000 Department of Defense)
Federal Government direct loans: $450,000
Federal guaranteed/insured loans: $3,359,000
Federal Government insurance: $9,412,000
Population change from April 1, 2000 to July 1, 2005:
Births: 887| Here: | 56 per 1000 residents |
| State: | 69 per 1000 residents |
Deaths: 1,093
| Here: | 69 per 1000 residents |
| State: | 49 per 1000 residents |
Net international migration: +4
| Here: | +0 per 1000 residents |
| State: | +7 per 1000 residents |
Net internal migration: +632
| Here: | +40 per 1000 residents |
| State: | +5 per 1000 residents |
Total withdrawal of fresh water for public supply: 0.90 millions of gallons per day (all from ground)
| Here: | 6.1 |
| State: | 6.4 |
| Here: | 4.3 |
| State: | 4.4 |
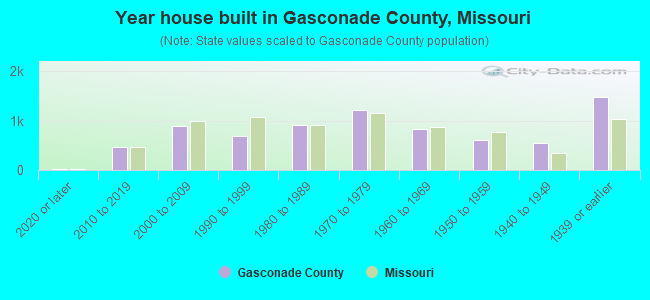
- Year house built in Gasconade County, Missouri
- 152020 or later
- 5302010 to 2019
- 9012000 to 2009
- 8491990 to 1999
- 8881980 to 1989
- 1,1381970 to 1979
- 6971960 to 1969
- 6031950 to 1959
- 5201940 to 1949
- 1,4431939 or earlier
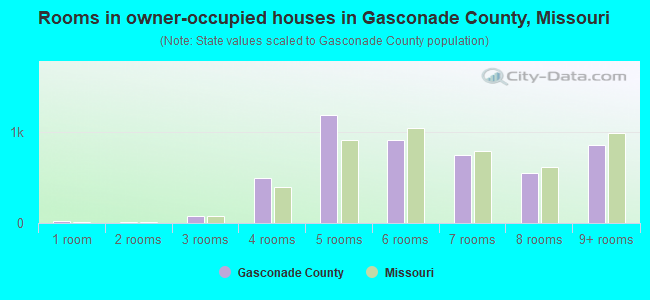
- Rooms in owner-occupied houses in Gasconade County, Missouri
- 461 room
- 252 rooms
- 973 rooms
- 5234 rooms
- 1,1695 rooms
- 8686 rooms
- 8447 rooms
- 5278 rooms
- 8549+ rooms
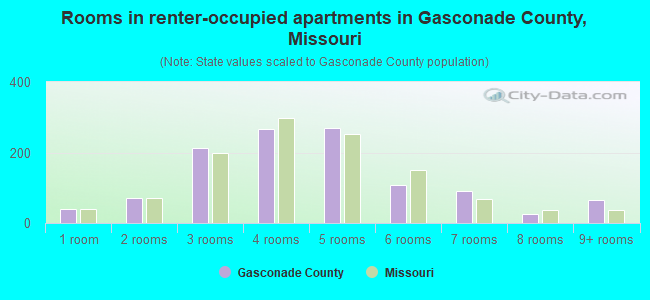
- Rooms in renter-occupied apartments in Gasconade County, Missouri
- 421 room
- 992 rooms
- 2593 rooms
- 2324 rooms
- 2415 rooms
- 1146 rooms
- 697 rooms
- 518 rooms
- 829+ rooms
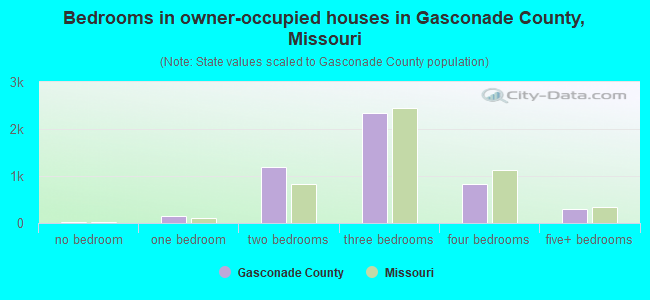
- Bedrooms in owner-occupied houses in Gasconade County, Missouri
- 46no bedroom
- 1911 bedroom
- 1,0792 bedrooms
- 2,4443 bedrooms
- 8894 bedrooms
- 3005+ bedrooms
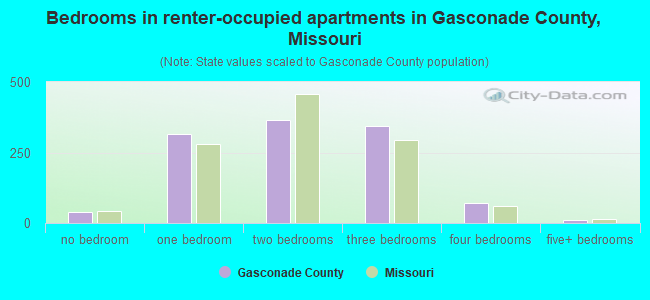
- Bedrooms in renter-occupied apartments in Gasconade County, Missouri
- 42no bedroom
- 3361 bedroom
- 3812 bedrooms
- 3363 bedrooms
- 764 bedrooms
- 55+ bedrooms
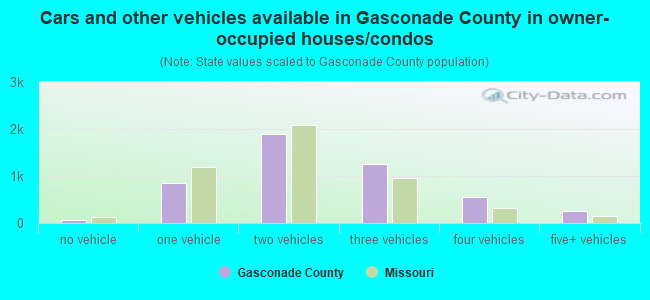
- Cars and other vehicles available in Gasconade County in owner-occupied houses/condos
- 145no vehicle
- 8911 vehicle
- 1,7772 vehicles
- 1,2743 vehicles
- 5984 vehicles
- 2615+ vehicles
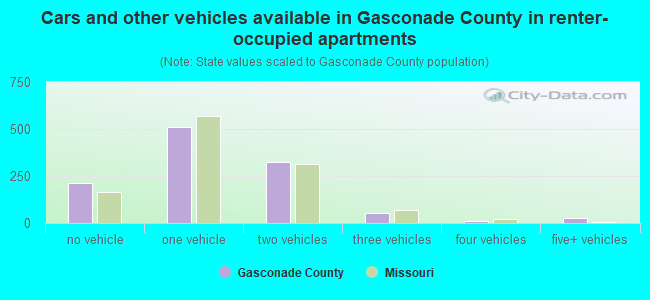
- Cars and other vehicles available in Gasconade County in renter-occupied apartments
- 233no vehicle
- 5201 vehicle
- 2772 vehicles
- 683 vehicles
- 434 vehicles
- 465+ vehicles
90.7% of Gasconade County residents lived in the same house 1 years ago.
Out of people who lived in different houses, 29% lived in this county.
Out of people who lived in different counties, 81% lived in Missouri.
| Gasconade County: | 90.7% |
| State average: | 87.1% |
Place of birth for U.S.-born residents:
- This state: 12,068
- Other state: 2,568
- Northeast: 187
- Midwest: 1,162
- South: 604
- West: 621
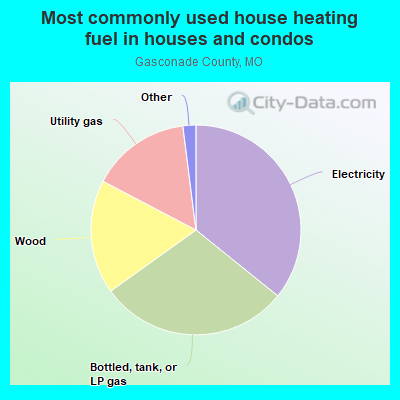
- 36.6%Electricity
- 28.4%Bottled, tank, or LP gas
- 17.8%Wood
- 14.8%Utility gas
- 1.4%Fuel oil, kerosene, etc.
- 0.8%Other fuel
- 0.1%No fuel used
- 65.8%Electricity
- 13.4%Bottled, tank, or LP gas
- 13.0%Utility gas
- 4.3%Wood
- 2.3%Fuel oil, kerosene, etc.
- 0.8%No fuel used
- 0.5%Other fuel
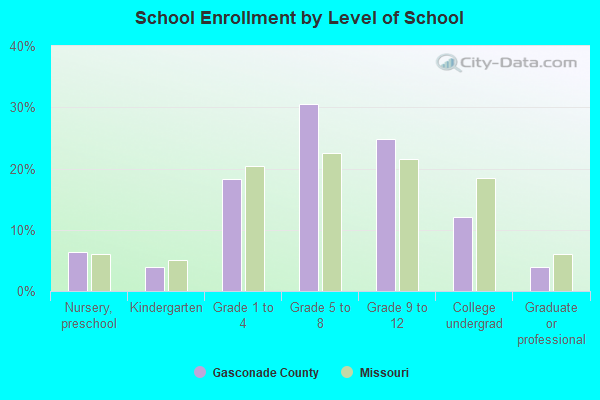
Private vs. public school enrollment:
| Here: | 15.4% |
| Missouri: | 15.4% |
| Here: | 7.7% |
| Missouri: | 13.9% |
| Here: | 13.1% |
| Missouri: | 22.6% |
Gasconade County government finances - Expenditure in 2017:
- Charges - Other: $702,000
- Construction - General Public Buildings: $70,000
Regular Highways: $39,000
Protective Inspection and Regulation - Other: $30,000
- Current Operations - Regular Highways: $1,283,000
Police Protection: $616,000
Central Staff Services: $493,000
Financial Administration: $367,000
Public Welfare - Other: $343,000
General - Other: $341,000
General Public Buildings: $267,000
Judicial and Legal Services: $243,000
Health - Other: $181,000
Protective Inspection and Regulation - Other: $44,000
- Intergovernmental to Local - Other - Correctional Institutions: $151,000
Other - Judicial and Legal Services: $26,000
- Intergovernmental to State - Police Protection: $17,000
- Local Intergovernmental - Other: $37,000
- Miscellaneous - Donations From Private Sources: $199,000
Interest Earnings: $15,000
- Other Capital Outlay - Regular Highways: $420,000
Police Protection: $74,000
Protective Inspection and Regulation - Other: $37,000
- Other Funds - Cash and Securities: $2,274,000
- State Intergovernmental - Highways: $639,000
Public Welfare: $166,000
Other: $100,000
General Local Government Support: $2,000
- Tax - General Sales and Gross Receipts: $1,865,000
Property: $1,569,000
Other License: $27,000
Alcoholic Beverage License: $26,000
Occupation and Business License - Other: $2,000
- Total Salaries and Wages: $1,662,000
Gasconade County government finances - Revenue in 2017:
- Charges - Other: $702,000
- Construction - General Public Buildings: $70,000
Regular Highways: $39,000
Protective Inspection and Regulation - Other: $30,000
- Current Operations - Regular Highways: $1,283,000
Police Protection: $616,000
Central Staff Services: $493,000
Financial Administration: $367,000
Public Welfare - Other: $343,000
General - Other: $341,000
General Public Buildings: $267,000
Judicial and Legal Services: $243,000
Health - Other: $181,000
Protective Inspection and Regulation - Other: $44,000
- Intergovernmental to Local - Other - Correctional Institutions: $151,000
Other - Judicial and Legal Services: $26,000
- Intergovernmental to State - Police Protection: $17,000
- Local Intergovernmental - Other: $37,000
- Miscellaneous - Donations From Private Sources: $199,000
Interest Earnings: $15,000
- Other Capital Outlay - Regular Highways: $420,000
Police Protection: $74,000
Protective Inspection and Regulation - Other: $37,000
- Other Funds - Cash and Securities: $2,274,000
- State Intergovernmental - Highways: $639,000
Public Welfare: $166,000
Other: $100,000
General Local Government Support: $2,000
- Tax - General Sales and Gross Receipts: $1,865,000
Property: $1,569,000
Other License: $27,000
Alcoholic Beverage License: $26,000
Occupation and Business License - Other: $2,000
- Total Salaries and Wages: $1,662,000
Gasconade County government finances - Debt in 2017:
- Charges - Other: $702,000
- Construction - General Public Buildings: $70,000
Regular Highways: $39,000
Protective Inspection and Regulation - Other: $30,000
- Current Operations - Regular Highways: $1,283,000
Police Protection: $616,000
Central Staff Services: $493,000
Financial Administration: $367,000
Public Welfare - Other: $343,000
General - Other: $341,000
General Public Buildings: $267,000
Judicial and Legal Services: $243,000
Health - Other: $181,000
Protective Inspection and Regulation - Other: $44,000
- Intergovernmental to Local - Other - Correctional Institutions: $151,000
Other - Judicial and Legal Services: $26,000
- Intergovernmental to State - Police Protection: $17,000
- Local Intergovernmental - Other: $37,000
- Miscellaneous - Donations From Private Sources: $199,000
Interest Earnings: $15,000
- Other Capital Outlay - Regular Highways: $420,000
Police Protection: $74,000
Protective Inspection and Regulation - Other: $37,000
- Other Funds - Cash and Securities: $2,274,000
- State Intergovernmental - Highways: $639,000
Public Welfare: $166,000
Other: $100,000
General Local Government Support: $2,000
- Tax - General Sales and Gross Receipts: $1,865,000
Property: $1,569,000
Other License: $27,000
Alcoholic Beverage License: $26,000
Occupation and Business License - Other: $2,000
- Total Salaries and Wages: $1,662,000
Gasconade County government finances - Cash and Securities in 2017:
- Charges - Other: $702,000
- Construction - General Public Buildings: $70,000
Regular Highways: $39,000
Protective Inspection and Regulation - Other: $30,000
- Current Operations - Regular Highways: $1,283,000
Police Protection: $616,000
Central Staff Services: $493,000
Financial Administration: $367,000
Public Welfare - Other: $343,000
General - Other: $341,000
General Public Buildings: $267,000
Judicial and Legal Services: $243,000
Health - Other: $181,000
Protective Inspection and Regulation - Other: $44,000
- Intergovernmental to Local - Other - Correctional Institutions: $151,000
Other - Judicial and Legal Services: $26,000
- Intergovernmental to State - Police Protection: $17,000
- Local Intergovernmental - Other: $37,000
- Miscellaneous - Donations From Private Sources: $199,000
Interest Earnings: $15,000
- Other Capital Outlay - Regular Highways: $420,000
Police Protection: $74,000
Protective Inspection and Regulation - Other: $37,000
- Other Funds - Cash and Securities: $2,274,000
- State Intergovernmental - Highways: $639,000
Public Welfare: $166,000
Other: $100,000
General Local Government Support: $2,000
- Tax - General Sales and Gross Receipts: $1,865,000
Property: $1,569,000
Other License: $27,000
Alcoholic Beverage License: $26,000
Occupation and Business License - Other: $2,000
- Total Salaries and Wages: $1,662,000
Supplemental Security Income (SSI) in 2006:
- Total number of recipients: 213
- Number of aged recipients: 20
- Number of blind and disabled recipients: 193
- Number of recipients under 18: 34
- Number of recipients between 18 and 64: 138
- Number of recipients older than 64: 41
- Number of recipients also receiving OASDI: 93
- Amount of payments (thousands of dollars): 86
| Most common first names in Gasconade County, MO among deceased individuals | ||
| Name | Count | Lived (average) |
|---|---|---|
| William | 163 | 76.5 years |
| John | 128 | 78.8 years |
| Charles | 106 | 73.6 years |
| George | 101 | 78.1 years |
| Mary | 86 | 80.5 years |
| James | 75 | 72.5 years |
| Walter | 74 | 78.7 years |
| Anna | 72 | 84.6 years |
| Clara | 70 | 82.2 years |
| Henry | 69 | 81.8 years |
| Most common last names in Gasconade County, MO among deceased individuals | ||
| Last name | Count | Lived (average) |
|---|---|---|
| Schneider | 47 | 80.0 years |
| Branson | 41 | 77.3 years |
| Smith | 41 | 78.3 years |
| Meyer | 41 | 80.4 years |
| Miller | 34 | 80.3 years |
| Schulte | 32 | 79.4 years |
| Michel | 28 | 79.9 years |
| Wehmeyer | 28 | 78.6 years |
| Shockley | 23 | 78.3 years |
| Kottwitz | 23 | 76.7 years |
| Businesses in Gasconade County, MO | ||||
| Name | Count | Name | Count | |
|---|---|---|---|---|
| Alco Stores | 1 | MasterBrand Cabinets | 4 | |
| Domino's Pizza | 1 | McDonald's | 1 | |
| FedEx | 1 | Pizza Hut | 1 | |
| Ford | 2 | RadioShack | 1 | |
| H&R Block | 2 | Subway | 2 | |
| Hardee's | 1 | U-Haul | 2 | |
| La-Z-Boy | 1 | Walmart | 1 | |