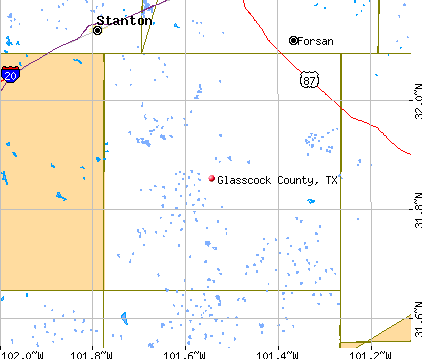
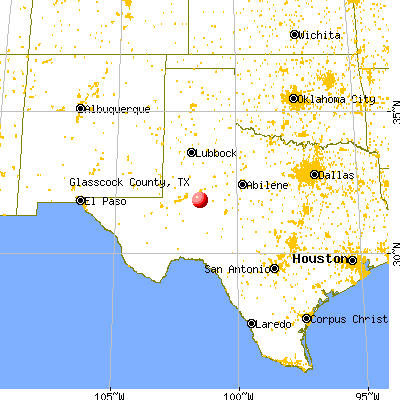
Glasscock County, Texas (TX)
County owner-occupied free and clear houses and condos in 2010: 185
County owner-occupied houses and condos in 2000: 325
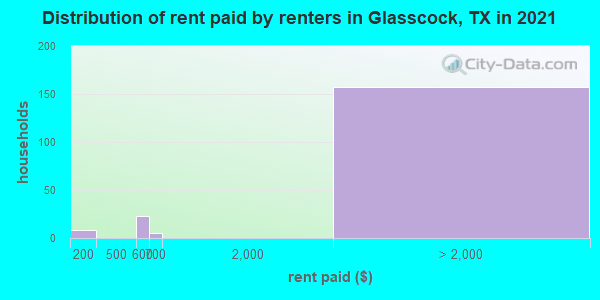
Renter-occupied apartments: 138 (it was 158 in 2000)
| % of renters here: | 33% |
| State: | 36% |
Land area: 901 sq. mi.
Water area: 0.2 sq. mi.
Population density: 1 people per square mile (very low).
Industries providing employment: Agriculture,forestry,fishing and hunting, and mining (38.7%), Construction (19.9%), Professional, scientific, management, administrative, and waste management services (14.7%), Educational, health and social services (11.5%).
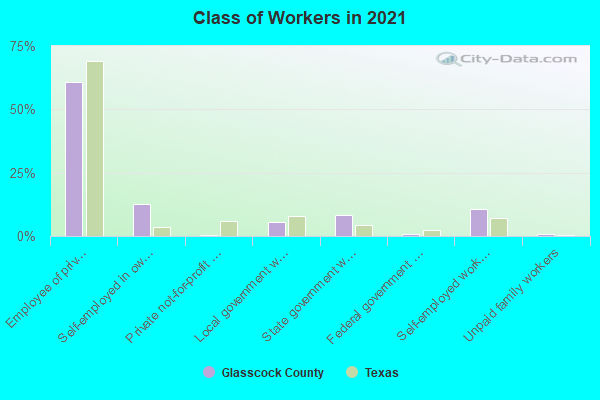
Type of workers:
- Private wage or salary: 72%
- Government: 15%
- Self-employed, not incorporated: 11%
- Unpaid family work: 3%
- OSM Map
- General Map
- Google Map
- MSN Map

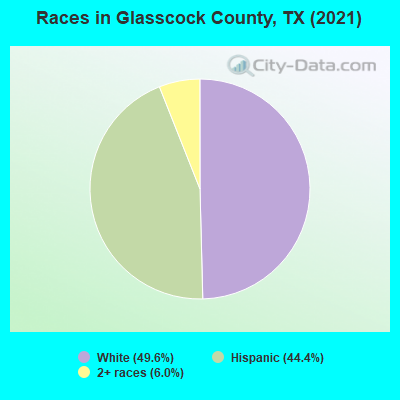
- 67962.3%White Non-Hispanic Alone
- 34531.7%Hispanic or Latino
- 666.1%Two or more races
| Median resident age: | 39.2 years |
| Texas median age: | 35.6 years |
| Males: 701 | |
| Females: 395 |

 | New County Population Estimates from the Census Bureau for Jluy 1, 2016 posted this morning about 9 A. M. (13 replies) |
| Small towns in the Hill Country and West Texas (35 replies) |
| Which Nice Conservative Texas Town? (70 replies) |
| Which counties are the most "RED" in Texas? (49 replies) |
| Newly Incorporated Places in Texas (23 replies) |
| Oil and Gas Lease Information (11 replies) |
| Glasscock County: | 2.0 people |
| Texas: | 3 people |
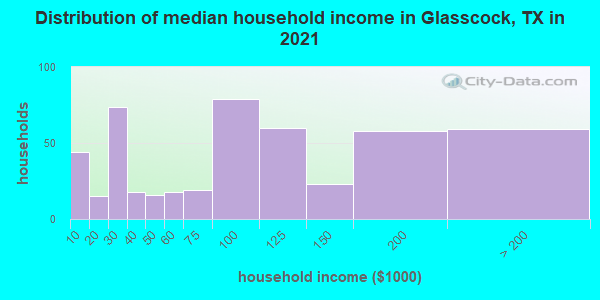
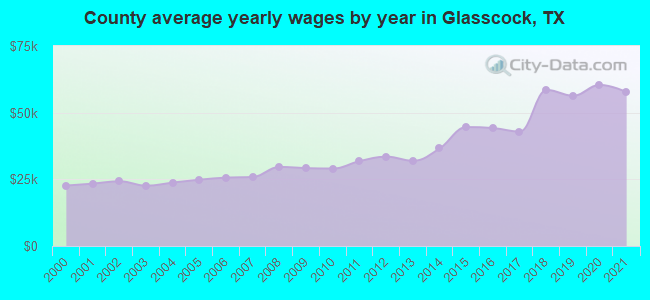
Estimated median household income in 2022: $111,034 ($35,655 in 1999)
| This county: | $111,034 |
| Texas: | $72,284 |
Median contract rent in 2022 for apartments: $-689,506,172
| This county: | |
| State: |
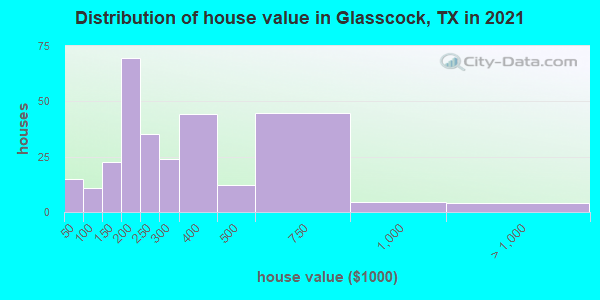
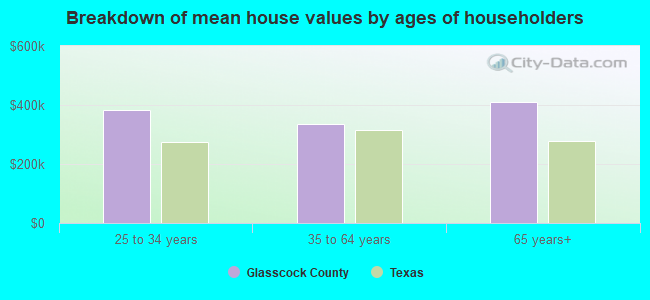
Estimated median house or condo value in 2022: $298,890 (it was $65,000 in 2000)
| Glasscock: | $298,890 |
| Texas: | $275,400 |
Mean price in 2022:
Median monthly housing costs for homes and condos with a mortgage: $854Detached houses: $372,516
Here: $372,516 State: $369,058 Mobile homes: $155,994
Here: $155,994 State: $124,413
Median monthly housing costs for units without a mortgage: $649
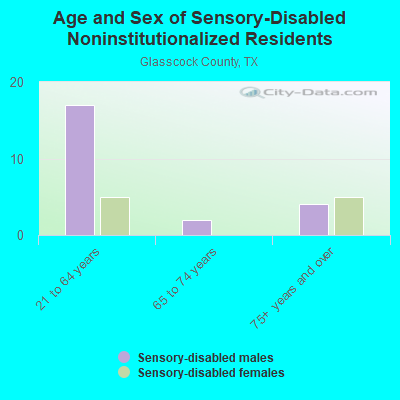
Institutionalized population: 0
Crime in 2021 (reported by the sheriff's office or county police, not the county total):
- Murders: 0
- Rapes: 0
- Robberies: 0
- Assaults: 0
- Burglaries: 6
- Thefts: 9
- Auto thefts: 2
Crime in 2020 (reported by the sheriff's office or county police, not the county total):
- Murders: 0
- Rapes: 0
- Robberies: 0
- Assaults: 2
- Burglaries: 6
- Thefts: 9
- Auto thefts: 5
Median real estate property taxes paid for housing units with mortgages in 2022: $283 (0.1%)
Median real estate property taxes paid for housing units with no mortgage in 2022: $1,467 (0.4%)
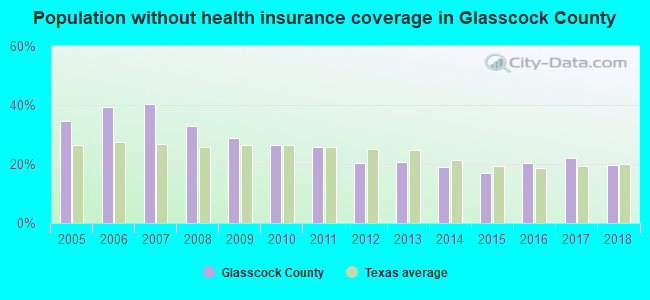
| Glasscock County: | 5.2% |
| Texas: | 14.0% |
Median age of residents in 2022: 39.2 years old
(Males: 32.9 years old, Females: 44.3 years old)
(Median age for: White residents: 43.7 years old, Hispanic or Latino residents: 29.1 years old, Other race residents: 51.0 years old)
Fair market rent in 2006 for a 1-bedroom apartment in Glasscock County is $401 a month.
Fair market rent for a 2-bedroom apartment is $484 a month.
Fair market rent for a 3-bedroom apartment is $624 a month.
Cities in this county include: Garden City.
Notable locations in this county outside city limits:
Notable locations in Glasscock County: McGill Ranch (A), Model A Windmill (B), Alvie Cole Ranch (C), Bobs Creek Ranch (D), Boone Windmill (E), Bull Pasture Windmill (F), Cedar Windmill (G), Challenge Windmill (H), Cole Ranch (I), Coleman Windmill (J), Davis Windmill (K), Dempster Windmill (L), Divide Windmill (M), Doodle Bug Windmill (N), East Windmill (O), Finley Windmill (P), Foster Ranch (Q), Garden Windmill (R), Garrett Windmill (S), Glass Ranch (T). Display/hide their locations on the map
Cemeteries: Lolanthe Cemetery (1), Montvale Cemetery (2), Edwards Cemetery (3), Foster Cemetery (4). Display/hide their locations on the map
Lakes and reservoirs: Rockwater Hole (A), Willow Net Tank (B), Spring Tank (C), Southwest Peter Lake Tank (D), Southeast Antelope Tank (E), Snake Mountain Tank (F), Powell Tank (G), Old McWhorter Tank (H). Display/hide their locations on the map
Creeks: Willow Creek (A), Sterling Creek (B), Lacy Creek (C), Little Mulberry Creek (D), Dobson Creek (E), Chalk Creek (F), Bobs Creek (G). Display/hide their locations on the map
Neighboring counties: Bacon County, Georgia  , Crane County
  , Ector County
  , Liberty County, Georgia , Macon County, Georgia , Nolan County
  .
.
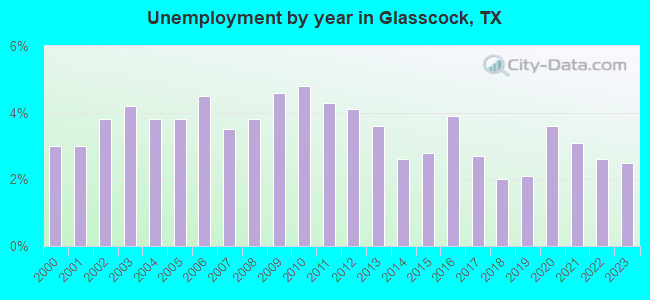
| Here: | 2.1% |
| Texas: | 3.5% |
Current college students: 40
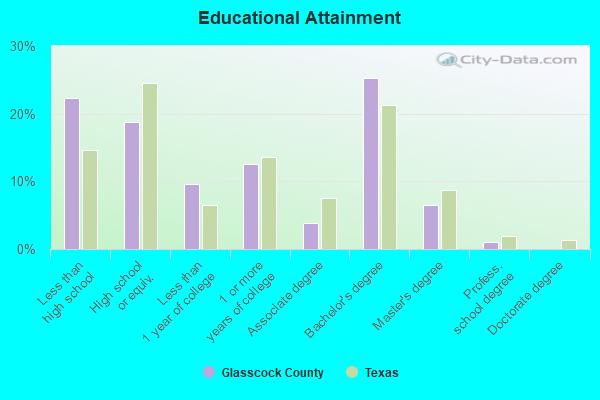
People 25 years of age or older with a high school degree or higher: 86.1%
People 25 years of age or older with a bachelor's degree or higher: 37.8%
Number of foreign born residents: 113 (11.6% naturalized citizens)
| Glasscock County: | 10.4% |
| Whole state: | 17.2% |
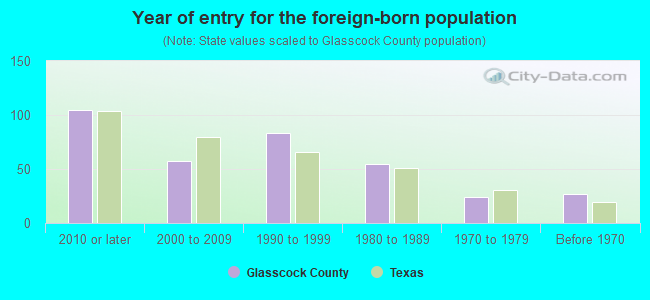
- Year of entry for the foreign-born population
- 112010 or later
- 712000 to 2009
- 161990 to 1999
- 551980 to 1989
- 241970 to 1979
- 27Before 1970
Mean travel time to work (commute): minutes
Percentage of county residents living and working in this county: 100.2%


Housing units in structures:
- One, detached: 439
- 5 to 9: 4
- Mobile homes: 60
Housing units in Glasscock County with a mortgage: 79 (0 second mortgage, 0 home equity loan, 0 both second mortgage and home equity loan)
Houses without a mortgage: 0
| Here: | 100.0% with mortgage |
| State: | 98.4% with mortgage |
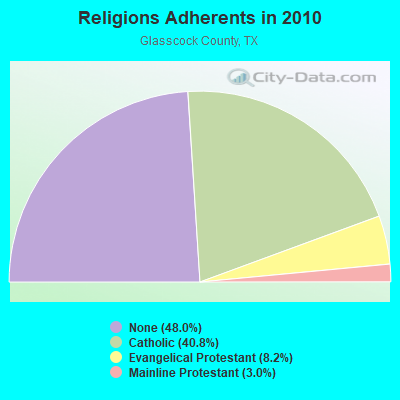
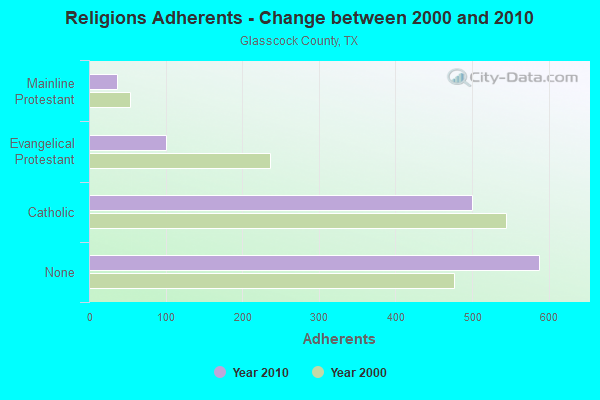
Religion statistics for Glasscock County
| Religion | Adherents | Congregations |
|---|---|---|
| Catholic | 500 | 1 |
| Evangelical Protestant | 101 | 2 |
| Mainline Protestant | 37 | 1 |
| None | 588 | - |
Source: Clifford Grammich, Kirk Hadaway, Richard Houseal, Dale E.Jones, Alexei Krindatch, Richie Stanley and Richard H.Taylor. 2012. 2010 U.S.Religion Census: Religious Congregations & Membership Study. Association of Statisticians of American Religious Bodies. Jones, Dale E., et al. 2002. Congregations and Membership in the United States 2000. Nashville, TN: Glenmary Research Center.
Food Environment Statistics:
| Glasscock County: | 8.57 / 10,000 pop. |
| Texas: | 3.95 / 10,000 pop. |
| Glasscock County: | 9.9% |
| Texas: | 8.9% |
| Glasscock County: | 26.9% |
| State: | 26.6% |
Agriculture in Glasscock County:
Average size of farms: 2477 acresAverage value of agricultural products sold per farm: $68,526
Average value of crops sold per acre for harvested cropland: $129.66
The value of livestock, poultry, and their products as a percentage of the total market value of agricultural products sold: 16.32%
Average total farm production expenses per farm: $88,941
Harvested cropland as a percentage of land in farms: 17.85%
Irrigated harvested cropland as a percentage of land in farms: 31.29%
Average market value of all machinery and equipment per farm: $134,772
The percentage of farms operated by a family or individual: 80.40%
Average age of principal farm operators: 53 years
Average number of cattle and calves per 100 acres of all land in farms: 1.40
All wheat for grain: 8519 harvested acres
Upland cotton: 66509 harvested acres
Vegetables: 18 harvested acres
Land in orchards: 249 acres
Tornado activity:
Glasscock County historical area-adjusted tornado activity is significantly below Texas state average. It is 29741814.2 times below overall U.S. average.Earthquake activity:
Glasscock County-area historical earthquake activity is significantly above Texas state average. It is 309% greater than the overall U.S. average.On 4/14/1995 at 00:32:56, a magnitude 5.7 (5.6 MB, 5.7 MS, 5.7 MW, Depth: 11.1 mi, Class: Moderate, Intensity: VI - VII) earthquake occurred 153.4 miles away from Glasscock County center
On 6/16/1978 at 11:46:54, a magnitude 5.3 (4.4 MB, 4.6 UK, 5.3 ML) earthquake occurred 93.1 miles away from the county center
On 1/2/1992 at 11:45:35, a magnitude 5.0 (4.6 MB, 5.0 LG, Depth: 3.1 mi) earthquake occurred 97.0 miles away from the county center
On 3/26/2020 at 15:16:27, a magnitude 5.0 (5.0 MW, Depth: 5.9 mi) earthquake occurred 147.1 miles away from the county center
On 9/11/2011 at 12:27:44, a magnitude 4.3 (4.3 MW, Depth: 3.1 mi, Class: Light, Intensity: IV - V) earthquake occurred 82.3 miles away from Glasscock County center
On 11/6/2011 at 03:53:10, a magnitude 5.7 (5.7 MW, Depth: 3.2 mi) earthquake occurred 374.5 miles away from the county center
Magnitude types: regional Lg-wave magnitude (LG), body-wave magnitude (MB), local magnitude (ML), surface-wave magnitude (MS), moment magnitude (MW)
Most recent natural disasters:
- Texas Covid-19 Pandemic, Incident Period: January 20, 2020, FEMA Id: 4485, Natural disaster type: Other
- Texas Wildfires, Incident Period: March 14, 2008 to September 01, 2008, Emergency Declared EM-3284: March 14, 2008, FEMA Id: 3284, Natural disaster type: Fire
- Texas Hurricane Rita, Incident Period: September 23, 2005 to October 14, 2005, Major Disaster (Presidential) Declared DR-1606: September 24, 2005, FEMA Id: 1606, Natural disaster type: Hurricane
- Texas Hurricane Rita, Incident Period: September 20, 2005 to October 14, 2005, Emergency Declared EM-3261: September 21, 2005, FEMA Id: 3261, Natural disaster type: Hurricane
- Texas Hurricane Katrina, Incident Period: August 29, 2005 to October 01, 2005, Emergency Declared EM-3216: September 02, 2005, FEMA Id: 3216, Natural disaster type: Hurricane
- Texas Extreme Fire Hazards, Incident Period: August 01, 1999 to December 10, 1999, Emergency Declared EM-3142: September 01, 1999, FEMA Id: 3142, Natural disaster type: Fire
- Texas Extreme Fire Hazard, Incident Period: August 30, 1993 to November 15, 1993, Emergency Declared EM-3113: September 10, 1993, FEMA Id: 3113, Natural disaster type: Fire
The number of natural disasters in Glasscock County (7) is smaller than the US average (15).
Major Disasters (Presidential) Declared: 1
Emergencies Declared: 5
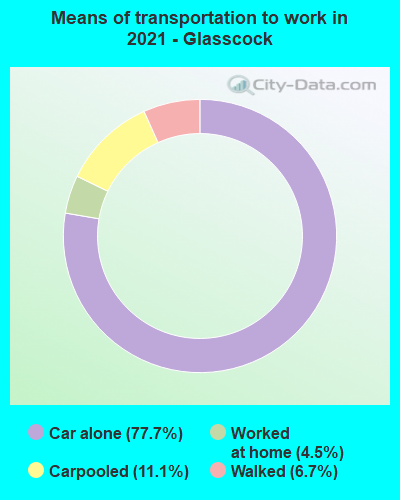
Means of transportation to work:
- Drove a car alone: 827 (79.0%)
- Carpooled: 98 (9.4%)
- Worked at home: 105 (10.0%)
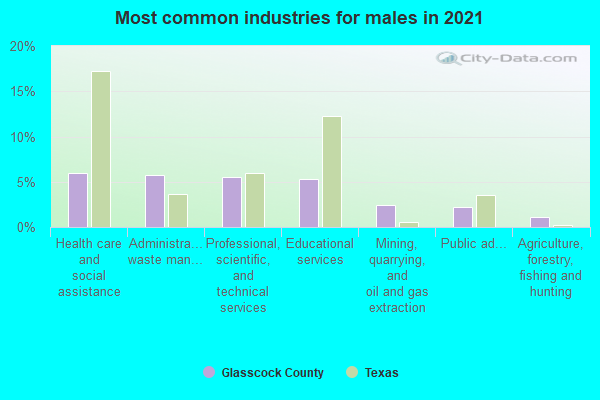
- Professional, scientific, and technical services (8%)
- Educational services (7%)
- Agriculture, forestry, fishing and hunting (6%)
- Administrative and support and waste management services (5%)
- Health care and social assistance (1%)
- Public administration (1%)
- Construction (1%)

- Professional, scientific, and technical services (26%)
- Educational services (23%)
- Agriculture, forestry, fishing and hunting (20%)
- Administrative and support and waste management services (17%)
- Health care and social assistance (4%)
- Public administration (3%)
- Construction (3%)
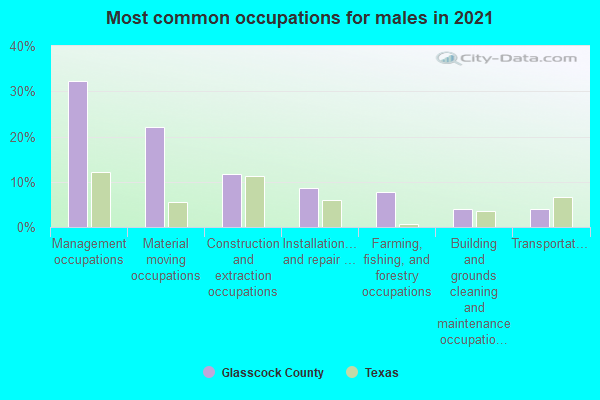
- Management occupations (40%)
- Construction and extraction occupations (14%)
- Farming, fishing, and forestry occupations (14%)
- Installation, maintenance, and repair occupations (14%)
- Production occupations (6%)
- Sales and related occupations (3%)
- Material moving occupations (2%)

- Office and administrative support occupations (26%)
- Architecture and engineering occupations (21%)
- Management occupations (18%)
- Transportation occupations (11%)
- Food preparation and serving related occupations (6%)
- Business and financial operations occupations (5%)
- Educational instruction, and library occupations (5%)
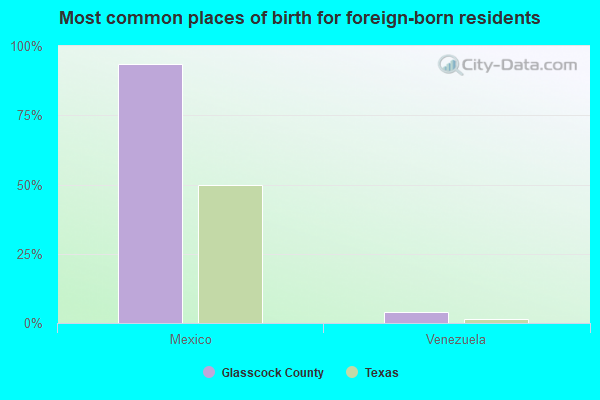
- Mexico (88%)
- Venezuela (10%)
- Norway (0%)
- Sweden (0%)
- United Kingdom, excluding England and Scotland (0%)
- England (0%)
- Scotland (0%)
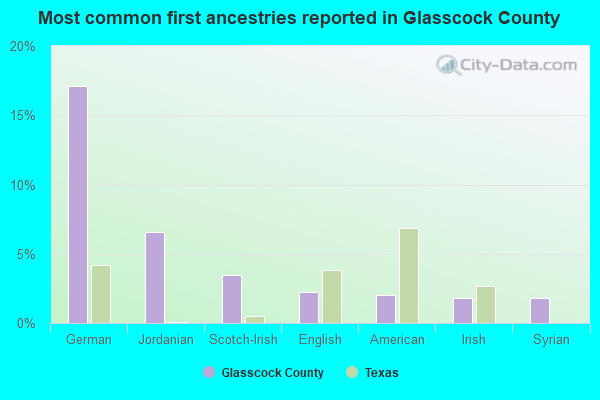
- German (26%)
- Scotch-Irish (6%)
- Jordanian (6%)
- English (5%)
- American (3%)
- Irish (1%)
- Czech (1%)

5.17% of this county's 2021 resident taxpayers lived in other counties in 2020 ($89,160 average adjusted gross income)
| Here: | 5.17% |
| Texas average: | 8.12% |
10 or fewer of this county's residents moved from foreign countries.
5.17% relocated from other counties in Texas ($89,160 average AGI)
10 or fewer of this county's residents relocated from other states.

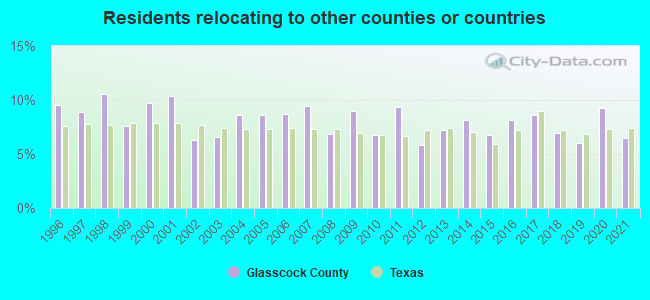
6.52% of this county's 2020 resident taxpayers moved to other counties in 2021 ($81,375 average adjusted gross income)
| Here: | 6.52% |
| Texas average: | 7.40% |
10 or fewer of this county's residents moved to foreign countries.
6.52% relocated to other counties in Texas ($81,375 average AGI)
10 or fewer of this county's residents relocated to other states.
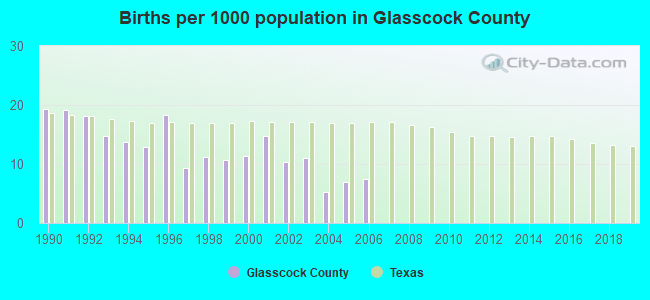
Births per 1000 population from 1990 to 1999: 14.8
Births per 1000 population from 2000 to 2006: 9.6
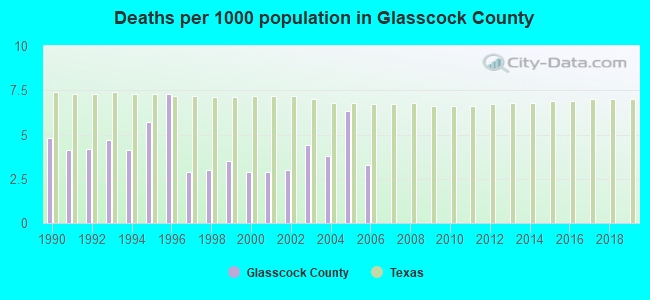
Deaths per 1000 population from 1990 to 1999: 4.4
Deaths per 1000 population from 2000 to 2009: 2.7
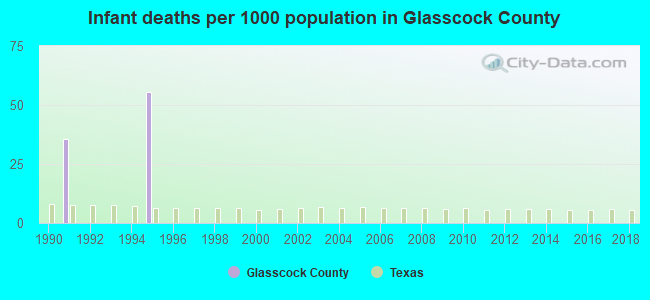
Infant deaths per 1000 live births from 1990 to 1999: 9.1
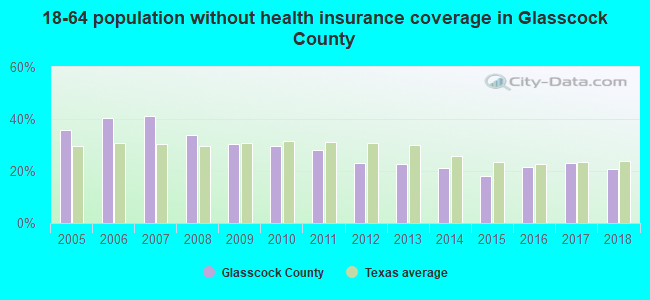
Persons under 19 years old without health insurance coverage in 2018: 17.1%


Children under 18 without health insurance coverage in 2007: 113 (38%)
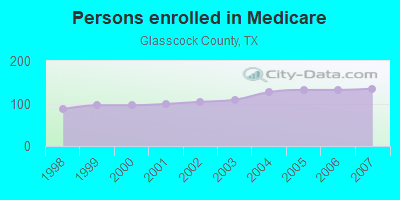
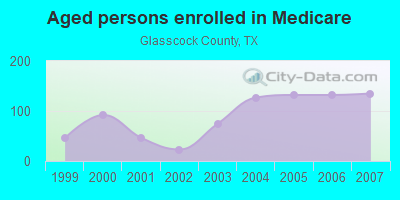
Persons enrolled in hospital insurance and/or supplemental medical insurance (Medicare) in July 1, 2003: 109 (0 aged, 0 disabled)
Population without health insurance coverage in 2000: 24%
Children under 18 without health insurance coverage in 2000: 26%
Medical specialist MDs per 100,000 population in 2005: 151
Crimes per 100,000 population in 1996: 1
Household type by relationship:
Households: 1,096- Male householders: 292 (46 living alone), Female householders: 144 (23 living alone)
292 spouses (292 opposite-sex spouses), 0 unmarried partners, (0 opposite-sex unmarried partners), 299 children (299 natural, 0 adopted, 0 stepchildren), 13 grandchildren, 6 brothers or sisters, 0 parents, 0 foster children, 32 other relatives, 16 non-relatives
Size of family households: 200 2-persons, 42 3-persons, 49 4-persons, 6 5-persons, 9 6-persons, 52 7-or-more-persons.
Size of nonfamily households: 70 1-person, 10 2-persons.
232 married couples with children.
17 single-parent households (17 men, 0 women).
72.7% of residents of Glasscock speak English at home.
19.4% of residents speak Spanish at home (49% speak English very well, 13% speak English well, 19% speak English not well, 19% don't speak English at all).
3.0% of residents speak other Indo-European language at home (100% speak English very well).
4.6% of residents speak other language at home (100% speak English very well).
In fiscal year 2004:
Federal Government expenditure: $18,704,000 ($14,021 per capita)
Department of Defense expenditure: $64,000
Federal direct payments to individuals for retirement and disability: $1,881,000
Federal other direct payments to individuals: $1,066,000
Federal direct payments not to individuals: $9,640,000
Federal grants: $5,959,000
Federal procurement contracts: $33,000 ($0,000 Department of Defense)
Federal salaries and wages: $126,000 ($0,000 Department of Defense)
Federal Government direct loans: $104,000
Federal guaranteed/insured loans: $157,000
Federal Government insurance: $10,992,000
Population change from April 1, 2000 to July 1, 2005:
Births: 85| Here: | 64 per 1000 residents |
| State: | 85 per 1000 residents |
Deaths: 27
| Here: | 20 per 1000 residents |
| State: | 35 per 1000 residents |
Net international migration: +38
| Here: | +29 per 1000 residents |
| State: | +29 per 1000 residents |
Net internal migration: -171
| Here: | |
| State: |

Total withdrawal of fresh water for public supply: 0.00 millions of gallons per day (all from surface)
| Here: | 6.5 |
| State: | 6.3 |
| Here: | 4.8 |
| State: | 4.0 |
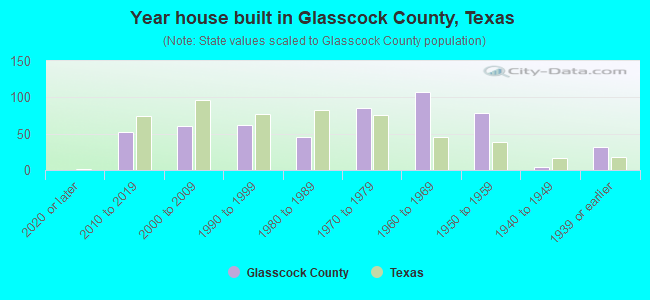
- Year house built in Glasscock County, Texas
- 02020 or later
- 512010 to 2019
- 822000 to 2009
- 621990 to 1999
- 431980 to 1989
- 721970 to 1979
- 1031960 to 1969
- 421950 to 1959
- 61940 to 1949
- 241939 or earlier
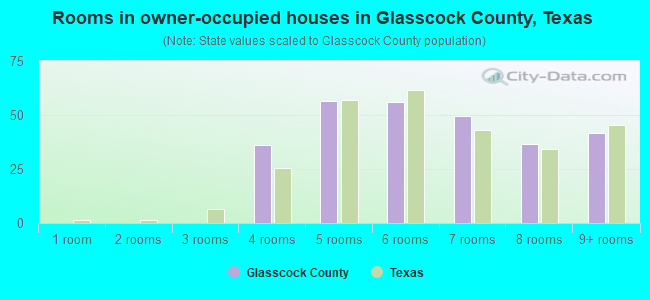
- Rooms in owner-occupied houses in Glasscock County, Texas
- 01 room
- 02 rooms
- 03 rooms
- 294 rooms
- 695 rooms
- 376 rooms
- 557 rooms
- 428 rooms
- 389+ rooms
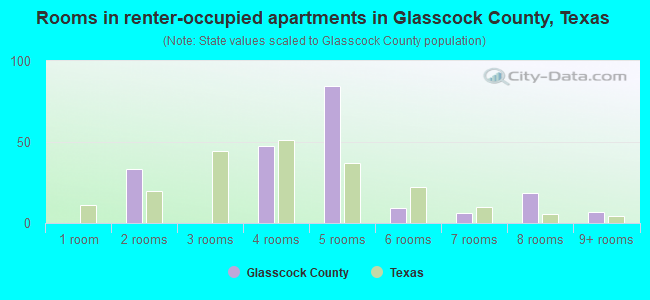
- Rooms in renter-occupied apartments in Glasscock County, Texas
- 01 room
- 02 rooms
- 03 rooms
- 524 rooms
- 695 rooms
- 96 rooms
- 77 rooms
- 258 rooms
- 09+ rooms
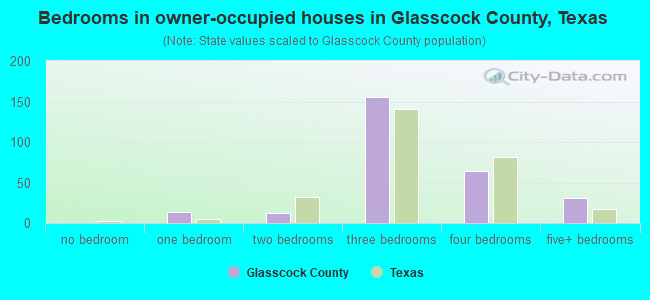
- Bedrooms in owner-occupied houses in Glasscock County, Texas
- 0no bedroom
- 161 bedroom
- 62 bedrooms
- 1653 bedrooms
- 624 bedrooms
- 235+ bedrooms
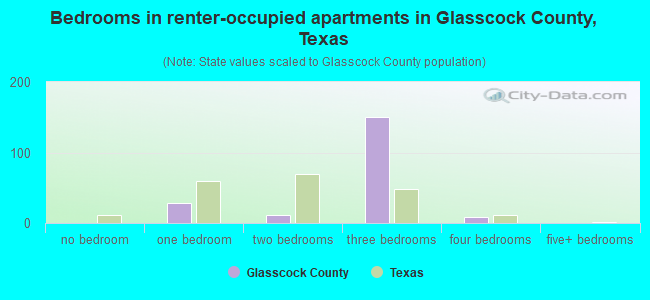
- Bedrooms in renter-occupied apartments in Glasscock County, Texas
- 0no bedroom
- 01 bedroom
- 02 bedrooms
- 1533 bedrooms
- 104 bedrooms
- 05+ bedrooms
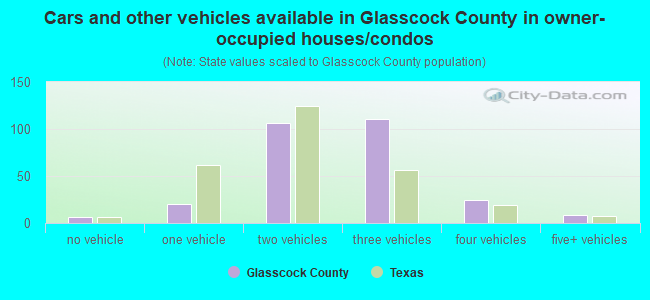
- Cars and other vehicles available in Glasscock County in owner-occupied houses/condos
- 6no vehicle
- 191 vehicle
- 1242 vehicles
- 973 vehicles
- 214 vehicles
- 35+ vehicles
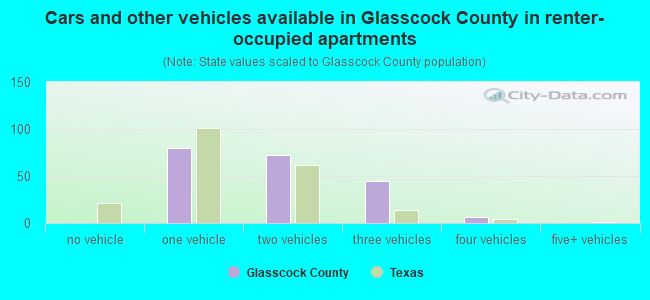
- Cars and other vehicles available in Glasscock County in renter-occupied apartments
- 0no vehicle
- 281 vehicle
- 712 vehicles
- 573 vehicles
- 74 vehicles
- 05+ vehicles
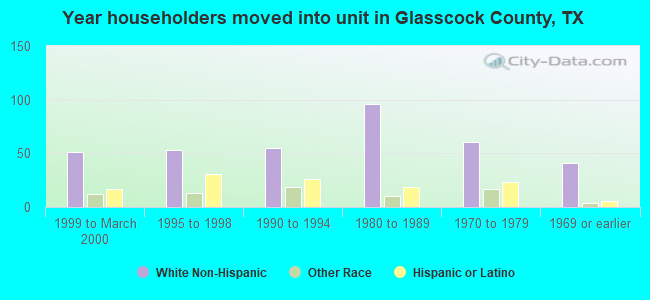
94.4% of Glasscock County residents lived in the same house 1 years ago.
Out of people who lived in different houses, 49% lived in this county.
| Glasscock County: | 94.4% |
| State average: | 85.7% |
Place of birth for U.S.-born residents:
- This state: 821
- Other state: 128
- Northeast: 0
- Midwest: 93
- South: 23
- West: 9
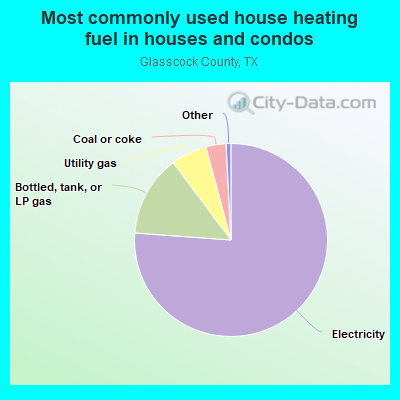
- 75.1%Electricity
- 11.7%Bottled, tank, or LP gas
- 6.6%Utility gas
- 3.5%Fuel oil, kerosene, etc.
- 3.1%Coal or coke
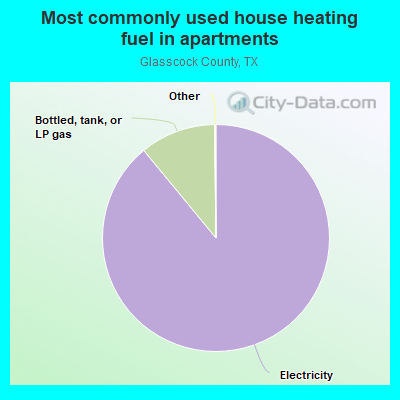
- 81.0%Electricity
- 19.0%Bottled, tank, or LP gas
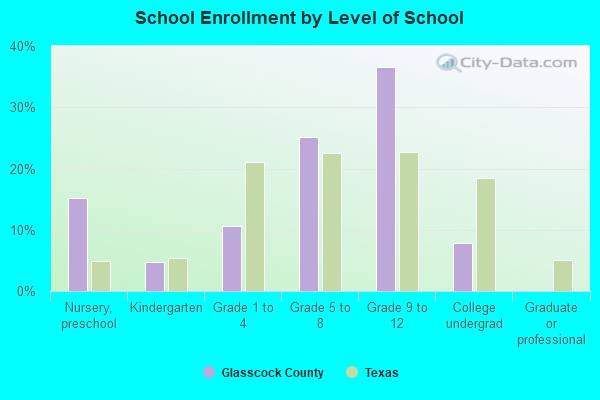
Private vs. public school enrollment:
| Here: | 0.0% |
| Texas: | 8.8% |
| Here: | 0.0% |
| Texas: | 8.0% |
| Here: | 0.0% |
| Texas: | 16.2% |

Glasscock County government finances - Expenditure in 2017:
- Bond Funds - Cash and Securities: $7,000
- Charges - Other: $52,000
Regular Highways: $1,000
- Construction - Regular Highways: $30,000
General - Other: $10,000
- Current Operations - Correctional Institutions: $102,000
Judicial and Legal Services: $84,000
Corrections - Other: $68,000
Police Protection: $61,000
General - Other: $45,000
Regular Highways: $44,000
Financial Administration: $18,000
General Public Buildings: $9,000
Local Fire Protection: $4,000
Central Staff Services: $4,000
Public Welfare, Vendor Payments for Medical Care: $3,000
Public Welfare - Other: $3,000
Natural Resources - Other: $1,000
Solid Waste Management: $1,000
- Federal Intergovernmental - Other: $3,000
- General - Interest on Debt: $6,000
- Local Intergovernmental - Other: $6,000
- Long Term Debt - Beginning Outstanding - Unspecified Public Purpose: $159,000
Outstanding Unspecified Public Purpose: $139,000
Retired Unspecified Public Purpose: $20,000
- Miscellaneous - General Revenue - Other: $18,000
Fines and Forfeits: $8,000
Interest Earnings: $2,000
- Other Capital Outlay - General - Other: $7,000
Corrections - Other: $3,000
Correctional Institutions: $1,000
- Other Funds - Cash and Securities: $309,000
- Sinking Funds - Cash and Securities: $10,000
- State Intergovernmental - Other: $21,000
General Local Government Support: $3,000
Highways: $1,000
- Tax - Property: $312,000
General Sales and Gross Receipts: $99,000
Motor Vehicle License: $20,000
Other Selective Sales: $12,000
Glasscock County government finances - Revenue in 2017:
- Bond Funds - Cash and Securities: $7,000
- Charges - Other: $52,000
Regular Highways: $1,000
- Construction - Regular Highways: $30,000
General - Other: $10,000
- Current Operations - Correctional Institutions: $102,000
Judicial and Legal Services: $84,000
Corrections - Other: $68,000
Police Protection: $61,000
General - Other: $45,000
Regular Highways: $44,000
Financial Administration: $18,000
General Public Buildings: $9,000
Local Fire Protection: $4,000
Central Staff Services: $4,000
Public Welfare, Vendor Payments for Medical Care: $3,000
Public Welfare - Other: $3,000
Natural Resources - Other: $1,000
Solid Waste Management: $1,000
- Federal Intergovernmental - Other: $3,000
- General - Interest on Debt: $6,000
- Local Intergovernmental - Other: $6,000
- Long Term Debt - Beginning Outstanding - Unspecified Public Purpose: $159,000
Outstanding Unspecified Public Purpose: $139,000
Retired Unspecified Public Purpose: $20,000
- Miscellaneous - General Revenue - Other: $18,000
Fines and Forfeits: $8,000
Interest Earnings: $2,000
- Other Capital Outlay - General - Other: $7,000
Corrections - Other: $3,000
Correctional Institutions: $1,000
- Other Funds - Cash and Securities: $309,000
- Sinking Funds - Cash and Securities: $10,000
- State Intergovernmental - Other: $21,000
General Local Government Support: $3,000
Highways: $1,000
- Tax - Property: $312,000
General Sales and Gross Receipts: $99,000
Motor Vehicle License: $20,000
Other Selective Sales: $12,000
Glasscock County government finances - Debt in 2017:
- Bond Funds - Cash and Securities: $7,000
- Charges - Other: $52,000
Regular Highways: $1,000
- Construction - Regular Highways: $30,000
General - Other: $10,000
- Current Operations - Correctional Institutions: $102,000
Judicial and Legal Services: $84,000
Corrections - Other: $68,000
Police Protection: $61,000
General - Other: $45,000
Regular Highways: $44,000
Financial Administration: $18,000
General Public Buildings: $9,000
Local Fire Protection: $4,000
Central Staff Services: $4,000
Public Welfare, Vendor Payments for Medical Care: $3,000
Public Welfare - Other: $3,000
Natural Resources - Other: $1,000
Solid Waste Management: $1,000
- Federal Intergovernmental - Other: $3,000
- General - Interest on Debt: $6,000
- Local Intergovernmental - Other: $6,000
- Long Term Debt - Beginning Outstanding - Unspecified Public Purpose: $159,000
Outstanding Unspecified Public Purpose: $139,000
Retired Unspecified Public Purpose: $20,000
- Miscellaneous - General Revenue - Other: $18,000
Fines and Forfeits: $8,000
Interest Earnings: $2,000
- Other Capital Outlay - General - Other: $7,000
Corrections - Other: $3,000
Correctional Institutions: $1,000
- Other Funds - Cash and Securities: $309,000
- Sinking Funds - Cash and Securities: $10,000
- State Intergovernmental - Other: $21,000
General Local Government Support: $3,000
Highways: $1,000
- Tax - Property: $312,000
General Sales and Gross Receipts: $99,000
Motor Vehicle License: $20,000
Other Selective Sales: $12,000
Glasscock County government finances - Cash and Securities in 2017:
- Bond Funds - Cash and Securities: $7,000
- Charges - Other: $52,000
Regular Highways: $1,000
- Construction - Regular Highways: $30,000
General - Other: $10,000
- Current Operations - Correctional Institutions: $102,000
Judicial and Legal Services: $84,000
Corrections - Other: $68,000
Police Protection: $61,000
General - Other: $45,000
Regular Highways: $44,000
Financial Administration: $18,000
General Public Buildings: $9,000
Local Fire Protection: $4,000
Central Staff Services: $4,000
Public Welfare, Vendor Payments for Medical Care: $3,000
Public Welfare - Other: $3,000
Natural Resources - Other: $1,000
Solid Waste Management: $1,000
- Federal Intergovernmental - Other: $3,000
- General - Interest on Debt: $6,000
- Local Intergovernmental - Other: $6,000
- Long Term Debt - Beginning Outstanding - Unspecified Public Purpose: $159,000
Outstanding Unspecified Public Purpose: $139,000
Retired Unspecified Public Purpose: $20,000
- Miscellaneous - General Revenue - Other: $18,000
Fines and Forfeits: $8,000
Interest Earnings: $2,000
- Other Capital Outlay - General - Other: $7,000
Corrections - Other: $3,000
Correctional Institutions: $1,000
- Other Funds - Cash and Securities: $309,000
- Sinking Funds - Cash and Securities: $10,000
- State Intergovernmental - Other: $21,000
General Local Government Support: $3,000
Highways: $1,000
- Tax - Property: $312,000
General Sales and Gross Receipts: $99,000
Motor Vehicle License: $20,000
Other Selective Sales: $12,000
Supplemental Security Income (SSI) in 2006:
- Total number of recipients: 14
- Number of aged recipients: 0
- Number of blind and disabled recipients: 0
- Number of recipients under 18: 0
- Number of recipients between 18 and 64: 0
- Number of recipients older than 64: 0
- Number of recipients also receiving OASDI: 0
- Amount of payments (thousands of dollars): 6
Glasscock County on our top lists:
- #7 on the list of "Top 101 counties with highest percentage of residents voting for Romney (Republican) in the 2012 Presidential Election"
- #13 on the list of "Top 101 counties with the largest number of children under 18 without health insurance coverage in 2000"
- #19 on the list of "Top 101 counties with the smallest number of people without health insurance coverage in 2000"