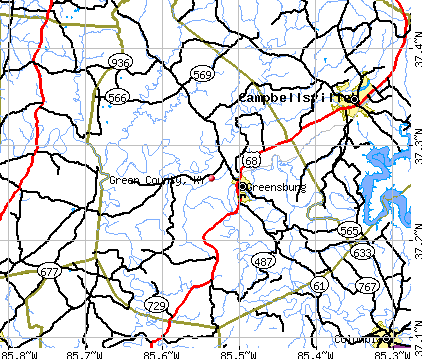
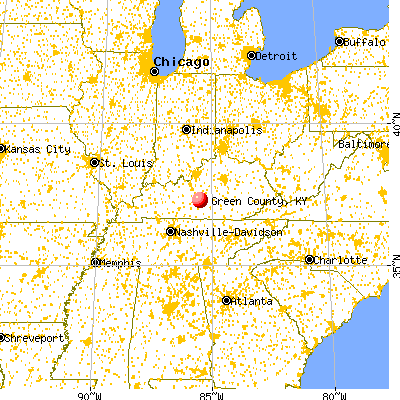
Green County, Kentucky (KY)
County owner-occupied free and clear houses and condos in 2010: 1,559
County owner-occupied houses and condos in 2000: 3,688
Renter-occupied apartments: 1,107 (it was 1,018 in 2000)
| % of renters here: | 22% |
| State: | 31% |
Land area: 289 sq. mi.
Water area: 0.1 sq. mi.
Population density: 39 people per square mile (low).
Industries providing employment: Educational, health and social services (28.8%), Manufacturing (17.8%), Retail trade (12.1%).
Type of workers:
- Private wage or salary: 79%
- Government: 14%
- Self-employed, not incorporated: 7%
- Unpaid family work: 0%
- OSM Map
- General Map
- Google Map
- MSN Map

- 10,40493.1%White Non-Hispanic Alone
- 2692.4%Two or more races
- 2061.8%Hispanic or Latino
- 1941.7%Black Non-Hispanic Alone
- 950.8%American Indian and Alaska Native alone
- 90.08%Asian alone

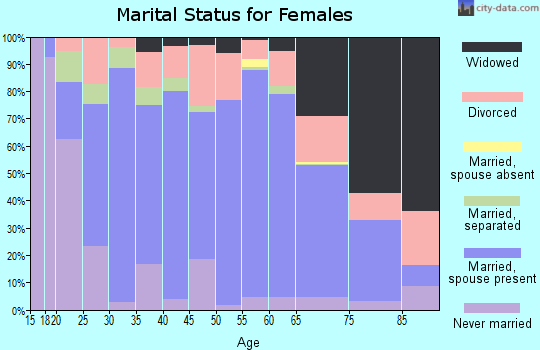
| Median resident age: | 45.4 years |
| Kentucky median age: | 39.4 years |
| Males: 5,608 | |
| Females: 5,613 |

 | Mountain Lion spotted in Oldham County (48 replies) |
| Your favorite places in Kentucky (42 replies) |
| Kentucky's BEST county school districts (18 replies) |
| Green County: | 2.0 people |
| Kentucky: | 2 people |
Estimated median household income in 2022: $38,055 ($25,463 in 1999)
| This county: | $38,055 |
| Kentucky: | $59,341 |
Median contract rent in 2022 for apartments: $421 (lower quartile is $275, upper quartile is $555)
| This county: | $421 |
| State: | $702 |
Estimated median house or condo value in 2022: $107,688 (it was $55,000 in 2000)
| Green: | $107,688 |
| Kentucky: | $196,300 |
Median monthly housing costs for homes and condos with a mortgage: $856
Median monthly housing costs for units without a mortgage: $321
Institutionalized population: 104
Crime in 2021 (reported by the sheriff's office or county police, not the county total):
- Murders: 0
- Rapes: 1
- Robberies: 0
- Assaults: 0
- Burglaries: 2
- Thefts: 3
- Auto thefts: 3
Crime in 2020 (reported by the sheriff's office or county police, not the county total):
- Murders: 0
- Rapes: 0
- Robberies: 0
- Assaults: 1
- Burglaries: 2
- Thefts: 2
- Auto thefts: 3
Single-family new house construction building permits:
- 2022: 2 buildings, average cost: $98,500
- 2021: 1 building, cost: $75,000
- 2020: 0 buildings
- 2019: 1 building, cost: $223,100
- 2018: 0 buildings
- 2017: 0 buildings
- 2016: 0 buildings
- 2015: 0 buildings
- 2014: 1 building, cost: $100,000
- 2013: 1 building, cost: $100,000
- 2012: 0 buildings
- 2011: 0 buildings
- 2010: 1 building, cost: $95,000
- 2009: 3 buildings, average cost: $24,200
- 2008: 7 buildings, average cost: $111,500
- 2007: 8 buildings, average cost: $110,000
- 2006: 0 buildings
- 2005: 0 buildings
- 2004: 0 buildings
- 2003: 0 buildings
- 2002: 0 buildings
- 2001: 0 buildings
- 2000: 0 buildings
- 1999: 0 buildings
- 1998: 0 buildings
- 1997: 0 buildings


Median real estate property taxes paid for housing units with mortgages in 2022: $765 (0.7%)
Median real estate property taxes paid for housing units with no mortgage in 2022: $574 (0.5%)


| Green County: | 21.8% |
| Kentucky: | 16.5% |
Median age of residents in 2022: 45.4 years old
(Males: 44.2 years old, Females: 46.1 years old)
(Median age for: White residents: 45.4 years old, Black residents: 65.9 years old, American Indian residents: 22.9 years old, Hispanic or Latino residents: 35.4 years old)
Fair market rent in 2006 for a 1-bedroom apartment in Green County is $358 a month.
Fair market rent for a 2-bedroom apartment is $429 a month.
Fair market rent for a 3-bedroom apartment is $519 a month.
Cities in this county include: Summersville, Greensburg, Donansburg, Gresham.
Neighboring counties: Grant County, Oklahoma  , Union County, New Mexico , Grant County, Kansas , Labette County, Kansas , Montgomery County, Kansas , Neosho County, Kansas , Polk County, Missouri .
| Here: | 3.4% |
| Kentucky: | 3.8% |


Current college students: 377
People 25 years of age or older with a high school degree or higher: 82.9%
People 25 years of age or older with a bachelor's degree or higher: 13.5%
Number of foreign born residents: 32 (28.7% naturalized citizens)
| Green County: | 0.3% |
| Whole state: | 4.0% |

- Year of entry for the foreign-born population
- 122010 or later
- 02000 to 2009
- 41990 to 1999
- 251980 to 1989
- 301970 to 1979
- 10Before 1970
Mean travel time to work (commute): minutes
Percentage of county residents living and working in this county: 100.1%

Housing units in structures:
- One, detached: 4,081
- One, attached: 53
- Two: 40
- 3 or 4: 43
- 5 to 9: 102
- 10 to 19: 23
- 20 or more: 7
- Mobile homes: 950
- Boats, RVs, vans, etc.: 12
Housing units in Green County with a mortgage: 1,679 (154 second mortgage, 0 home equity loan, 111 both second mortgage and home equity loan)
Houses without a mortgage: 43
| Here: | 2.3% with mortgage |
| State: | 96.8% with mortgage |
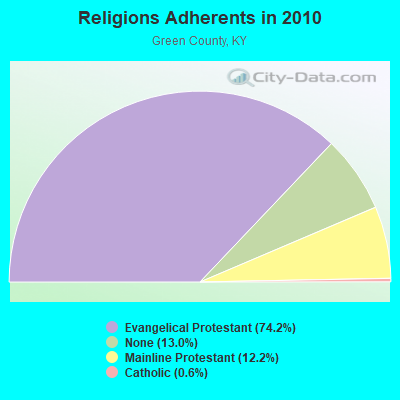
Religion statistics for Green County
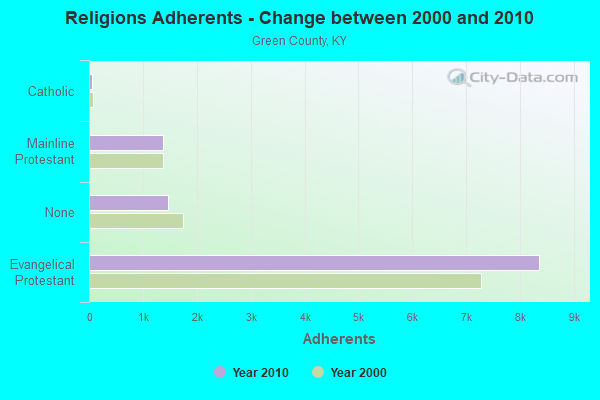
| Religion | Adherents | Congregations |
|---|---|---|
| Evangelical Protestant | 8,358 | 38 |
| Mainline Protestant | 1,376 | 12 |
| Catholic | 62 | 1 |
| None | 1,462 | - |
Source: Clifford Grammich, Kirk Hadaway, Richard Houseal, Dale E.Jones, Alexei Krindatch, Richie Stanley and Richard H.Taylor. 2012. 2010 U.S.Religion Census: Religious Congregations & Membership Study. Association of Statisticians of American Religious Bodies. Jones, Dale E., et al. 2002. Congregations and Membership in the United States 2000. Nashville, TN: Glenmary Research Center.
Food Environment Statistics:
| Green County: | 1.73 / 10,000 pop. |
| State: | 2.19 / 10,000 pop. |
| This county: | 0.87 / 10,000 pop. |
| Kentucky: | 0.74 / 10,000 pop. |
| Green County: | 5.20 / 10,000 pop. |
| Kentucky: | 4.36 / 10,000 pop. |
| This county: | 1.73 / 10,000 pop. |
| State: | 5.74 / 10,000 pop. |
| Green County: | 11.6% |
| Kentucky: | 11.0% |
| Green County: | 31.3% |
| State: | 30.0% |
| Here: | 16.6% |
| State: | 15.9% |
Agriculture in Green County:
Average size of farms: 119 acresAverage value of agricultural products sold per farm: $18,635
Average value of crops sold per acre for harvested cropland: $182.02
The value of nursery, greenhouse, floriculture, and sod as a percentage of the total market value of agricultural products sold: 0.77%
The value of livestock, poultry, and their products as a percentage of the total market value of agricultural products sold: 64.43%
Average total farm production expenses per farm: $14,775
Harvested cropland as a percentage of land in farms: 30.62%
Irrigated harvested cropland as a percentage of land in farms: 0.18%
Average market value of all machinery and equipment per farm: $33,692
The percentage of farms operated by a family or individual: 93.56%
Average age of principal farm operators: 55 years
Average number of cattle and calves per 100 acres of all land in farms: 26.59
Milk cows as a percentage of all cattle and calves: 9.56%
Corn for grain: 2769 harvested acres
All wheat for grain: 460 harvested acres
Soybeans for beans: 1791 harvested acres
Vegetables: 16 harvested acres
Earthquake activity:
Green County-area historical earthquake activity is significantly above Kentucky state average. It is 125% greater than the overall U.S. average.On 7/27/1980 at 18:52:21, a magnitude 5.2 (5.1 MB, 4.7 MS, 5.0 UK, 5.2 UK, Class: Moderate, Intensity: VI - VII) earthquake occurred 108.8 miles away from Green County center
On 4/18/2008 at 09:36:59, a magnitude 5.4 (5.1 MB, 4.8 MS, 5.4 MW, 5.2 MW) earthquake occurred 152.4 miles away from the county center
On 4/18/2008 at 09:36:59, a magnitude 5.2 (5.2 MW, Depth: 8.9 mi) earthquake occurred 152.4 miles away from the county center
On 6/18/2002 at 17:37:15, a magnitude 5.0 (4.3 MB, 4.6 MW, 5.0 LG) earthquake occurred 132.7 miles away from the county center
On 6/10/1987 at 23:48:54, a magnitude 5.1 (4.9 MB, 4.4 MS, 4.6 MS, 5.1 LG) earthquake occurred 167.2 miles away from Green County center
On 9/7/1988 at 02:28:09, a magnitude 4.6 (4.5 MB, 4.6 LG, Class: Light, Intensity: IV - V) earthquake occurred 109.2 miles away from the county center
Magnitude types: regional Lg-wave magnitude (LG), body-wave magnitude (MB), surface-wave magnitude (MS), moment magnitude (MW)
Most recent natural disasters:
- Kentucky Covid-19 Pandemic, Incident Period: January 20, 2020, FEMA Id: 4497, Natural disaster type: Other
- Kentucky Severe Storms, Tornadoes, and Flooding, Incident Period: April 12, 2011 to May 20, 2011, Major Disaster (Presidential) Declared DR-1976: May 04, 2011, FEMA Id: 1976, Natural disaster type: Storm, Tornado, Flood
- Kentucky Severe Storms, Flooding, Mudslides, and Tornadoes, Incident Period: May 01, 2010 to June 01, 2010, Major Disaster (Presidential) Declared DR-1912: May 11, 2010, FEMA Id: 1912, Natural disaster type: Storm, Tornado, Mudslide, Flood
- Kentucky Severe Winter Storm, Incident Period: January 27, 2009 to February 05, 2009, Emergency Declared EM-3302: January 28, 2009, FEMA Id: 3302, Natural disaster type: Winter Storm
- Kentucky Severe Winter Storm and Flooding, Incident Period: January 26, 2009 to February 13, 2009, Major Disaster (Presidential) Declared DR-1818: February 05, 2009, FEMA Id: 1818, Natural disaster type: Winter Storm, Flood
- Kentucky Hurricane Katrina Evacuation, Incident Period: August 29, 2005 to October 01, 2005, Emergency Declared EM-3231: September 10, 2005, FEMA Id: 3231, Natural disaster type: Hurricane
- Kentucky Severe Storms and Flooding, Incident Period: July 13, 2004 to July 15, 2004, Major Disaster (Presidential) Declared DR-1537: August 06, 2004, FEMA Id: 1537, Natural disaster type: Storm, Flood
- Kentucky Severe Winter Storms, Incident Period: February 15, 2003 to February 26, 2003, Major Disaster (Presidential) Declared DR-1454: March 14, 2003, FEMA Id: 1454, Natural disaster type: Winter Storm
- Kentucky Severe Storms, Tornadoes and Flooding, Incident Period: April 27, 2002 to May 10, 2002, Major Disaster (Presidential) Declared DR-1414: May 07, 2002, FEMA Id: 1414, Natural disaster type: Storm, Tornado, Flood
- Kentucky Severe Storms/Flooding, Incident Period: March 01, 1997 to March 31, 1997, Major Disaster (Presidential) Declared DR-1163: March 04, 1997, FEMA Id: 1163, Natural disaster type: Storm, Flood
- 7 other natural disasters have been reported since 1953.
The number of natural disasters in Green County (17) is near the US average (15).
Major Disasters (Presidential) Declared: 13
Emergencies Declared: 3
Causes of natural disasters: Floods: 7, Storms: 7, Tornadoes: 7, Winter Storms: 4, Blizzard: 1, Freeze: 1, Hurricane: 1, Mudslide: 1, Snow: 1, Snowfall: 1, Wind: 1, Other: 1 (Note: some incidents may be assigned to more than one category).

Means of transportation to work:
- Drove a car alone: 1,491 (68.0%)
- Carpooled: 242 (11.0%)
- Bus: 44 (2.0%)
- Taxicab, motorcycle, or other means: 43 (2.0%)
- Walked: 8 (0.4%)
- Worked at home: 394 (18.0%)


- Health care and social assistance (29%)
- Manufacturing (12%)
- Retail trade (11%)
- Educational services (11%)
- Finance and insurance (8%)
- Accommodation and food services (6%)
- Other services, except public administration (4%)

- Health care and social assistance (30%)
- Manufacturing (13%)
- Retail trade (12%)
- Educational services (11%)
- Finance and insurance (8%)
- Accommodation and food services (6%)
- Other services, except public administration (4%)

- Production occupations (13%)
- Construction and extraction occupations (12%)
- Building and grounds cleaning and maintenance occupations (10%)
- Material moving occupations (10%)
- Sales and related occupations (9%)
- Transportation occupations (9%)
- Installation, maintenance, and repair occupations (9%)

- Office and administrative support occupations (25%)
- Healthcare support occupations (10%)
- Sales and related occupations (9%)
- Management occupations (8%)
- Production occupations (8%)
- Educational instruction, and library occupations (7%)
- Business and financial operations occupations (5%)

- Thailand (33%)
- Scotland (24%)
- England (18%)
- Austria (9%)
- Germany (3%)
- Denmark (0%)
- Ireland (0%)

- American (34%)
- English (12%)
- Irish (7%)
- German (3%)
- Italian (2%)
- African (2%)
- Scottish (2%)


9 people in group homes intended for adults
People in group quarters in Green County, Kentucky in 2000:
- 126 people in nursing homes
- 19 people in other noninstitutional group quarters
- 16 people in mental (psychiatric) hospitals or wards
7.19% of this county's 2021 resident taxpayers lived in other counties in 2020 ($35,297 average adjusted gross income)
| Here: | 7.19% |
| Kentucky average: | 7.04% |
10 or fewer of this county's residents moved from foreign countries.
6.39% relocated from other counties in Kentucky ($31,280 average AGI)
0.80% relocated from other states ($4,018 average AGI)
Green County: 0.80% Kentucky average: 2.87%

Top counties from which taxpayers relocated into this county between 2020 and 2021:
| from Taylor County, KY | |
| from Hart County, KY |
5.01% of this county's 2020 resident taxpayers moved to other counties in 2021 ($31,979 average adjusted gross income)
| Here: | 5.01% |
| Kentucky average: | 6.89% |
10 or fewer of this county's residents moved to foreign countries.
4.43% relocated to other counties in Kentucky ($28,126 average AGI)
0.58% relocated to other states ($3,853 average AGI)
Green County: 0.58% Kentucky average: 2.73%

Top counties to which taxpayers relocated from this county between 2020 and 2021:
| to Taylor County, KY |
Births per 1000 population from 1990 to 1999: 10.8
Births per 1000 population from 2000 to 2006: 11.2

Deaths per 1000 population from 1990 to 1999: 11.3
Deaths per 1000 population from 2000 to 2009: 11.8
Deaths per 1000 population from 2010 to 2020: 13.0

Infant deaths per 1000 live births from 1990 to 1999: 7.7
Infant deaths per 1000 live births from 2000 to 2006: 5.7

Persons under 19 years old without health insurance coverage in 2018: 5.8%


Persons enrolled in hospital insurance and/or supplemental medical insurance (Medicare) in July 1, 2007: 2,427 (1,853 aged, 574 disabled)
Children under 18 without health insurance coverage in 2007: 317 (13%)


Most common underlying causes of death in Green County, Kentucky in 1999 - 2019:
- Acute myocardial infarction, unspecified (350)
- Bronchus or lung, unspecified - Malignant neoplasms (135)
- Congestive heart failure (55)
- Atherosclerotic heart disease (20)
- Chronic obstructive pulmonary disease, unspecified (20)
Population without health insurance coverage in 2000: 17%
Children under 18 without health insurance coverage in 2000: 13%
Short term general hospital admissions per 100,000 population in 2004: 12,017
Short term general hospital beds per 100,000 population in 2004: 549
Emergency room visits per 100,000 population in 2004: 50,279
General practice office based MDs per 100,000 population in 2005: 967
Medical specialist MDs per 100,000 population in 2005: 1,087
Total births per 100,000 population, July 2005 - July 2006 : 28
Total deaths per 100,000 population, July 2005 - July 2006: 60
Crimes per 100,000 population in 1996: 1
Household type by relationship:
Households: 11,221- Male householders: 2,062 (480 living alone), Female householders: 2,490 (705 living alone)
2,341 spouses (2,332 opposite-sex spouses), 258 unmarried partners, (233 opposite-sex unmarried partners), 3,167 children (2,844 natural, 55 adopted, 267 stepchildren), 190 grandchildren, 102 brothers or sisters, 134 parents, 3 foster children, 123 other relatives, 231 non-relatives
- In group quarters: 135
Size of family households: 1,472 2-persons, 716 3-persons, 609 4-persons, 229 5-persons, 27 6-persons, 27 7-or-more-persons.
Size of nonfamily households: 1,185 1-person, 252 2-persons, 4 3-persons, 20 4-persons.
1,480 married couples with children.
624 single-parent households (186 men, 438 women).
97.5% of residents of Green speak English at home.
0.7% of residents speak Spanish at home (57% speak English very well, 43% speak English not well).
1.6% of residents speak other Indo-European language at home (33% speak English very well, 67% speak English well).
0.1% of residents speak Asian or Pacific Island language at home (67% speak English well, 33% speak English not well).
In fiscal year 2004:
Federal Government expenditure: $63,265,000 ($5,423 per capita)
Department of Defense expenditure: $589,000
Federal direct payments to individuals for retirement and disability: $28,682,000
Federal other direct payments to individuals: $16,998,000
Federal direct payments not to individuals: $797,000
Federal grants: $14,965,000
Federal procurement contracts: $344,000 ($13,000 Department of Defense)
Federal salaries and wages: $1,478,000 ($0,000 Department of Defense)
Federal Government direct loans: $534,000
Federal guaranteed/insured loans: $965,000
Federal Government insurance: $308,000
Population change from April 1, 2000 to July 1, 2005:
Births: 686| Here: | 59 per 1000 residents |
| State: | 69 per 1000 residents |
Deaths: 691
| Here: | 60 per 1000 residents |
| State: | 50 per 1000 residents |
Net international migration: +17
| Here: | +1 per 1000 residents |
| State: | +7 per 1000 residents |
Net internal migration: +85
| Here: | +7 per 1000 residents |
| State: | +8 per 1000 residents |

Total withdrawal of fresh water for public supply: 1.08 millions of gallons per day (all from surface)
| Here: | 6.2 |
| State: | 6.4 |
| Here: | 4.9 |
| State: | 4.4 |

- Year house built in Green County, Kentucky
- 132020 or later
- 3302010 to 2019
- 6432000 to 2009
- 7471990 to 1999
- 8051980 to 1989
- 5801970 to 1979
- 6051960 to 1969
- 5351950 to 1959
- 2561940 to 1949
- 7051939 or earlier

- Rooms in owner-occupied houses in Green County, Kentucky
- 421 room
- 02 rooms
- 1793 rooms
- 4634 rooms
- 5365 rooms
- 7396 rooms
- 5657 rooms
- 4108 rooms
- 5049+ rooms

- Rooms in renter-occupied apartments in Green County, Kentucky
- 121 room
- 92 rooms
- 1223 rooms
- 3114 rooms
- 2775 rooms
- 1856 rooms
- 1057 rooms
- 828 rooms
- 179+ rooms

- Bedrooms in owner-occupied houses in Green County, Kentucky
- 41no bedroom
- 1081 bedroom
- 9862 bedrooms
- 1,4753 bedrooms
- 6194 bedrooms
- 1915+ bedrooms

- Bedrooms in renter-occupied apartments in Green County, Kentucky
- 13no bedroom
- 2081 bedroom
- 3532 bedrooms
- 4363 bedrooms
- 1024 bedrooms
- 85+ bedrooms

- Cars and other vehicles available in Green County in owner-occupied houses/condos
- 67no vehicle
- 8051 vehicle
- 1,4072 vehicles
- 7753 vehicles
- 2894 vehicles
- 765+ vehicles

- Cars and other vehicles available in Green County in renter-occupied apartments
- 131no vehicle
- 5201 vehicle
- 3552 vehicles
- 933 vehicles
- 174 vehicles
- 185+ vehicles
88.6% of Green County residents lived in the same house 1 years ago.
Out of people who lived in different houses, 30% lived in this county.
Out of people who lived in different counties, 70% lived in Kentucky.
| Green County: | 88.6% |
| State average: | 87.2% |
Place of birth for U.S.-born residents:
- This state: 8,978
- Other state: 2,124
- Northeast: 329
- Midwest: 1,017
- South: 620
- West: 157


- 53.0%Electricity
- 18.6%Bottled, tank, or LP gas
- 15.6%Utility gas
- 10.7%Wood
- 1.3%Fuel oil, kerosene, etc.
- 0.8%No fuel used

- 67.6%Electricity
- 13.3%Utility gas
- 11.1%Wood
- 5.4%Bottled, tank, or LP gas
- 2.0%No fuel used
- 0.4%Other fuel
Private vs. public school enrollment:
| Here: | 8.3% |
| Kentucky: | 17.2% |
| Here: | 12.6% |
| Kentucky: | 15.2% |
| Here: | 17.2% |
| Kentucky: | 19.6% |


Green County government finances - Expenditure in 2018:
- Bond Funds - Cash and Securities: $460,000
Cash and Securities: $133,000
- Charges - Other: $170,000
Other: $93,000
Parks and Recreation: $67,000
Regular Highways: $25,000
Regular Highways: $24,000
Solid Waste Management: $3,000
- Construction - Regular Highways: $330,000
Regular Highways: $147,000
Parks and Recreation: $94,000
Parks and Recreation: $19,000
General Public Buildings: $15,000
Health - Other: $5,000
- Current Operations - Regular Highways: $1,636,000
General - Other: $599,000
Central Staff Services: $411,000
Judicial and Legal Services: $258,000
Police Protection: $232,000
General - Other: $179,000
Health - Other: $96,000
General Public Buildings: $74,000
Parks and Recreation: $72,000
Financial Administration: $67,000
Regular Highways: $66,000
Correctional Institutions: $59,000
Natural Resources - Other: $40,000
Judicial and Legal Services: $38,000
Central Staff Services: $35,000
Police Protection: $23,000
Financial Administration: $9,000
Local Fire Protection: $8,000
Parks and Recreation: $8,000
Local Fire Protection: $8,000
Correctional Institutions: $5,000
Solid Waste Management: $4,000
Solid Waste Management: $3,000
General Public Buildings: $3,000
Health - Other: $3,000
Natural Resources - Other: $3,000
Public Welfare - Other: $1,000
- Federal Intergovernmental - Other: $55,000
Other: $5,000
Health and Hospitals: $4,000
Health and Hospitals: $3,000
- General - Interest on Debt: $287,000
Interest on Debt: $287,000
- Intergovernmental to Local - Other - Correctional Institutions: $196,000
Other - Correctional Institutions: $27,000
Other - Health - Other: $10,000
Other - Natural Resources - Other: $1,000
- Local Intergovernmental - Highways: $18,000
Highways: $2,000
Other: $2,000
Other: $1,000
- Long Term Debt - Beginning Outstanding - Unspecified Public Purpose: $7,175,000
Beginning Outstanding - Unspecified Public Purpose: $7,175,000
Outstanding Unspecified Public Purpose: $7,175,000
Outstanding Unspecified Public Purpose: $6,720,000
Retired Unspecified Public Purpose: $455,000
- Miscellaneous - General Revenue - Other: $142,000
General Revenue - Other: $76,000
Donations From Private Sources: $10,000
Sale of Property: $5,000
Sale of Property: $4,000
Rents: $2,000
Interest Earnings: $2,000
Interest Earnings: $1,000
- Other Capital Outlay - Regular Highways: $94,000
Police Protection: $26,000
Regular Highways: $8,000
Correctional Institutions: $6,000
Financial Administration: $3,000
Police Protection: $2,000
Parks and Recreation: $2,000
Financial Administration: $2,000
Parks and Recreation: $2,000
General - Other: $1,000
- Other Funds - Cash and Securities: $787,000
Cash and Securities: $372,000
- State Intergovernmental - Other: $1,462,000
Highways: $1,204,000
Highways: $1,199,000
Other: $801,000
- Tax - Property: $433,000
Property: $424,000
Insurance Premiums Sales: $338,000
Insurance Premiums Sales: $299,000
Public Utilities Sales: $187,000
Public Utilities Sales: $175,000
Corporation License: $33,000
Corporation License: $32,000
Documentary and Stock Transfer: $26,000
Documentary and Stock Transfer: $25,000
Alcoholic Beverage License: $2,000
Alcoholic Beverage License: $1,000
- Total Salaries and Wages: $719,000
: $57,000
Green County government finances - Revenue in 2018:
- Bond Funds - Cash and Securities: $460,000
Cash and Securities: $133,000
- Charges - Other: $170,000
Other: $93,000
Parks and Recreation: $67,000
Regular Highways: $25,000
Regular Highways: $24,000
Solid Waste Management: $3,000
- Construction - Regular Highways: $330,000
Regular Highways: $147,000
Parks and Recreation: $94,000
Parks and Recreation: $19,000
General Public Buildings: $15,000
Health - Other: $5,000
- Current Operations - Regular Highways: $1,636,000
General - Other: $599,000
Central Staff Services: $411,000
Judicial and Legal Services: $258,000
Police Protection: $232,000
General - Other: $179,000
Health - Other: $96,000
General Public Buildings: $74,000
Parks and Recreation: $72,000
Financial Administration: $67,000
Regular Highways: $66,000
Correctional Institutions: $59,000
Natural Resources - Other: $40,000
Judicial and Legal Services: $38,000
Central Staff Services: $35,000
Police Protection: $23,000
Financial Administration: $9,000
Local Fire Protection: $8,000
Parks and Recreation: $8,000
Local Fire Protection: $8,000
Correctional Institutions: $5,000
Solid Waste Management: $4,000
Solid Waste Management: $3,000
General Public Buildings: $3,000
Health - Other: $3,000
Natural Resources - Other: $3,000
Public Welfare - Other: $1,000
- Federal Intergovernmental - Other: $55,000
Other: $5,000
Health and Hospitals: $4,000
Health and Hospitals: $3,000
- General - Interest on Debt: $287,000
Interest on Debt: $287,000
- Intergovernmental to Local - Other - Correctional Institutions: $196,000
Other - Correctional Institutions: $27,000
Other - Health - Other: $10,000
Other - Natural Resources - Other: $1,000
- Local Intergovernmental - Highways: $18,000
Highways: $2,000
Other: $2,000
Other: $1,000
- Long Term Debt - Beginning Outstanding - Unspecified Public Purpose: $7,175,000
Beginning Outstanding - Unspecified Public Purpose: $7,175,000
Outstanding Unspecified Public Purpose: $7,175,000
Outstanding Unspecified Public Purpose: $6,720,000
Retired Unspecified Public Purpose: $455,000
- Miscellaneous - General Revenue - Other: $142,000
General Revenue - Other: $76,000
Donations From Private Sources: $10,000
Sale of Property: $5,000
Sale of Property: $4,000
Rents: $2,000
Interest Earnings: $2,000
Interest Earnings: $1,000
- Other Capital Outlay - Regular Highways: $94,000
Police Protection: $26,000
Regular Highways: $8,000
Correctional Institutions: $6,000
Financial Administration: $3,000
Police Protection: $2,000
Parks and Recreation: $2,000
Financial Administration: $2,000
Parks and Recreation: $2,000
General - Other: $1,000
- Other Funds - Cash and Securities: $787,000
Cash and Securities: $372,000
- State Intergovernmental - Other: $1,462,000
Highways: $1,204,000
Highways: $1,199,000
Other: $801,000
- Tax - Property: $433,000
Property: $424,000
Insurance Premiums Sales: $338,000
Insurance Premiums Sales: $299,000
Public Utilities Sales: $187,000
Public Utilities Sales: $175,000
Corporation License: $33,000
Corporation License: $32,000
Documentary and Stock Transfer: $26,000
Documentary and Stock Transfer: $25,000
Alcoholic Beverage License: $2,000
Alcoholic Beverage License: $1,000
- Total Salaries and Wages: $719,000
: $57,000
Green County government finances - Debt in 2018:
- Bond Funds - Cash and Securities: $460,000
Cash and Securities: $133,000
- Charges - Other: $170,000
Other: $93,000
Parks and Recreation: $67,000
Regular Highways: $25,000
Regular Highways: $24,000
Solid Waste Management: $3,000
- Construction - Regular Highways: $330,000
Regular Highways: $147,000
Parks and Recreation: $94,000
Parks and Recreation: $19,000
General Public Buildings: $15,000
Health - Other: $5,000
- Current Operations - Regular Highways: $1,636,000
General - Other: $599,000
Central Staff Services: $411,000
Judicial and Legal Services: $258,000
Police Protection: $232,000
General - Other: $179,000
Health - Other: $96,000
General Public Buildings: $74,000
Parks and Recreation: $72,000
Financial Administration: $67,000
Regular Highways: $66,000
Correctional Institutions: $59,000
Natural Resources - Other: $40,000
Judicial and Legal Services: $38,000
Central Staff Services: $35,000
Police Protection: $23,000
Financial Administration: $9,000
Local Fire Protection: $8,000
Parks and Recreation: $8,000
Local Fire Protection: $8,000
Correctional Institutions: $5,000
Solid Waste Management: $4,000
Solid Waste Management: $3,000
General Public Buildings: $3,000
Health - Other: $3,000
Natural Resources - Other: $3,000
Public Welfare - Other: $1,000
- Federal Intergovernmental - Other: $55,000
Other: $5,000
Health and Hospitals: $4,000
Health and Hospitals: $3,000
- General - Interest on Debt: $287,000
Interest on Debt: $287,000
- Intergovernmental to Local - Other - Correctional Institutions: $196,000
Other - Correctional Institutions: $27,000
Other - Health - Other: $10,000
Other - Natural Resources - Other: $1,000
- Local Intergovernmental - Highways: $18,000
Highways: $2,000
Other: $2,000
Other: $1,000
- Long Term Debt - Beginning Outstanding - Unspecified Public Purpose: $7,175,000
Beginning Outstanding - Unspecified Public Purpose: $7,175,000
Outstanding Unspecified Public Purpose: $7,175,000
Outstanding Unspecified Public Purpose: $6,720,000
Retired Unspecified Public Purpose: $455,000
- Miscellaneous - General Revenue - Other: $142,000
General Revenue - Other: $76,000
Donations From Private Sources: $10,000
Sale of Property: $5,000
Sale of Property: $4,000
Rents: $2,000
Interest Earnings: $2,000
Interest Earnings: $1,000
- Other Capital Outlay - Regular Highways: $94,000
Police Protection: $26,000
Regular Highways: $8,000
Correctional Institutions: $6,000
Financial Administration: $3,000
Police Protection: $2,000
Parks and Recreation: $2,000
Financial Administration: $2,000
Parks and Recreation: $2,000
General - Other: $1,000
- Other Funds - Cash and Securities: $787,000
Cash and Securities: $372,000
- State Intergovernmental - Other: $1,462,000
Highways: $1,204,000
Highways: $1,199,000
Other: $801,000
- Tax - Property: $433,000
Property: $424,000
Insurance Premiums Sales: $338,000
Insurance Premiums Sales: $299,000
Public Utilities Sales: $187,000
Public Utilities Sales: $175,000
Corporation License: $33,000
Corporation License: $32,000
Documentary and Stock Transfer: $26,000
Documentary and Stock Transfer: $25,000
Alcoholic Beverage License: $2,000
Alcoholic Beverage License: $1,000
- Total Salaries and Wages: $719,000
: $57,000
Green County government finances - Cash and Securities in 2018:
- Bond Funds - Cash and Securities: $460,000
Cash and Securities: $133,000
- Charges - Other: $170,000
Other: $93,000
Parks and Recreation: $67,000
Regular Highways: $25,000
Regular Highways: $24,000
Solid Waste Management: $3,000
- Construction - Regular Highways: $330,000
Regular Highways: $147,000
Parks and Recreation: $94,000
Parks and Recreation: $19,000
General Public Buildings: $15,000
Health - Other: $5,000
- Current Operations - Regular Highways: $1,636,000
General - Other: $599,000
Central Staff Services: $411,000
Judicial and Legal Services: $258,000
Police Protection: $232,000
General - Other: $179,000
Health - Other: $96,000
General Public Buildings: $74,000
Parks and Recreation: $72,000
Financial Administration: $67,000
Regular Highways: $66,000
Correctional Institutions: $59,000
Natural Resources - Other: $40,000
Judicial and Legal Services: $38,000
Central Staff Services: $35,000
Police Protection: $23,000
Financial Administration: $9,000
Local Fire Protection: $8,000
Parks and Recreation: $8,000
Local Fire Protection: $8,000
Correctional Institutions: $5,000
Solid Waste Management: $4,000
Solid Waste Management: $3,000
General Public Buildings: $3,000
Health - Other: $3,000
Natural Resources - Other: $3,000
Public Welfare - Other: $1,000
- Federal Intergovernmental - Other: $55,000
Other: $5,000
Health and Hospitals: $4,000
Health and Hospitals: $3,000
- General - Interest on Debt: $287,000
Interest on Debt: $287,000
- Intergovernmental to Local - Other - Correctional Institutions: $196,000
Other - Correctional Institutions: $27,000
Other - Health - Other: $10,000
Other - Natural Resources - Other: $1,000
- Local Intergovernmental - Highways: $18,000
Highways: $2,000
Other: $2,000
Other: $1,000
- Long Term Debt - Beginning Outstanding - Unspecified Public Purpose: $7,175,000
Beginning Outstanding - Unspecified Public Purpose: $7,175,000
Outstanding Unspecified Public Purpose: $7,175,000
Outstanding Unspecified Public Purpose: $6,720,000
Retired Unspecified Public Purpose: $455,000
- Miscellaneous - General Revenue - Other: $142,000
General Revenue - Other: $76,000
Donations From Private Sources: $10,000
Sale of Property: $5,000
Sale of Property: $4,000
Rents: $2,000
Interest Earnings: $2,000
Interest Earnings: $1,000
- Other Capital Outlay - Regular Highways: $94,000
Police Protection: $26,000
Regular Highways: $8,000
Correctional Institutions: $6,000
Financial Administration: $3,000
Police Protection: $2,000
Parks and Recreation: $2,000
Financial Administration: $2,000
Parks and Recreation: $2,000
General - Other: $1,000
- Other Funds - Cash and Securities: $787,000
Cash and Securities: $372,000
- State Intergovernmental - Other: $1,462,000
Highways: $1,204,000
Highways: $1,199,000
Other: $801,000
- Tax - Property: $433,000
Property: $424,000
Insurance Premiums Sales: $338,000
Insurance Premiums Sales: $299,000
Public Utilities Sales: $187,000
Public Utilities Sales: $175,000
Corporation License: $33,000
Corporation License: $32,000
Documentary and Stock Transfer: $26,000
Documentary and Stock Transfer: $25,000
Alcoholic Beverage License: $2,000
Alcoholic Beverage License: $1,000
- Total Salaries and Wages: $719,000
: $57,000
Supplemental Security Income (SSI) in 2006:
- Total number of recipients: 691
- Number of aged recipients: 107
- Number of blind and disabled recipients: 584
- Number of recipients under 18: 62
- Number of recipients between 18 and 64: 406
- Number of recipients older than 64: 223
- Number of recipients also receiving OASDI: 308
- Amount of payments (thousands of dollars): 274
| Most common first names in Green County, KY among deceased individuals | ||
| Name | Count | Lived (average) |
|---|---|---|
| William | 110 | 74.0 years |
| James | 80 | 75.1 years |
| Mary | 76 | 79.3 years |
| Robert | 46 | 73.7 years |
| John | 43 | 77.3 years |
| George | 42 | 78.5 years |
| Henry | 29 | 78.4 years |
| Frank | 26 | 79.7 years |
| Charles | 25 | 72.3 years |
| Ruth | 24 | 79.1 years |
| Most common last names in Green County, KY among deceased individuals | ||
| Last name | Count | Lived (average) |
|---|---|---|
| Milby | 99 | 75.8 years |
| Judd | 93 | 73.9 years |
| Davis | 64 | 77.6 years |
| Thompson | 47 | 77.5 years |
| Wright | 46 | 75.9 years |
| Pierce | 46 | 74.2 years |
| Clark | 44 | 81.0 years |
| Jones | 44 | 75.0 years |
| Simpson | 41 | 78.3 years |
| Curry | 41 | 72.3 years |
| Businesses in Green County, KY | ||||
| Name | Count | Name | Count | |
|---|---|---|---|---|
| Dairy Queen | 1 | Rite Aid | 1 | |
| Lane Furniture | 1 | Subway | 1 | |
| McDonald's | 1 | U-Haul | 1 | |
| Pizza Hut | 1 | |||