Greene County, Indiana (IN)
County owner-occupied free and clear houses and condos in 2010: 4,348
County owner-occupied houses and condos in 2000: 10,700
Renter-occupied apartments: 2,939 (it was 2,672 in 2000)
| % of renters here: | 20% |
| State: | 30% |
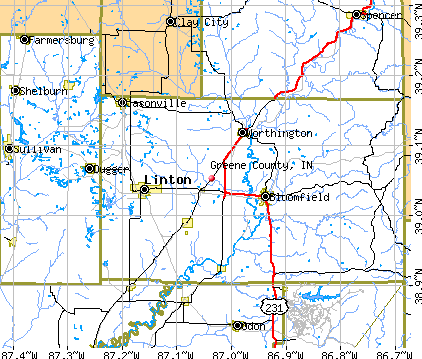
Land area: 542 sq. mi.
Water area: 4.2 sq. mi.
Population density: 57 people per square mile (average).
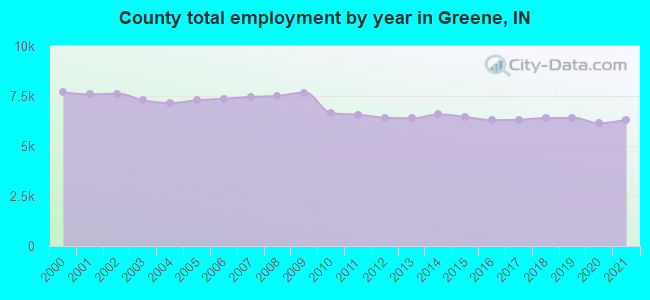
Industries providing employment: Educational, health and social services (21.5%), Manufacturing (15.4%), Retail trade (10.4%), Public administration (10.1%).
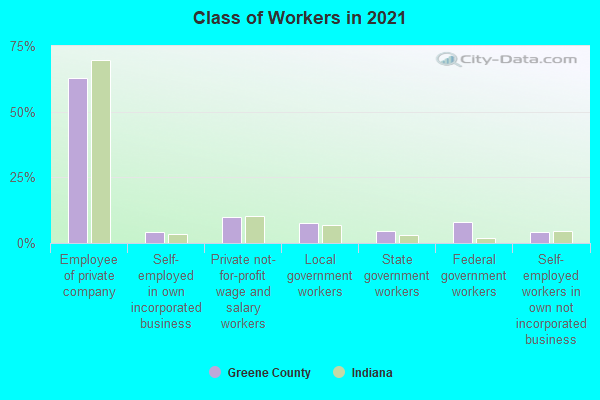
Type of workers:
- Private wage or salary: 77%
- Government: 18%
- Self-employed, not incorporated: 5%
- Unpaid family work: 0%
- OSM Map
- General Map
- Google Map
- MSN Map

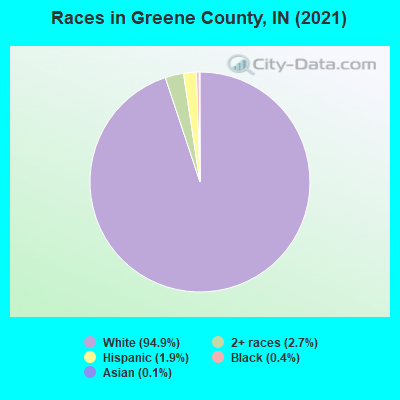
- 29,29495.1%White Non-Hispanic Alone
- 6322.1%Two or more races
- 6212.0%Hispanic or Latino
- 1830.6%Black Non-Hispanic Alone
- 460.1%Asian alone
- 400.1%Some other race alone
| Median resident age: | 43.2 years |
| Indiana median age: | 38.2 years |
| Males: 15,733 | |
| Females: 15,388 |

 | Do you think a Meijer will ever come to Bloomington/Southern Indiana? (35 replies) |
| How do Chicago transplants like Indy? (34 replies) |
| Relocating to Greene County (6 replies) |
| jackson county vs. washington county (15 replies) |
| Cougars, Wolves, Bears, Bobcats in Indiana (55 replies) |
| Where in Indiana to relocate to? (7 replies) |
| Greene County: | 2.0 people |
| Indiana: | 3 people |
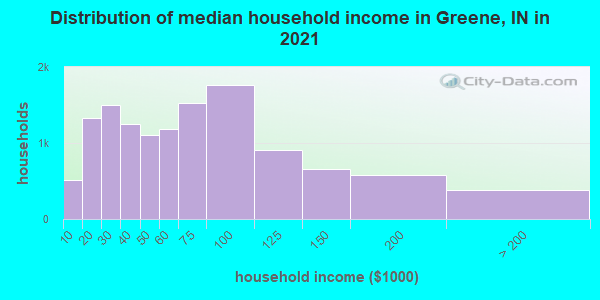
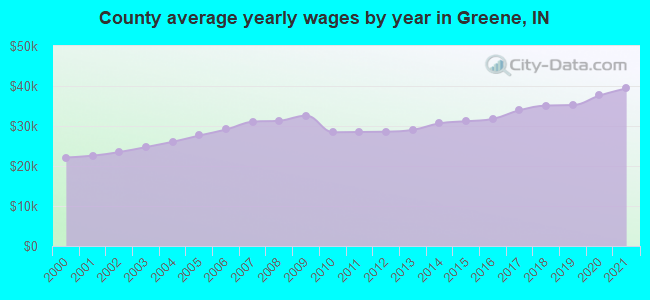
Estimated median household income in 2022: $57,437 ($33,998 in 1999)
| This county: | $57,437 |
| Indiana: | $66,785 |
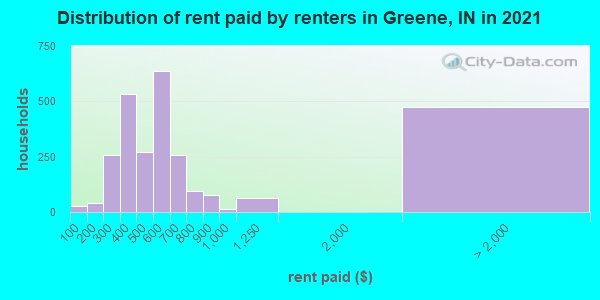
Median contract rent in 2022 for apartments: $520 (lower quartile is $352, upper quartile is $652)
| This county: | $520 |
| State: | $780 |
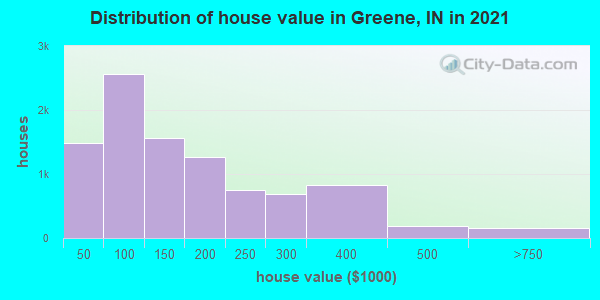
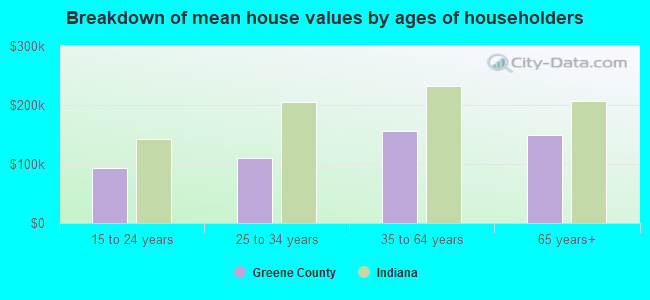
Estimated median house or condo value in 2022: $132,313 (it was $65,300 in 2000)
| Greene: | $132,313 |
| Indiana: | $208,700 |
Mean price in 2022:
Median monthly housing costs for homes and condos with a mortgage: $1,139Detached houses: $204,619
Here: $204,619 State: $257,916 Townhouses or other attached units: $177,149
Here: $177,149 State: $224,114 In 2-unit structures: $141,695
Here: $141,695 State: $175,375 Mobile homes: $98,398
Here: $98,398 State: $67,116
Median monthly housing costs for units without a mortgage: $441
Institutionalized population: 247
Crime in 2021 (reported by the sheriff's office or county police, not the county total):
- Murders: 2
- Rapes: 5
- Robberies: 1
- Assaults: 8
- Burglaries: 20
- Thefts: 86
- Auto thefts: 22
Crime in 2020 (reported by the sheriff's office or county police, not the county total):
- Murders: 0
- Rapes: 16
- Robberies: 4
- Assaults: 10
- Burglaries: 24
- Thefts: 120
- Auto thefts: 35
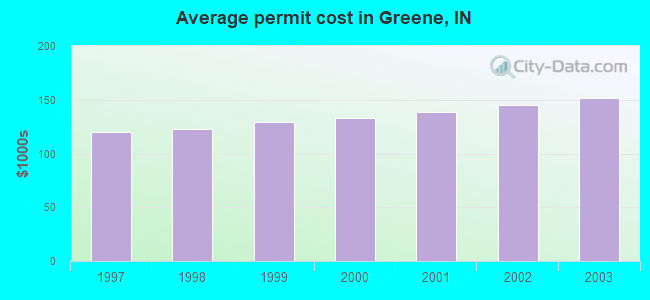
Single-family new house construction building permits:
- 2003: 0 buildings
- 2002: 0 buildings
- 2001: 0 buildings
- 2000: 0 buildings
- 1999: 0 buildings
- 1998: 0 buildings
- 1997: 0 buildings

Median real estate property taxes paid for housing units with mortgages in 2022: $1,051 (0.7%)
Median real estate property taxes paid for housing units with no mortgage in 2022: $739 (0.7%)
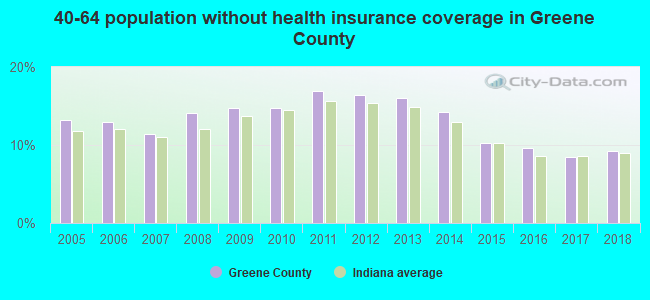
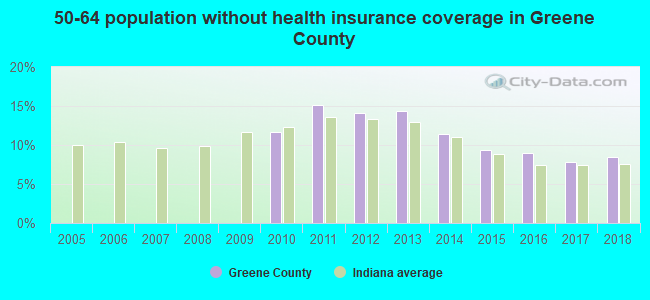
| Greene County: | 14.3% |
| Indiana: | 12.6% |
Median age of residents in 2022: 43.2 years old
(Males: 42.2 years old, Females: 43.8 years old)
(Median age for: White residents: 43.9 years old, Black residents: 56.9 years old, Asian residents: 54.7 years old, Hispanic or Latino residents: 26.6 years old, Other race residents: 23.9 years old)
Fair market rent in 2006 for a 1-bedroom apartment in Greene County is $391 a month.
Fair market rent for a 2-bedroom apartment is $503 a month.
Fair market rent for a 3-bedroom apartment is $730 a month.
Cities in this county include: Linton, Bloomfield, Jasonville, Worthington, Lyons, Owensburg, Switz City, Newberry, Scotland.
2023 air pollution in Greene County:
Ozone (1-hour): 0.036 ppm (standard limit: 0.12 ppm). Near U.S. average.
Particulate Matter (PM2.5) Annual: 10.6 µg/m3(standard limit: 15.0 µg/m3). Near U.S. average.
Neighboring counties: Douglas County, Nevada  , Daviess County
  , Randolph County, West Virginia
  , Taylor County, West Virginia , Lyon County, Kansas , Owen County
  .
.
| Here: | 3.3% |
| Indiana: | 2.8% |
Current college students: 1,162
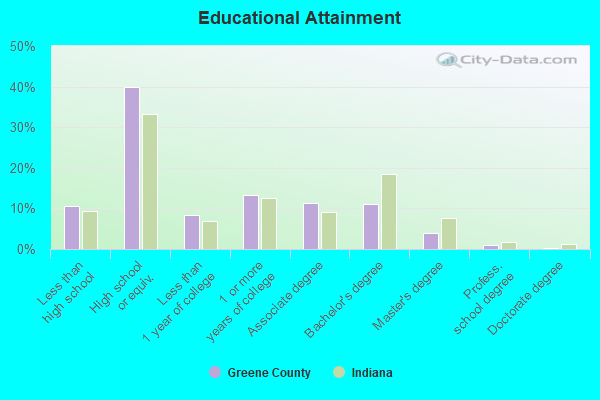
People 25 years of age or older with a high school degree or higher: 88.3%
People 25 years of age or older with a bachelor's degree or higher: 16.1%
Number of foreign born residents: 378 (34.3% naturalized citizens)
| Greene County: | 1.2% |
| Whole state: | 6.1% |
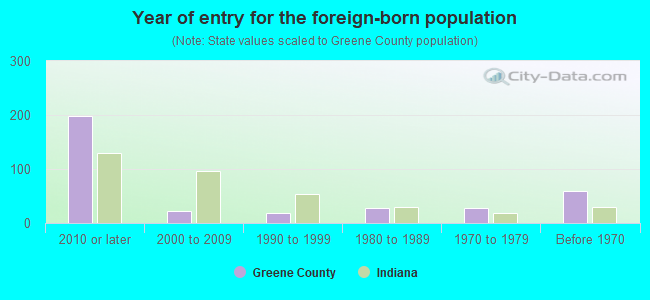
- Year of entry for the foreign-born population
- 2672010 or later
- 252000 to 2009
- 471990 to 1999
- 271980 to 1989
- 281970 to 1979
- 60Before 1970
Mean travel time to work (commute): minutes
Percentage of county residents living and working in this county: 98.7%
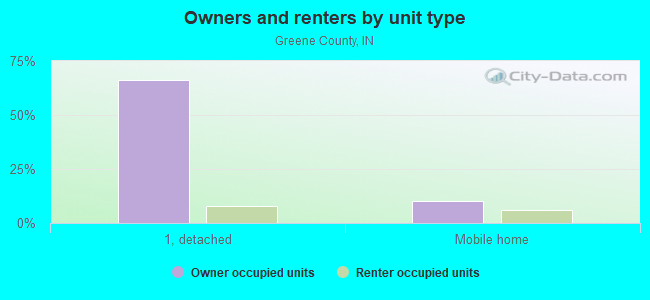
Housing units in structures:
- One, detached: 10,746
- One, attached: 95
- Two: 257
- 3 or 4: 225
- 5 to 9: 370
- 10 to 19: 12
- 20 to 49: 82
- 50 or more: 66
- Mobile homes: 2,626
- Boats, RVs, vans, etc.: 19
Housing units in Greene County with a mortgage: 4,834 (640 second mortgage, 10 home equity loan, 524 both second mortgage and home equity loan)
Houses without a mortgage: 289
| Here: | 1.4% with mortgage |
| State: | 96.6% with mortgage |
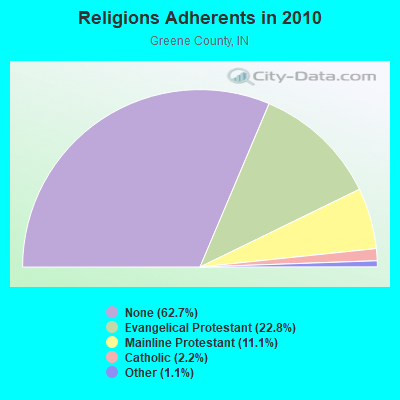
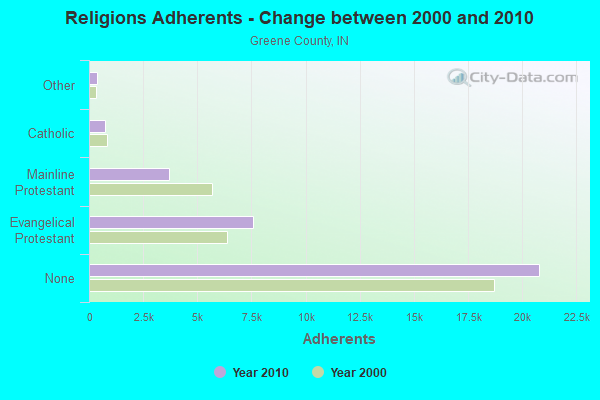
Religion statistics for Greene County
| Religion | Adherents | Congregations |
|---|---|---|
| Evangelical Protestant | 7,562 | 59 |
| Mainline Protestant | 3,689 | 24 |
| Catholic | 746 | 3 |
| Other | 374 | 2 |
| None | 20,794 | - |
Source: Clifford Grammich, Kirk Hadaway, Richard Houseal, Dale E.Jones, Alexei Krindatch, Richie Stanley and Richard H.Taylor. 2012. 2010 U.S.Religion Census: Religious Congregations & Membership Study. Association of Statisticians of American Religious Bodies. Jones, Dale E., et al. 2002. Congregations and Membership in the United States 2000. Nashville, TN: Glenmary Research Center.
Food Environment Statistics:
| Greene County: | 2.14 / 10,000 pop. |
| State: | 1.73 / 10,000 pop. |
| Here: | 0.31 / 10,000 pop. |
| Indiana: | 0.21 / 10,000 pop. |
| This county: | 0.31 / 10,000 pop. |
| Indiana: | 0.50 / 10,000 pop. |
| Greene County: | 5.82 / 10,000 pop. |
| Indiana: | 3.57 / 10,000 pop. |
| This county: | 6.43 / 10,000 pop. |
| State: | 6.78 / 10,000 pop. |
| Greene County: | 10.3% |
| Indiana: | 9.2% |
| Greene County: | 28.6% |
| State: | 29.0% |
| Here: | 13.4% |
| State: | 14.3% |
Agriculture in Greene County:
Average size of farms: 207 acresAverage value of agricultural products sold per farm: $50,027
Average value of crops sold per acre for harvested cropland: $191.00
The value of nursery, greenhouse, floriculture, and sod as a percentage of the total market value of agricultural products sold: 3.31%
The value of livestock, poultry, and their products as a percentage of the total market value of agricultural products sold: 58.39%
Average total farm production expenses per farm: $52,093
Harvested cropland as a percentage of land in farms: 52.53%
Irrigated harvested cropland as a percentage of land in farms: 1.71%
Average market value of all machinery and equipment per farm: $44,008
The percentage of farms operated by a family or individual: 93.43%
Average age of principal farm operators: 55 years
Average number of cattle and calves per 100 acres of all land in farms: 9.80
Milk cows as a percentage of all cattle and calves: 4.50%
Corn for grain: 33354 harvested acres
All wheat for grain: 844 harvested acres
Soybeans for beans: 36822 harvested acres
Vegetables: 17 harvested acres
Land in orchards: 30 acres
Earthquake activity:
Greene County-area historical earthquake activity is significantly above Indiana state average. It is 139% greater than the overall U.S. average.On 4/18/2008 at 09:36:59, a magnitude 5.4 (5.1 MB, 4.8 MS, 5.4 MW, 5.2 MW, Class: Moderate, Intensity: VI - VII) earthquake occurred 61.8 miles away from Greene County center
On 4/18/2008 at 09:36:59, a magnitude 5.2 (5.2 MW, Depth: 8.9 mi) earthquake occurred 61.8 miles away from the county center
On 6/10/1987 at 23:48:54, a magnitude 5.1 (4.9 MB, 4.4 MS, 4.6 MS, 5.1 LG) earthquake occurred 48.3 miles away from the county center
On 6/18/2002 at 17:37:15, a magnitude 5.0 (4.3 MB, 4.6 MW, 5.0 LG) earthquake occurred 83.9 miles away from the county center
On 4/18/2008 at 15:14:16, a magnitude 4.8 (4.5 MB, 4.8 MW, 4.6 MW, Class: Light, Intensity: IV - V) earthquake occurred 59.1 miles away from Greene County center
On 4/18/2008 at 15:14:17, a magnitude 4.7 (4.7 MW, Depth: 9.6 mi) earthquake occurred 60.8 miles away from the county center
Magnitude types: regional Lg-wave magnitude (LG), body-wave magnitude (MB), surface-wave magnitude (MS), moment magnitude (MW)
Most recent natural disasters:
- Indiana Covid-19 Pandemic, Incident Period: January 31, 2020, FEMA Id: 4515, Natural disaster type: Other
- Indiana Severe Storms and Flooding, Incident Period: May 30, 2008 to June 27, 2008, Major Disaster (Presidential) Declared DR-1766: June 08, 2008, FEMA Id: 1766, Natural disaster type: Storm, Flood
- Indiana Hurricane Katrina Evacuation, Incident Period: August 29, 2005 to October 01, 2005, Emergency Declared EM-3238: September 10, 2005, FEMA Id: 3238, Natural disaster type: Hurricane
- Indiana Severe Winter Storms and Flooding, Incident Period: January 01, 2005 to February 11, 2005, Major Disaster (Presidential) Declared DR-1573: January 21, 2005, FEMA Id: 1573, Natural disaster type: Winter Storm, Flood
- Indiana Snow, Incident Period: December 21, 2004 to December 23, 2004, Emergency Declared EM-3197: January 11, 2005, FEMA Id: 3197, Natural disaster type: Snow
- Indiana Tornadoes, and Flooding, Incident Period: July 03, 2004 to July 18, 2004, Major Disaster (Presidential) Declared DR-1542: September 01, 2004, FEMA Id: 1542, Natural disaster type: Tornado, Flood
- Indiana Severe Storms, Tornadoes, and Flooding, Incident Period: May 25, 2004 to June 25, 2004, Major Disaster (Presidential) Declared DR-1520: June 03, 2004, FEMA Id: 1520, Natural disaster type: Storm, Tornado, Flood
- Indiana Severe Storms, Tornadoes, and Flooding, Incident Period: August 26, 2003 to September 15, 2003, Major Disaster (Presidential) Declared DR-1487: September 05, 2003, FEMA Id: 1487, Natural disaster type: Storm, Tornado, Flood
- Indiana Severe Storms, Tornadoes, and Flooding, Incident Period: July 04, 2003 to August 06, 2003, Major Disaster (Presidential) Declared DR-1476: July 11, 2003, FEMA Id: 1476, Natural disaster type: Storm, Tornado, Flood
- Indiana Severe Storms and Tornadoes, Incident Period: September 20, 2002, Major Disaster (Presidential) Declared DR-1433: September 25, 2002, FEMA Id: 1433, Natural disaster type: Storm, Tornado
- 6 other natural disasters have been reported since 1953.
The number of natural disasters in Greene County (16) is near the US average (15).
Major Disasters (Presidential) Declared: 13
Emergencies Declared: 2
Causes of natural disasters: Floods: 11, Storms: 10, Tornadoes: 8, Blizzard: 1, Hurricane: 1, Snow: 1, Winter Storm: 1, Other: 1 (Note: some incidents may be assigned to more than one category).
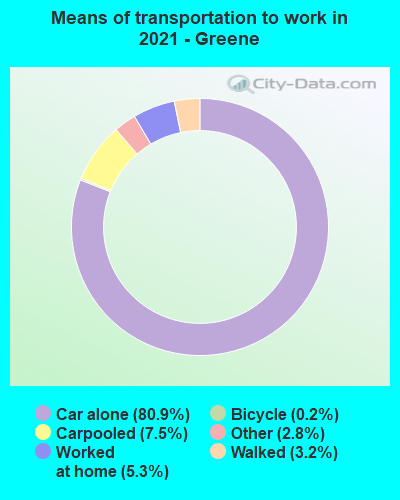
Means of transportation to work:
- Drove a car alone: 5,963 (72.9%)
- Carpooled: 839 (10.3%)
- Taxicab, motorcycle, or other means: 266 (3.3%)
- Bicycle: 20 (0.2%)
- Walked: 300 (3.7%)
- Worked at home: 804 (9.8%)
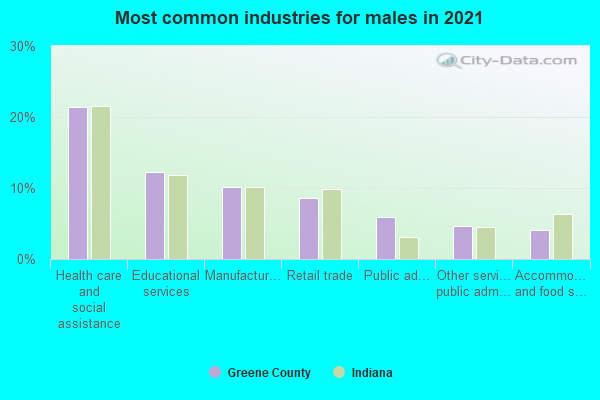
- Health care and social assistance (21%)
- Manufacturing (11%)
- Educational services (10%)
- Retail trade (9%)
- Public administration (6%)
- Other services, except public administration (5%)
- Accommodation and food services (5%)
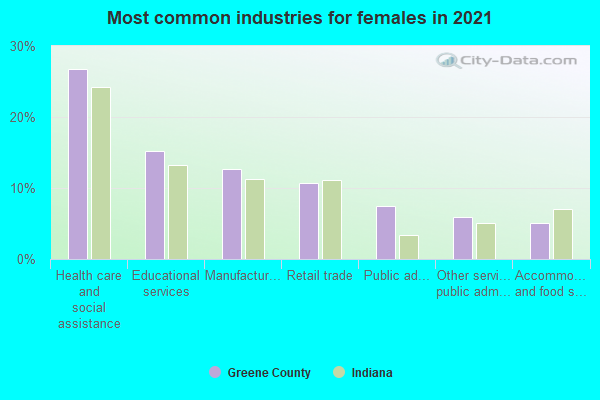
- Health care and social assistance (27%)
- Manufacturing (13%)
- Educational services (13%)
- Retail trade (12%)
- Public administration (7%)
- Other services, except public administration (6%)
- Accommodation and food services (6%)
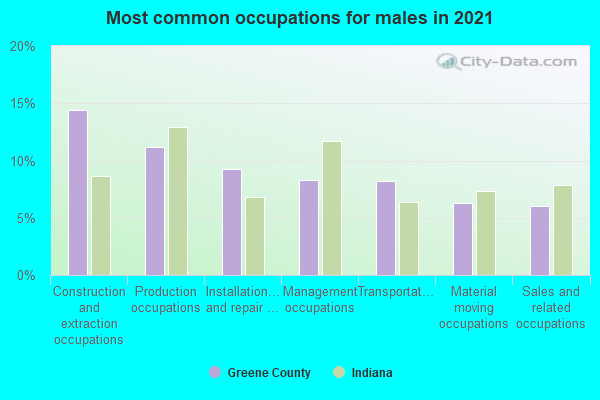
- Construction and extraction occupations (13%)
- Production occupations (12%)
- Installation, maintenance, and repair occupations (9%)
- Transportation occupations (8%)
- Management occupations (7%)
- Sales and related occupations (7%)
- Material moving occupations (6%)
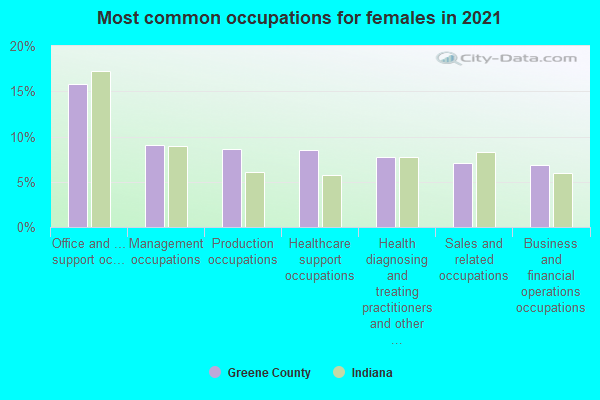
- Office and administrative support occupations (14%)
- Production occupations (10%)
- Sales and related occupations (10%)
- Management occupations (10%)
- Health diagnosing and treating practitioners and other technical occupations (9%)
- Healthcare support occupations (8%)
- Educational instruction, and library occupations (6%)
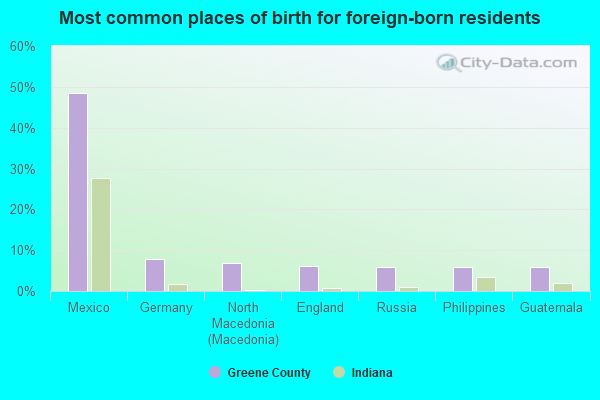
- Mexico (38%)
- Guatemala (19%)
- Honduras (11%)
- Germany (6%)
- England (4%)
- Philippines (4%)
- Burma (Myanmar) (4%)
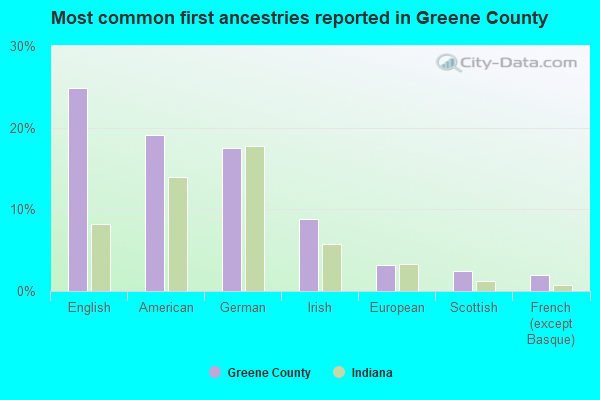
- English (22%)
- American (22%)
- German (16%)
- Irish (9%)
- European (3%)
- Italian (2%)
- Scottish (2%)
People in group quarters in Greene County, Indiana in 2010:
- 140 people in nursing facilities/skilled-nursing facilities
- 76 people in local jails and other municipal confinement facilities
- 31 people in correctional residential facilities
- 20 people in other noninstitutional facilities
- 14 people in group homes intended for adults
People in group quarters in Greene County, Indiana in 2000:
- 393 people in nursing homes
- 79 people in local jails and other confinement facilities (including police lockups)
- 42 people in other noninstitutional group quarters
- 16 people in hospitals/wards and hospices for chronically ill
- 16 people in other hospitals or wards for chronically ill
- 7 people in homes or halfway houses for drug/alcohol abuse
- 7 people in homes for the mentally retarded
- 2 people in religious group quarters
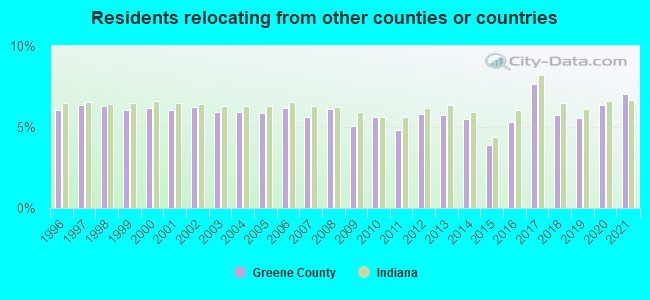
7.01% of this county's 2021 resident taxpayers lived in other counties in 2020 ($42,573 average adjusted gross income)
| Here: | 7.01% |
| Indiana average: | 6.66% |
10 or fewer of this county's residents moved from foreign countries.
5.97% relocated from other counties in Indiana ($34,094 average AGI)
1.04% relocated from other states ($8,480 average AGI)
Greene County: 1.04% Indiana average: 2.58%
Top counties from which taxpayers relocated into this county between 2020 and 2021:
| from Monroe County, IN | |
| from Sullivan County, IN | |
| from Lawrence County, IN | |
| from Owen County, IN | |
| from Marion County, IN | |
| from Daviess County, IN | |
| from Knox County, IN |
5.64% of this county's 2020 resident taxpayers moved to other counties in 2021 ($42,430 average adjusted gross income)
| Here: | 5.64% |
| Indiana average: | 6.55% |
10 or fewer of this county's residents moved to foreign countries.
4.72% relocated to other counties in Indiana ($33,333 average AGI)
0.92% relocated to other states ($9,097 average AGI)
Greene County: 0.92% Indiana average: 2.46%

Top counties to which taxpayers relocated from this county between 2020 and 2021:
| to Monroe County, IN | |
| to Sullivan County, IN | |
| to Owen County, IN | |
| to Vigo County, IN | |
| to Lawrence County, IN | |
| to Daviess County, IN | |
| to Marion County, IN |
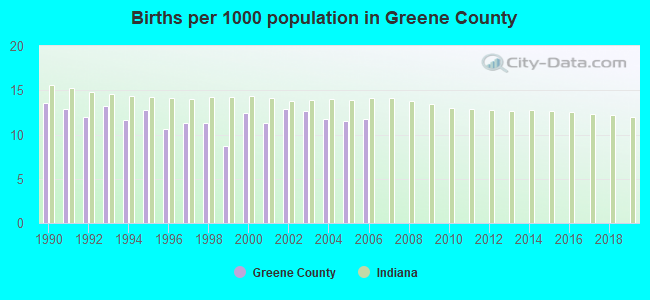
Births per 1000 population from 1990 to 1999: 11.8
Births per 1000 population from 2000 to 2006: 12.0
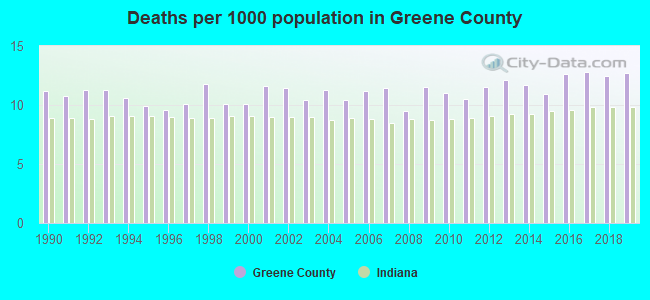
Deaths per 1000 population from 1990 to 1999: 10.7
Deaths per 1000 population from 2000 to 2009: 10.9
Deaths per 1000 population from 2010 to 2020: 12.0
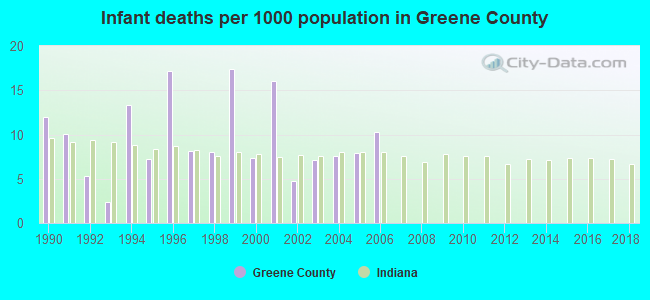
Infant deaths per 1000 live births from 1990 to 1999: 10.1
Infant deaths per 1000 live births from 2000 to 2006: 8.7
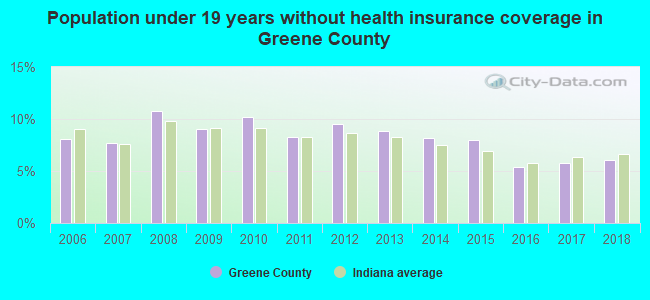
Persons under 19 years old without health insurance coverage in 2018: 6.1%
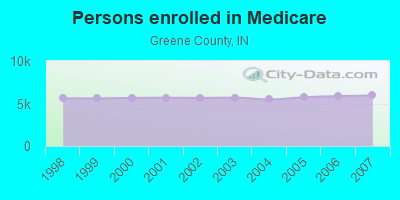
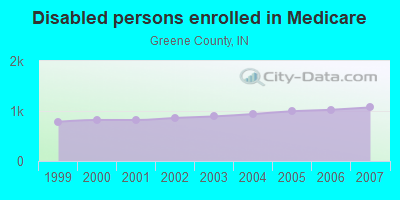
Persons enrolled in hospital insurance and/or supplemental medical insurance (Medicare) in July 1, 2007: 5,942 (4,870 aged, 1,072 disabled)
Children under 18 without health insurance coverage in 2007: 552 (7%)

Most common underlying causes of death in Greene County, Indiana in 1999 - 2019:
- Acute myocardial infarction, unspecified (705)
- Bronchus or lung, unspecified - Malignant neoplasms (568)
- Atherosclerotic heart disease (535)
- Chronic obstructive pulmonary disease, unspecified (391)
- Congestive heart failure (184)
- Stroke, not specified as haemorrhage or infarction (180)
- Alzheimer disease, unspecified (172)
- Unspecified dementia (83)
- Disorder of lipoprotein metabolism, unspecified (81)
- Atherosclerotic cardiovascular disease, so described (67)
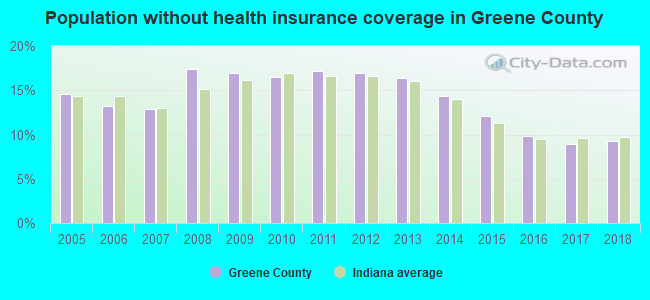
Population without health insurance coverage in 2000: 13%
Children under 18 without health insurance coverage in 2000: 11%
Short term general hospital admissions per 100,000 population in 2004: 4,036
Short term general hospital beds per 100,000 population in 2004: 75
Emergency room visits per 100,000 population in 2004: 26,379
General practice office based MDs per 100,000 population in 2005: 1,144
Medical specialist MDs per 100,000 population in 2005: 1,090
Dentists per 100,000 population in 1998: 15
Total births per 100,000 population, July 2005 - July 2006 : 36
Total deaths per 100,000 population, July 2005 - July 2006: 63
Limited-service eating places per 100,000 population in 2005 : 6
Beer, wine & liquor stores per 100,000 population in 2005: 1
Suicides per 1,000,000 population from 2000 to 2006: 146.9. This is more than state average.
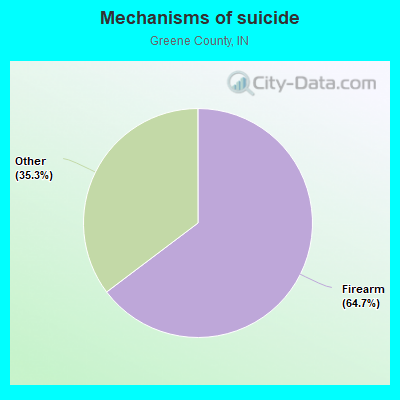
- Firearm - 95.0
- Other - 51.8
Household type by relationship:
Households: 31,121- Male householders: 6,879 (2,078 living alone), Female householders: 6,101 (1,527 living alone)
6,667 spouses (6,620 opposite-sex spouses), 849 unmarried partners, (830 opposite-sex unmarried partners), 7,880 children (6,929 natural, 259 adopted, 698 stepchildren), 893 grandchildren, 151 brothers or sisters, 368 parents, 24 foster children, 540 other relatives, 480 non-relatives
- In group quarters: 339
Size of family households: 4,754 2-persons, 1,793 3-persons, 1,084 4-persons, 625 5-persons, 325 6-persons, 155 7-or-more-persons.
Size of nonfamily households: 3,600 1-person, 622 2-persons, 52 3-persons.
4,060 married couples with children.
1,510 single-parent households (403 men, 1,107 women).
97.3% of residents of Greene speak English at home.
1.2% of residents speak Spanish at home (41% speak English very well, 18% speak English well, 41% speak English not well).
0.8% of residents speak other Indo-European language at home (89% speak English very well, 11% speak English well).
0.1% of residents speak Asian or Pacific Island language at home (65% speak English very well, 35% speak English not well).
In fiscal year 2004:
Federal Government expenditure: $238,296,000 ($7,113 per capita)
Department of Defense expenditure: $57,917,000
Federal direct payments to individuals for retirement and disability: $99,224,000
Federal other direct payments to individuals: $37,821,000
Federal direct payments not to individuals: $5,732,000
Federal grants: $34,952,000
Federal procurement contracts: $52,358,000 ($51,095,000 Department of Defense)
Federal salaries and wages: $8,209,000 ($3,000,000 Department of Defense)
Federal Government direct loans: $279,000
Federal guaranteed/insured loans: $9,754,000
Federal Government insurance: $17,126,000
Population change from April 1, 2000 to July 1, 2005:
Births: 2,144| Here: | 64 per 1000 residents |
| State: | 72 per 1000 residents |
Deaths: 1,862
| Here: | 56 per 1000 residents |
| State: | 47 per 1000 residents |
Net international migration: +21
| Here: | +1 per 1000 residents |
| State: | +9 per 1000 residents |
Net internal migration: +88
| Here: | |
| State: |
Total withdrawal of fresh water for public supply: 2.66 millions of gallons per day (all from ground)
| Here: | 6.2 |
| State: | 6.6 |
| Here: | 4.5 |
| State: | 4.3 |
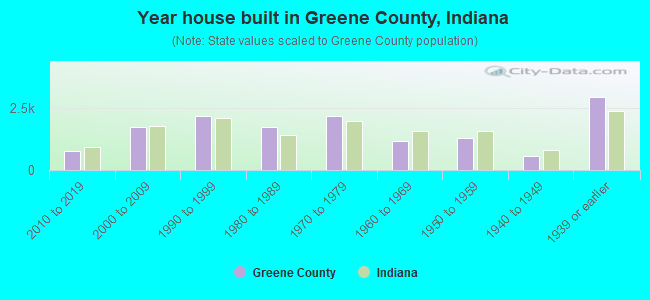
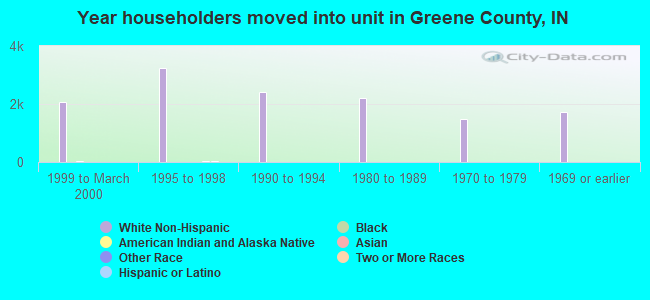
- Year house built in Greene County, Indiana
- 672020 or later
- 8292010 to 2019
- 1,5642000 to 2009
- 2,2411990 to 1999
- 1,7121980 to 1989
- 2,2651970 to 1979
- 1,1011960 to 1969
- 1,1071950 to 1959
- 6031940 to 1949
- 2,8691939 or earlier
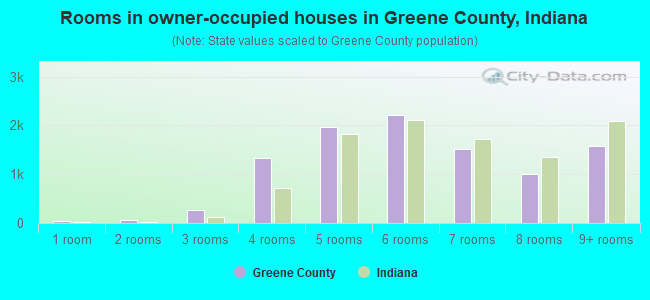
- Rooms in owner-occupied houses in Greene County, Indiana
- 311 room
- 662 rooms
- 3313 rooms
- 1,1544 rooms
- 1,9965 rooms
- 2,0236 rooms
- 1,7967 rooms
- 9898 rooms
- 1,5239+ rooms
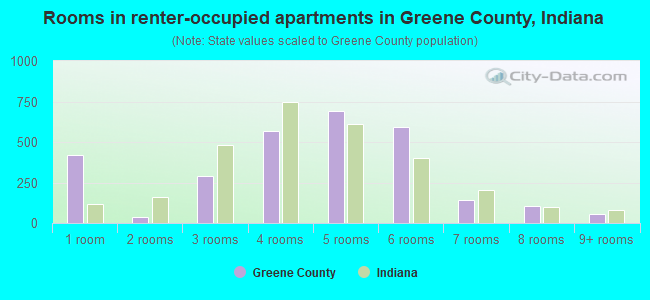
- Rooms in renter-occupied apartments in Greene County, Indiana
- 3811 room
- 652 rooms
- 2983 rooms
- 7184 rooms
- 7085 rooms
- 5476 rooms
- 1567 rooms
- 1478 rooms
- 499+ rooms
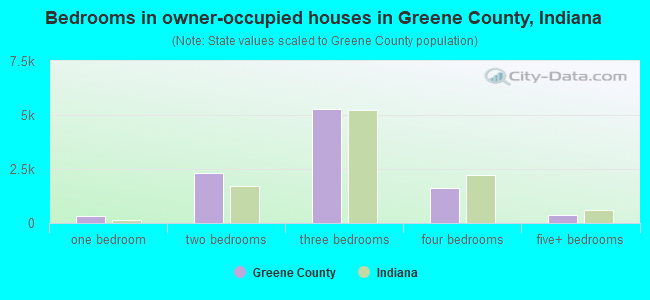
- Bedrooms in owner-occupied houses in Greene County, Indiana
- 53no bedroom
- 3311 bedroom
- 2,4992 bedrooms
- 4,9553 bedrooms
- 1,7854 bedrooms
- 2695+ bedrooms
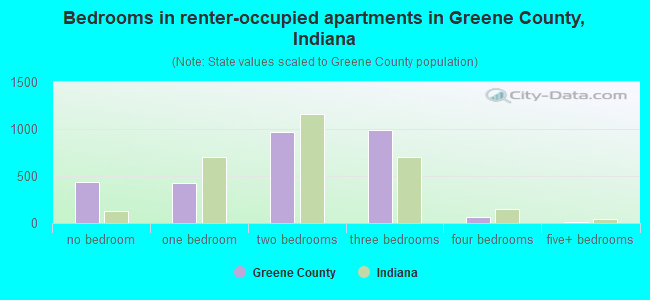
- Bedrooms in renter-occupied apartments in Greene County, Indiana
- 395no bedroom
- 4751 bedroom
- 1,0712 bedrooms
- 1,0553 bedrooms
- 844 bedrooms
- 85+ bedrooms
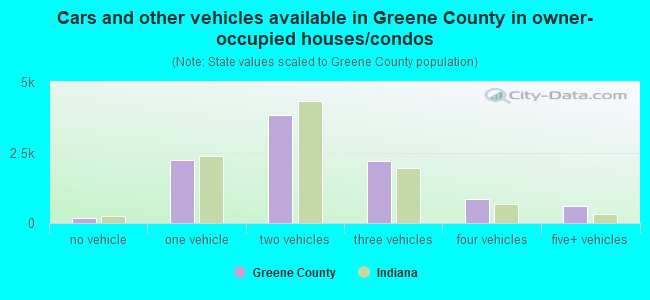
- Cars and other vehicles available in Greene County in owner-occupied houses/condos
- 194no vehicle
- 2,3211 vehicle
- 3,7822 vehicles
- 2,2083 vehicles
- 8734 vehicles
- 4805+ vehicles
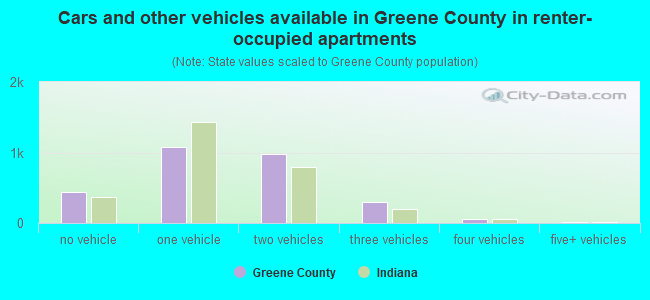
- Cars and other vehicles available in Greene County in renter-occupied apartments
- 611no vehicle
- 1,1301 vehicle
- 9562 vehicles
- 3083 vehicles
- 654 vehicles
- 225+ vehicles
88.9% of Greene County residents lived in the same house 1 years ago.
Out of people who lived in different houses, 34% lived in this county.
Out of people who lived in different counties, 82% lived in Indiana.
| Greene County: | 88.9% |
| State average: | 87.1% |
Place of birth for U.S.-born residents:
- This state: 25,289
- Other state: 5,123
- Northeast: 478
- Midwest: 2,255
- South: 1,663
- West: 733
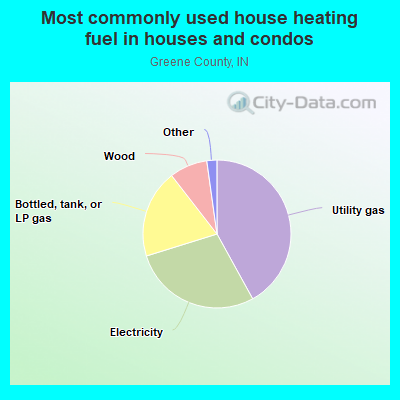
- 42.8%Utility gas
- 26.8%Electricity
- 20.8%Bottled, tank, or LP gas
- 8.0%Wood
- 1.0%Fuel oil, kerosene, etc.
- 0.5%No fuel used
- 0.1%Solar energy
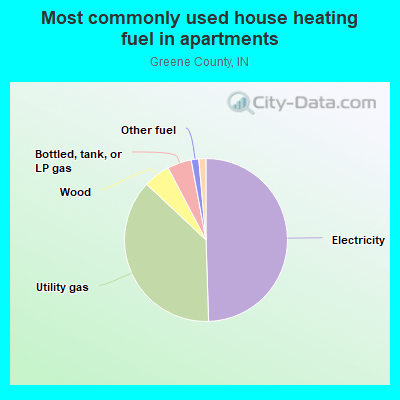
- 49.9%Electricity
- 37.9%Utility gas
- 5.6%Bottled, tank, or LP gas
- 4.1%Wood
- 1.6%Other fuel
- 0.7%No fuel used
- 0.2%Fuel oil, kerosene, etc.
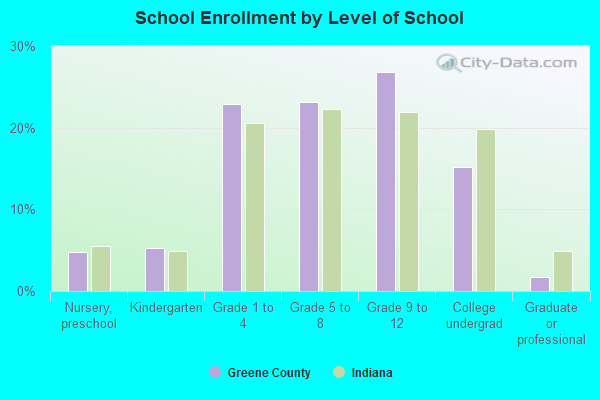
Private vs. public school enrollment:
| Here: | 9.5% |
| Indiana: | 14.9% |
| Here: | 13.2% |
| Indiana: | 11.4% |
| Here: | 8.3% |
| Indiana: | 22.3% |
Greene County government finances - Expenditure in 2018:
- Bond Funds - Cash and Securities: $1,795,000
Cash and Securities: $1,323,000
- Charges - Other: $5,781,000
Other: $2,076,000
Regular Highways: $121,000
Sewerage: $65,000
Sewerage: $39,000
Miscellaneous Commercial Activities: $3,000
- Construction - Regular Highways: $763,000
Regular Highways: $213,000
General - Other: $72,000
General - Other: $32,000
- Current Operations - General - Other: $35,244,000
Regular Highways: $11,541,000
Central Staff Services: $5,355,000
Police Protection: $4,162,000
Regular Highways: $3,960,000
Central Staff Services: $3,298,000
Health - Other: $2,430,000
Judicial and Legal Services: $2,269,000
Health - Other: $2,171,000
Judicial and Legal Services: $2,073,000
Correctional Institutions: $1,871,000
Correctional Institutions: $1,471,000
General Public Buildings: $1,362,000
General - Other: $1,097,000
Parks and Recreation: $1,024,000
Police Protection: $1,010,000
Financial Administration: $832,000
Financial Administration: $754,000
Corrections - Other: $425,000
Corrections - Other: $395,000
Natural Resources - Other: $269,000
Natural Resources - Other: $229,000
General Public Buildings: $95,000
Protective Inspection and Regulation - Other: $15,000
Protective Inspection and Regulation - Other: $14,000
Sewerage: $8,000
Sewerage: $6,000
Elementary and Secondary Education: $4,000
- General - Interest on Debt: $431,000
Interest on Debt: $416,000
- Local Intergovernmental - Highways: $373,000
- Long Term Debt - Outstanding Unspecified Public Purpose: $10,776,000
Beginning Outstanding - Unspecified Public Purpose: $10,776,000
Outstanding Unspecified Public Purpose: $10,398,000
Beginning Outstanding - Unspecified Public Purpose: $10,398,000
- Miscellaneous - Rents: $514,000
Fines and Forfeits: $482,000
Interest Earnings: $456,000
Sale of Property: $297,000
Interest Earnings: $122,000
Fines and Forfeits: $120,000
Donations From Private Sources: $20,000
Donations From Private Sources: $4,000
- Other Capital Outlay - General - Other: $344,000
Regular Highways: $244,000
General - Other: $164,000
Corrections - Other: $110,000
Correctional Institutions: $68,000
Central Staff Services: $67,000
Correctional Institutions: $13,000
Natural Resources - Other: $7,000
Judicial and Legal Services: $6,000
Financial Administration: $4,000
Judicial and Legal Services: $3,000
Health - Other: $2,000
Police Protection: $2,000
Police Protection: $2,000
- Other Funds - Cash and Securities: $14,614,000
Cash and Securities: $14,362,000
- State Intergovernmental - Other: $18,179,000
Other: $13,198,000
Highways: $3,471,000
General Local Government Support: $961,000
Highways: $415,000
General Local Government Support: $199,000
- Tax - Property: $32,983,000
Property: $7,043,000
Public Utilities Sales: $456,000
Other Selective Sales: $35,000
Documentary and Stock Transfer: $34,000
Greene County government finances - Revenue in 2018:
- Bond Funds - Cash and Securities: $1,795,000
Cash and Securities: $1,323,000
- Charges - Other: $5,781,000
Other: $2,076,000
Regular Highways: $121,000
Sewerage: $65,000
Sewerage: $39,000
Miscellaneous Commercial Activities: $3,000
- Construction - Regular Highways: $763,000
Regular Highways: $213,000
General - Other: $72,000
General - Other: $32,000
- Current Operations - General - Other: $35,244,000
Regular Highways: $11,541,000
Central Staff Services: $5,355,000
Police Protection: $4,162,000
Regular Highways: $3,960,000
Central Staff Services: $3,298,000
Health - Other: $2,430,000
Judicial and Legal Services: $2,269,000
Health - Other: $2,171,000
Judicial and Legal Services: $2,073,000
Correctional Institutions: $1,871,000
Correctional Institutions: $1,471,000
General Public Buildings: $1,362,000
General - Other: $1,097,000
Parks and Recreation: $1,024,000
Police Protection: $1,010,000
Financial Administration: $832,000
Financial Administration: $754,000
Corrections - Other: $425,000
Corrections - Other: $395,000
Natural Resources - Other: $269,000
Natural Resources - Other: $229,000
General Public Buildings: $95,000
Protective Inspection and Regulation - Other: $15,000
Protective Inspection and Regulation - Other: $14,000
Sewerage: $8,000
Sewerage: $6,000
Elementary and Secondary Education: $4,000
- General - Interest on Debt: $431,000
Interest on Debt: $416,000
- Local Intergovernmental - Highways: $373,000
- Long Term Debt - Outstanding Unspecified Public Purpose: $10,776,000
Beginning Outstanding - Unspecified Public Purpose: $10,776,000
Outstanding Unspecified Public Purpose: $10,398,000
Beginning Outstanding - Unspecified Public Purpose: $10,398,000
- Miscellaneous - Rents: $514,000
Fines and Forfeits: $482,000
Interest Earnings: $456,000
Sale of Property: $297,000
Interest Earnings: $122,000
Fines and Forfeits: $120,000
Donations From Private Sources: $20,000
Donations From Private Sources: $4,000
- Other Capital Outlay - General - Other: $344,000
Regular Highways: $244,000
General - Other: $164,000
Corrections - Other: $110,000
Correctional Institutions: $68,000
Central Staff Services: $67,000
Correctional Institutions: $13,000
Natural Resources - Other: $7,000
Judicial and Legal Services: $6,000
Financial Administration: $4,000
Judicial and Legal Services: $3,000
Health - Other: $2,000
Police Protection: $2,000
Police Protection: $2,000
- Other Funds - Cash and Securities: $14,614,000
Cash and Securities: $14,362,000
- State Intergovernmental - Other: $18,179,000
Other: $13,198,000
Highways: $3,471,000
General Local Government Support: $961,000
Highways: $415,000
General Local Government Support: $199,000
- Tax - Property: $32,983,000
Property: $7,043,000
Public Utilities Sales: $456,000
Other Selective Sales: $35,000
Documentary and Stock Transfer: $34,000
Greene County government finances - Debt in 2018:
- Bond Funds - Cash and Securities: $1,795,000
Cash and Securities: $1,323,000
- Charges - Other: $5,781,000
Other: $2,076,000
Regular Highways: $121,000
Sewerage: $65,000
Sewerage: $39,000
Miscellaneous Commercial Activities: $3,000
- Construction - Regular Highways: $763,000
Regular Highways: $213,000
General - Other: $72,000
General - Other: $32,000
- Current Operations - General - Other: $35,244,000
Regular Highways: $11,541,000
Central Staff Services: $5,355,000
Police Protection: $4,162,000
Regular Highways: $3,960,000
Central Staff Services: $3,298,000
Health - Other: $2,430,000
Judicial and Legal Services: $2,269,000
Health - Other: $2,171,000
Judicial and Legal Services: $2,073,000
Correctional Institutions: $1,871,000
Correctional Institutions: $1,471,000
General Public Buildings: $1,362,000
General - Other: $1,097,000
Parks and Recreation: $1,024,000
Police Protection: $1,010,000
Financial Administration: $832,000
Financial Administration: $754,000
Corrections - Other: $425,000
Corrections - Other: $395,000
Natural Resources - Other: $269,000
Natural Resources - Other: $229,000
General Public Buildings: $95,000
Protective Inspection and Regulation - Other: $15,000
Protective Inspection and Regulation - Other: $14,000
Sewerage: $8,000
Sewerage: $6,000
Elementary and Secondary Education: $4,000
- General - Interest on Debt: $431,000
Interest on Debt: $416,000
- Local Intergovernmental - Highways: $373,000
- Long Term Debt - Outstanding Unspecified Public Purpose: $10,776,000
Beginning Outstanding - Unspecified Public Purpose: $10,776,000
Outstanding Unspecified Public Purpose: $10,398,000
Beginning Outstanding - Unspecified Public Purpose: $10,398,000
- Miscellaneous - Rents: $514,000
Fines and Forfeits: $482,000
Interest Earnings: $456,000
Sale of Property: $297,000
Interest Earnings: $122,000
Fines and Forfeits: $120,000
Donations From Private Sources: $20,000
Donations From Private Sources: $4,000
- Other Capital Outlay - General - Other: $344,000
Regular Highways: $244,000
General - Other: $164,000
Corrections - Other: $110,000
Correctional Institutions: $68,000
Central Staff Services: $67,000
Correctional Institutions: $13,000
Natural Resources - Other: $7,000
Judicial and Legal Services: $6,000
Financial Administration: $4,000
Judicial and Legal Services: $3,000
Health - Other: $2,000
Police Protection: $2,000
Police Protection: $2,000
- Other Funds - Cash and Securities: $14,614,000
Cash and Securities: $14,362,000
- State Intergovernmental - Other: $18,179,000
Other: $13,198,000
Highways: $3,471,000
General Local Government Support: $961,000
Highways: $415,000
General Local Government Support: $199,000
- Tax - Property: $32,983,000
Property: $7,043,000
Public Utilities Sales: $456,000
Other Selective Sales: $35,000
Documentary and Stock Transfer: $34,000
Greene County government finances - Cash and Securities in 2018:
- Bond Funds - Cash and Securities: $1,795,000
Cash and Securities: $1,323,000
- Charges - Other: $5,781,000
Other: $2,076,000
Regular Highways: $121,000
Sewerage: $65,000
Sewerage: $39,000
Miscellaneous Commercial Activities: $3,000
- Construction - Regular Highways: $763,000
Regular Highways: $213,000
General - Other: $72,000
General - Other: $32,000
- Current Operations - General - Other: $35,244,000
Regular Highways: $11,541,000
Central Staff Services: $5,355,000
Police Protection: $4,162,000
Regular Highways: $3,960,000
Central Staff Services: $3,298,000
Health - Other: $2,430,000
Judicial and Legal Services: $2,269,000
Health - Other: $2,171,000
Judicial and Legal Services: $2,073,000
Correctional Institutions: $1,871,000
Correctional Institutions: $1,471,000
General Public Buildings: $1,362,000
General - Other: $1,097,000
Parks and Recreation: $1,024,000
Police Protection: $1,010,000
Financial Administration: $832,000
Financial Administration: $754,000
Corrections - Other: $425,000
Corrections - Other: $395,000
Natural Resources - Other: $269,000
Natural Resources - Other: $229,000
General Public Buildings: $95,000
Protective Inspection and Regulation - Other: $15,000
Protective Inspection and Regulation - Other: $14,000
Sewerage: $8,000
Sewerage: $6,000
Elementary and Secondary Education: $4,000
- General - Interest on Debt: $431,000
Interest on Debt: $416,000
- Local Intergovernmental - Highways: $373,000
- Long Term Debt - Outstanding Unspecified Public Purpose: $10,776,000
Beginning Outstanding - Unspecified Public Purpose: $10,776,000
Outstanding Unspecified Public Purpose: $10,398,000
Beginning Outstanding - Unspecified Public Purpose: $10,398,000
- Miscellaneous - Rents: $514,000
Fines and Forfeits: $482,000
Interest Earnings: $456,000
Sale of Property: $297,000
Interest Earnings: $122,000
Fines and Forfeits: $120,000
Donations From Private Sources: $20,000
Donations From Private Sources: $4,000
- Other Capital Outlay - General - Other: $344,000
Regular Highways: $244,000
General - Other: $164,000
Corrections - Other: $110,000
Correctional Institutions: $68,000
Central Staff Services: $67,000
Correctional Institutions: $13,000
Natural Resources - Other: $7,000
Judicial and Legal Services: $6,000
Financial Administration: $4,000
Judicial and Legal Services: $3,000
Health - Other: $2,000
Police Protection: $2,000
Police Protection: $2,000
- Other Funds - Cash and Securities: $14,614,000
Cash and Securities: $14,362,000
- State Intergovernmental - Other: $18,179,000
Other: $13,198,000
Highways: $3,471,000
General Local Government Support: $961,000
Highways: $415,000
General Local Government Support: $199,000
- Tax - Property: $32,983,000
Property: $7,043,000
Public Utilities Sales: $456,000
Other Selective Sales: $35,000
Documentary and Stock Transfer: $34,000
Supplemental Security Income (SSI) in 2006:
- Total number of recipients: 639
- Number of aged recipients: 45
- Number of blind and disabled recipients: 594
- Number of recipients under 18: 90
- Number of recipients between 18 and 64: 459
- Number of recipients older than 64: 90
- Number of recipients also receiving OASDI: 260
- Amount of payments (thousands of dollars): 261
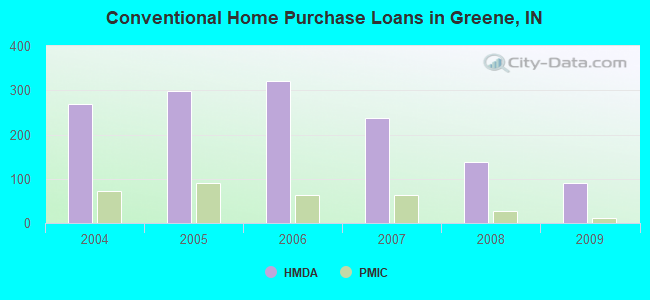
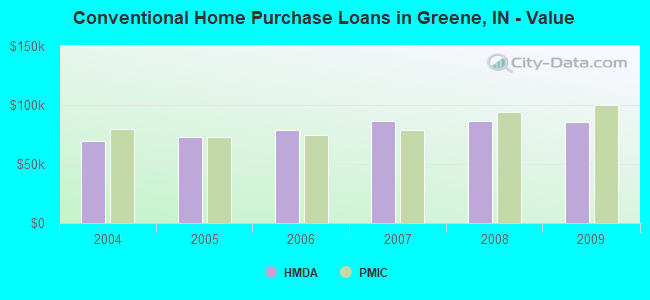
| Home Mortgage Disclosure Act Aggregated Statistics For Year 2009 (Based on 8 full tracts) | ||||||||||||||
| A) FHA, FSA/RHS & VA Home Purchase Loans | B) Conventional Home Purchase Loans | C) Refinancings | D) Home Improvement Loans | E) Loans on Dwellings For 5+ Families | F) Non-occupant Loans on < 5 Family Dwellings (A B C & D) | G) Loans On Manufactured Home Dwelling (A B C & D) | ||||||||
|---|---|---|---|---|---|---|---|---|---|---|---|---|---|---|
| Number | Average Value | Number | Average Value | Number | Average Value | Number | Average Value | Number | Average Value | Number | Average Value | Number | Average Value | |
| LOANS ORIGINATED | 87 | $87,862 | 91 | $85,396 | 493 | $99,525 | 74 | $41,608 | 1 | $545,000 | 31 | $66,484 | 71 | $67,465 |
| APPLICATIONS APPROVED, NOT ACCEPTED | 4 | $55,000 | 14 | $54,786 | 41 | $95,341 | 2 | $12,000 | 0 | $0 | 4 | $35,000 | 9 | $57,556 |
| APPLICATIONS DENIED | 40 | $84,250 | 34 | $65,735 | 180 | $89,972 | 33 | $28,970 | 0 | $0 | 8 | $56,000 | 42 | $54,857 |
| APPLICATIONS WITHDRAWN | 10 | $75,200 | 8 | $65,625 | 101 | $103,446 | 7 | $51,143 | 0 | $0 | 5 | $134,400 | 15 | $67,667 |
| FILES CLOSED FOR INCOMPLETENESS | 5 | $78,600 | 0 | $0 | 21 | $122,905 | 2 | $72,500 | 0 | $0 | 1 | $15,000 | 3 | $84,000 |
| Private Mortgage Insurance Companies Aggregated Statistics For Year 2009 (Based on 6 full tracts) | ||||||
| A) Conventional Home Purchase Loans | B) Refinancings | D) Loans On Manufactured Home Dwelling (A & B) | ||||
|---|---|---|---|---|---|---|
| Number | Average Value | Number | Average Value | Number | Average Value | |
| LOANS ORIGINATED | 11 | $100,091 | 19 | $115,842 | 1 | $70,000 |
| APPLICATIONS APPROVED, NOT ACCEPTED | 4 | $76,750 | 8 | $132,750 | 0 | $0 |
| APPLICATIONS DENIED | 1 | $181,000 | 1 | $172,000 | 0 | $0 |
| APPLICATIONS WITHDRAWN | 0 | $0 | 6 | $142,667 | 0 | $0 |
| FILES CLOSED FOR INCOMPLETENESS | 0 | $0 | 0 | $0 | 0 | $0 |
| Most common first names in Greene County, IN among deceased individuals | ||
| Name | Count | Lived (average) |
|---|---|---|
| Mary | 297 | 78.6 years |
| William | 274 | 74.8 years |
| James | 233 | 73.7 years |
| John | 232 | 75.9 years |
| Robert | 202 | 70.7 years |
| Charles | 182 | 76.5 years |
| George | 108 | 76.9 years |
| Ruth | 94 | 81.0 years |
| Paul | 90 | 73.6 years |
| Roy | 88 | 75.8 years |
| Most common last names in Greene County, IN among deceased individuals | ||
| Last name | Count | Lived (average) |
|---|---|---|
| Miller | 118 | 76.7 years |
| Smith | 112 | 75.4 years |
| Johnson | 91 | 79.1 years |
| Brown | 60 | 77.8 years |
| Allen | 58 | 78.0 years |
| Baker | 50 | 77.3 years |
| Goodman | 50 | 72.5 years |
| Thompson | 49 | 73.6 years |
| Wright | 47 | 79.1 years |
| Sparks | 46 | 73.8 years |
| Businesses in Greene County, IN | ||||
| Name | Count | Name | Count | |
|---|---|---|---|---|
| AT&T | 1 | MasterBrand Cabinets | 2 | |
| Advance Auto Parts | 1 | McDonald's | 2 | |
| Arby's | 1 | Nike | 1 | |
| AutoZone | 1 | Pizza Hut | 2 | |
| Burger King | 1 | RadioShack | 1 | |
| CVS | 2 | Sears | 1 | |
| Dairy Queen | 2 | Subway | 4 | |
| FedEx | 2 | Taco Bell | 1 | |
| H&R Block | 1 | The Room Place | 1 | |
| Jimmy John's | 2 | U-Haul | 2 | |
| KFC | 1 | Walmart | 1 | |
| La-Z-Boy | 1 | Wendy's | 1 | |
| Long John Silver's | 1 | |||
Greene County on our top lists:
- #58 on the list of "Top 101 counties with the highest Ozone (1-hour) air pollution readings in 2012 (ppm)"