Hand County, South Dakota (SD)
County owner-occupied free and clear houses and condos in 2010: 655
County owner-occupied houses and condos in 2000: 1,143
Renter-occupied apartments: 402 (it was 400 in 2000)
| % of renters here: | 26% |
| State: | 32% |
Land area: 1437 sq. mi.
Water area: 3.6 sq. mi.
Population density: 2 people per square mile (very low).
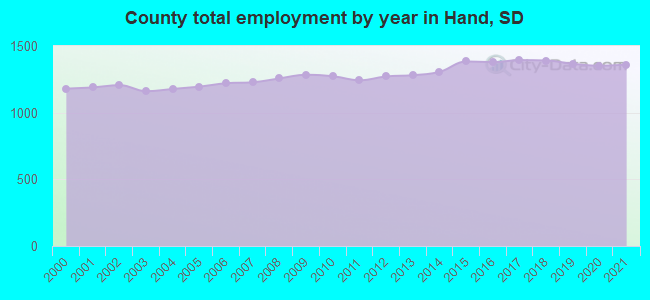
Industries providing employment: Agriculture,forestry,fishing and hunting, and mining (30.4%), Educational, health and social services (25.7%).
Type of workers:
- Private wage or salary: 71%
- Government: 12%
- Self-employed, not incorporated: 17%
- Unpaid family work: 0%
- OSM Map
- General Map
- Google Map
- MSN Map

- 2,88391.4%White Non-Hispanic Alone
- 1625.1%Hispanic or Latino
- 842.7%Some other race alone
- 90.3%Two or more races
- 70.2%Asian alone
- 60.2%American Indian and Alaska Native alone
- 30.10%Black Non-Hispanic Alone

| Median resident age: | 45.8 years |
| South Dakota median age: | 38.5 years |
| Males: 1,609 | |
| Females: 1,533 |

 | Central South Dakota (Highmore, SD, Miller, SD) (3 replies) |
| Rant/Rave (1039 replies) |
| Pheasant Hunting a bust in November 2013. (11 replies) |
| Topography of eastern SD (7 replies) |
| Country Schools in South Dakota (87 replies) |
| Ree Heights Catholic Churches (5 replies) |
| Hand County: | 2.0 people |
| South Dakota: | 2 people |
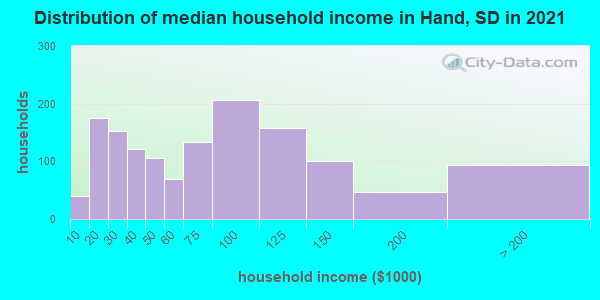
Estimated median household income in 2022: $73,141 ($32,377 in 1999)
| This county: | $73,141 |
| South Dakota: | $69,728 |
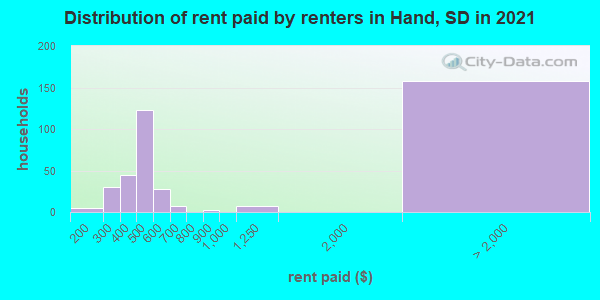
Median contract rent in 2022 for apartments: $467 (lower quartile is $359, upper quartile is $527)
| This county: | $467 |
| State: | $747 |
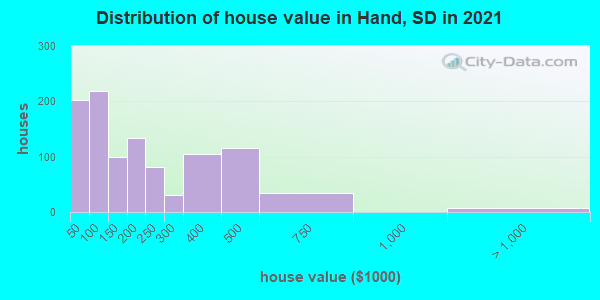
Estimated median house or condo value in 2022: $167,426 (it was $46,400 in 2000)
| Hand: | $167,426 |
| South Dakota: | $245,000 |
Median monthly housing costs for homes and condos with a mortgage: $1,318
Median monthly housing costs for units without a mortgage: $507
Institutionalized population: 53
Crime in 2020 (reported by the sheriff's office or county police, not the county total):
- Murders: 0
- Rapes: 0
- Robberies: 0
- Assaults: 0
- Burglaries: 0
- Thefts: 0
- Auto thefts: 0
Crime in 2019 (reported by the sheriff's office or county police, not the county total):
- Murders: 0
- Rapes: 3
- Robberies: 0
- Assaults: 1
- Burglaries: 0
- Thefts: 1
- Auto thefts: 0
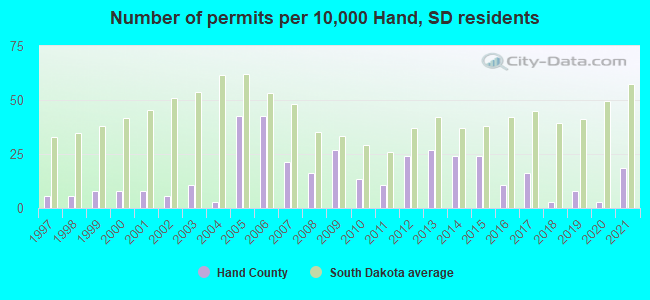
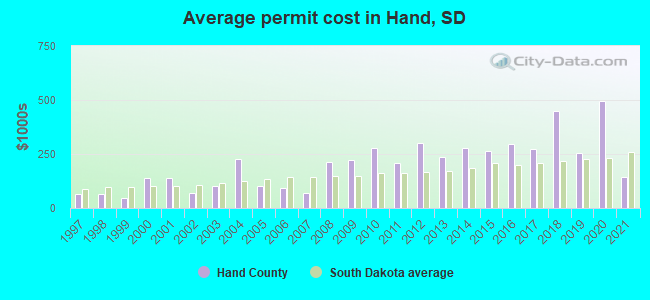
Single-family new house construction building permits:
- 2022: 3 buildings, average cost: $500,000
- 2021: 7 buildings, average cost: $143,300
- 2020: 1 building, cost: $495,000
- 2019: 3 buildings, average cost: $252,700
- 2018: 1 building, cost: $450,000
- 2017: 6 buildings, average cost: $275,000
- 2016: 4 buildings, average cost: $293,500
- 2015: 9 buildings, average cost: $265,600
- 2014: 9 buildings, average cost: $276,400
- 2013: 10 buildings, average cost: $237,600
- 2012: 9 buildings, average cost: $301,800
- 2011: 4 buildings, average cost: $206,500
- 2010: 5 buildings, average cost: $276,000
- 2009: 10 buildings, average cost: $222,300
- 2008: 6 buildings, average cost: $213,300
- 2007: 8 buildings, average cost: $68,200
- 2006: 16 buildings, average cost: $90,500
- 2005: 16 buildings, average cost: $101,800
- 2004: 1 building, cost: $224,900
- 2003: 4 buildings, average cost: $100,000
- 2002: 2 buildings, average cost: $67,500
- 2001: 3 buildings, average cost: $136,700
- 2000: 3 buildings, average cost: $136,700
- 1999: 3 buildings, average cost: $47,300
- 1998: 2 buildings, average cost: $65,500
- 1997: 2 buildings, average cost: $65,500
Median real estate property taxes paid for housing units with mortgages in 2022: $1,313 (0.7%)
Median real estate property taxes paid for housing units with no mortgage in 2022: $1,156 (0.8%)
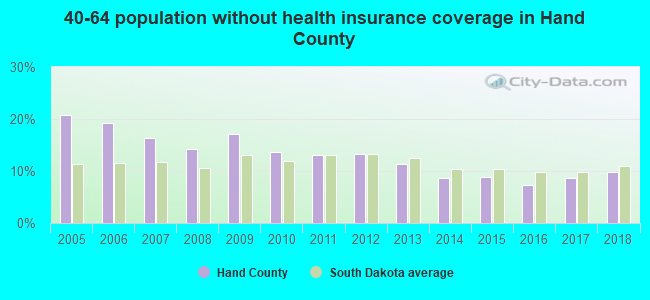
| Hand County: | 7.8% |
| South Dakota: | 12.5% |
Median age of residents in 2022: 45.8 years old
(Males: 45.2 years old, Females: 46.6 years old)
(Median age for: White residents: 48.1 years old, American Indian residents: 71.3 years old, Hispanic or Latino residents: 35.3 years old, Other race residents: 17.7 years old)
Fair market rent in 2006 for a 1-bedroom apartment in Hand County is $368 a month.
Fair market rent for a 2-bedroom apartment is $484 a month.
Fair market rent for a 3-bedroom apartment is $639 a month.
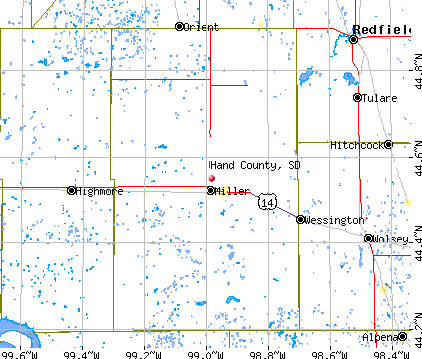
Cities in this county include: Miller, St. Lawrence, Ree Heights.
Neighboring counties: Androscoggin County, Maine  , Anoka County, Minnesota , Kennebec County, Maine , Clark County
  , Deuel County , Gem County, Idaho
  , Goodhue County, Minnesota , Grant County , Grand Traverse County, Michigan .
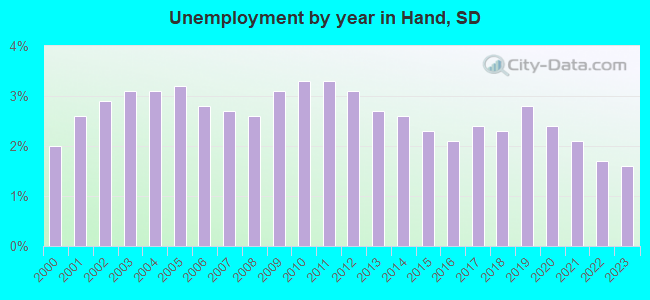
| Here: | 1.6% |
| South Dakota: | 2.0% |

Current college students: 33
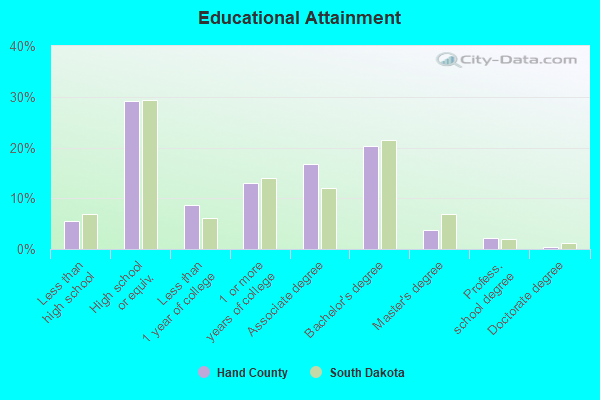
People 25 years of age or older with a high school degree or higher: 93.1%
People 25 years of age or older with a bachelor's degree or higher: 25.3%
Number of foreign born residents: 44 (2.6% naturalized citizens)
| Hand County: | 1.4% |
| Whole state: | 3.5% |
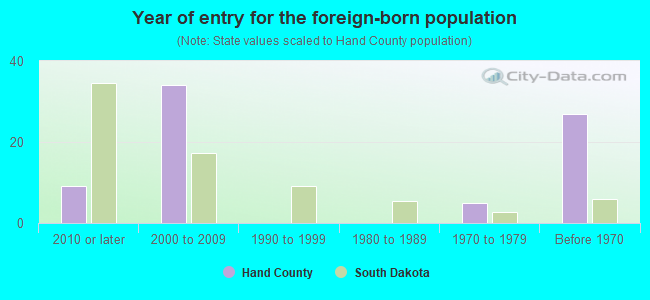
- Year of entry for the foreign-born population
- 82010 or later
- 392000 to 2009
- 01990 to 1999
- 01980 to 1989
- 51970 to 1979
- 27Before 1970
Mean travel time to work (commute): minutes
Percentage of county residents living and working in this county: 99.9%


Housing units in structures:
- One, detached: 1,421
- One, attached: 19
- Two: 34
- 3 or 4: 49
- 10 to 19: 29
- 20 to 49: 77
- 50 or more: 3
- Mobile homes: 116
Housing units in Hand County with a mortgage: 356 (9 second mortgage, 0 home equity loan, 10 both second mortgage and home equity loan)
Houses without a mortgage: 2
| Here: | 99.4% with mortgage |
| State: | 98.3% with mortgage |
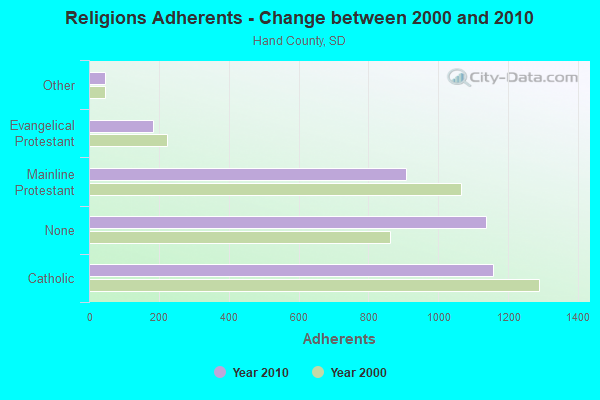
Religion statistics for Hand County
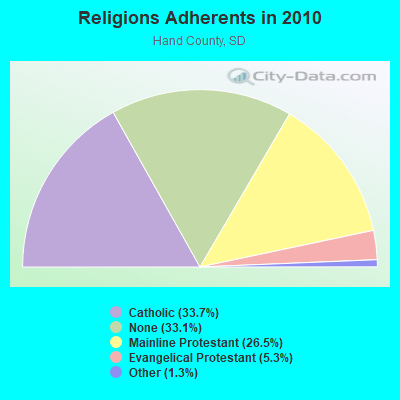
| Religion | Adherents | Congregations |
|---|---|---|
| Catholic | 1,157 | 3 |
| Mainline Protestant | 909 | 4 |
| Evangelical Protestant | 183 | 5 |
| Other | 46 | 1 |
| None | 1,136 | - |
Source: Clifford Grammich, Kirk Hadaway, Richard Houseal, Dale E.Jones, Alexei Krindatch, Richie Stanley and Richard H.Taylor. 2012. 2010 U.S.Religion Census: Religious Congregations & Membership Study. Association of Statisticians of American Religious Bodies. Jones, Dale E., et al. 2002. Congregations and Membership in the United States 2000. Nashville, TN: Glenmary Research Center.
Food Environment Statistics:
| Hand County: | 3.06 / 10,000 pop. |
| State: | 2.84 / 10,000 pop. |
| Hand County: | 3.06 / 10,000 pop. |
| South Dakota: | 6.68 / 10,000 pop. |
| This county: | 9.17 / 10,000 pop. |
| State: | 9.21 / 10,000 pop. |
| Hand County: | 9.6% |
| South Dakota: | 7.7% |
| Hand County: | 28.5% |
| State: | 27.7% |
Agriculture in Hand County:
Average size of farms: 1809 acresAverage value of agricultural products sold per farm: $160,294
Average value of crops sold per acre for harvested cropland: $77.51
The value of nursery, greenhouse, floriculture, and sod as a percentage of the total market value of agricultural products sold: 0.00%
The value of livestock, poultry, and their products as a percentage of the total market value of agricultural products sold: 65.79%
Average total farm production expenses per farm: $140,024
Harvested cropland as a percentage of land in farms: 39.11%
Irrigated harvested cropland as a percentage of land in farms: 1.14%
Average market value of all machinery and equipment per farm: $129,414
The percentage of farms operated by a family or individual: 83.75%
Average age of principal farm operators: 53 years
Average number of cattle and calves per 100 acres of all land in farms: 12.47
Milk cows as a percentage of all cattle and calves: 1.23%
Corn for grain: 59030 harvested acres
All wheat for grain: 52504 harvested acres
Soybeans for beans: 69371 harvested acres
Earthquake activity:
Hand County-area historical earthquake activity is significantly above South Dakota state average. It is 179% greater than the overall U.S. average.On 8/18/1959 at 06:37:13, a magnitude 7.7 (7.7 UK, Class: Major, Intensity: VIII - XII) earthquake occurred 574.7 miles away from Hand County center, causing $26,000,000 total damage
On 3/4/1983 at 06:32:18, a magnitude 4.6 (4.4 MB, 4.6 LG, 4.4 ML, Class: Light, Intensity: IV - V) earthquake occurred 31.2 miles away from the county center
On 7/9/1975 at 14:54:15, a magnitude 4.6 (4.6 MB) earthquake occurred 163.3 miles away from the county center
On 11/3/2002 at 20:41:56, a magnitude 4.3 (4.3 MB, Depth: 3.1 mi) earthquake occurred 123.2 miles away from the county center
On 10/25/1990 at 06:25:25, a magnitude 3.9 (3.6 MB, 3.9 LG, Depth: 3.1 mi, Class: Light, Intensity: II - III) earthquake occurred 58.0 miles away from Hand County center
On 10/18/1984 at 15:30:23, a magnitude 5.5 (5.4 MB, 5.1 MS, 5.5 ML, Class: Moderate, Intensity: VI - VII) earthquake occurred 362.3 miles away from the county center
Magnitude types: regional Lg-wave magnitude (LG), body-wave magnitude (MB), local magnitude (ML), surface-wave magnitude (MS)
Most recent natural disasters:
- South Dakota Covid-19 Pandemic, Incident Period: January 20, 2020, FEMA Id: 4527, Natural disaster type: Other
- South Dakota Severe Winter Storm, Snowstorm, And Flooding, Incident Period: March 13, 2019 - April 26, 2019, FEMA Id: 4440, Natural disaster type: Snowstorm, Winter Storm, Flood
- South Dakota Flooding, Incident Period: March 11, 2011 to July 22, 2011, Major Disaster (Presidential) Declared DR-1984: May 13, 2011, FEMA Id: 1984, Natural disaster type: Flood
- South Dakota Severe Storms and Flooding, Incident Period: July 21, 2010 to July 30, 2010, Major Disaster (Presidential) Declared DR-1938: September 23, 2010, FEMA Id: 1938, Natural disaster type: Storm, Flood
- South Dakota Flooding, Incident Period: March 10, 2010 to June 20, 2010, Major Disaster (Presidential) Declared DR-1915: May 13, 2010, FEMA Id: 1915, Natural disaster type: Flood
- South Dakota Severe Winter Storm, Incident Period: January 20, 2010 to January 26, 2010, Major Disaster (Presidential) Declared DR-1887: March 10, 2010, FEMA Id: 1887, Natural disaster type: Winter Storm
- South Dakota Severe Storms and Flooding, Incident Period: June 02, 2008 to June 12, 2008, Major Disaster (Presidential) Declared DR-1774: July 09, 2008, FEMA Id: 1774, Natural disaster type: Storm, Flood
- South Dakota Severe Winter Storm, Incident Period: November 27, 2005 to November 29, 2005, Major Disaster (Presidential) Declared DR-1620: December 20, 2005, FEMA Id: 1620, Natural disaster type: Winter Storm
- South Dakota Hurricane Katrina Evacuation, Incident Period: September 06, 2005 to October 01, 2005, Emergency Declared EM-3234: September 10, 2005, FEMA Id: 3234, Natural disaster type: Hurricane
- South Dakota Severe Storms/Flooding, Incident Period: February 03, 1997 to May 24, 1997, Major Disaster (Presidential) Declared DR-1173: April 07, 1997, FEMA Id: 1173, Natural disaster type: Storm, Flood
- 8 other natural disasters have been reported since 1953.
The number of natural disasters in Hand County (18) is near the US average (15).
Major Disasters (Presidential) Declared: 14
Emergencies Declared: 2
Causes of natural disasters: Floods: 11, Storms: 7, Winter Storms: 5, Blizzard: 1, Drought: 1, Hurricane: 1, Snowstorm: 1, Tornado: 1, Other: 1 (Note: some incidents may be assigned to more than one category).
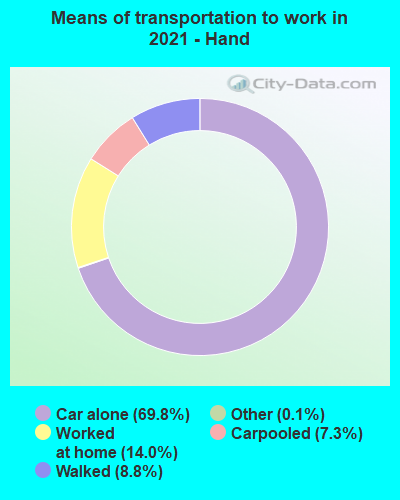
Means of transportation to work:
- Drove a car alone: 1,136 (69.9%)
- Carpooled: 104 (6.4%)
- Bus: 3 (0.2%)
- Taxicab, motorcycle, or other means: 3 (0.2%)
- Walked: 133 (8.2%)
- Worked at home: 233 (14.3%)

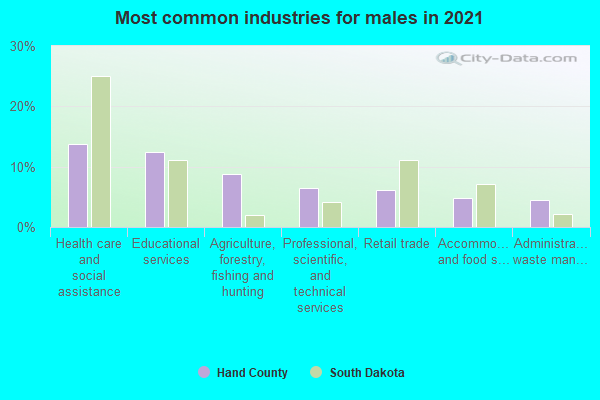
- Educational services (21%)
- Health care and social assistance (15%)
- Agriculture, forestry, fishing and hunting (11%)
- Retail trade (5%)
- Accommodation and food services (5%)
- Professional, scientific, and technical services (5%)
- Administrative and support and waste management services (3%)
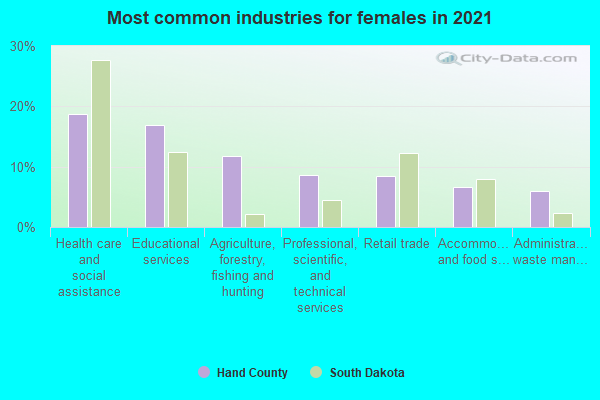
- Educational services (27%)
- Health care and social assistance (19%)
- Agriculture, forestry, fishing and hunting (13%)
- Retail trade (7%)
- Accommodation and food services (6%)
- Professional, scientific, and technical services (6%)
- Administrative and support and waste management services (4%)
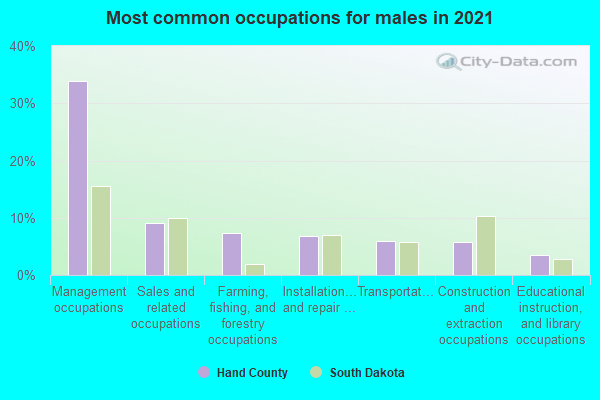
- Management occupations (41%)
- Farming, fishing, and forestry occupations (9%)
- Sales and related occupations (8%)
- Transportation occupations (7%)
- Installation, maintenance, and repair occupations (6%)
- Educational instruction, and library occupations (6%)
- Construction and extraction occupations (4%)
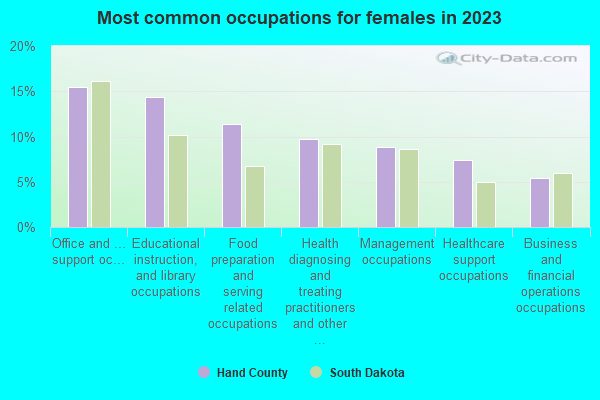
- Educational instruction, and library occupations (17%)
- Office and administrative support occupations (16%)
- Food preparation and serving related occupations (10%)
- Management occupations (9%)
- Health diagnosing and treating practitioners and other technical occupations (7%)
- Business and financial operations occupations (7%)
- Community and social service occupations (6%)
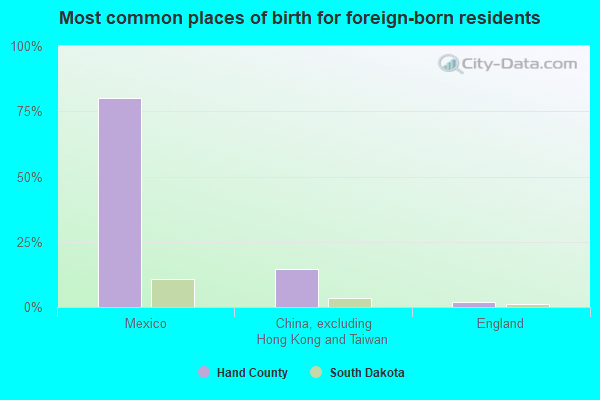
- Mexico (81%)
- China, excluding Hong Kong and Taiwan (15%)
- Ireland (0%)
- Norway (0%)
- Sweden (0%)
- United Kingdom, excluding England and Scotland (0%)
- England (0%)
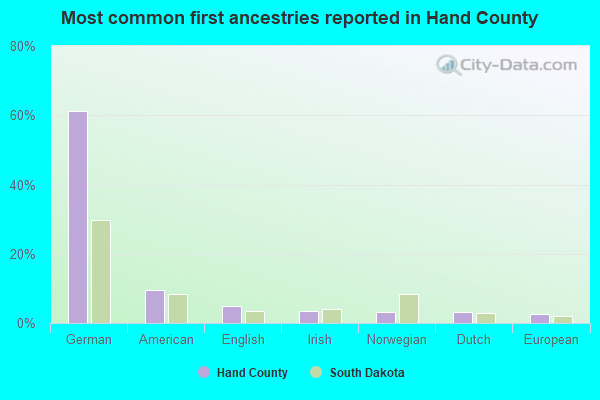
- German (54%)
- American (11%)
- Norwegian (6%)
- English (5%)
- Pennsylvania German (5%)
- Irish (3%)
- Dutch (2%)
8 people in group homes intended for adults
67 people in nursing homes
3 people in wards in general hospitals for patients who have no usual home elsewhere
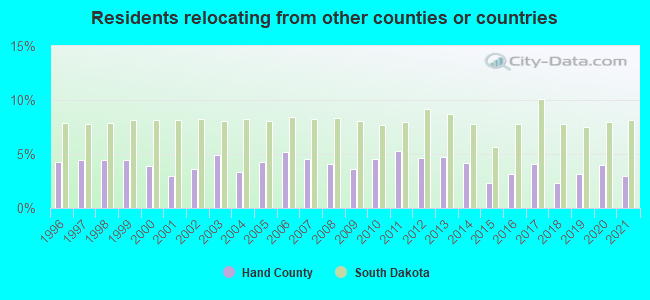
2.94% of this county's 2021 resident taxpayers lived in other counties in 2020 ($39,081 average adjusted gross income)
| Here: | 2.94% |
| South Dakota average: | 8.18% |
10 or fewer of this county's residents moved from foreign countries.
2.94% relocated from other counties in South Dakota ($39,081 average AGI)
10 or fewer of this county's residents relocated from other states.
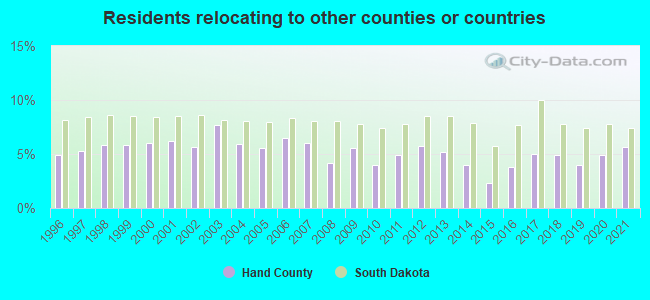
5.63% of this county's 2020 resident taxpayers moved to other counties in 2021 ($63,014 average adjusted gross income)
| Here: | 5.63% |
| South Dakota average: | 7.42% |
10 or fewer of this county's residents moved to foreign countries.
4.01% relocated to other counties in South Dakota ($44,370 average AGI)
1.62% relocated to other states ($18,658 average AGI)
Hand County: 1.62% South Dakota average: 3.31%
Births per 1000 population from 1990 to 1999: 11.3
Births per 1000 population from 2000 to 2006: 8.9

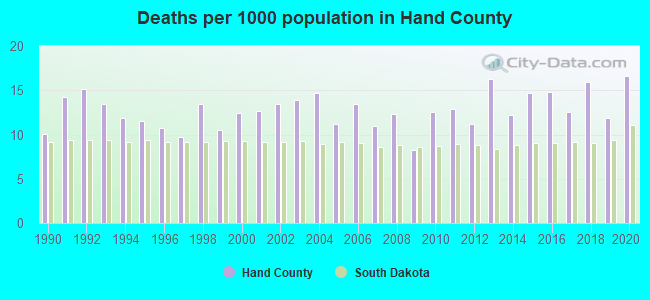
Deaths per 1000 population from 1990 to 1999: 12.1
Deaths per 1000 population from 2000 to 2009: 12.3
Deaths per 1000 population from 2010 to 2020: 13.8
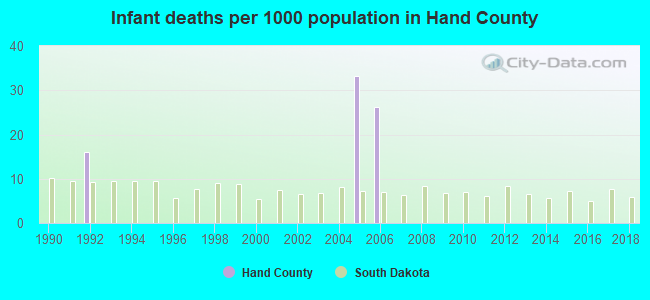
Infant deaths per 1000 live births from 1990 to 1999: 1.6
Infant deaths per 1000 live births from 2000 to 2006: 8.5
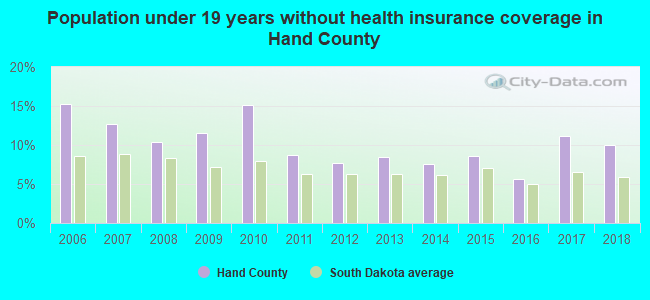
Persons under 19 years old without health insurance coverage in 2018: 10.0%


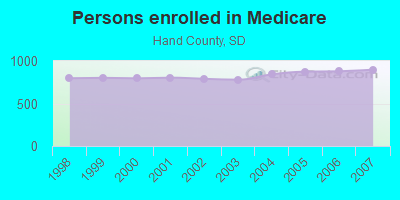
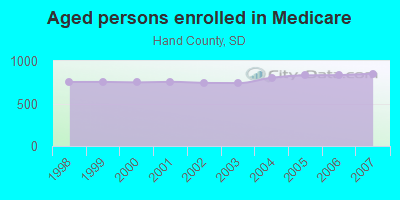
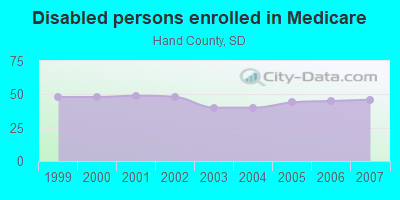
Persons enrolled in hospital insurance and/or supplemental medical insurance (Medicare) in July 1, 2007: 898 (852 aged, 46 disabled)
Children under 18 without health insurance coverage in 2007: 76 (12%)
Population without health insurance coverage in 2000: 12%
Children under 18 without health insurance coverage in 2000: 14%
Short term general hospital admissions per 100,000 population in 2004: 10,954
Short term general hospital beds per 100,000 population in 2004: 1,292
Emergency room visits per 100,000 population in 2004: 26,197
General practice office based MDs per 100,000 population in 2005: 1,270
Medical specialist MDs per 100,000 population in 2005: 1,391
Total births per 100,000 population, July 2005 - July 2006 : 24
Total deaths per 100,000 population, July 2005 - July 2006: 60
Limited-service eating places per 100,000 population in 2005 : 60
Household type by relationship:
Households: 3,142- Male householders: 845 (297 living alone), Female householders: 611 (214 living alone)
762 spouses (755 opposite-sex spouses), 59 unmarried partners, (59 opposite-sex unmarried partners), 727 children (664 natural, 29 adopted, 32 stepchildren), 33 grandchildren, 1 brothers or sisters, 15 parents, 0 foster children, 18 other relatives, 14 non-relatives
- In group quarters: 71
Size of family households: 491 2-persons, 127 3-persons, 159 4-persons, 37 5-persons, 13 6-persons, 49 7-or-more-persons.
Size of nonfamily households: 509 1-person, 56 2-persons, 11 3-persons.
559 married couples with children.
87 single-parent households (8 men, 79 women).
95.0% of residents of Hand speak English at home.
1.7% of residents speak Spanish at home (100% speak English very well).
3.9% of residents speak other Indo-European language at home (100% speak English very well).
0.2% of residents speak Asian or Pacific Island language at home (100% speak English well).
In fiscal year 2004:
Federal Government expenditure: $59,402,000 ($17,446 per capita)
Department of Defense expenditure: $213,000
Federal direct payments to individuals for retirement and disability: $8,280,000
Federal other direct payments to individuals: $4,686,000
Federal direct payments not to individuals: $23,056,000
Federal grants: $22,296,000
Federal procurement contracts: $200,000 ($0,000 Department of Defense)
Federal salaries and wages: $885,000 ($49,000 Department of Defense)
Federal Government direct loans: $394,000
Federal guaranteed/insured loans: $728,000
Federal Government insurance: $43,819,000
Population change from April 1, 2000 to July 1, 2005:
Births: 150| Here: | 45 per 1000 residents |
| State: | 72 per 1000 residents |
Deaths: 249
| Here: | 75 per 1000 residents |
| State: | 48 per 1000 residents |
Net international migration: +5
| Here: | +2 per 1000 residents |
| State: | +5 per 1000 residents |
Net internal migration: -330
| Here: | |
| State: |

Total withdrawal of fresh water for public supply: 0.01 millions of gallons per day (all from ground)
| Here: | 7.5 |
| State: | 7.0 |
| Here: | 5.6 |
| State: | 4.1 |

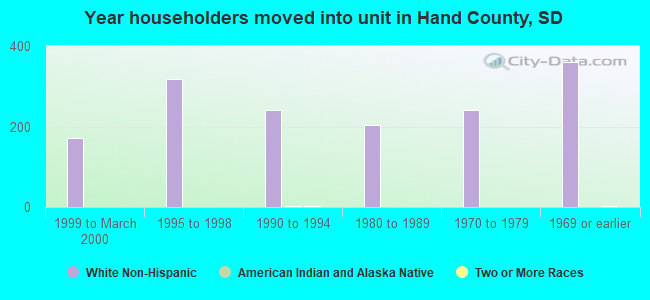
- Year house built in Hand County, South Dakota
- 02020 or later
- 1202010 to 2019
- 1222000 to 2009
- 1071990 to 1999
- 1221980 to 1989
- 2451970 to 1979
- 1311960 to 1969
- 2031950 to 1959
- 831940 to 1949
- 5531939 or earlier
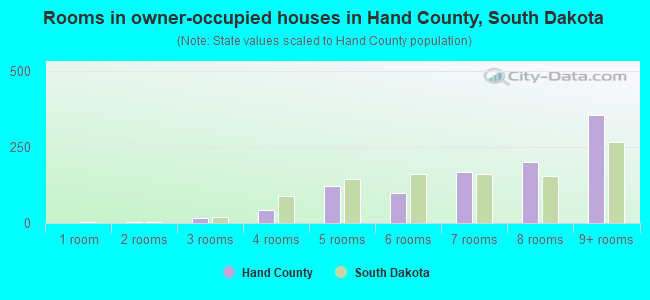
- Rooms in owner-occupied houses in Hand County, South Dakota
- 01 room
- 72 rooms
- 223 rooms
- 474 rooms
- 1305 rooms
- 1116 rooms
- 1847 rooms
- 1668 rooms
- 3519+ rooms

- Rooms in renter-occupied apartments in Hand County, South Dakota
- 01 room
- 372 rooms
- 343 rooms
- 754 rooms
- 625 rooms
- 686 rooms
- 477 rooms
- 438 rooms
- 699+ rooms

- Bedrooms in owner-occupied houses in Hand County, South Dakota
- 0no bedroom
- 511 bedroom
- 1422 bedrooms
- 3963 bedrooms
- 2724 bedrooms
- 1635+ bedrooms

- Bedrooms in renter-occupied apartments in Hand County, South Dakota
- 0no bedroom
- 761 bedroom
- 1602 bedrooms
- 1103 bedrooms
- 414 bedrooms
- 505+ bedrooms
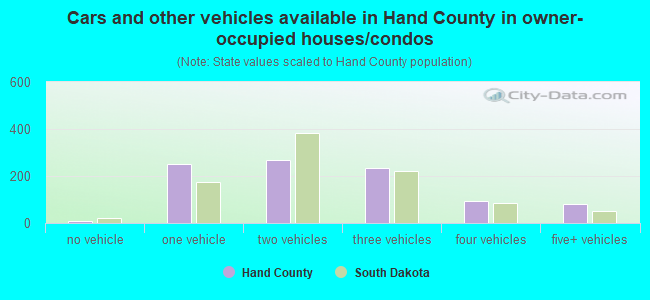
- Cars and other vehicles available in Hand County in owner-occupied houses/condos
- 10no vehicle
- 2401 vehicle
- 3232 vehicles
- 2643 vehicles
- 1394 vehicles
- 455+ vehicles
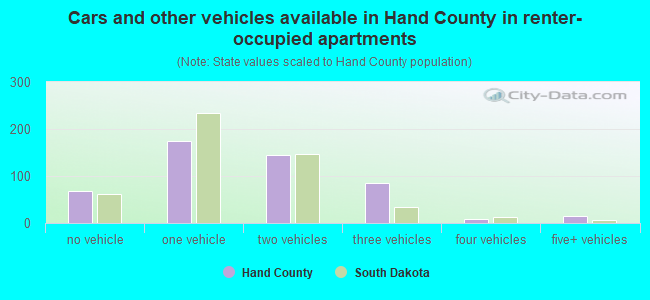
- Cars and other vehicles available in Hand County in renter-occupied apartments
- 52no vehicle
- 1551 vehicle
- 1082 vehicles
- 913 vehicles
- 54 vehicles
- 185+ vehicles
94.6% of Hand County residents lived in the same house 1 years ago.
Out of people who lived in different houses, 34% lived in this county.
Out of people who lived in different counties, 54% lived in South Dakota.
| Hand County: | 94.6% |
| State average: | 86.6% |
Place of birth for U.S.-born residents:
- This state: 2,512
- Other state: 560
- Northeast: 37
- Midwest: 265
- South: 158
- West: 104
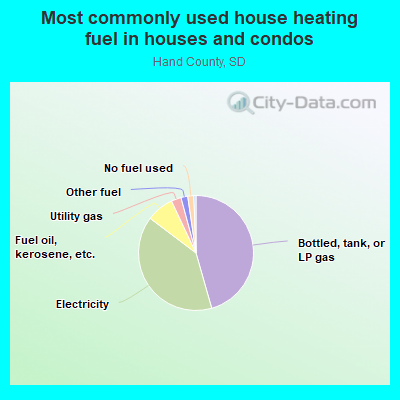
- 46.3%Bottled, tank, or LP gas
- 38.3%Electricity
- 5.6%Fuel oil, kerosene, etc.
- 4.7%Other fuel
- 2.8%Utility gas
- 1.8%No fuel used
- 0.4%Wood

- 47.7%Electricity
- 37.4%Bottled, tank, or LP gas
- 11.7%Other fuel
- 2.8%Fuel oil, kerosene, etc.
- 0.5%No fuel used
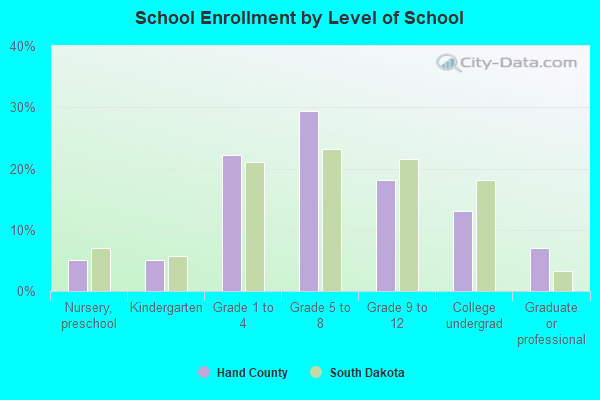
Private vs. public school enrollment:
| Here: | 1.6% |
| South Dakota: | 11.9% |
| Here: | 2.6% |
| South Dakota: | 7.2% |
| Here: | 3.6% |
| South Dakota: | 10.2% |
Hand County government finances - Expenditure in 2018:
- Charges - Other: $185,000
- Current Operations - Regular Highways: $1,869,000
Police Protection: $256,000
Health - Other: $254,000
Judicial and Legal Services: $98,000
General - Other: $96,000
Central Staff Services: $93,000
General Public Buildings: $45,000
Natural Resources - Other: $44,000
Parks and Recreation: $36,000
Correctional Institutions: $27,000
Public Welfare - Other: $22,000
Protective Inspection and Regulation - Other: $7,000
Corrections - Other: $1,000
- Federal Intergovernmental - General Local Government Support: $38,000
Other: $1,000
- General - Interest on Debt: $18,000
- Long Term Debt - Beginning Outstanding - Unspecified Public Purpose: $443,000
Retired Unspecified Public Purpose: $267,000
Outstanding Unspecified Public Purpose: $176,000
- Miscellaneous - General Revenue - Other: $3,000
Fines and Forfeits: $2,000
- State Intergovernmental - Highways: $508,000
Other: $50,000
- Tax - Property: $1,817,000
Other License: $15,000
Hand County government finances - Revenue in 2018:
- Charges - Other: $185,000
- Current Operations - Regular Highways: $1,869,000
Police Protection: $256,000
Health - Other: $254,000
Judicial and Legal Services: $98,000
General - Other: $96,000
Central Staff Services: $93,000
General Public Buildings: $45,000
Natural Resources - Other: $44,000
Parks and Recreation: $36,000
Correctional Institutions: $27,000
Public Welfare - Other: $22,000
Protective Inspection and Regulation - Other: $7,000
Corrections - Other: $1,000
- Federal Intergovernmental - General Local Government Support: $38,000
Other: $1,000
- General - Interest on Debt: $18,000
- Long Term Debt - Beginning Outstanding - Unspecified Public Purpose: $443,000
Retired Unspecified Public Purpose: $267,000
Outstanding Unspecified Public Purpose: $176,000
- Miscellaneous - General Revenue - Other: $3,000
Fines and Forfeits: $2,000
- State Intergovernmental - Highways: $508,000
Other: $50,000
- Tax - Property: $1,817,000
Other License: $15,000
Hand County government finances - Debt in 2018:
- Charges - Other: $185,000
- Current Operations - Regular Highways: $1,869,000
Police Protection: $256,000
Health - Other: $254,000
Judicial and Legal Services: $98,000
General - Other: $96,000
Central Staff Services: $93,000
General Public Buildings: $45,000
Natural Resources - Other: $44,000
Parks and Recreation: $36,000
Correctional Institutions: $27,000
Public Welfare - Other: $22,000
Protective Inspection and Regulation - Other: $7,000
Corrections - Other: $1,000
- Federal Intergovernmental - General Local Government Support: $38,000
Other: $1,000
- General - Interest on Debt: $18,000
- Long Term Debt - Beginning Outstanding - Unspecified Public Purpose: $443,000
Retired Unspecified Public Purpose: $267,000
Outstanding Unspecified Public Purpose: $176,000
- Miscellaneous - General Revenue - Other: $3,000
Fines and Forfeits: $2,000
- State Intergovernmental - Highways: $508,000
Other: $50,000
- Tax - Property: $1,817,000
Other License: $15,000
Hand County government finances - Cash and Securities in 2018:
- Charges - Other: $185,000
- Current Operations - Regular Highways: $1,869,000
Police Protection: $256,000
Health - Other: $254,000
Judicial and Legal Services: $98,000
General - Other: $96,000
Central Staff Services: $93,000
General Public Buildings: $45,000
Natural Resources - Other: $44,000
Parks and Recreation: $36,000
Correctional Institutions: $27,000
Public Welfare - Other: $22,000
Protective Inspection and Regulation - Other: $7,000
Corrections - Other: $1,000
- Federal Intergovernmental - General Local Government Support: $38,000
Other: $1,000
- General - Interest on Debt: $18,000
- Long Term Debt - Beginning Outstanding - Unspecified Public Purpose: $443,000
Retired Unspecified Public Purpose: $267,000
Outstanding Unspecified Public Purpose: $176,000
- Miscellaneous - General Revenue - Other: $3,000
Fines and Forfeits: $2,000
- State Intergovernmental - Highways: $508,000
Other: $50,000
- Tax - Property: $1,817,000
Other License: $15,000
Supplemental Security Income (SSI) in 2006:
- Total number of recipients: 49
- Number of aged recipients: 23
- Number of blind and disabled recipients: 26
- Number of recipients under 18: 7
- Number of recipients between 18 and 64: 17
- Number of recipients older than 64: 25
- Number of recipients also receiving OASDI: 15
- Amount of payments (thousands of dollars): 17
| Most common first names in Hand County, SD among deceased individuals | ||
| Name | Count | Lived (average) |
|---|---|---|
| John | 46 | 81.6 years |
| Mary | 27 | 78.9 years |
| Charles | 23 | 82.4 years |
| William | 23 | 82.4 years |
| Robert | 23 | 73.5 years |
| James | 19 | 79.6 years |
| Anna | 19 | 86.9 years |
| George | 17 | 81.0 years |
| Henry | 15 | 82.2 years |
| Ruth | 15 | 82.5 years |
| Most common last names in Hand County, SD among deceased individuals | ||
| Last name | Count | Lived (average) |
|---|---|---|
| Johnson | 25 | 80.6 years |
| Wilson | 13 | 75.6 years |
| Miller | 12 | 81.4 years |
| Campbell | 11 | 73.5 years |
| Waldner | 10 | 69.2 years |
| Bertsch | 10 | 83.6 years |
| Jones | 9 | 84.4 years |
| Smith | 9 | 85.2 years |
| Gortmaker | 9 | 67.9 years |
| Williams | 8 | 80.9 years |
| Businesses in Hand County, SD | ||||
| Name | Count | Name | Count | |
|---|---|---|---|---|
| Ace Hardware | 1 | RadioShack | 1 | |
| Alco Stores | 1 | Super 8 | 1 | |
| Chevrolet | 1 | UPS | 1 | |
| Dairy Queen | 1 | |||
Hand County on our top lists:
- #14 on the list of "Top 101 counties with the largest number of people without health insurance coverage in 2000"
- #15 on the list of "Top 101 counties with the lowest total withdrawal of fresh water for public supply"
- #24 on the list of "Top 101 counties with the lowest ground withdrawal of fresh water for public supply"