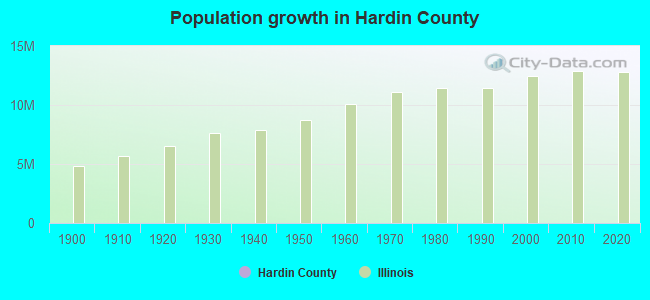
Hardin County, Illinois (IL)
County owner-occupied free and clear houses and condos in 2010: 920
County owner-occupied houses and condos in 2000: 1,599
Renter-occupied apartments: 375 (it was 388 in 2000)
| % of renters here: | 20% |
| State: | 33% |
Land area: 178 sq. mi.
Water area: 3.2 sq. mi.
Population density: 20 people per square mile (low).
Industries providing employment: Educational, health and social services (38.0%), Retail trade (12.2%), Agriculture,forestry,fishing and hunting, and mining (12.0%).
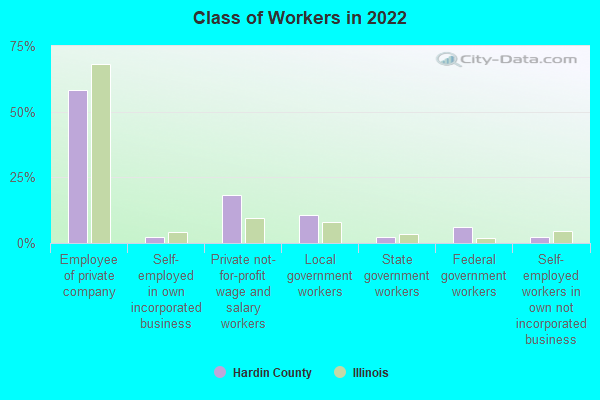
Type of workers:
- Private wage or salary: 80%
- Government: 18%
- Self-employed, not incorporated: 2%
- Unpaid family work: 0%
- OSM Map
- General Map
- Google Map
- MSN Map

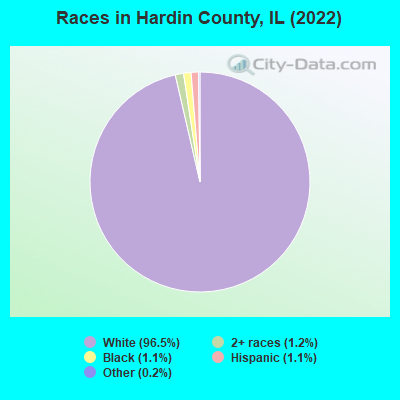
- 3,43296.5%White Non-Hispanic Alone
- 431.2%Two or more races
- 381.1%Black Non-Hispanic Alone
- 381.1%Hispanic or Latino
- 70.2%Some other race alone
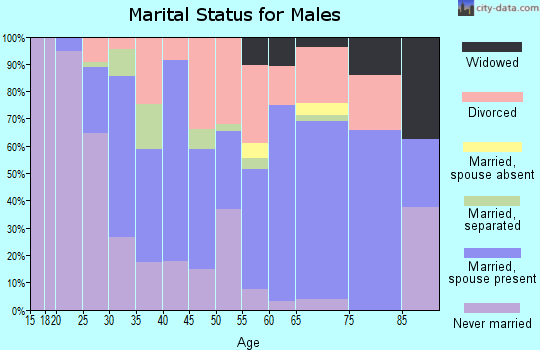
| Median resident age: | 54.5 years |
| Illinois median age: | 39.1 years |
| Males: 1,821 | |
| Females: 1,793 |

 | Things going on in Illinois ...August & September 2009 (12 replies) |
| Good schools in southeastern illinois? (4 replies) |
| Hardin County: | 2.0 people |
| Illinois: | 3 people |
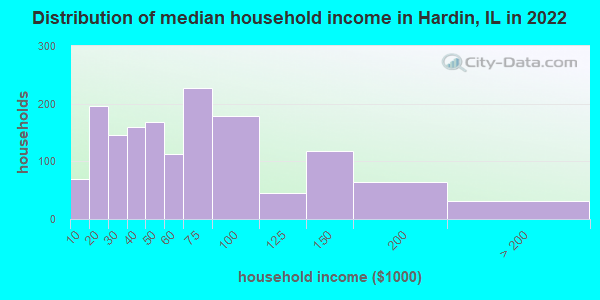
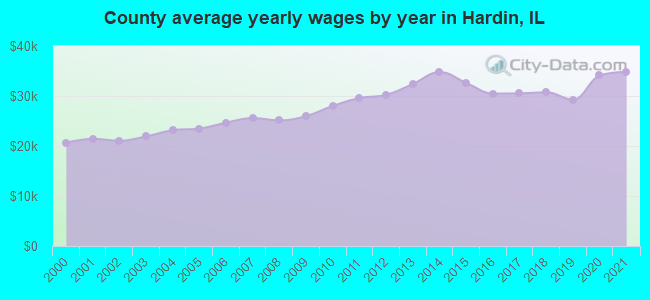
Estimated median household income in 2022: $51,859 ($27,693 in 1999)
| This county: | $51,859 |
| Illinois: | $76,708 |
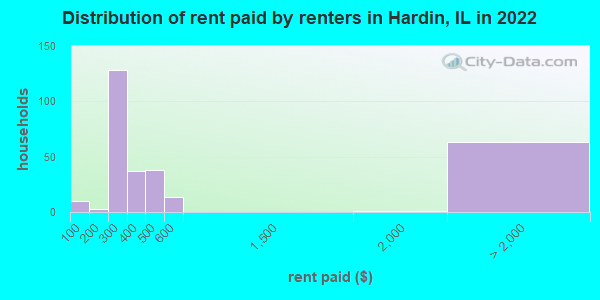
Median contract rent in 2022 for apartments: $253 (lower quartile is $220, upper quartile is $358)
| This county: | $253 |
| State: | $1008 |
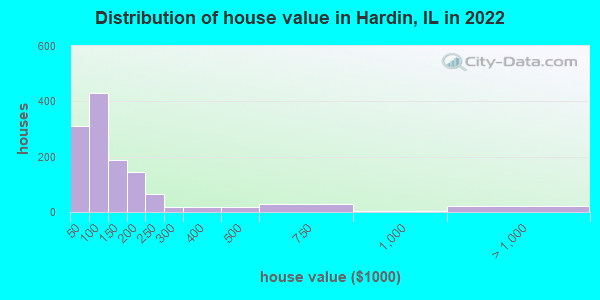
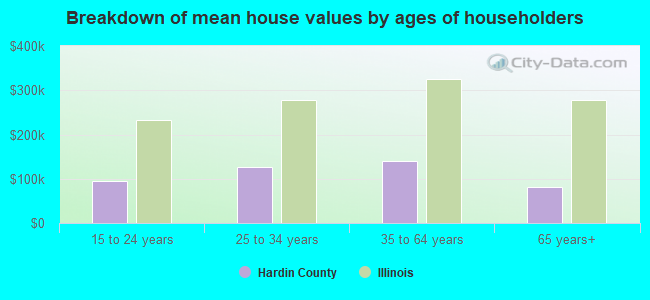
Estimated median house or condo value in 2022: $95,337 (it was $42,300 in 2000)
| Hardin: | $95,337 |
| Illinois: | $251,600 |
Mean price in 2022:
Median monthly housing costs for homes and condos with a mortgage: $972Detached houses: $108,155
Here: $108,155 State: $310,164 Mobile homes: $56,332
Here: $56,332 State: $78,855
Median monthly housing costs for units without a mortgage: $488
Institutionalized population: 0
Crime in 2018 (reported by the sheriff's office or county police, not the county total):
- Murders: 0
- Rapes: 1
- Robberies: 0
- Assaults: 8
- Burglaries: 3
- Thefts: 14
- Auto thefts: 2
Crime in 2017 (reported by the sheriff's office or county police, not the county total):
- Murders: 1
- Rapes: 1
- Robberies: 1
- Assaults: 16
- Burglaries: 13
- Thefts: 14
- Auto thefts: 4
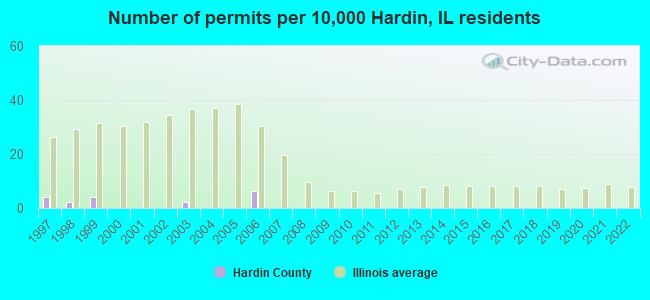
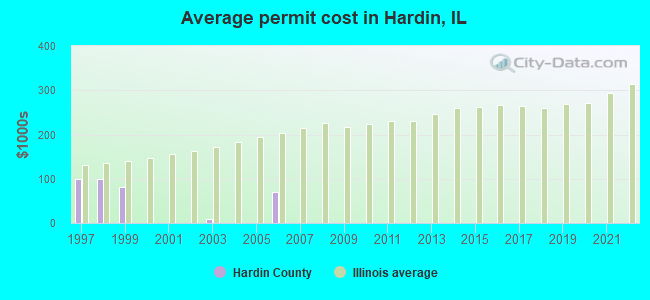
Single-family new house construction building permits:
- 2022: 0 buildings
- 2021: 0 buildings
- 2020: 0 buildings
- 2019: 0 buildings
- 2018: 0 buildings
- 2017: 0 buildings
- 2016: 0 buildings
- 2015: 0 buildings
- 2014: 0 buildings
- 2013: 0 buildings
- 2012: 0 buildings
- 2011: 0 buildings
- 2010: 0 buildings
- 2009: 0 buildings
- 2008: 0 buildings
- 2007: 0 buildings
- 2006: 3 buildings, average cost: $70,000
- 2005: 0 buildings
- 2004: 0 buildings
- 2003: 1 building, cost: $10,000
- 2002: 0 buildings
- 2001: 0 buildings
- 2000: 0 buildings
- 1999: 2 buildings, average cost: $81,000
- 1998: 1 building, cost: $100,000
- 1997: 2 buildings, average cost: $100,000
Median real estate property taxes paid for housing units with mortgages in 2022: $1,177 (1.1%)
Median real estate property taxes paid for housing units with no mortgage in 2022: $946 (1.1%)
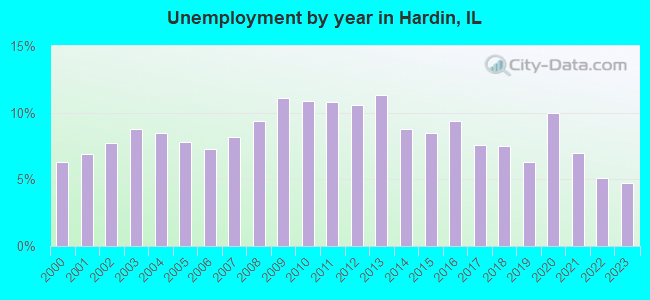
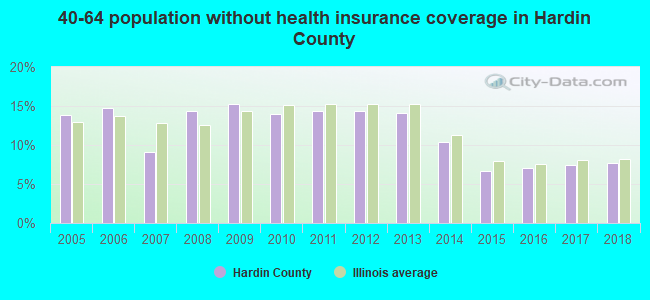
| Hardin County: | 11.7% |
| Illinois: | 11.9% |
Median age of residents in 2022: 54.5 years old
(Males: 54.3 years old, Females: 55.5 years old)
(Median age for: White residents: 54.8 years old, Black residents: 37.4 years old, Hispanic or Latino residents: 30.0 years old)
Fair market rent in 2006 for a 1-bedroom apartment in Hardin County is $408 a month.
Fair market rent for a 2-bedroom apartment is $492 a month.
Fair market rent for a 3-bedroom apartment is $648 a month.
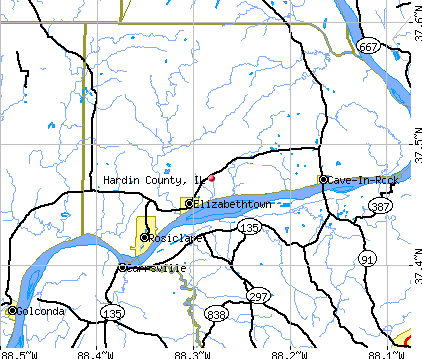
Cities in this county include: Rosiclare, Elizabethtown, Cave-In-Rock.
Neighboring counties: Baca County, Colorado  , Elk County, Kansas , Montgomery County, Virginia
  , Leslie County, Kentucky , Saline County
  .
.
| Here: | 4.7% |
| Illinois: | 4.2% |
Current college students: 214
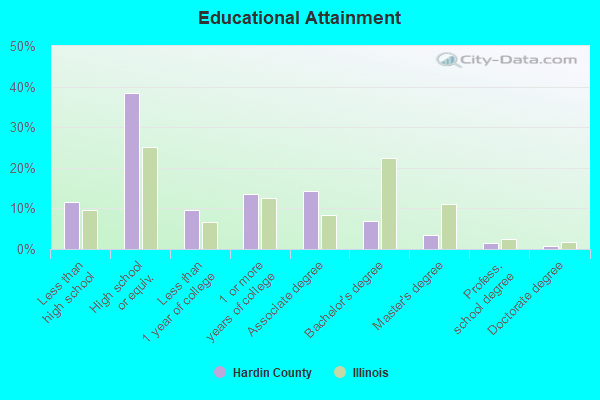
People 25 years of age or older with a high school degree or higher: 87.3%
People 25 years of age or older with a bachelor's degree or higher: 12.0%
Number of foreign born residents: 12 (16.7% naturalized citizens)
| Hardin County: | 0.3% |
| Whole state: | 14.4% |
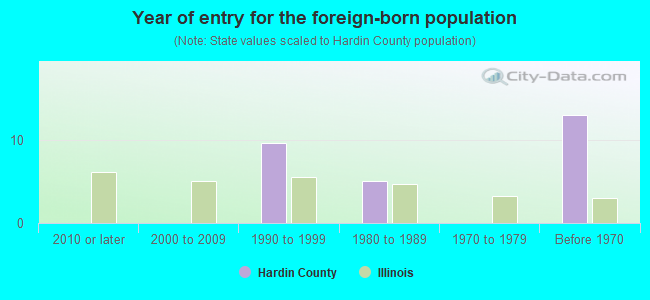
- Year of entry for the foreign-born population
- 02010 or later
- 02000 to 2009
- 101990 to 1999
- 51980 to 1989
- 01970 to 1979
- 13Before 1970
Mean travel time to work (commute): minutes
Percentage of county residents living and working in this county: 90.8%

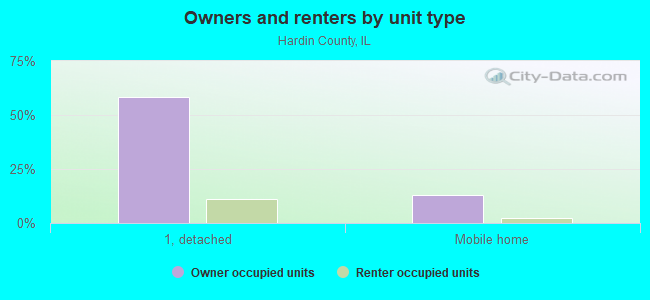
Housing units in structures:
- One, detached: 1,676
- One, attached: 10
- Two: 40
- 3 or 4: 129
- Mobile homes: 381
Housing units in Hardin County with a mortgage: 412 (30 second mortgage, 0 home equity loan, 30 both second mortgage and home equity loan)
Houses without a mortgage: 0
| Here: | 100.0% with mortgage |
| State: | 97.4% with mortgage |
Religion statistics for Hardin County
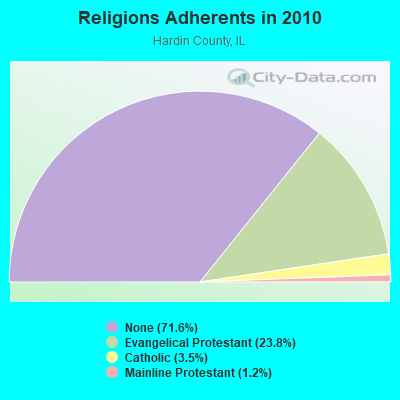
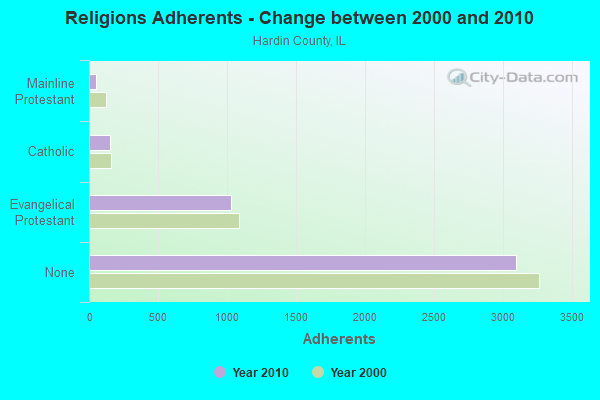
| Religion | Adherents | Congregations |
|---|---|---|
| Evangelical Protestant | 1,026 | 8 |
| Catholic | 150 | 1 |
| Mainline Protestant | 51 | 1 |
| Other | 1 | - |
| None | 3,092 | - |
Source: Clifford Grammich, Kirk Hadaway, Richard Houseal, Dale E.Jones, Alexei Krindatch, Richie Stanley and Richard H.Taylor. 2012. 2010 U.S.Religion Census: Religious Congregations & Membership Study. Association of Statisticians of American Religious Bodies. Jones, Dale E., et al. 2002. Congregations and Membership in the United States 2000. Nashville, TN: Glenmary Research Center.
Food Environment Statistics:
| Hardin County: | 2.25 / 10,000 pop. |
| State: | 2.24 / 10,000 pop. |
| Hardin County: | 6.74 / 10,000 pop. |
| Illinois: | 2.61 / 10,000 pop. |
| This county: | 11.24 / 10,000 pop. |
| State: | 6.86 / 10,000 pop. |
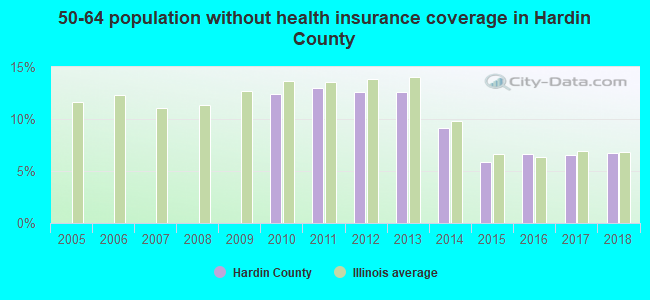
| Hardin County: | 9.2% |
| Illinois: | 8.3% |
| Hardin County: | 27.0% |
| State: | 25.2% |
| Here: | 15.5% |
| State: | 14.5% |
Agriculture in Hardin County:
Average size of farms: 222 acresAverage value of agricultural products sold per farm: $16,248
Average total farm production expenses per farm: $18,316
Harvested cropland as a percentage of land in farms: 30.84%
Irrigated harvested cropland as a percentage of land in farms: 0.17%
Average market value of all machinery and equipment per farm: $35,978
The percentage of farms operated by a family or individual: 89.94%
Average age of principal farm operators: 57 years
Average number of cattle and calves per 100 acres of all land in farms: 13.59
Corn for grain: 1800 harvested acres
Soybeans for beans: 3305 harvested acres
Earthquake activity:
Hardin County-area historical earthquake activity is significantly above Illinois state average. It is 271% greater than the overall U.S. average.On 4/18/2008 at 09:36:59, a magnitude 5.4 (5.1 MB, 4.8 MS, 5.4 MW, 5.2 MW, Class: Moderate, Intensity: VI - VII) earthquake occurred 71.2 miles away from Hardin County center
On 4/18/2008 at 09:36:59, a magnitude 5.2 (5.2 MW, Depth: 8.9 mi) earthquake occurred 71.2 miles away from the county center
On 6/18/2002 at 17:37:15, a magnitude 5.0 (4.3 MB, 4.6 MW, 5.0 LG) earthquake occurred 45.0 miles away from the county center
On 9/26/1990 at 13:18:51, a magnitude 5.0 (4.7 MB, 4.8 LG, 5.0 LG, Depth: 7.7 mi) earthquake occurred 72.1 miles away from the county center
On 6/10/1987 at 23:48:54, a magnitude 5.1 (4.9 MB, 4.4 MS, 4.6 MS, 5.1 LG) earthquake occurred 95.9 miles away from Hardin County center
On 5/4/1991 at 01:18:54, a magnitude 5.0 (4.4 MB, 4.6 LG, 5.0 LG, Depth: 3.1 mi) earthquake occurred 105.7 miles away from the county center
Magnitude types: regional Lg-wave magnitude (LG), body-wave magnitude (MB), surface-wave magnitude (MS), moment magnitude (MW)
Most recent natural disasters:
- Illinois Covid-19 Pandemic, Incident Period: January 20, 2020, FEMA Id: 4489, Natural disaster type: Other
- Illinois Severe Storms and Flooding, Incident Period: April 19, 2011 to June 14, 2011, Major Disaster (Presidential) Declared DR-1991: June 07, 2011, FEMA Id: 1991, Natural disaster type: Storm, Flood
- Illinois Severe Winter Storm, Incident Period: January 26, 2009 to January 28, 2009, Major Disaster (Presidential) Declared DR-1826: March 02, 2009, FEMA Id: 1826, Natural disaster type: Winter Storm
- Illinois Hurricane Katrina Evacuation, Incident Period: August 29, 2005 to October 01, 2005, Emergency Declared EM-3230: September 07, 2005, FEMA Id: 3230, Natural disaster type: Hurricane
- Illinois Snow, Incident Period: December 21, 2004 to December 23, 2004, Emergency Declared EM-3199: February 01, 2005, FEMA Id: 3199, Natural disaster type: Snow
- Illinois Severe Storms, Tornadoes, and Flooding, Incident Period: April 21, 2002 to May 23, 2002, Major Disaster (Presidential) Declared DR-1416: May 21, 2002, FEMA Id: 1416, Natural disaster type: Storm, Tornado, Flood
- Illinois Severe Storms and Flooding, Incident Period: March 01, 1997 to April 01, 1997, Major Disaster (Presidential) Declared DR-1170: March 21, 1997, FEMA Id: 1170, Natural disaster type: Storm, Flood
The number of natural disasters in Hardin County (7) is smaller than the US average (15).
Major Disasters (Presidential) Declared: 4
Emergencies Declared: 2
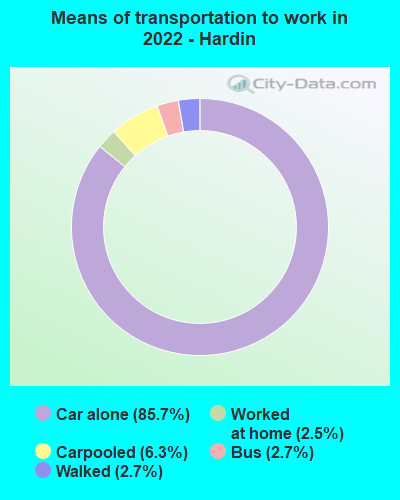
Means of transportation to work:
- Drove a car alone: 523 (82.6%)
- Carpooled: 41 (6.5%)
- Bus: 15 (2.4%)
- Walked: 16 (2.5%)
- Worked at home: 20 (3.2%)
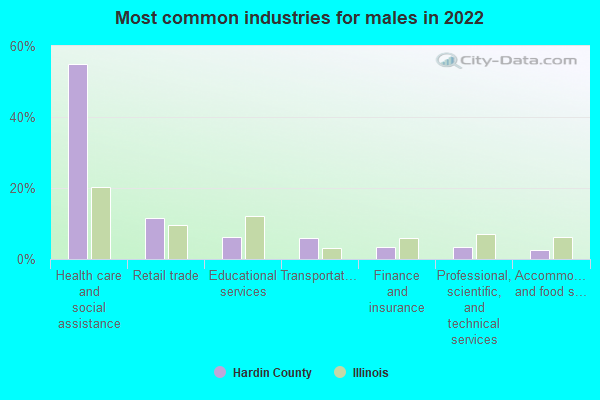
- Health care and social assistance (55%)
- Retail trade (11%)
- Educational services (6%)
- Transportation and warehousing (6%)
- Finance and insurance (4%)
- Professional, scientific, and technical services (4%)
- Accommodation and food services (3%)
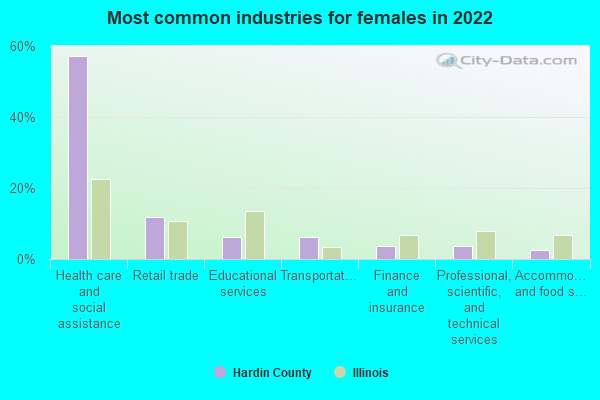
- Health care and social assistance (57%)
- Retail trade (12%)
- Educational services (6%)
- Transportation and warehousing (6%)
- Finance and insurance (4%)
- Professional, scientific, and technical services (4%)
- Accommodation and food services (3%)
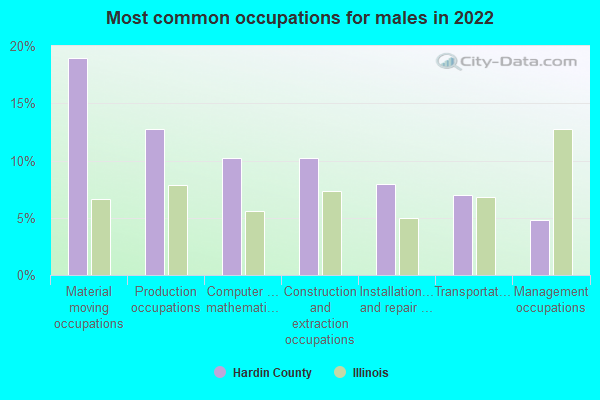
- Material moving occupations (19%)
- Production occupations (13%)
- Computer and mathematical occupations (10%)
- Construction and extraction occupations (10%)
- Installation, maintenance, and repair occupations (8%)
- Transportation occupations (7%)
- Management occupations (5%)
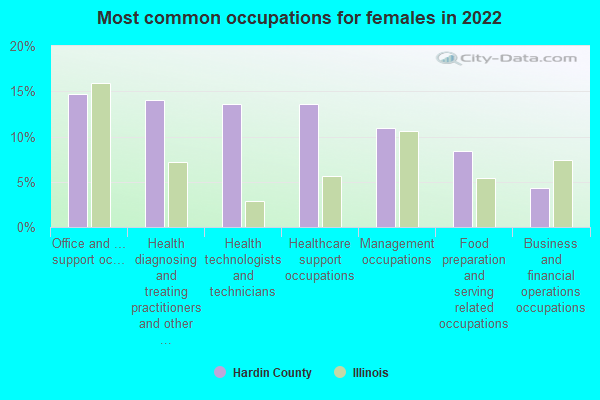
- Office and administrative support occupations (15%)
- Health diagnosing and treating practitioners and other technical occupations (14%)
- Health technologists and technicians (14%)
- Healthcare support occupations (14%)
- Management occupations (11%)
- Food preparation and serving related occupations (8%)
- Business and financial operations occupations (4%)
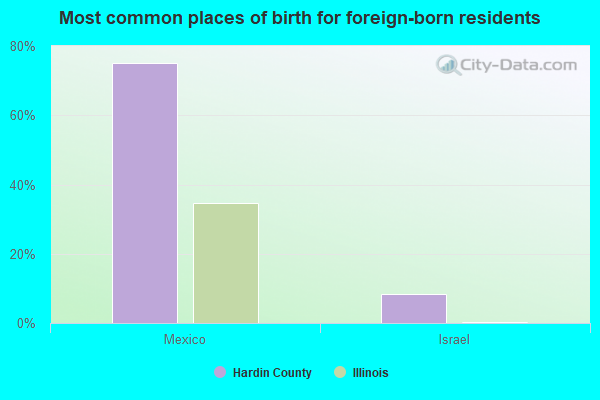
- Mexico (75%)
- Israel (8%)
- Ireland (0%)
- Norway (0%)
- Sweden (0%)
- United Kingdom, excluding England and Scotland (0%)
- England (0%)
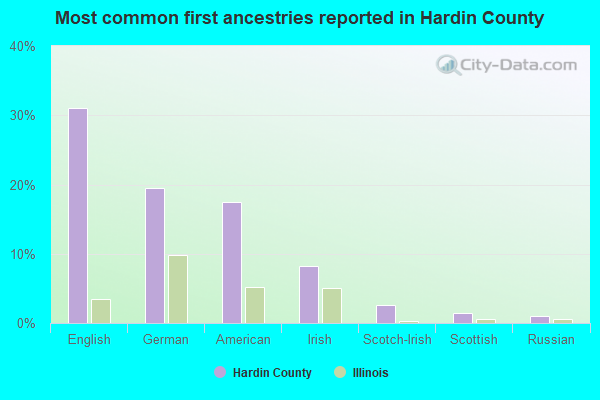
- English (31%)
- German (19%)
- American (18%)
- Irish (8%)
- Scotch-Irish (3%)
- Scottish (1%)
- Russian (1%)
People in group quarters in Hardin County, Illinois in 2000:
- 153 people in state prisons
- 57 people in nursing homes
- 14 people in other noninstitutional group quarters
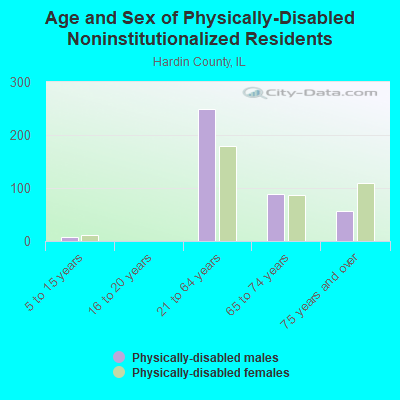
- 13 people in orthopedic wards and institutions for the physically handicapped
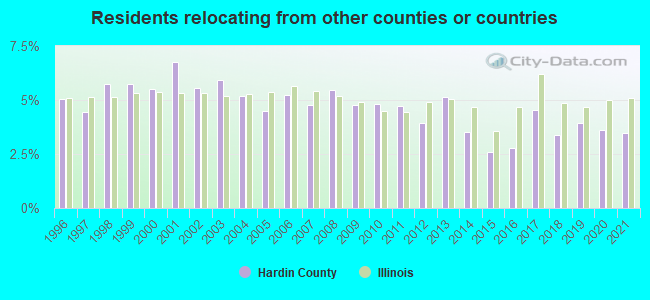
3.46% of this county's 2021 resident taxpayers lived in other counties in 2020 ($38,818 average adjusted gross income)
| Here: | 3.46% |
| Illinois average: | 5.09% |
10 or fewer of this county's residents moved from foreign countries.
3.46% relocated from other counties in Illinois ($38,818 average AGI)
10 or fewer of this county's residents relocated from other states.
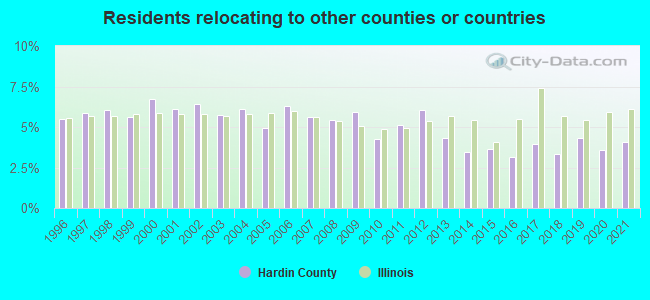
4.06% of this county's 2020 resident taxpayers moved to other counties in 2021 ($29,865 average adjusted gross income)
| Here: | 4.06% |
| Illinois average: | 6.10% |
10 or fewer of this county's residents moved to foreign countries.
4.06% relocated to other counties in Illinois ($29,865 average AGI)
10 or fewer of this county's residents relocated to other states.
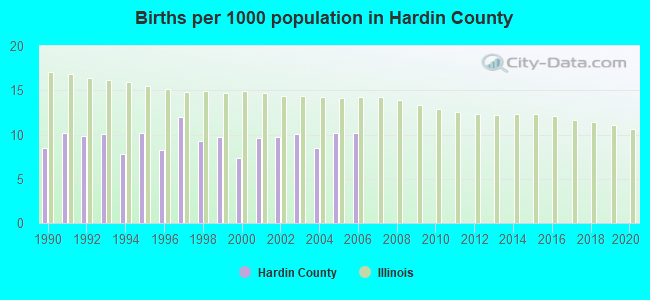
Births per 1000 population from 1990 to 1999: 9.6
Births per 1000 population from 2000 to 2006: 9.4
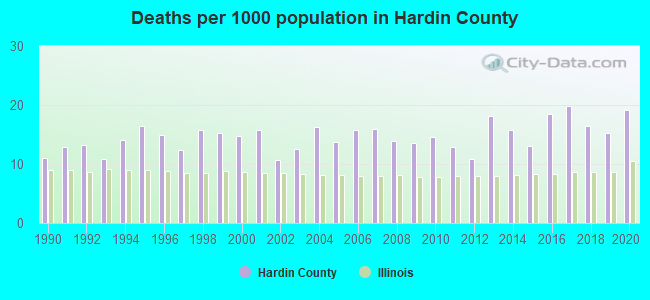
Deaths per 1000 population from 1990 to 1999: 13.7
Deaths per 1000 population from 2000 to 2009: 14.3
Deaths per 1000 population from 2010 to 2020: 15.8
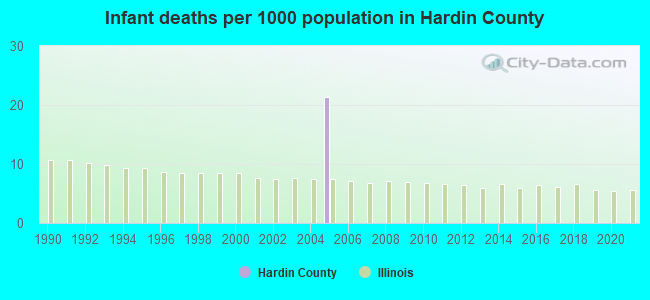
Infant deaths per 1000 live births from 2000 to 2006: 3.0
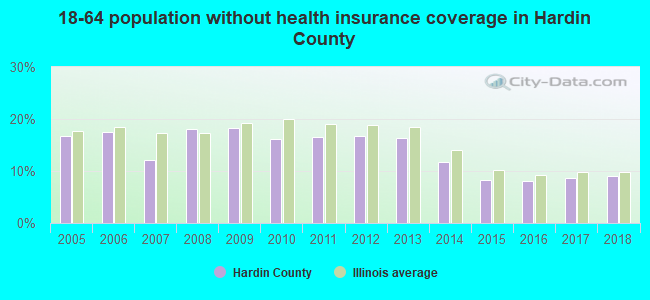
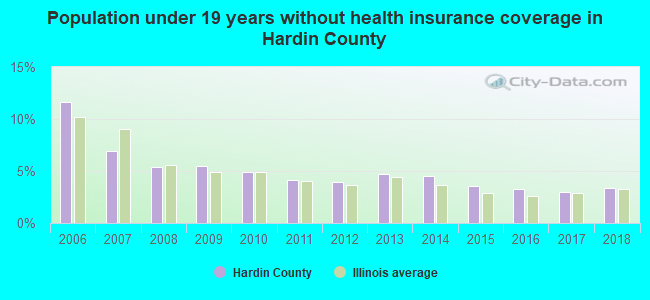
Persons under 19 years old without health insurance coverage in 2018: 3.4%
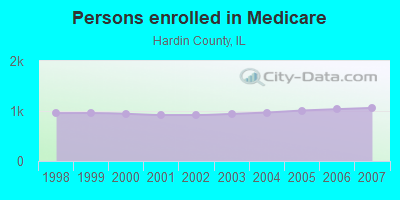
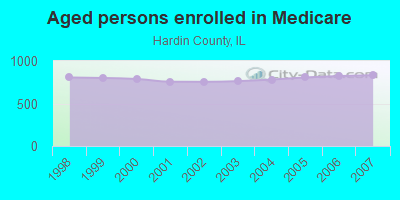
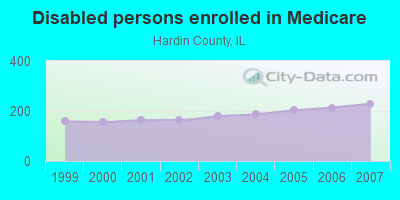
Persons enrolled in hospital insurance and/or supplemental medical insurance (Medicare) in July 1, 2007: 1,062 (833 aged, 229 disabled)
Children under 18 without health insurance coverage in 2007: 98 (12%)
Most common underlying causes of death in Hardin County, Illinois in 1999 - 2019:
- Acute myocardial infarction, unspecified (22)
- Atherosclerotic heart disease (21)
- Bronchus or lung, unspecified - Malignant neoplasms (12)
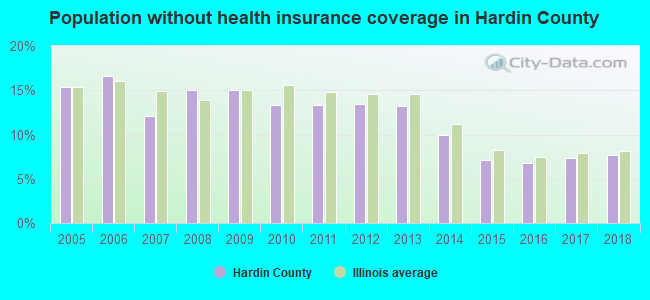
Population without health insurance coverage in 2000: 10%
Children under 18 without health insurance coverage in 2000: 8%
Short term general hospital admissions per 100,000 population in 2004: 14,201
Short term general hospital beds per 100,000 population in 2004: 529
Emergency room visits per 100,000 population in 2004: 92,339
General practice office based MDs per 100,000 population in 2005: 1,017
Medical specialist MDs per 100,000 population in 2005: 2,120
Dentists per 100,000 population in 1998: 21
Household type by relationship:
Households: 3,614- Male householders: 727 (224 living alone), Female householders: 778 (300 living alone)
703 spouses (703 opposite-sex spouses), 97 unmarried partners, (97 opposite-sex unmarried partners), 701 children (651 natural, 0 adopted, 50 stepchildren), 116 grandchildren, 171 brothers or sisters, 82 parents, 0 foster children, 112 other relatives, 30 non-relatives
- In group quarters: 88
Size of family households: 567 2-persons, 166 3-persons, 102 4-persons, 36 5-persons, 41 6-persons, 18 7-or-more-persons.
Size of nonfamily households: 524 1-person, 52 2-persons.
224 married couples with children.
172 single-parent households (76 men, 96 women).
99.9% of residents of Hardin speak English at home.
0.4% of residents speak Spanish at home (36% speak English very well, 64% speak English not well).
In fiscal year 2004:
Federal Government expenditure: $36,278,000 ($7,678 per capita)
Department of Defense expenditure: $401,000
Federal direct payments to individuals for retirement and disability: $13,856,000
Federal other direct payments to individuals: $9,181,000
Federal direct payments not to individuals: $930,000
Federal grants: $10,966,000
Federal procurement contracts: $291,000 ($68,000 Department of Defense)
Federal salaries and wages: $1,054,000 ($0,000 Department of Defense)
Federal Government direct loans: $32,000
Federal guaranteed/insured loans: $302,000
Federal Government insurance: $2,714,000
Population change from April 1, 2000 to July 1, 2005:
Births: 231| Here: | 49 per 1000 residents |
| State: | 75 per 1000 residents |
Deaths: 330
| Here: | 70 per 1000 residents |
| State: | 43 per 1000 residents |
Net international migration: +45
| Here: | +10 per 1000 residents |
| State: | +26 per 1000 residents |
Net internal migration: -22
| Here: | |
| State: |
Total withdrawal of fresh water for public supply: 0.14 millions of gallons per day (all from ground)
| Here: | 5.9 |
| State: | 6.4 |
| Here: | 3.8 |
| State: | 4.1 |
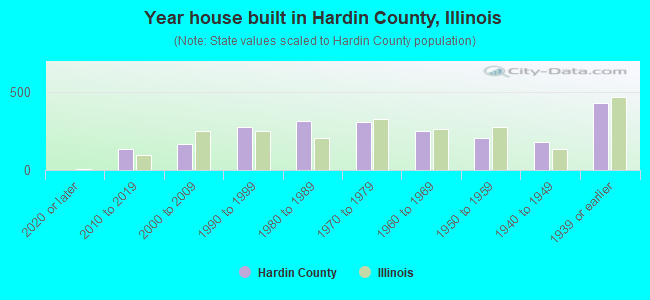
- Year house built in Hardin County, Illinois
- 02020 or later
- 1372010 to 2019
- 1652000 to 2009
- 2751990 to 1999
- 3151980 to 1989
- 3081970 to 1979
- 2491960 to 1969
- 2061950 to 1959
- 1781940 to 1949
- 4261939 or earlier
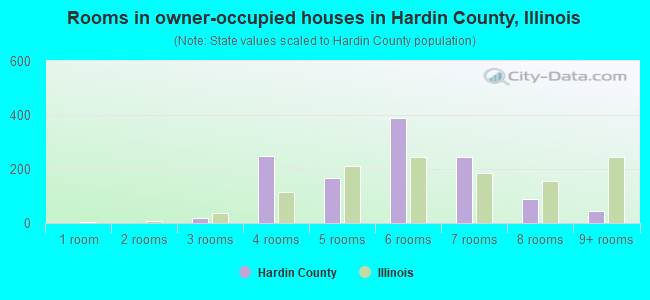
- Rooms in owner-occupied houses in Hardin County, Illinois
- 01 room
- 02 rooms
- 203 rooms
- 2504 rooms
- 1685 rooms
- 3896 rooms
- 2467 rooms
- 908 rooms
- 459+ rooms
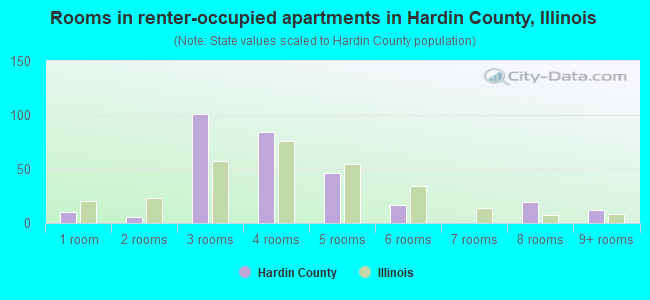
- Rooms in renter-occupied apartments in Hardin County, Illinois
- 101 room
- 62 rooms
- 1013 rooms
- 844 rooms
- 465 rooms
- 176 rooms
- 07 rooms
- 198 rooms
- 129+ rooms
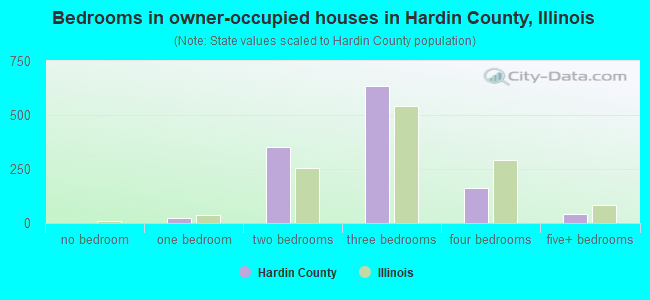
- Bedrooms in owner-occupied houses in Hardin County, Illinois
- 0no bedroom
- 211 bedroom
- 3532 bedrooms
- 6343 bedrooms
- 1604 bedrooms
- 415+ bedrooms
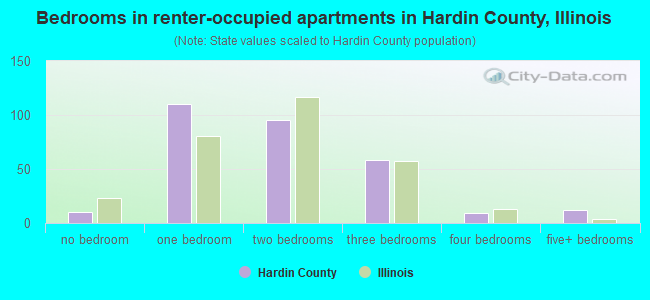
- Bedrooms in renter-occupied apartments in Hardin County, Illinois
- 10no bedroom
- 1101 bedroom
- 952 bedrooms
- 583 bedrooms
- 94 bedrooms
- 125+ bedrooms
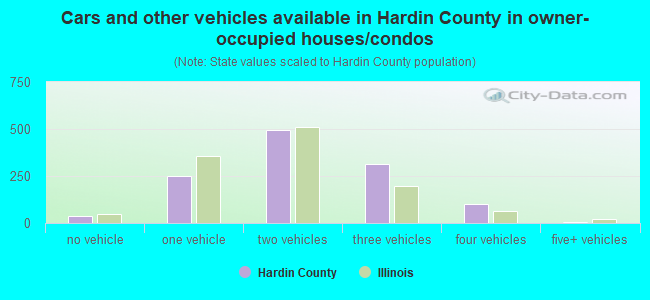
- Cars and other vehicles available in Hardin County in owner-occupied houses/condos
- 37no vehicle
- 2511 vehicle
- 4932 vehicles
- 3163 vehicles
- 1024 vehicles
- 75+ vehicles
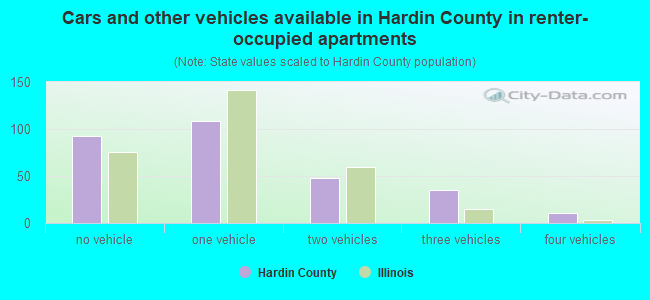
- Cars and other vehicles available in Hardin County in renter-occupied apartments
- 93no vehicle
- 1091 vehicle
- 482 vehicles
- 353 vehicles
- 114 vehicles
- 05+ vehicles
84.5% of Hardin County residents lived in the same house 1 years ago.
Out of people who lived in different houses, 32% lived in this county.
Out of people who lived in different counties, 21% lived in Illinois.
| Hardin County: | 84.5% |
| State average: | 88.3% |
Place of birth for U.S.-born residents:
- This state: 2,602
- Other state: 990
- Northeast: 18
- Midwest: 452
- South: 398
- West: 114
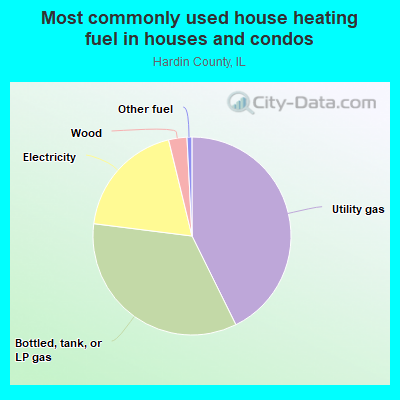
- 42.7%Utility gas
- 34.3%Bottled, tank, or LP gas
- 19.2%Electricity
- 3.0%Wood
- 0.8%Other fuel
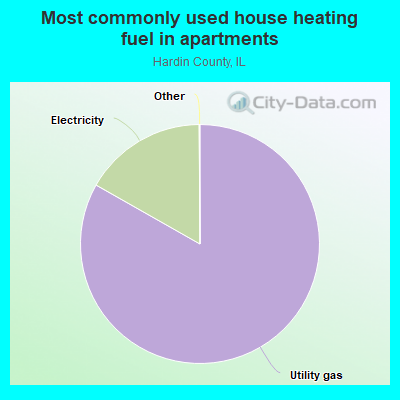
- 83.3%Utility gas
- 16.7%Electricity
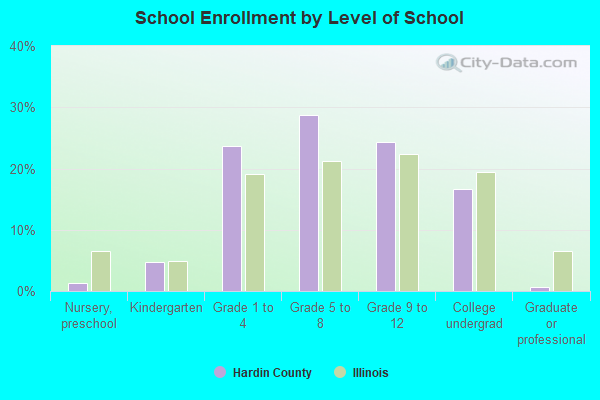
Private vs. public school enrollment:
| Here: | 0.8% |
| Illinois: | 13.3% |
| Here: | 0.8% |
| Illinois: | 9.9% |
| Here: | 0.0% |
| Illinois: | 27.4% |
Hardin County government finances - Expenditure in 2017:
- Charges - Other: $158,000
- Current Operations - Regular Highways: $560,000
Judicial and Legal Services: $440,000
General - Other: $245,000
Central Staff Services: $193,000
Police Protection: $157,000
Correctional Institutions: $156,000
Health - Other: $58,000
Parks and Recreation: $27,000
Public Welfare - Other: $11,000
- Miscellaneous - General Revenue - Other: $138,000
Interest Earnings: $26,000
- Other Capital Outlay - Regular Highways: $49,000
- Other Funds - Cash and Securities: $4,012,000
- State Intergovernmental - General Local Government Support: $456,000
Highways: $273,000
Other: $93,000
- Tax - Property: $664,000
- Total Salaries and Wages: $1,025,000
Hardin County government finances - Revenue in 2017:
- Charges - Other: $158,000
- Current Operations - Regular Highways: $560,000
Judicial and Legal Services: $440,000
General - Other: $245,000
Central Staff Services: $193,000
Police Protection: $157,000
Correctional Institutions: $156,000
Health - Other: $58,000
Parks and Recreation: $27,000
Public Welfare - Other: $11,000
- Miscellaneous - General Revenue - Other: $138,000
Interest Earnings: $26,000
- Other Capital Outlay - Regular Highways: $49,000
- Other Funds - Cash and Securities: $4,012,000
- State Intergovernmental - General Local Government Support: $456,000
Highways: $273,000
Other: $93,000
- Tax - Property: $664,000
- Total Salaries and Wages: $1,025,000
Hardin County government finances - Debt in 2017:
- Charges - Other: $158,000
- Current Operations - Regular Highways: $560,000
Judicial and Legal Services: $440,000
General - Other: $245,000
Central Staff Services: $193,000
Police Protection: $157,000
Correctional Institutions: $156,000
Health - Other: $58,000
Parks and Recreation: $27,000
Public Welfare - Other: $11,000
- Miscellaneous - General Revenue - Other: $138,000
Interest Earnings: $26,000
- Other Capital Outlay - Regular Highways: $49,000
- Other Funds - Cash and Securities: $4,012,000
- State Intergovernmental - General Local Government Support: $456,000
Highways: $273,000
Other: $93,000
- Tax - Property: $664,000
- Total Salaries and Wages: $1,025,000
Hardin County government finances - Cash and Securities in 2017:
- Charges - Other: $158,000
- Current Operations - Regular Highways: $560,000
Judicial and Legal Services: $440,000
General - Other: $245,000
Central Staff Services: $193,000
Police Protection: $157,000
Correctional Institutions: $156,000
Health - Other: $58,000
Parks and Recreation: $27,000
Public Welfare - Other: $11,000
- Miscellaneous - General Revenue - Other: $138,000
Interest Earnings: $26,000
- Other Capital Outlay - Regular Highways: $49,000
- Other Funds - Cash and Securities: $4,012,000
- State Intergovernmental - General Local Government Support: $456,000
Highways: $273,000
Other: $93,000
- Tax - Property: $664,000
- Total Salaries and Wages: $1,025,000
Supplemental Security Income (SSI) in 2006:
- Total number of recipients: 191
- Number of aged recipients: 14
- Number of blind and disabled recipients: 177
- Number of recipients under 18: 25
- Number of recipients between 18 and 64: 115
- Number of recipients older than 64: 51
- Number of recipients also receiving OASDI: 72
- Amount of payments (thousands of dollars): 78
| Most common first names in Hardin County, IL among deceased individuals | ||
| Name | Count | Lived (average) |
|---|---|---|
| James | 79 | 70.3 years |
| John | 63 | 73.4 years |
| William | 61 | 72.3 years |
| Charles | 51 | 73.2 years |
| Mary | 44 | 80.5 years |
| Robert | 22 | 70.6 years |
| Thomas | 21 | 70.7 years |
| George | 20 | 75.5 years |
| Mildred | 14 | 84.3 years |
| Helen | 14 | 76.7 years |
| Most common last names in Hardin County, IL among deceased individuals | ||
| Last name | Count | Lived (average) |
|---|---|---|
| Smith | 35 | 75.0 years |
| Oxford | 31 | 79.7 years |
| Davis | 25 | 76.6 years |
| Hobbs | 25 | 73.8 years |
| Patton | 25 | 76.6 years |
| Holbrook | 22 | 73.7 years |
| Joiner | 21 | 73.7 years |
| Suits | 19 | 73.4 years |
| Frailey | 17 | 79.5 years |
| Dutton | 17 | 69.6 years |
Businesses in Hardin County, IL
- H&R Block: 1