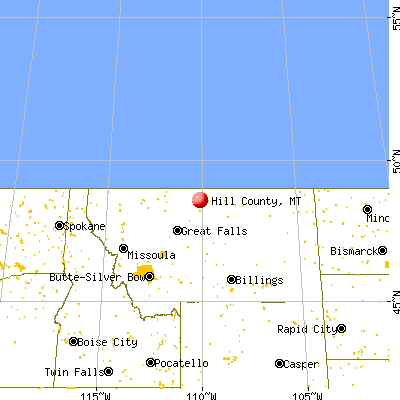
Hill County, Montana (MT)
County owner-occupied free and clear houses and condos in 2010: 1,874
County owner-occupied houses and condos in 2000: 4,161
Renter-occupied apartments: 2,138 (it was 2,296 in 2000)
| % of renters here: | 36% |
| State: | 32% |
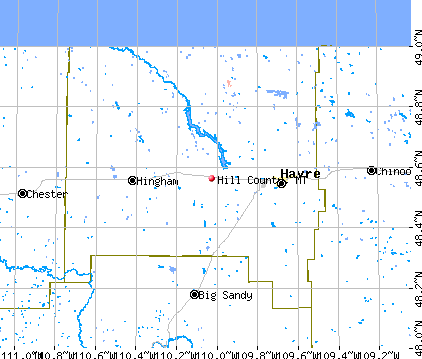
Land area: 2896 sq. mi.
Water area: 19.7 sq. mi.
Population density: 6 people per square mile (very low).
Industries providing employment: Educational, health and social services (22.6%), Arts, entertainment, recreation, accommodation and food services (11.6%), Retail trade (11.3%).
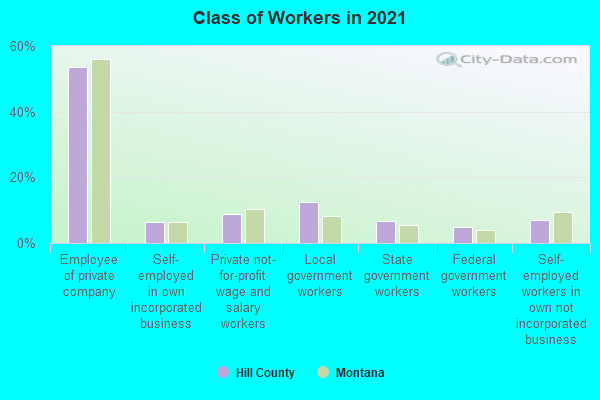
Type of workers:
- Private wage or salary: 74%
- Government: 20%
- Self-employed, not incorporated: 6%
- Unpaid family work: 0%
- OSM Map
- General Map
- Google Map
- MSN Map

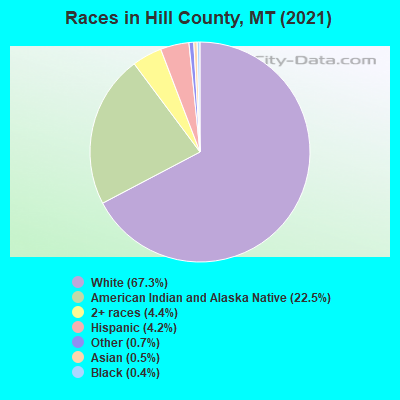
- 11,20667.6%White Non-Hispanic Alone
- 3,57821.6%American Indian and Alaska Native alone
- 9065.5%Two or more races
- 7044.2%Hispanic or Latino
- 1200.7%Some other race alone
- 350.2%Asian alone
- 180.1%Black Non-Hispanic Alone
- 140.08%Native Hawaiian and Other
Pacific Islander alone
| Median resident age: | 33.5 years |
| Montana median age: | 40.2 years |
| Males: 8,495 | |
| Females: 8,204 |

 | Butte or Great Falls? Which would you choose? (53 replies) |
| Havre, Montana (28 replies) |
| Racism in the NW (120 replies) |
| Recommendations on affordable, mid-size towns for libertarian couple (15 replies) |
| havre montana and jobs (7 replies) |
| Hill County: | 2.0 people |
| Montana: | 2 people |
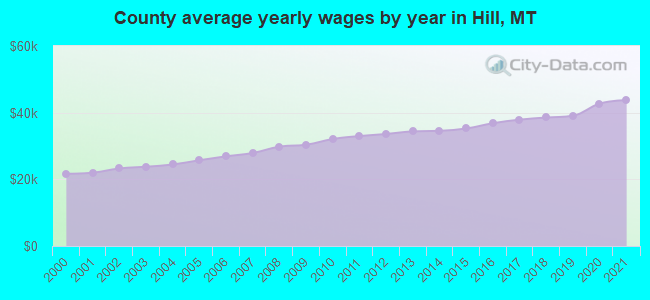
Estimated median household income in 2022: $59,563 ($30,781 in 1999)
| This county: | $59,563 |
| Montana: | $67,631 |
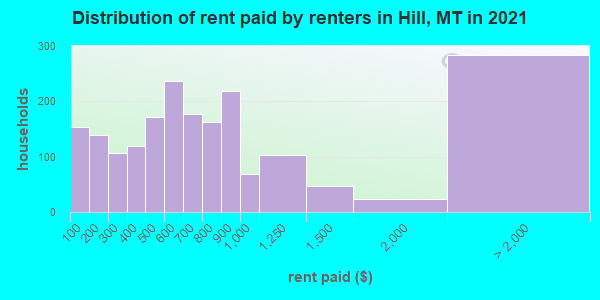
Median contract rent in 2022 for apartments: $601 (lower quartile is $385, upper quartile is $879)
| This county: | $601 |
| State: | $871 |
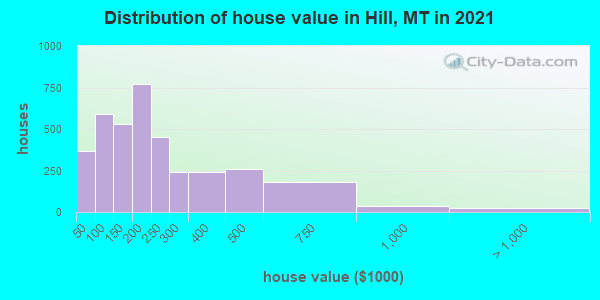
Estimated median house or condo value in 2022: $219,696 (it was $74,600 in 2000)
| Hill: | $219,696 |
| Montana: | $366,400 |
Median monthly housing costs for homes and condos with a mortgage: $1,416
Median monthly housing costs for units without a mortgage: $451
Institutionalized population: 134
Crime in 2021 (reported by the sheriff's office or county police, not the county total):
- Murders: 0
- Rapes: 4
- Robberies: 1
- Assaults: 17
- Burglaries: 9
- Thefts: 126
- Auto thefts: 14
Crime in 2020 (reported by the sheriff's office or county police, not the county total):
- Murders: 1
- Rapes: 4
- Robberies: 1
- Assaults: 24
- Burglaries: 7
- Thefts: 90
- Auto thefts: 9
Health of residents in Hill County based on CDC Behavioral Risk Factor Surveillance System Survey Questionnaires from 2003 to 2012:
General health status score of residents in this county from 1 (poor) to 5 (excellent) is 3.3. This is worse than average.67.2% of residents exercised in the past month. This is less than average.
50.8% of residents smoked 100+ cigarettes in their lives. This is about average.
51.5% of adult residents drank alcohol in the past 30 days. This is less than average.
66.6% of residents visited a dentist within the past year. This is less than average.
Average weight of males is 204 pounds. This is more than average.
Average weight of females is 163 pounds. This is about average.
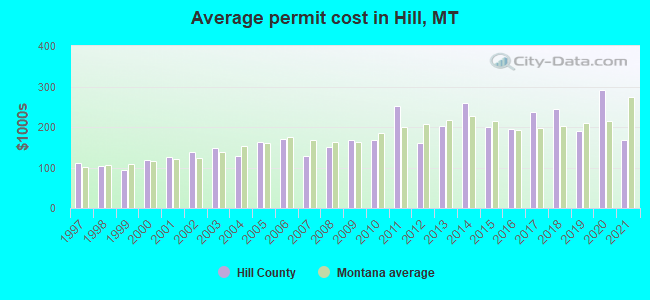
Single-family new house construction building permits:
- 2022: 0 buildings
- 2021: 1 building, cost: $167,200
- 2020: 1 building, cost: $292,000
- 2019: 1 building, cost: $190,600
- 2018: 1 building, cost: $245,000
- 2017: 1 building, cost: $237,700
- 2016: 4 buildings, average cost: $196,300
- 2015: 2 buildings, average cost: $201,400
- 2014: 3 buildings, average cost: $258,800
- 2013: 3 buildings, average cost: $202,700
- 2012: 4 buildings, average cost: $160,500
- 2011: 2 buildings, average cost: $252,500
- 2010: 1 building, cost: $166,600
- 2009: 6 buildings, average cost: $168,000
- 2008: 13 buildings, average cost: $149,700
- 2007: 17 buildings, average cost: $127,700
- 2006: 19 buildings, average cost: $171,200
- 2005: 2 buildings, average cost: $162,600
- 2004: 9 buildings, average cost: $129,200
- 2003: 7 buildings, average cost: $148,900
- 2002: 5 buildings, average cost: $138,100
- 2001: 5 buildings, average cost: $126,400
- 2000: 5 buildings, average cost: $118,500
- 1999: 17 buildings, average cost: $94,500
- 1998: 2 buildings, average cost: $103,300
- 1997: 5 buildings, average cost: $109,700

Median real estate property taxes paid for housing units with mortgages in 2022: $2,137 (0.9%)
Median real estate property taxes paid for housing units with no mortgage in 2022: $2,006 (1.1%)

| Hill County: | 16.5% |
| Montana: | 12.1% |
Median age of residents in 2022: 33.5 years old
(Males: 32.6 years old, Females: 34.7 years old)
(Median age for: White residents: 39.8 years old, Black residents: 27.6 years old, American Indian residents: 22.9 years old, Asian residents: 49.8 years old, Hispanic or Latino residents: 19.9 years old, Other race residents: 34.0 years old)
Fair market rent in 2006 for a 1-bedroom apartment in Hill County is $403 a month.
Fair market rent for a 2-bedroom apartment is $503 a month.
Fair market rent for a 3-bedroom apartment is $725 a month.
Cities in this county include: Havre, Rocky Boy's, Havre North, Box Elder, Wild Horse Lake, Rocky Boy's Agency, Beaver Creek, St. Pierre, West Havre, Rudyard.
2023 air pollution in Hill County:
Particulate Matter (PM2.5) Annual: 7.2 µg/m3(standard limit: 15.0 µg/m3). Near U.S. average.
Neighboring counties: Okanogan County, Washington  , Phillips County
  , Ramsey County, North Dakota , Marshall County, Minnesota .
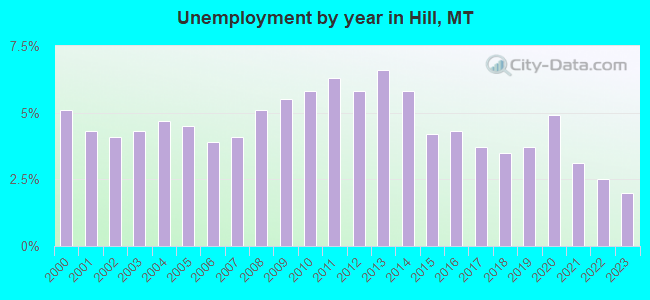
| Here: | 3.2% |
| Montana: | 3.8% |
Current college students: 1,378
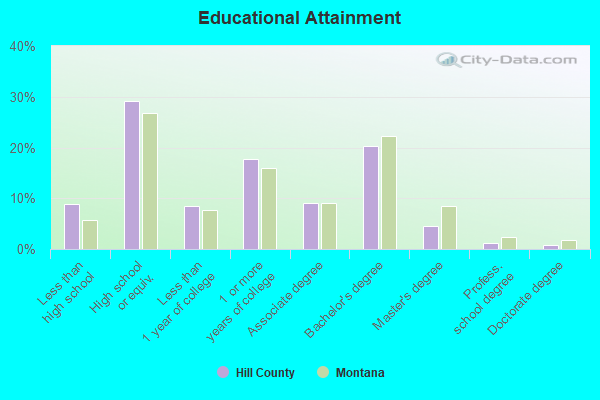
People 25 years of age or older with a high school degree or higher: 90.4%
People 25 years of age or older with a bachelor's degree or higher: 23.7%
Number of foreign born residents: 133 (36.1% naturalized citizens)
| Hill County: | 0.8% |
| Whole state: | 2.3% |
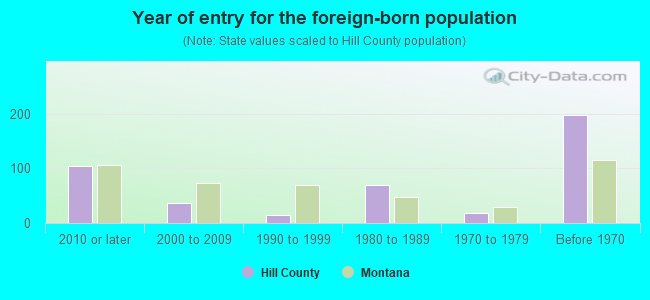
- Year of entry for the foreign-born population
- 192010 or later
- 452000 to 2009
- 221990 to 1999
- 691980 to 1989
- 191970 to 1979
- 198Before 1970
Mean travel time to work (commute): minutes
Percentage of county residents living and working in this county: 100.2%
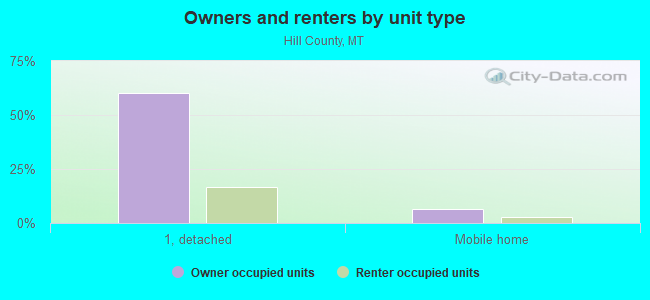
Housing units in structures:
- One, detached: 5,307
- One, attached: 335
- Two: 173
- 3 or 4: 278
- 5 to 9: 217
- 10 to 19: 112
- 20 to 49: 63
- 50 or more: 55
- Mobile homes: 819
Housing units in Hill County with a mortgage: 2,062 (166 second mortgage, 0 home equity loan, 148 both second mortgage and home equity loan)
Houses without a mortgage: 17
| Here: | 10.5% with mortgage |
| State: | 97.4% with mortgage |
Religion statistics for Hill County
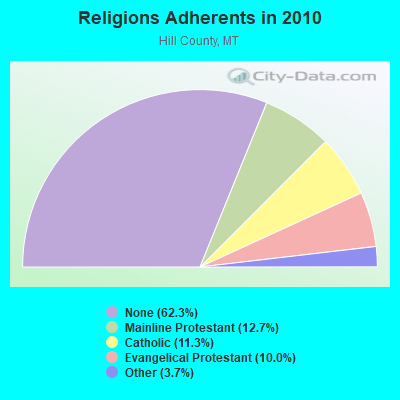
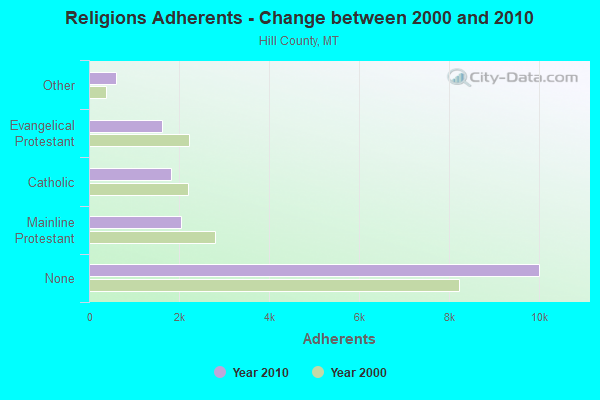
| Religion | Adherents | Congregations |
|---|---|---|
| Mainline Protestant | 2,039 | 14 |
| Catholic | 1,820 | 5 |
| Evangelical Protestant | 1,615 | 18 |
| Other | 601 | 2 |
| None | 10,021 | - |
Source: Clifford Grammich, Kirk Hadaway, Richard Houseal, Dale E.Jones, Alexei Krindatch, Richie Stanley and Richard H.Taylor. 2012. 2010 U.S.Religion Census: Religious Congregations & Membership Study. Association of Statisticians of American Religious Bodies. Jones, Dale E., et al. 2002. Congregations and Membership in the United States 2000. Nashville, TN: Glenmary Research Center.
Food Environment Statistics:
| Hill County: | 1.21 / 10,000 pop. |
| State: | 2.55 / 10,000 pop. |
| This county: | 0.60 / 10,000 pop. |
| Montana: | 0.48 / 10,000 pop. |
| Hill County: | 4.84 / 10,000 pop. |
| Montana: | 4.69 / 10,000 pop. |
| This county: | 6.65 / 10,000 pop. |
| State: | 10.38 / 10,000 pop. |
| Hill County: | 8.1% |
| Montana: | 7.2% |
| Hill County: | 29.0% |
| State: | 23.1% |
| Here: | 18.8% |
| State: | 10.7% |
Agriculture in Hill County:
Average size of farms: 2164 acresAverage value of agricultural products sold per farm: $51,980
Average value of crops sold per acre for harvested cropland: $67.43
The value of livestock, poultry, and their products as a percentage of the total market value of agricultural products sold: 22.76%
Average total farm production expenses per farm: $62,847
Harvested cropland as a percentage of land in farms: 27.52%
Irrigated harvested cropland as a percentage of land in farms: 0.60%
Average market value of all machinery and equipment per farm: $126,306
The percentage of farms operated by a family or individual: 65.79%
Average age of principal farm operators: 53 years
Average number of cattle and calves per 100 acres of all land in farms: 1.23
All wheat for grain: 444014 harvested acres
Earthquake activity:
Hill County-area historical earthquake activity is significantly above Montana state average. It is 444% greater than the overall U.S. average.On 8/18/1959 at 06:37:13, a magnitude 7.7 (7.7 UK, Class: Major, Intensity: VIII - XII) earthquake occurred 277.8 miles away from Hill County center, causing $26,000,000 total damage
On 10/28/1983 at 14:06:06, a magnitude 7.3 (6.2 MB, 7.3 MS, 7.0 MW) earthquake occurred 358.5 miles away from the county center, causing 2 deaths (2 shaking deaths) and 3 injuries, causing $15,000,000 total damage
On 7/6/2017 at 06:30:17, a magnitude 5.8 (5.8 MW, Depth: 7.6 mi, Class: Moderate, Intensity: VI - VII) earthquake occurred 165.8 miles away from the county center
On 6/30/1975 at 18:54:13, a magnitude 6.1 (5.6 MB, 5.9 MS, 6.1 UK, 6.1 ML, Class: Strong, Intensity: VII - IX) earthquake occurred 270.9 miles away from the county center
On 3/31/2020 at 23:52:30, a magnitude 6.5 (6.5 MW, Depth: 7.5 mi) earthquake occurred 372.5 miles away from Hill County center
On 7/26/2005 at 04:08:37, a magnitude 5.7 (5.7 MB, 5.2 MS, 5.6 MW) earthquake occurred 249.5 miles away from the county center
Magnitude types: body-wave magnitude (MB), local magnitude (ML), surface-wave magnitude (MS), moment magnitude (MW)
Most recent natural disasters:
- Montana Covid-19 Pandemic, Incident Period: January 20, 2020, FEMA Id: 4508, Natural disaster type: Other
- Montana Flooding, Incident Period: April 12, 2018 - May 6, 2018, FEMA Id: 4388, Natural disaster type: Flood
- Montana Flooding, Incident Period: May 19, 2013 to June 03, 2013, Major Disaster (Presidential) Declared DR-4127: July 10, 2013, FEMA Id: 4127, Natural disaster type: Flood
- Montana Severe Storms and Flooding, Incident Period: April 04, 2011 to July 22, 2011, Major Disaster (Presidential) Declared DR-1996: June 17, 2011, FEMA Id: 1996, Natural disaster type: Storm, Flood
- Montana Severe Storms and Flooding, Incident Period: June 15, 2010 to July 30, 2010, Major Disaster (Presidential) Declared DR-1922: July 10, 2010, FEMA Id: 1922, Natural disaster type: Storm, Flood
- Montana Hurricane Katrina Evacuation, Incident Period: August 29, 2005 to October 01, 2005, Emergency Declared EM-3253: September 13, 2005, FEMA Id: 3253, Natural disaster type: Hurricane
- Montana Severe Storms and Flooding, Incident Period: June 08, 2002 to June 21, 2002, Major Disaster (Presidential) Declared DR-1424: July 03, 2002, FEMA Id: 1424, Natural disaster type: Storm, Flood
- Montana Wildfires, Incident Period: July 13, 2000 to September 25, 2000, Major Disaster (Presidential) Declared DR-1340: August 30, 2000, FEMA Id: 1340, Natural disaster type: Fire
- Montana Flooding, Incident Period: March 01, 1996 to June 05, 1996, Major Disaster (Presidential) Declared DR-1113: May 16, 1996, FEMA Id: 1113, Natural disaster type: Flood
- Montana SEVERE STORMS, FLOODING, Incident Period: September 25, 1986 to October 28, 1986, Major Disaster (Presidential) Declared DR-777: October 14, 1986, FEMA Id: 777, Natural disaster type: Storm, Flood
The number of natural disasters in Hill County (10) is smaller than the US average (15).
Major Disasters (Presidential) Declared: 7
Emergencies Declared: 1
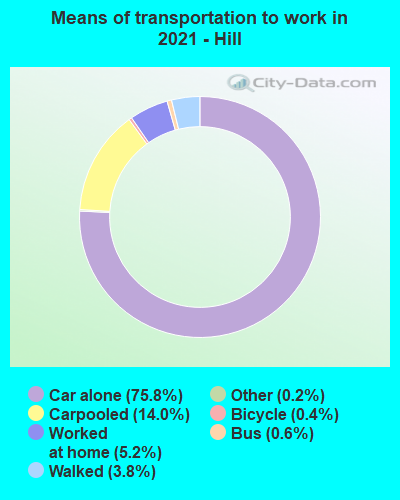
Means of transportation to work:
- Drove a car alone: 5,824 (71.0%)
- Carpooled: 1,406 (17.1%)
- Bus: 16 (0.2%)
- Taxicab, motorcycle, or other means: 47 (0.6%)
- Bicycle: 40 (0.5%)
- Walked: 381 (4.6%)
- Worked at home: 456 (5.6%)
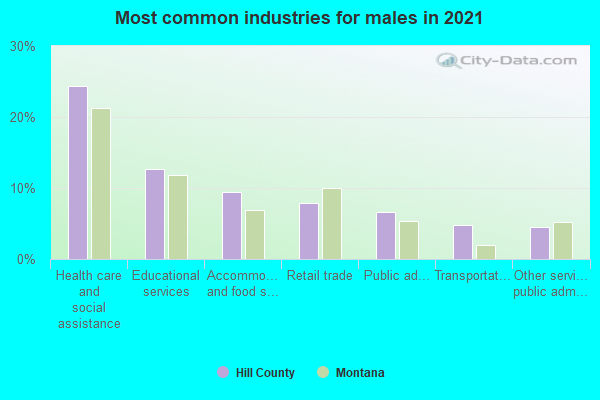
- Health care and social assistance (25%)
- Accommodation and food services (12%)
- Retail trade (11%)
- Educational services (11%)
- Other services, except public administration (5%)
- Public administration (5%)
- Finance and insurance (5%)
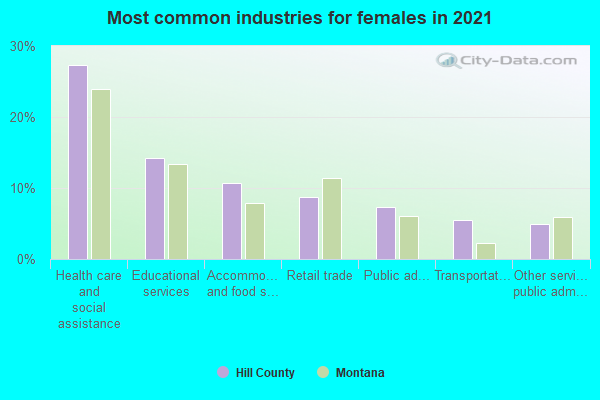
- Health care and social assistance (27%)
- Accommodation and food services (12%)
- Retail trade (12%)
- Educational services (12%)
- Other services, except public administration (5%)
- Public administration (5%)
- Finance and insurance (5%)
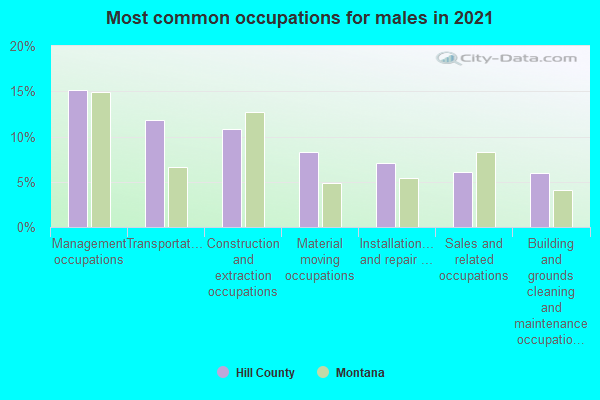
- Management occupations (14%)
- Installation, maintenance, and repair occupations (11%)
- Construction and extraction occupations (10%)
- Transportation occupations (10%)
- Material moving occupations (9%)
- Sales and related occupations (7%)
- Production occupations (7%)
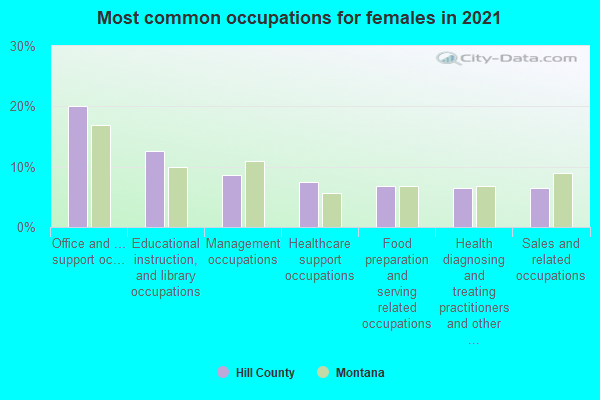
- Office and administrative support occupations (19%)
- Management occupations (9%)
- Sales and related occupations (9%)
- Educational instruction, and library occupations (8%)
- Health diagnosing and treating practitioners and other technical occupations (8%)
- Healthcare support occupations (8%)
- Food preparation and serving related occupations (7%)
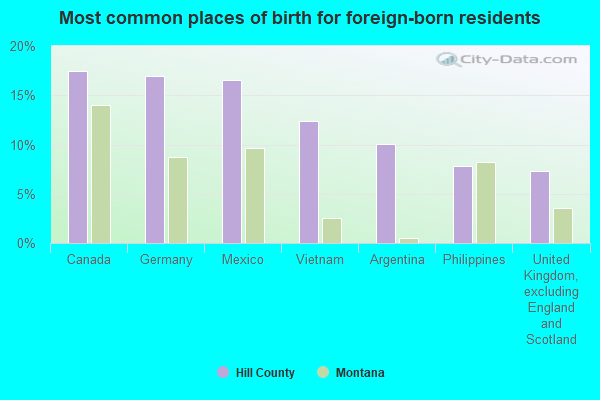
- Argentina (30%)
- Canada (23%)
- South Africa (17%)
- Vietnam (14%)
- Germany (7%)
- Europe, n.e.c. (5%)
- Nigeria (2%)
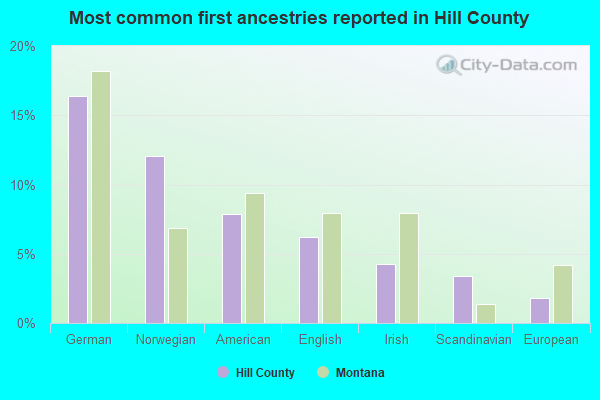
- German (13%)
- Norwegian (12%)
- American (11%)
- English (7%)
- Scandinavian (3%)
- Irish (3%)
- European (2%)

People in group quarters in Hill County, Montana in 2010:
- 248 people in other noninstitutional facilities
- 183 people in college/university student housing
- 104 people in nursing facilities/skilled-nursing facilities
- 30 people in local jails and other municipal confinement facilities
- 28 people in group homes intended for adults
People in group quarters in Hill County, Montana in 2000:
- 170 people in college dormitories (includes college quarters off campus)
- 110 people in mental (psychiatric) hospitals or wards
- 23 people in local jails and other confinement facilities (including police lockups)
- 14 people in homes for the mentally retarded
- 13 people in other noninstitutional group quarters
- 9 people in nursing homes
- 5 people in homes or halfway houses for drug/alcohol abuse
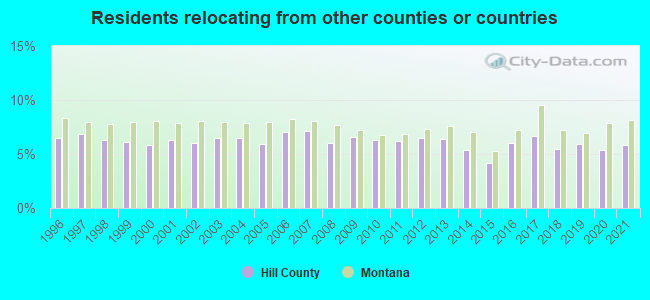
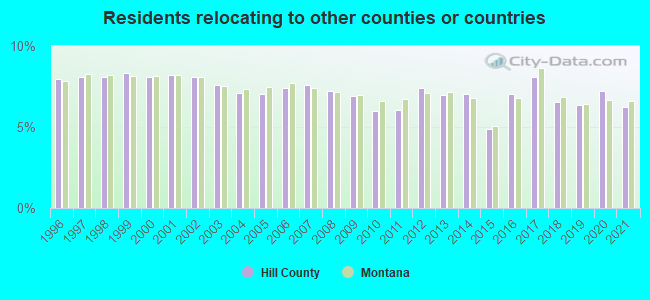
5.86% of this county's 2021 resident taxpayers lived in other counties in 2020 ($46,253 average adjusted gross income)
| Here: | 5.86% |
| Montana average: | 8.17% |
10 or fewer of this county's residents moved from foreign countries.
3.41% relocated from other counties in Montana ($21,810 average AGI)
2.45% relocated from other states ($24,445 average AGI)
Hill County: 2.45% Montana average: 5.13%
Top counties from which taxpayers relocated into this county between 2020 and 2021:
| from Blaine County, MT | |
| from Cascade County, MT | |
| from Chouteau County, MT | |
| from Missoula County, MT |
6.23% of this county's 2020 resident taxpayers moved to other counties in 2021 ($50,003 average adjusted gross income)
| Here: | 6.23% |
| Montana average: | 6.62% |
10 or fewer of this county's residents moved to foreign countries.
4.05% relocated to other counties in Montana ($30,018 average AGI)
2.18% relocated to other states ($19,985 average AGI)
Hill County: 2.18% Montana average: 3.54%
Top counties to which taxpayers relocated from this county between 2020 and 2021:
| to Cascade County, MT | |
| to Blaine County, MT | |
| to Chouteau County, MT | |
| to Lewis and Clark County, MT | |
| to Flathead County, MT |
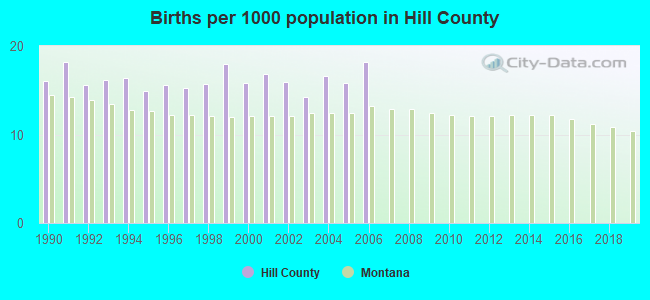
Births per 1000 population from 1990 to 1999: 16.2
Births per 1000 population from 2000 to 2006: 16.2
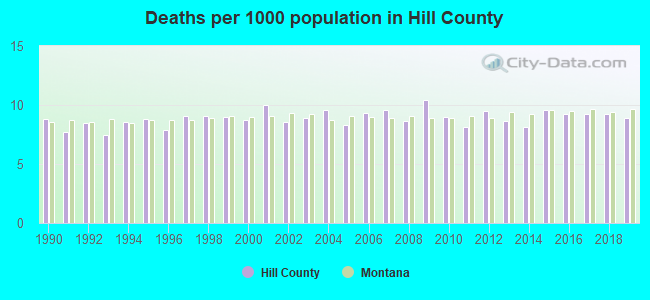
Deaths per 1000 population from 1990 to 1999: 8.5
Deaths per 1000 population from 2000 to 2009: 9.2
Deaths per 1000 population from 2010 to 2020: 9.2
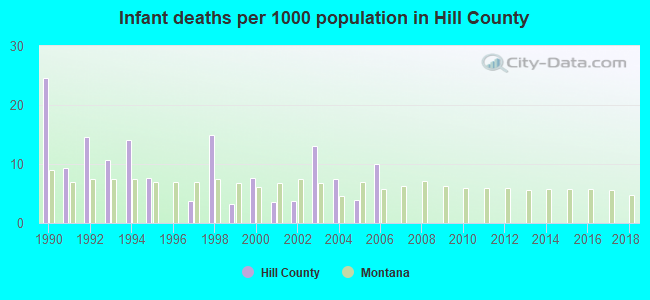
Infant deaths per 1000 live births from 1990 to 1999: 10.3
Infant deaths per 1000 live births from 2000 to 2006: 7.0
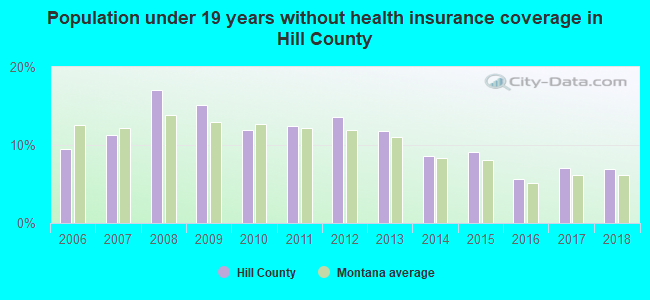
Persons under 19 years old without health insurance coverage in 2018: 6.9%

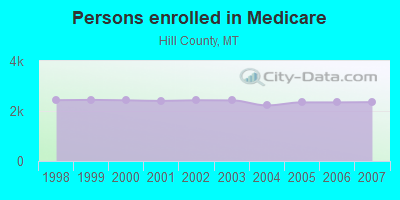
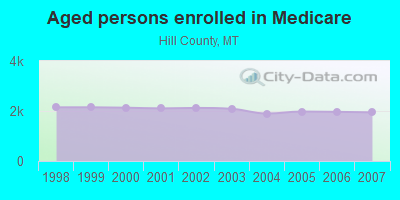
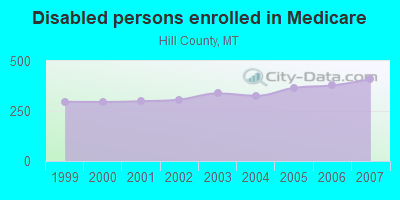
Persons enrolled in hospital insurance and/or supplemental medical insurance (Medicare) in July 1, 2007: 2,354 (1,945 aged, 409 disabled)
Children under 18 without health insurance coverage in 2007: 470 (10%)
Most common underlying causes of death in Hill County, Montana in 1999 - 2019:
- Atherosclerotic cardiovascular disease, so described (131)
- Atherosclerotic heart disease (96)
- Chronic obstructive pulmonary disease, unspecified (82)
- Unspecified dementia (71)
- Bronchus or lung, unspecified - Malignant neoplasms (65)
- Acute myocardial infarction, unspecified (47)
- Congestive heart failure (22)
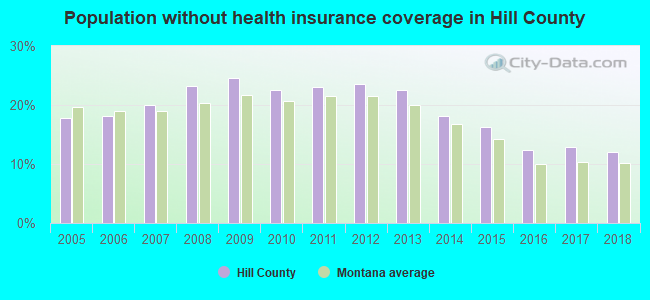
Population without health insurance coverage in 2000: 19%
Children under 18 without health insurance coverage in 2000: 18%
Short term general hospital admissions per 100,000 population in 2004: 17,306
Short term general hospital beds per 100,000 population in 2004: 1,130
Emergency room visits per 100,000 population in 2004: 54,916
General practice office based MDs per 100,000 population in 2005: 1,785
Medical specialist MDs per 100,000 population in 2005: 1,214
Dentists per 100,000 population in 1998: 6
Total births per 100,000 population, July 2005 - July 2006 : 40
Total deaths per 100,000 population, July 2005 - July 2006: 141
Limited-service eating places per 100,000 population in 2005 : 31
Household type by relationship:
Households: 16,699- Male householders: 3,153 (874 living alone), Female householders: 3,348 (944 living alone)
2,882 spouses (2,880 opposite-sex spouses), 510 unmarried partners, (505 opposite-sex unmarried partners), 4,591 children (4,262 natural, 88 adopted, 234 stepchildren), 997 grandchildren, 57 brothers or sisters, 33 parents, 16 foster children, 193 other relatives, 443 non-relatives
- In group quarters: 461
Size of family households: 1,892 2-persons, 1,092 3-persons, 806 4-persons, 272 5-persons, 150 6-persons, 89 7-or-more-persons.
Size of nonfamily households: 1,819 1-person, 304 2-persons, 45 3-persons, 10 4-persons, 4 5-persons, 6 7-or-more-persons.
2,184 married couples with children.
1,434 single-parent households (651 men, 783 women).
96.3% of residents of Hill speak English at home.
1.2% of residents speak Spanish at home (100% speak English very well).
1.2% of residents speak other Indo-European language at home (100% speak English very well).
0.2% of residents speak Asian or Pacific Island language at home (44% speak English very well, 56% speak English well).
0.9% of residents speak other language at home (73% speak English very well, 21% speak English well, 5% speak English not well).
In fiscal year 2004:
Federal Government expenditure: $164,676,000 ($10,056 per capita)
Department of Defense expenditure: $1,640,000
Federal direct payments to individuals for retirement and disability: $42,064,000
Federal other direct payments to individuals: $21,795,000
Federal direct payments not to individuals: $36,943,000
Federal grants: $52,877,000
Federal procurement contracts: $1,460,000 ($6,000 Department of Defense)
Federal salaries and wages: $9,538,000 ($162,000 Department of Defense)
Federal Government direct loans: $868,000
Federal guaranteed/insured loans: $12,054,000
Federal Government insurance: $39,728,000
Population change from April 1, 2000 to July 1, 2005:
Births: 1,314| Here: | 81 per 1000 residents |
| State: | 62 per 1000 residents |
Deaths: 766
| Here: | 47 per 1000 residents |
| State: | 47 per 1000 residents |
Net international migration: +11
| Here: | +1 per 1000 residents |
| State: | +2 per 1000 residents |
Net internal migration: -907
| Here: | |
| State: |
Total withdrawal of fresh water for public supply: 1.77 millions of gallons per day (51% from ground, 49% from surface)
| Here: | 6.6 |
| State: | 6.4 |
| Here: | 4.7 |
| State: | 4.2 |

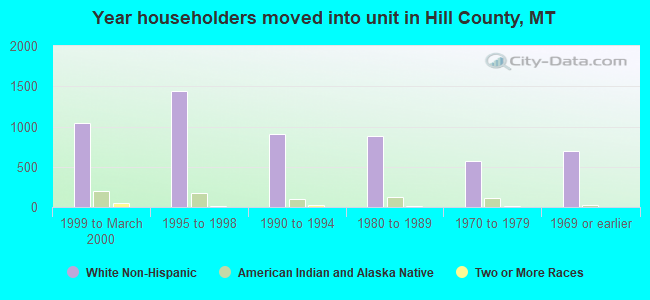
- Year house built in Hill County, Montana
- 02020 or later
- 3632010 to 2019
- 4652000 to 2009
- 3551990 to 1999
- 9081980 to 1989
- 1,7551970 to 1979
- 7091960 to 1969
- 1,2901950 to 1959
- 3891940 to 1949
- 8981939 or earlier
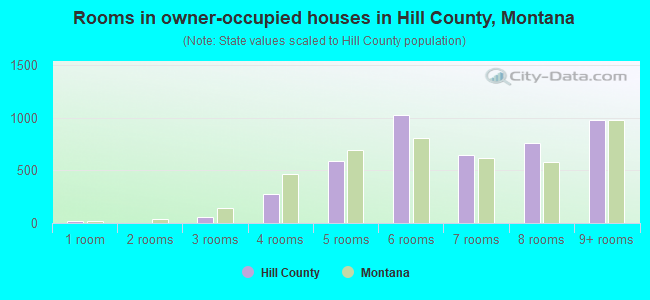
- Rooms in owner-occupied houses in Hill County, Montana
- 121 room
- 232 rooms
- 533 rooms
- 2574 rooms
- 5755 rooms
- 1,0396 rooms
- 7617 rooms
- 6138 rooms
- 9239+ rooms
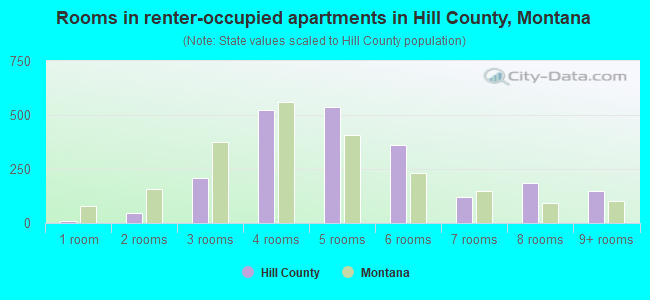
- Rooms in renter-occupied apartments in Hill County, Montana
- 141 room
- 622 rooms
- 1863 rooms
- 7274 rooms
- 5565 rooms
- 2986 rooms
- 1207 rooms
- 1218 rooms
- 1389+ rooms
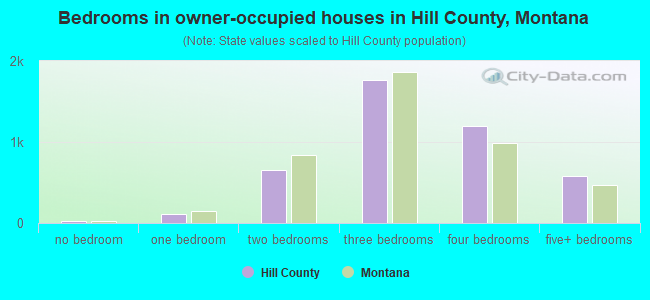
- Bedrooms in owner-occupied houses in Hill County, Montana
- 20no bedroom
- 1221 bedroom
- 6472 bedrooms
- 1,7173 bedrooms
- 1,2344 bedrooms
- 5385+ bedrooms
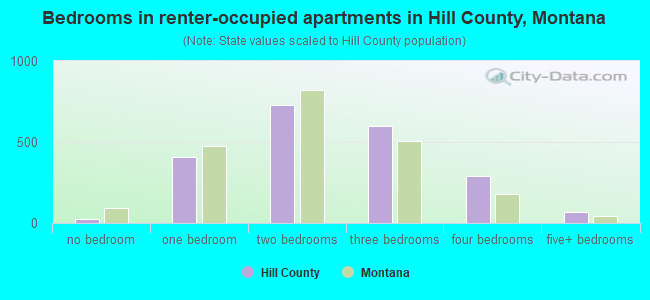
- Bedrooms in renter-occupied apartments in Hill County, Montana
- 35no bedroom
- 4241 bedroom
- 8792 bedrooms
- 6103 bedrooms
- 2144 bedrooms
- 525+ bedrooms
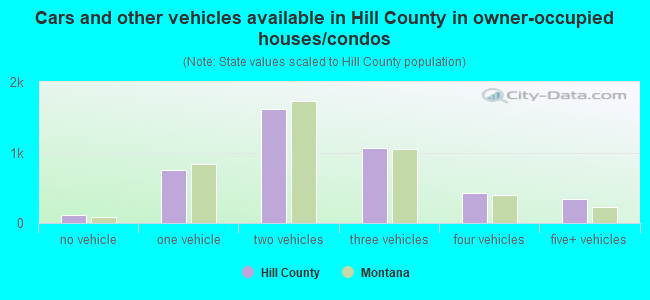
- Cars and other vehicles available in Hill County in owner-occupied houses/condos
- 160no vehicle
- 6511 vehicle
- 1,5712 vehicles
- 1,0233 vehicles
- 4894 vehicles
- 3935+ vehicles
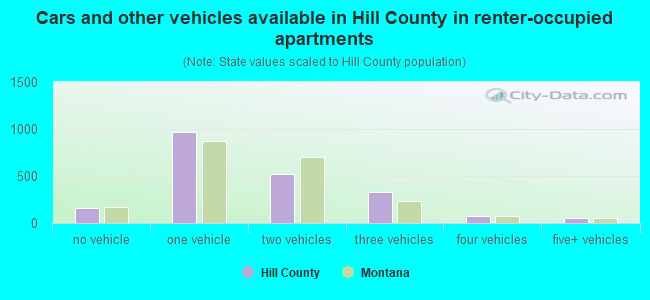
- Cars and other vehicles available in Hill County in renter-occupied apartments
- 177no vehicle
- 1,1871 vehicle
- 5762 vehicles
- 2043 vehicles
- 524 vehicles
- 535+ vehicles
90.3% of Hill County residents lived in the same house 1 years ago.
Out of people who lived in different houses, 32% lived in this county.
Out of people who lived in different counties, 69% lived in Montana.
| Hill County: | 90.3% |
| State average: | 86.7% |
Place of birth for U.S.-born residents:
- This state: 12,695
- Other state: 3,420
- Northeast: 294
- Midwest: 1,011
- South: 396
- West: 1,714
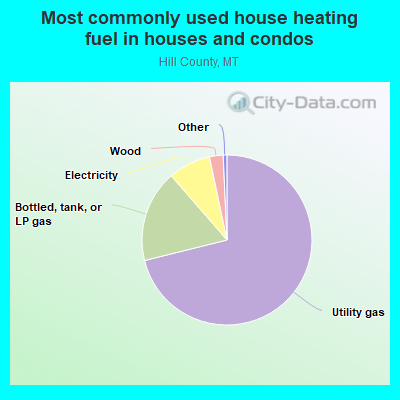
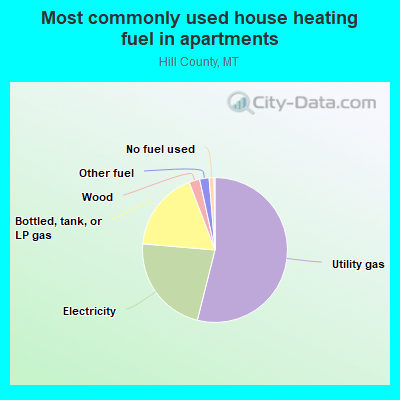
- 70.4%Utility gas
- 17.6%Bottled, tank, or LP gas
- 8.8%Electricity
- 2.5%Wood
- 0.4%Fuel oil, kerosene, etc.
- 0.1%Other fuel
- 0.1%No fuel used
- 57.5%Utility gas
- 24.6%Electricity
- 13.3%Bottled, tank, or LP gas
- 2.1%Other fuel
- 1.5%Wood
- 0.9%No fuel used
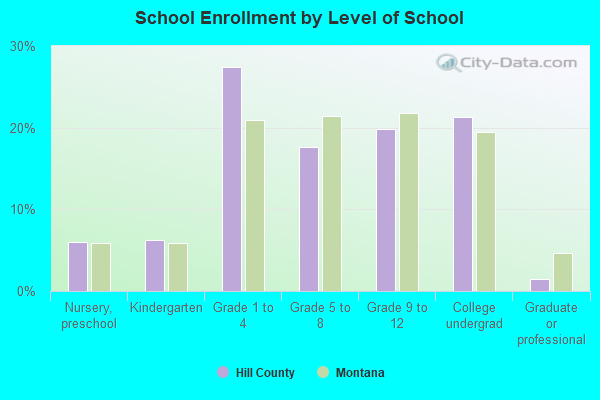
Private vs. public school enrollment:
| Here: | 4.8% |
| Montana: | 15.3% |
| Here: | 2.4% |
| Montana: | 12.2% |
| Here: | 5.4% |
| Montana: | 15.0% |

Hill County government finances - Expenditure in 2020:
- Bond Funds - Cash and Securities: $11,000
Cash and Securities: $9,000
- Charges - Parks and Recreation: $231,000
Parks and Recreation: $215,000
- Construction - Regular Highways: $155,000
Parks and Recreation: $31,000
Correctional Institutions: $16,000
- Current Operations - Regular Highways: $1,430,000
Regular Highways: $1,321,000
Police Protection: $1,140,000
General Public Buildings: $1,000,000
General - Other: $808,000
Solid Waste Management: $800,000
General - Other: $758,000
Judicial and Legal Services: $737,000
Judicial and Legal Services: $713,000
General Public Buildings: $657,000
Central Staff Services: $617,000
Health - Other: $613,000
Central Staff Services: $579,000
Health - Other: $506,000
Financial Administration: $333,000
Financial Administration: $307,000
Correctional Institutions: $276,000
Parks and Recreation: $240,000
Parks and Recreation: $227,000
Correctional Institutions: $150,000
Natural Resources - Other: $57,000
Natural Resources - Other: $33,000
- General - Interest on Debt: $28,000
Interest on Debt: $17,000
- Intergovernmental to Local - Other - Elementary and Secondary Education: $4,157,000
Other - Elementary and Secondary Education: $3,370,000
Other - Solid Waste Management: $818,000
Other - Libraries: $238,000
Other - Libraries: $198,000
Other - Air Transportation: $146,000
Other - Air Transportation: $141,000
Other - Correctional Institutions: $65,000
Other - General - Other: $58,000
Other - General - Other: $51,000
Other - Sewerage: $9,000
Other - Parks and Recreation: $3,000
- Local Intergovernmental - Health and Hospitals: $5,000
- Long Term Debt - Beginning Outstanding - Unspecified Public Purpose: $701,000
Outstanding Unspecified Public Purpose: $668,000
Outstanding Unspecified Public Purpose: $493,000
Beginning Outstanding - Unspecified Public Purpose: $448,000
Issue, Unspecified Public Purpose: $90,000
Retired Unspecified Public Purpose: $46,000
Retired Unspecified Public Purpose: $33,000
- Miscellaneous - General Revenue - Other: $698,000
Royalties: $452,000
General Revenue - Other: $441,000
Royalties: $230,000
Fines and Forfeits: $126,000
Fines and Forfeits: $110,000
Donations From Private Sources: $52,000
Rents: $48,000
Rents: $45,000
Donations From Private Sources: $30,000
Special Assessments: $6,000
- Other Capital Outlay - Regular Highways: $467,000
Regular Highways: $96,000
Health - Other: $55,000
Parks and Recreation: $47,000
Health - Other: $45,000
General Public Building: $41,000
Police Protection: $33,000
Parks and Recreation: $9,000
General Public Building: $9,000
Central Staff Services: $7,000
Judicial and Legal Services: $5,000
- Other Funds - Cash and Securities: $42,562,000
Cash and Securities: $38,171,000
- Sinking Funds - Cash and Securities: $105,000
Cash and Securities: $21,000
- State Intergovernmental - Other: $1,095,000
Other: $1,041,000
General Local Government Support: $132,000
Transit Utilities: $87,000
- Tax - Property: $10,219,000
Property: $9,916,000
Other: $589,000
Other: $563,000
Alcoholic Beverage License: $2,000
Alcoholic Beverage License: $1,000
- Total Salaries and Wages: $4,717,000
: $4,600,000
Hill County government finances - Revenue in 2020:
- Bond Funds - Cash and Securities: $11,000
Cash and Securities: $9,000
- Charges - Parks and Recreation: $231,000
Parks and Recreation: $215,000
- Construction - Regular Highways: $155,000
Parks and Recreation: $31,000
Correctional Institutions: $16,000
- Current Operations - Regular Highways: $1,430,000
Regular Highways: $1,321,000
Police Protection: $1,140,000
General Public Buildings: $1,000,000
General - Other: $808,000
Solid Waste Management: $800,000
General - Other: $758,000
Judicial and Legal Services: $737,000
Judicial and Legal Services: $713,000
General Public Buildings: $657,000
Central Staff Services: $617,000
Health - Other: $613,000
Central Staff Services: $579,000
Health - Other: $506,000
Financial Administration: $333,000
Financial Administration: $307,000
Correctional Institutions: $276,000
Parks and Recreation: $240,000
Parks and Recreation: $227,000
Correctional Institutions: $150,000
Natural Resources - Other: $57,000
Natural Resources - Other: $33,000
- General - Interest on Debt: $28,000
Interest on Debt: $17,000
- Intergovernmental to Local - Other - Elementary and Secondary Education: $4,157,000
Other - Elementary and Secondary Education: $3,370,000
Other - Solid Waste Management: $818,000
Other - Libraries: $238,000
Other - Libraries: $198,000
Other - Air Transportation: $146,000
Other - Air Transportation: $141,000
Other - Correctional Institutions: $65,000
Other - General - Other: $58,000
Other - General - Other: $51,000
Other - Sewerage: $9,000
Other - Parks and Recreation: $3,000
- Local Intergovernmental - Health and Hospitals: $5,000
- Long Term Debt - Beginning Outstanding - Unspecified Public Purpose: $701,000
Outstanding Unspecified Public Purpose: $668,000
Outstanding Unspecified Public Purpose: $493,000
Beginning Outstanding - Unspecified Public Purpose: $448,000
Issue, Unspecified Public Purpose: $90,000
Retired Unspecified Public Purpose: $46,000
Retired Unspecified Public Purpose: $33,000
- Miscellaneous - General Revenue - Other: $698,000
Royalties: $452,000
General Revenue - Other: $441,000
Royalties: $230,000
Fines and Forfeits: $126,000
Fines and Forfeits: $110,000
Donations From Private Sources: $52,000
Rents: $48,000
Rents: $45,000
Donations From Private Sources: $30,000
Special Assessments: $6,000
- Other Capital Outlay - Regular Highways: $467,000
Regular Highways: $96,000
Health - Other: $55,000
Parks and Recreation: $47,000
Health - Other: $45,000
General Public Building: $41,000
Police Protection: $33,000
Parks and Recreation: $9,000
General Public Building: $9,000
Central Staff Services: $7,000
Judicial and Legal Services: $5,000
- Other Funds - Cash and Securities: $42,562,000
Cash and Securities: $38,171,000
- Sinking Funds - Cash and Securities: $105,000
Cash and Securities: $21,000
- State Intergovernmental - Other: $1,095,000
Other: $1,041,000
General Local Government Support: $132,000
Transit Utilities: $87,000
- Tax - Property: $10,219,000
Property: $9,916,000
Other: $589,000
Other: $563,000
Alcoholic Beverage License: $2,000
Alcoholic Beverage License: $1,000
- Total Salaries and Wages: $4,717,000
: $4,600,000
Hill County government finances - Debt in 2020:
- Bond Funds - Cash and Securities: $11,000
Cash and Securities: $9,000
- Charges - Parks and Recreation: $231,000
Parks and Recreation: $215,000
- Construction - Regular Highways: $155,000
Parks and Recreation: $31,000
Correctional Institutions: $16,000
- Current Operations - Regular Highways: $1,430,000
Regular Highways: $1,321,000
Police Protection: $1,140,000
General Public Buildings: $1,000,000
General - Other: $808,000
Solid Waste Management: $800,000
General - Other: $758,000
Judicial and Legal Services: $737,000
Judicial and Legal Services: $713,000
General Public Buildings: $657,000
Central Staff Services: $617,000
Health - Other: $613,000
Central Staff Services: $579,000
Health - Other: $506,000
Financial Administration: $333,000
Financial Administration: $307,000
Correctional Institutions: $276,000
Parks and Recreation: $240,000
Parks and Recreation: $227,000
Correctional Institutions: $150,000
Natural Resources - Other: $57,000
Natural Resources - Other: $33,000
- General - Interest on Debt: $28,000
Interest on Debt: $17,000
- Intergovernmental to Local - Other - Elementary and Secondary Education: $4,157,000
Other - Elementary and Secondary Education: $3,370,000
Other - Solid Waste Management: $818,000
Other - Libraries: $238,000
Other - Libraries: $198,000
Other - Air Transportation: $146,000
Other - Air Transportation: $141,000
Other - Correctional Institutions: $65,000
Other - General - Other: $58,000
Other - General - Other: $51,000
Other - Sewerage: $9,000
Other - Parks and Recreation: $3,000
- Local Intergovernmental - Health and Hospitals: $5,000
- Long Term Debt - Beginning Outstanding - Unspecified Public Purpose: $701,000
Outstanding Unspecified Public Purpose: $668,000
Outstanding Unspecified Public Purpose: $493,000
Beginning Outstanding - Unspecified Public Purpose: $448,000
Issue, Unspecified Public Purpose: $90,000
Retired Unspecified Public Purpose: $46,000
Retired Unspecified Public Purpose: $33,000
- Miscellaneous - General Revenue - Other: $698,000
Royalties: $452,000
General Revenue - Other: $441,000
Royalties: $230,000
Fines and Forfeits: $126,000
Fines and Forfeits: $110,000
Donations From Private Sources: $52,000
Rents: $48,000
Rents: $45,000
Donations From Private Sources: $30,000
Special Assessments: $6,000
- Other Capital Outlay - Regular Highways: $467,000
Regular Highways: $96,000
Health - Other: $55,000
Parks and Recreation: $47,000
Health - Other: $45,000
General Public Building: $41,000
Police Protection: $33,000
Parks and Recreation: $9,000
General Public Building: $9,000
Central Staff Services: $7,000
Judicial and Legal Services: $5,000
- Other Funds - Cash and Securities: $42,562,000
Cash and Securities: $38,171,000
- Sinking Funds - Cash and Securities: $105,000
Cash and Securities: $21,000
- State Intergovernmental - Other: $1,095,000
Other: $1,041,000
General Local Government Support: $132,000
Transit Utilities: $87,000
- Tax - Property: $10,219,000
Property: $9,916,000
Other: $589,000
Other: $563,000
Alcoholic Beverage License: $2,000
Alcoholic Beverage License: $1,000
- Total Salaries and Wages: $4,717,000
: $4,600,000
Hill County government finances - Cash and Securities in 2020:
- Bond Funds - Cash and Securities: $11,000
Cash and Securities: $9,000
- Charges - Parks and Recreation: $231,000
Parks and Recreation: $215,000
- Construction - Regular Highways: $155,000
Parks and Recreation: $31,000
Correctional Institutions: $16,000
- Current Operations - Regular Highways: $1,430,000
Regular Highways: $1,321,000
Police Protection: $1,140,000
General Public Buildings: $1,000,000
General - Other: $808,000
Solid Waste Management: $800,000
General - Other: $758,000
Judicial and Legal Services: $737,000
Judicial and Legal Services: $713,000
General Public Buildings: $657,000
Central Staff Services: $617,000
Health - Other: $613,000
Central Staff Services: $579,000
Health - Other: $506,000
Financial Administration: $333,000
Financial Administration: $307,000
Correctional Institutions: $276,000
Parks and Recreation: $240,000
Parks and Recreation: $227,000
Correctional Institutions: $150,000
Natural Resources - Other: $57,000
Natural Resources - Other: $33,000
- General - Interest on Debt: $28,000
Interest on Debt: $17,000
- Intergovernmental to Local - Other - Elementary and Secondary Education: $4,157,000
Other - Elementary and Secondary Education: $3,370,000
Other - Solid Waste Management: $818,000
Other - Libraries: $238,000
Other - Libraries: $198,000
Other - Air Transportation: $146,000
Other - Air Transportation: $141,000
Other - Correctional Institutions: $65,000
Other - General - Other: $58,000
Other - General - Other: $51,000
Other - Sewerage: $9,000
Other - Parks and Recreation: $3,000
- Local Intergovernmental - Health and Hospitals: $5,000
- Long Term Debt - Beginning Outstanding - Unspecified Public Purpose: $701,000
Outstanding Unspecified Public Purpose: $668,000
Outstanding Unspecified Public Purpose: $493,000
Beginning Outstanding - Unspecified Public Purpose: $448,000
Issue, Unspecified Public Purpose: $90,000
Retired Unspecified Public Purpose: $46,000
Retired Unspecified Public Purpose: $33,000
- Miscellaneous - General Revenue - Other: $698,000
Royalties: $452,000
General Revenue - Other: $441,000
Royalties: $230,000
Fines and Forfeits: $126,000
Fines and Forfeits: $110,000
Donations From Private Sources: $52,000
Rents: $48,000
Rents: $45,000
Donations From Private Sources: $30,000
Special Assessments: $6,000
- Other Capital Outlay - Regular Highways: $467,000
Regular Highways: $96,000
Health - Other: $55,000
Parks and Recreation: $47,000
Health - Other: $45,000
General Public Building: $41,000
Police Protection: $33,000
Parks and Recreation: $9,000
General Public Building: $9,000
Central Staff Services: $7,000
Judicial and Legal Services: $5,000
- Other Funds - Cash and Securities: $42,562,000
Cash and Securities: $38,171,000
- Sinking Funds - Cash and Securities: $105,000
Cash and Securities: $21,000
- State Intergovernmental - Other: $1,095,000
Other: $1,041,000
General Local Government Support: $132,000
Transit Utilities: $87,000
- Tax - Property: $10,219,000
Property: $9,916,000
Other: $589,000
Other: $563,000
Alcoholic Beverage License: $2,000
Alcoholic Beverage License: $1,000
- Total Salaries and Wages: $4,717,000
: $4,600,000
Supplemental Security Income (SSI) in 2006:
- Total number of recipients: 375
- Number of aged recipients: 27
- Number of blind and disabled recipients: 348
- Number of recipients under 18: 51
- Number of recipients between 18 and 64: 261
- Number of recipients older than 64: 63
- Number of recipients also receiving OASDI: 137
- Amount of payments (thousands of dollars): 171
| Most common first names in Hill County, MT among deceased individuals | ||
| Name | Count | Lived (average) |
|---|---|---|
| John | 107 | 75.5 years |
| Mary | 99 | 79.3 years |
| William | 79 | 75.5 years |
| Robert | 60 | 70.8 years |
| George | 59 | 77.9 years |
| James | 49 | 68.4 years |
| Joseph | 44 | 71.6 years |
| Margaret | 44 | 82.7 years |
| Charles | 36 | 72.9 years |
| Helen | 36 | 78.0 years |
| Most common last names in Hill County, MT among deceased individuals | ||
| Last name | Count | Lived (average) |
|---|---|---|
| Anderson | 46 | 77.4 years |
| Johnson | 44 | 74.9 years |
| Nelson | 32 | 74.6 years |
| Larson | 25 | 74.0 years |
| Denny | 24 | 70.6 years |
| Wilson | 23 | 79.2 years |
| Miller | 22 | 83.6 years |
| Olson | 20 | 77.3 years |
| Smith | 19 | 67.2 years |
| Peterson | 19 | 71.0 years |
| Businesses in Hill County, MT | ||||
| Name | Count | Name | Count | |
|---|---|---|---|---|
| AmericInn | 1 | Maurices | 1 | |
| Best Western | 1 | New Balance | 1 | |
| Budget Car Rental | 1 | Nike | 2 | |
| Carson Pirie Scott | 1 | RadioShack | 1 | |
| Chevrolet | 1 | Sears | 1 | |
| Dairy Queen | 1 | Super 8 | 1 | |
| FedEx | 1 | The Athlete's Foot | 1 | |
| Ford | 1 | Toyota | 1 | |
| H&R Block | 1 | U-Haul | 1 | |
| Kmart | 1 | UPS | 3 | |
| La-Z-Boy | 1 | Walmart | 1 | |
| Lane Furniture | 2 | Wendy's | 1 | |
| MasterBrand Cabinets | 3 | |||
Hill County on our top lists:
- #55 on the list of "Top 101 counties with highest percentage of residents voting for 3rd party candidates in the 2012 Presidential Election"