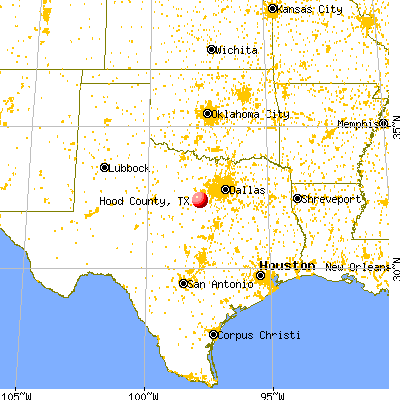
Hood County, Texas (TX)
County owner-occupied free and clear houses and condos in 2010: 6,415
County owner-occupied houses and condos in 2000: 13,134
Renter-occupied apartments: 4,590 (it was 3,042 in 2000)
| % of renters here: | 19% |
| State: | 36% |
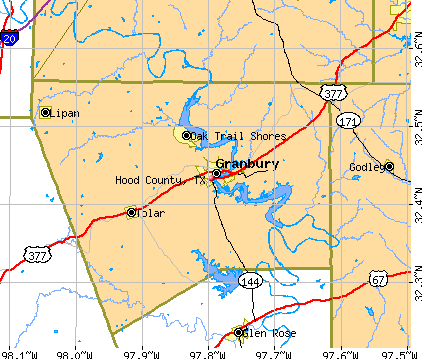
Land area: 422 sq. mi.
Water area: 15.2 sq. mi.
Population density: 157 people per square mile (average).
Industries providing employment: Educational, health and social services (20.6%), Retail trade (14.0%), Professional, scientific, management, administrative, and waste management services (10.5%).
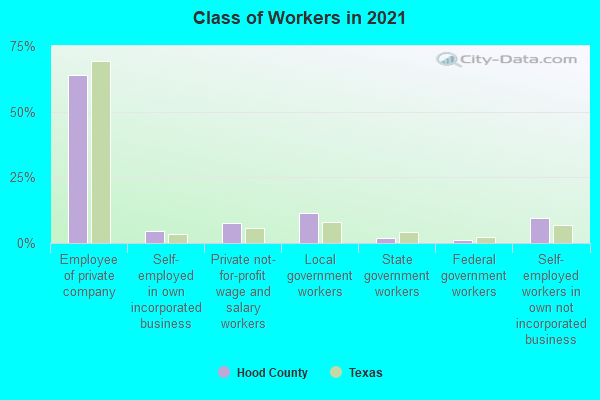
Type of workers:
- Private wage or salary: 76%
- Government: 14%
- Self-employed, not incorporated: 9%
- Unpaid family work: 0%
- OSM Map
- General Map
- Google Map
- MSN Map

- 53,97781.3%White Non-Hispanic Alone
- 9,14213.8%Hispanic or Latino
- 1,4662.2%Two or more races
- 6901.0%Asian alone
- 5960.9%Black Non-Hispanic Alone
- 3670.6%American Indian and Alaska Native alone
- 1350.2%Some other race alone

| Median resident age: | 46.0 years |
| Texas median age: | 35.6 years |
| Males: 32,324 | |
| Females: 34,049 |

 | When will Sherman/Denison Be In DFW Metro? (66 replies) |
| Looks like the Metroplex is about to officially reach Oklahoma... (31 replies) |
| How much bigger will DFW population be? (57 replies) |
| Texas County Courthouses (13 replies) |
| Granbury, TX, possible retirement (7 replies) |
| New County Population Estimates from the Census Bureau for Jluy 1, 2016 posted this morning about 9 A. M. (13 replies) |
| Hood County: | 2.0 people |
| Texas: | 3 people |
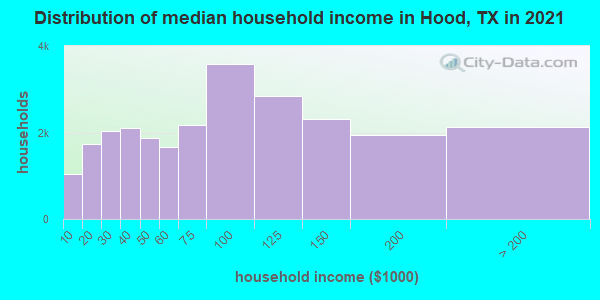
Estimated median household income in 2022: $69,462 ($43,668 in 1999)
| This county: | $69,462 |
| Texas: | $72,284 |
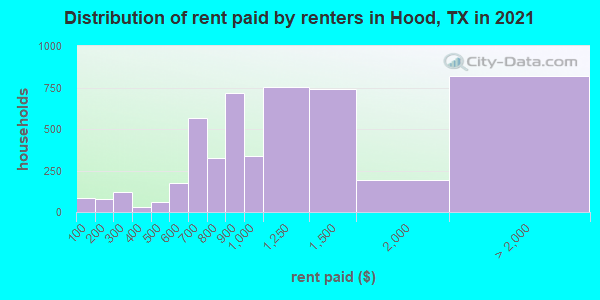
Median contract rent in 2022 for apartments: $1,221 (lower quartile is $782, upper quartile is $1,779)
| This county: | $1221 |
| State: | $1117 |
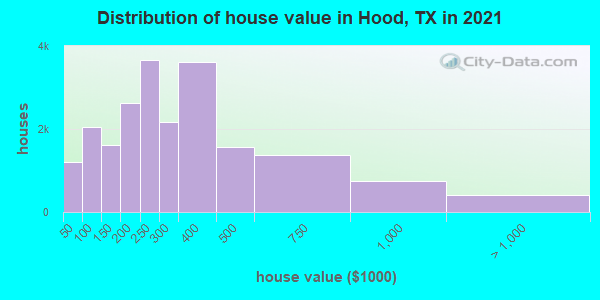
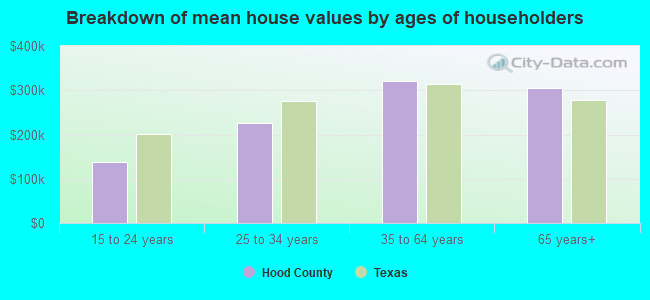
Estimated median house or condo value in 2022: $291,000 (it was $88,800 in 2000)
| Hood: | $291,000 |
| Texas: | $275,400 |
Median monthly housing costs for homes and condos with a mortgage: $1,799
Median monthly housing costs for units without a mortgage: $585
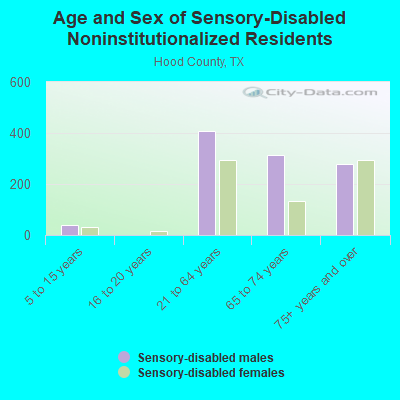
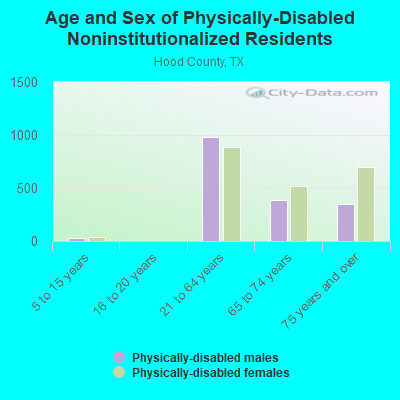
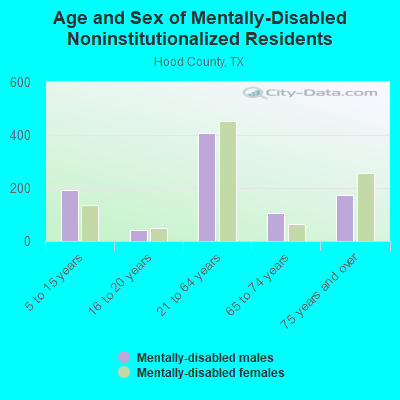
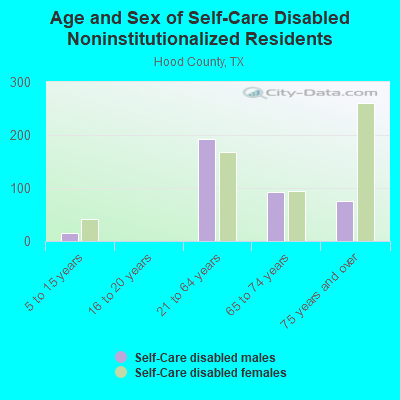
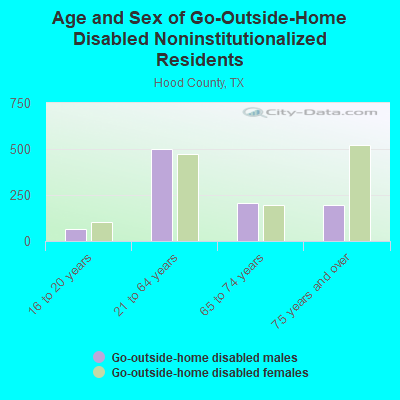
Institutionalized population: 672
Crime in 2021 (reported by the sheriff's office or county police, not the county total):
- Murders: 0
- Rapes: 8
- Robberies: 4
- Assaults: 41
- Burglaries: 66
- Thefts: 179
- Auto thefts: 34
Crime in 2020 (reported by the sheriff's office or county police, not the county total):
- Murders: 2
- Rapes: 14
- Robberies: 0
- Assaults: 59
- Burglaries: 81
- Thefts: 246
- Auto thefts: 30
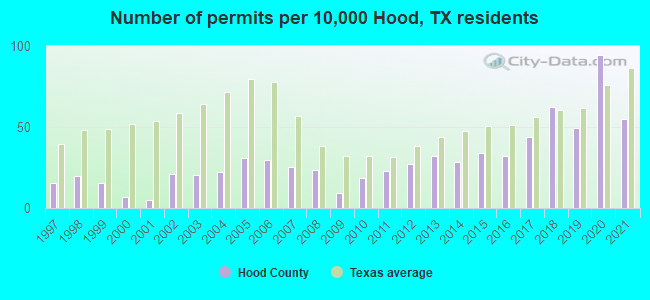
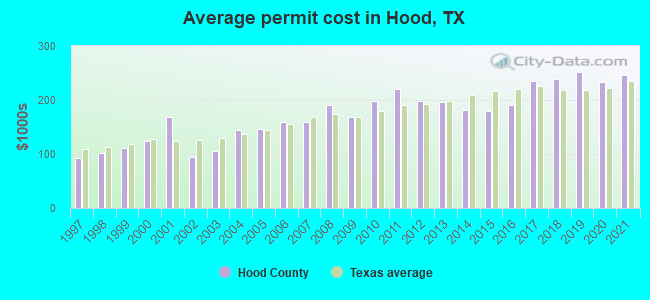
Single-family new house construction building permits:
- 2022: 119 buildings, average cost: $256,200
- 2021: 227 buildings, average cost: $246,200
- 2020: 389 buildings, average cost: $233,700
- 2019: 202 buildings, average cost: $251,800
- 2018: 256 buildings, average cost: $237,900
- 2017: 180 buildings, average cost: $235,300
- 2016: 132 buildings, average cost: $190,900
- 2015: 140 buildings, average cost: $180,100
- 2014: 117 buildings, average cost: $180,900
- 2013: 133 buildings, average cost: $197,100
- 2012: 112 buildings, average cost: $198,700
- 2011: 94 buildings, average cost: $221,300
- 2010: 76 buildings, average cost: $198,900
- 2009: 37 buildings, average cost: $168,900
- 2008: 97 buildings, average cost: $190,400
- 2007: 105 buildings, average cost: $160,200
- 2006: 121 buildings, average cost: $160,400
- 2005: 126 buildings, average cost: $146,400
- 2004: 92 buildings, average cost: $145,400
- 2003: 83 buildings, average cost: $106,400
- 2002: 87 buildings, average cost: $95,300
- 2001: 20 buildings, average cost: $167,800
- 2000: 29 buildings, average cost: $125,200
- 1999: 64 buildings, average cost: $111,300
- 1998: 80 buildings, average cost: $102,400
- 1997: 63 buildings, average cost: $92,800
Median real estate property taxes paid for housing units with mortgages in 2022: $3,774 (1.1%)
Median real estate property taxes paid for housing units with no mortgage in 2022: $2,274 (0.9%)
| Hood County: | 10.4% |
| Texas: | 14.0% |
Median age of residents in 2022: 46.0 years old
(Males: 44.9 years old, Females: 49.3 years old)
(Median age for: White residents: 51.2 years old, Black residents: 42.8 years old, American Indian residents: 63.3 years old, Asian residents: 61.1 years old, Hispanic or Latino residents: 30.5 years old, Other race residents: 36.3 years old)
Fair market rent in 2006 for a 1-bedroom apartment in Hood County is $487 a month.
Fair market rent for a 2-bedroom apartment is $542 a month.
Fair market rent for a 3-bedroom apartment is $716 a month.
Cities in this county include: Granbury, Pecan Plantation, DeCordova, Oak Trail Shores, Canyon Creek, Cresson, Tolar, Lipan, Brazos Bend.
2023 air pollution in Hood County:
Ozone (1-hour): 0.032 ppm (standard limit: 0.12 ppm). Near U.S. average.
Notable locations in this county outside city limits:
Notable locations in Hood County: Riverview Golf Club (A), Fishermans Paradise (B), Meredith Hart House (C), Bono Volunteer Fire Department (D), Blue Water Oaks Volunteer Fire Department (E), Liberty Chapel Volunteer Fire Department (F), Mid North Johnson County Fire Department (G), Lillian Volunteer Fire Department (H), CareFlite - Johnson County Station 2 (I). Display/hide their locations on the map
Churches in Hood County include: Pleasant Point Church (A), Prices Chapel (B), Thompson Church (C), Union Hill Church (D), Watts Chapel (E), Willow Springs Church (F), Barnesville Church (G), Bethany Church (H), Bethesda Church (I). Display/hide their locations on the map
Cemeteries: Lone Cottonwood Cemetery (1), Antioch Rest Cemetery (2), Morrow Cemetery (3), Baker Lain Cemetery (4), Barnesville Cemetery (5), Boatright Cemetery (6), Buchanan Cemetery (7). Display/hide their locations on the map
Reservoirs: Buck Ranch Reservoir Number 4 (A), Cleburne State Park Lake (B), Soil Conservation Service Site 38 Reservoir (C), Soil Conservation Service Site 61a Reservoir (D), Soil Conservation Service Site 33 Reservoir (E), Soil Conservation Service Site 37 Reservoir (F), Soil Conservation Service Site 36 Reservoir (G), Soil Conservation Service Site 34 Reservoir (H). Display/hide their locations on the map
Streams, rivers, and creeks: Wilson Creek (A), Wilson Branch (B), West Nolan Creek (C), West Fork Nolan River (D), Wallace Branch (E), Valley Branch (F), Turkey Creek (G), Rock Tank Creek (H), Reece Branch (I). Display/hide their locations on the map
Parks in Hood County include: Ham Creek Park (1), Cleburne State Park (2). Display/hide their locations on the map
Neighboring counties: East Carroll Parish, Louisiana  , Candler County, Georgia , Sumter County, Alabama , Smith County, Mississippi , Wilcox County, Alabama , Johnson County , Tattnall County, Georgia .
| Here: | 3.1% |
| Texas: | 3.5% |
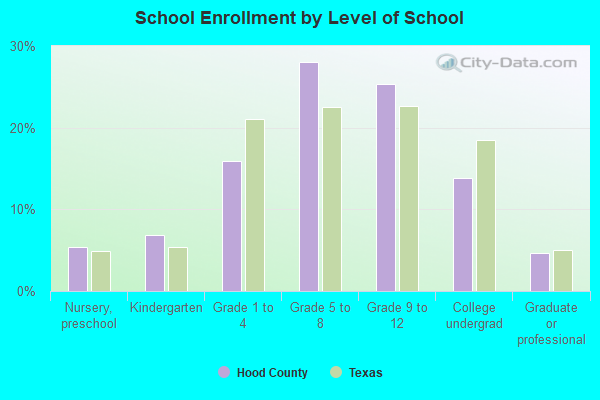
Current college students: 1,234
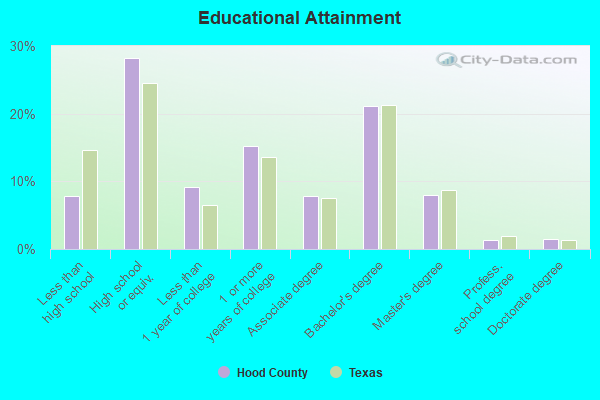
People 25 years of age or older with a high school degree or higher: 94.2%
People 25 years of age or older with a bachelor's degree or higher: 33.0%
Number of foreign born residents: 3,952 (49.7% naturalized citizens)
| Hood County: | 6.0% |
| Whole state: | 17.2% |

- Year of entry for the foreign-born population
- 8052010 or later
- 1992000 to 2009
- 8781990 to 1999
- 3331980 to 1989
- 2151970 to 1979
- 195Before 1970
Mean travel time to work (commute): ) minutes
Percentage of county residents living and working in this county: 99.4%
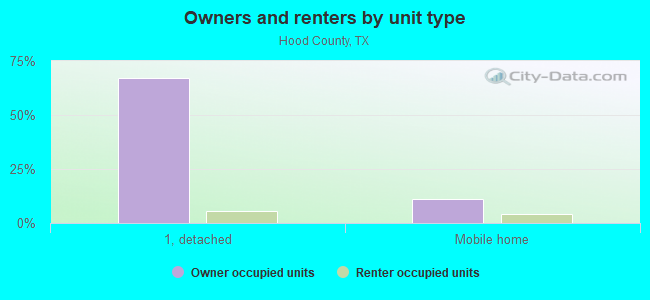
Housing units in structures:
- One, detached: 21,167
- One, attached: 1,006
- Two: 173
- 3 or 4: 287
- 5 to 9: 423
- 10 to 19: 364
- 20 to 49: 736
- 50 or more: 693
- Mobile homes: 4,249
- Boats, RVs, vans, etc.: 140
Housing units in Hood County with a mortgage: 11,115 (293 second mortgage, 0 home equity loan, 293 both second mortgage and home equity loan)
Houses without a mortgage: 171
| Here: | 6.0% with mortgage |
| State: | 98.4% with mortgage |
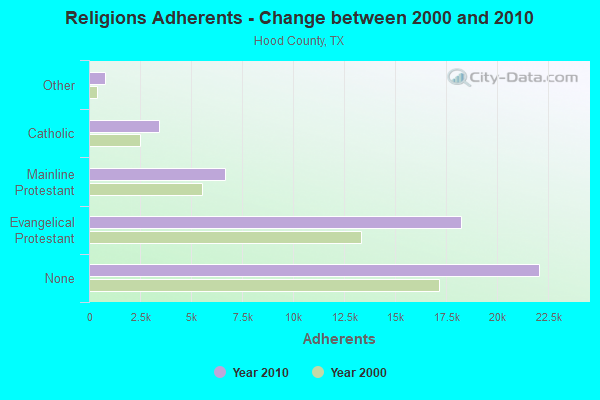
Religion statistics for Hood County
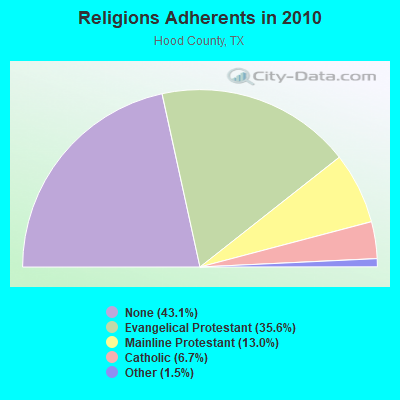
| Religion | Adherents | Congregations |
|---|---|---|
| Evangelical Protestant | 18,218 | 52 |
| Mainline Protestant | 6,650 | 10 |
| Catholic | 3,450 | 1 |
| Other | 789 | 4 |
| None | 22,075 | - |
Source: Clifford Grammich, Kirk Hadaway, Richard Houseal, Dale E.Jones, Alexei Krindatch, Richie Stanley and Richard H.Taylor. 2012. 2010 U.S.Religion Census: Religious Congregations & Membership Study. Association of Statisticians of American Religious Bodies. Jones, Dale E., et al. 2002. Congregations and Membership in the United States 2000. Nashville, TN: Glenmary Research Center.
Food Environment Statistics:
| Hood County: | 2.45 / 10,000 pop. |
| State: | 1.47 / 10,000 pop. |
| Here: | 0.20 / 10,000 pop. |
| Texas: | 0.14 / 10,000 pop. |
| This county: | 0.41 / 10,000 pop. |
| Texas: | 1.11 / 10,000 pop. |
| Hood County: | 7.14 / 10,000 pop. |
| Texas: | 3.95 / 10,000 pop. |
| This county: | 6.53 / 10,000 pop. |
| State: | 6.13 / 10,000 pop. |
| Hood County: | 10.8% |
| Texas: | 8.9% |
| Hood County: | 26.2% |
| State: | 26.6% |
| Here: | 16.0% |
| State: | 15.7% |
Agriculture in Hood County:
Average size of farms: 216 acresAverage value of agricultural products sold per farm: $23,240
Average value of crops sold per acre for harvested cropland: $148.92
The value of livestock, poultry, and their products as a percentage of the total market value of agricultural products sold: 81.02%
Average total farm production expenses per farm: $25,046
Harvested cropland as a percentage of land in farms: 13.70%
Irrigated harvested cropland as a percentage of land in farms: 12.06%
Average market value of all machinery and equipment per farm: $36,330
The percentage of farms operated by a family or individual: 95.08%
Average age of principal farm operators: 57 years
Average number of cattle and calves per 100 acres of all land in farms: 14.87
All wheat for grain: 380 harvested acres
Vegetables: 27 harvested acres
Land in orchards: 2,961 acres
Tornado activity:
Hood County historical area-adjusted tornado activity is significantly below Texas state average. It is 480659.7 times below overall U.S. average.Tornadoes in this county have caused 14 injuries recorded between 1950 and 2004.
On 4/23/1973, a category 3 (max. wind speeds 158-206 mph) tornado injured 3 people
Earthquake activity:
Hood County-area historical earthquake activity is significantly above Texas state average. It is 425% greater than the overall U.S. average.On 11/6/2011 at 03:53:10, a magnitude 5.7 (5.7 MW, Depth: 3.2 mi, Class: Moderate, Intensity: VI - VII) earthquake occurred 222.4 miles away from Hood County center
On 6/16/1978 at 11:46:54, a magnitude 5.3 (4.4 MB, 4.6 UK, 5.3 ML) earthquake occurred 177.7 miles away from the county center
On 9/3/2016 at 12:02:44, a magnitude 5.8 (5.8 MW, Depth: 3.5 mi) earthquake occurred 280.6 miles away from the county center
On 4/14/1995 at 00:32:56, a magnitude 5.7 (5.6 MB, 5.7 MS, 5.7 MW, Depth: 11.1 mi) earthquake occurred 361.1 miles away from the county center
On 5/7/2015 at 22:58:05, a magnitude 4.0 (4.0 MW, Depth: 1.6 mi, Class: Light, Intensity: IV - V) earthquake occurred 40.7 miles away from Hood County center
On 5/17/2012 at 08:12:00, a magnitude 4.8 (4.8 MW, Depth: 3.1 mi) earthquake occurred 203.7 miles away from the county center
Magnitude types: body-wave magnitude (MB), local magnitude (ML), surface-wave magnitude (MS), moment magnitude (MW)
Most recent natural disasters:
- Texas Covid-19 Pandemic, Incident Period: January 20, 2020, FEMA Id: 4485, Natural disaster type: Other
- Texas Severe Storms and Flooding, Incident Period: May 22, 2016 to June 24, 2016, Major Disaster (Presidential) Declared DR-4272: June 11, 2016, FEMA Id: 4272, Natural disaster type: Storm, Flood
- Texas Severe Storms, Tornadoes, and Flooding, Incident Period: March 07, 2016 to March 29, 2016, Major Disaster (Presidential) Declared DR-4266: March 19, 2016, FEMA Id: 4266, Natural disaster type: Storm, Tornado, Flood
- Texas Severe Storms, Tornadoes, Straight-line Winds, and Flooding, Incident Period: May 04, 2015 to June 23, 2015, Major Disaster (Presidential) Declared DR-4223: May 29, 2015, FEMA Id: 4223, Natural disaster type: Storm, Tornado, Flood, Wind
- Texas Wildfires, Incident Period: March 14, 2008 to September 01, 2008, Emergency Declared EM-3284: March 14, 2008, FEMA Id: 3284, Natural disaster type: Fire
- Texas Severe Storms, Tornadoes, and Flooding, Incident Period: June 16, 2007 to August 03, 2007, Major Disaster (Presidential) Declared DR-1709: June 29, 2007, FEMA Id: 1709, Natural disaster type: Storm, Tornado, Flood
- Texas Extreme Wildfire Threat, Incident Period: November 27, 2005 to May 14, 2006, Major Disaster (Presidential) Declared DR-1624: January 11, 2006, FEMA Id: 1624, Natural disaster type: Fire
- Texas Hurricane Rita, Incident Period: September 23, 2005 to October 14, 2005, Major Disaster (Presidential) Declared DR-1606: September 24, 2005, FEMA Id: 1606, Natural disaster type: Hurricane
- Texas Hurricane Rita, Incident Period: September 20, 2005 to October 14, 2005, Emergency Declared EM-3261: September 21, 2005, FEMA Id: 3261, Natural disaster type: Hurricane
- Texas Hurricane Katrina, Incident Period: August 29, 2005 to October 01, 2005, Emergency Declared EM-3216: September 02, 2005, FEMA Id: 3216, Natural disaster type: Hurricane
- 6 other natural disasters have been reported since 1953.
The number of natural disasters in Hood County (16) is near the US average (15).
Major Disasters (Presidential) Declared: 9
Emergencies Declared: 6
Causes of natural disasters: Storms: 7, Floods: 6, Tornadoes: 5, Fires: 4, Hurricanes: 3, Wind: 1, Other: 2 (Note: some incidents may be assigned to more than one category).
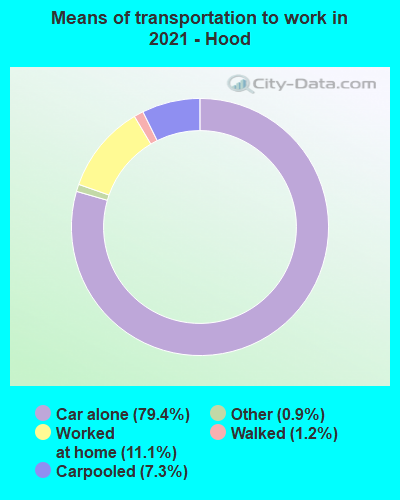
Means of transportation to work:
- Drove a car alone: 14,566 (71.8%)
- Carpooled: 1,648 (8.1%)
- Taxicab, motorcycle, or other means: 293 (1.4%)
- Walked: 311 (1.5%)
- Worked at home: 3,644 (18.0%)
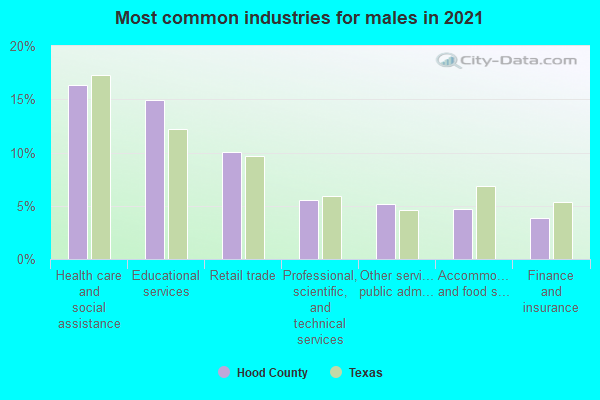
- Health care and social assistance (16%)
- Retail trade (12%)
- Educational services (9%)
- Public administration (7%)
- Professional, scientific, and technical services (6%)
- Manufacturing (5%)
- Transportation and warehousing (5%)

- Health care and social assistance (19%)
- Retail trade (14%)
- Educational services (11%)
- Public administration (9%)
- Professional, scientific, and technical services (7%)
- Manufacturing (6%)
- Transportation and warehousing (6%)
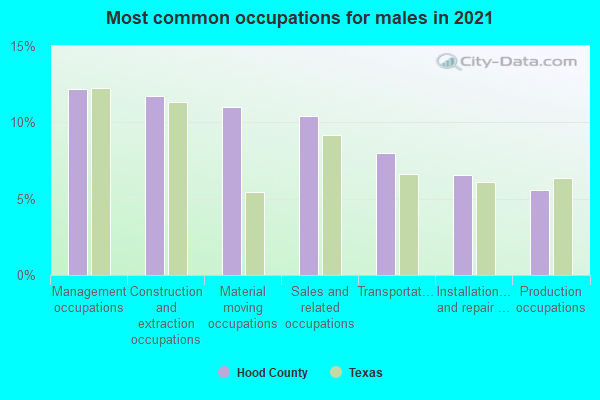
- Management occupations (13%)
- Sales and related occupations (11%)
- Construction and extraction occupations (10%)
- Transportation occupations (9%)
- Production occupations (9%)
- Business and financial operations occupations (7%)
- Building and grounds cleaning and maintenance occupations (4%)
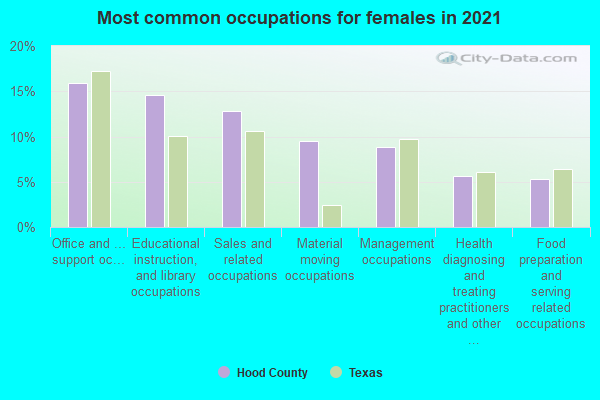
- Sales and related occupations (15%)
- Office and administrative support occupations (14%)
- Management occupations (14%)
- Educational instruction, and library occupations (9%)
- Health technologists and technicians (8%)
- Food preparation and serving related occupations (5%)
- Health diagnosing and treating practitioners and other technical occupations (5%)
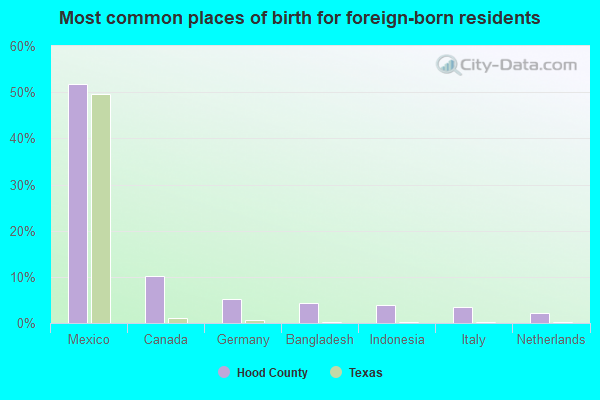
- Mexico (56%)
- Canada (6%)
- Russia (4%)
- Nepal (4%)
- Philippines (3%)
- Italy (3%)
- Germany (2%)
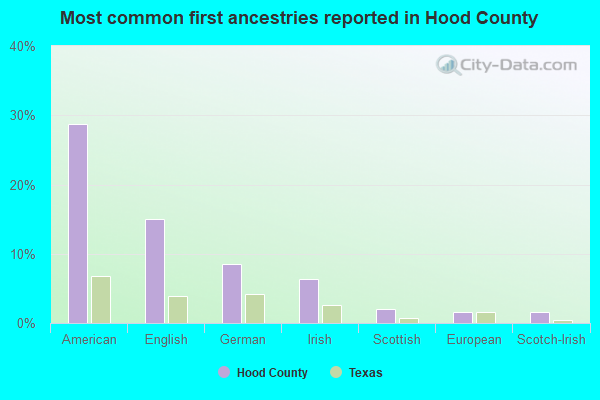
- American (26%)
- English (16%)
- German (9%)
- Irish (6%)
- Scottish (2%)
- European (2%)
- Scotch-Irish (2%)
People in group quarters in Hood County, Texas in 2010:
- 360 people in nursing facilities/skilled-nursing facilities
- 185 people in local jails and other municipal confinement facilities
- 67 people in correctional facilities intended for juveniles
- 60 people in in-patient hospice facilities
- 27 people in group homes intended for adults
- 2 people in workers' group living quarters and job corps centers
People in group quarters in Hood County, Texas in 2000:
- 166 people in other noninstitutional group quarters
- 165 people in nursing homes
- 133 people in local jails and other confinement facilities (including police lockups)
- 118 people in homes for abused, dependent, and neglected children
- 16 people in homes for the mentally retarded
- 3 people in other group homes
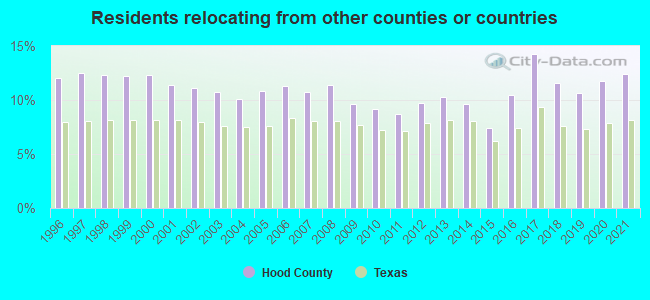
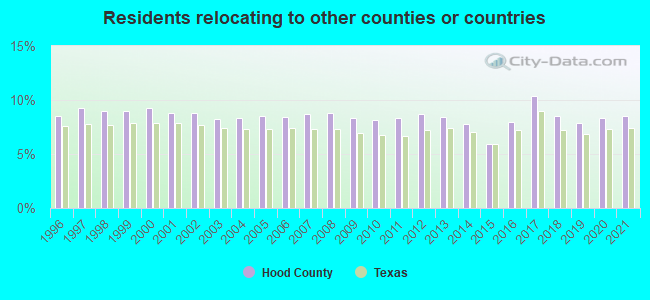
12.39% of this county's 2021 resident taxpayers lived in other counties in 2020 ($85,953 average adjusted gross income)
| Here: | 12.39% |
| Texas average: | 8.12% |
10 or fewer of this county's residents moved from foreign countries.
8.97% relocated from other counties in Texas ($61,673 average AGI)
3.43% relocated from other states ($24,279 average AGI)
Hood County: 3.43% Texas average: 2.83%
Top counties from which taxpayers relocated into this county between 2020 and 2021:
| from Tarrant County, TX | |
| from Parker County, TX | |
| from Johnson County, TX | |
| from Dallas County, TX | |
| from Erath County, TX | |
| from Denton County, TX | |
| from Collin County, TX |
8.52% of this county's 2020 resident taxpayers moved to other counties in 2021 ($64,172 average adjusted gross income)
| Here: | 8.52% |
| Texas average: | 7.40% |
10 or fewer of this county's residents moved to foreign countries.
6.70% relocated to other counties in Texas ($50,047 average AGI)
1.82% relocated to other states ($14,125 average AGI)
Hood County: 1.82% Texas average: 2.08%
Top counties to which taxpayers relocated from this county between 2020 and 2021:
| to Tarrant County, TX | |
| to Parker County, TX | |
| to Johnson County, TX | |
| to Erath County, TX | |
| to Dallas County, TX | |
| to Somervell County, TX | |
| to Denton County, TX |
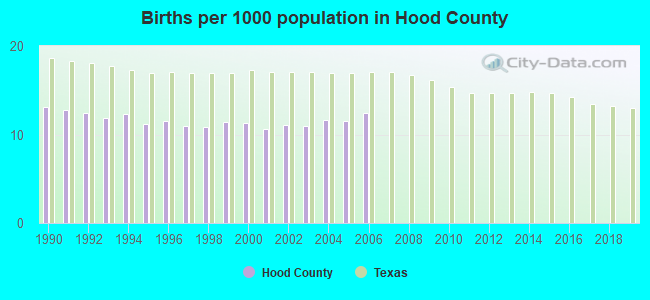
Births per 1000 population from 1990 to 1999: 11.8
Births per 1000 population from 2000 to 2006: 11.4
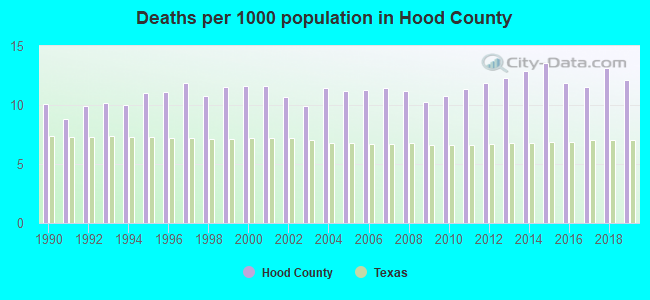
Deaths per 1000 population from 1990 to 1999: 10.5
Deaths per 1000 population from 2000 to 2009: 11.1
Deaths per 1000 population from 2010 to 2020: 12.3
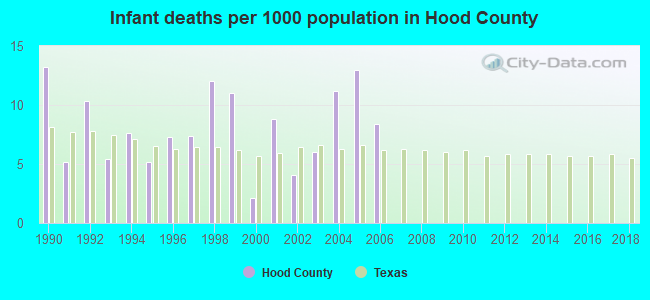
Infant deaths per 1000 live births from 1990 to 1999: 8.5
Infant deaths per 1000 live births from 2000 to 2006: 7.7
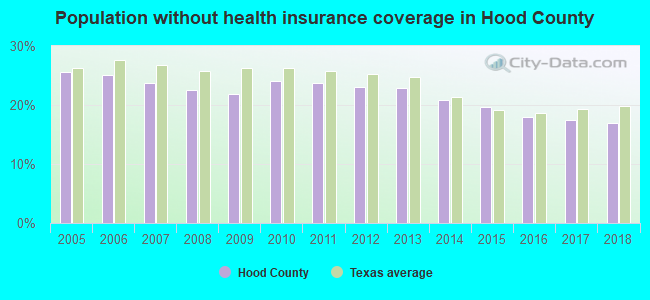
Persons under 19 years old without health insurance coverage in 2018: 10.3%


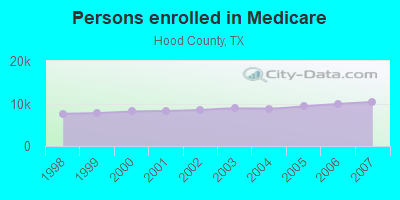
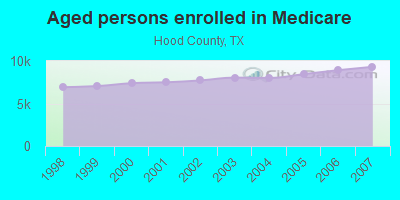
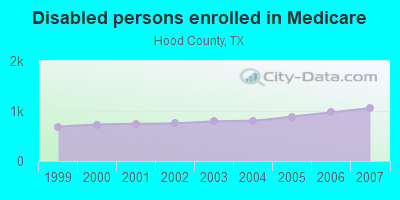
Persons enrolled in hospital insurance and/or supplemental medical insurance (Medicare) in July 1, 2007: 10,372 (9,314 aged, 1,058 disabled)
Children under 18 without health insurance coverage in 2007: 1,796 (16%)
Most common underlying causes of death in Hood County, Texas in 1999 - 2019:
- Acute myocardial infarction, unspecified (895)
- Bronchus or lung, unspecified - Malignant neoplasms (857)
- Alzheimer disease, unspecified (842)
- Chronic obstructive pulmonary disease, unspecified (703)
- Atherosclerotic heart disease (668)
- Stroke, not specified as haemorrhage or infarction (332)
- Unspecified dementia (317)
- Congestive heart failure (262)
- Colon, unspecified - Malignant neoplasms (140)
- Parkinson disease (100)
Population without health insurance coverage in 2000: 15%
Children under 18 without health insurance coverage in 2000: 15%
Short term general hospital admissions per 100,000 population in 2004: 4,272
Short term general hospital beds per 100,000 population in 2004: 82
Emergency room visits per 100,000 population in 2004: 27,678
General practice office based MDs per 100,000 population in 2005: 1,202
Medical specialist MDs per 100,000 population in 2005: 1,200
Dentists per 100,000 population in 1998: 4
Total births per 100,000 population, July 2005 - July 2006 : 30
Total deaths per 100,000 population, July 2005 - July 2006: 77
Limited-service eating places per 100,000 population in 2005 : 17
Suicides per 1,000,000 population from 2000 to 2006: 140.5. This is more than state average.
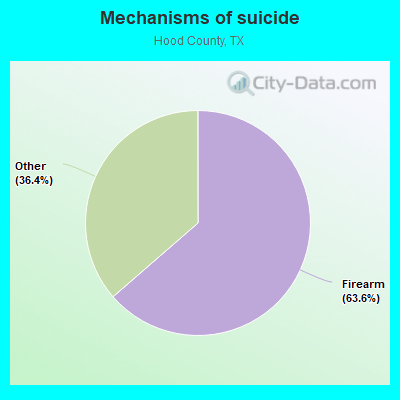
- Firearm - 89.4
- Other - 51.1
Household type by relationship:
Households: 66,373- Male householders: 13,611 (2,340 living alone), Female householders: 12,089 (3,560 living alone)
14,799 spouses (14,639 opposite-sex spouses), 1,099 unmarried partners, (1,099 opposite-sex unmarried partners), 17,653 children (15,357 natural, 1,570 adopted, 726 stepchildren), 2,853 grandchildren, 867 brothers or sisters, 554 parents, 90 foster children, 664 other relatives, 1,191 non-relatives
- In group quarters: 903
Size of family households: 10,284 2-persons, 3,770 3-persons, 2,925 4-persons, 1,097 5-persons, 473 6-persons, 300 7-or-more-persons.
Size of nonfamily households: 6,418 1-person, 883 2-persons, 39 3-persons, 7 4-persons.
9,474 married couples with children.
2,097 single-parent households (663 men, 1,434 women).
91.1% of residents of Hood speak English at home.
8.1% of residents speak Spanish at home (62% speak English very well, 17% speak English well, 17% speak English not well, 4% don't speak English at all).
0.9% of residents speak other Indo-European language at home (71% speak English very well, 25% speak English well, 4% don't speak English at all).
0.2% of residents speak Asian or Pacific Island language at home (37% speak English very well, 33% speak English well, 26% speak English not well, 4% don't speak English at all).
In fiscal year 2004:
Federal Government expenditure: $230,024,000 ($4,948 per capita)
Department of Defense expenditure: $20,614,000
Federal direct payments to individuals for retirement and disability: $159,425,000
Federal other direct payments to individuals: $45,851,000
Federal direct payments not to individuals: $385,000
Federal grants: $13,606,000
Federal procurement contracts: $4,238,000 ($2,261,000 Department of Defense)
Federal salaries and wages: $6,519,000 ($38,000 Department of Defense)
Federal Government direct loans: $0,000
Federal guaranteed/insured loans: $23,319,000
Federal Government insurance: $47,914,000
Population change from April 1, 2000 to July 1, 2005:
Births: 2,509| Here: | 52 per 1000 residents |
| State: | 85 per 1000 residents |
Deaths: 2,450
| Here: | 51 per 1000 residents |
| State: | 35 per 1000 residents |
Net international migration: +316
| Here: | +7 per 1000 residents |
| State: | +29 per 1000 residents |
Net internal migration: +6,539
| Here: | +136 per 1000 residents |
| State: | +10 per 1000 residents |
Total withdrawal of fresh water for public supply: 7.67 millions of gallons per day (41% from ground, 59% from surface)
| Here: | 6.4 |
| State: | 6.3 |
| Here: | 4.4 |
| State: | 4.0 |
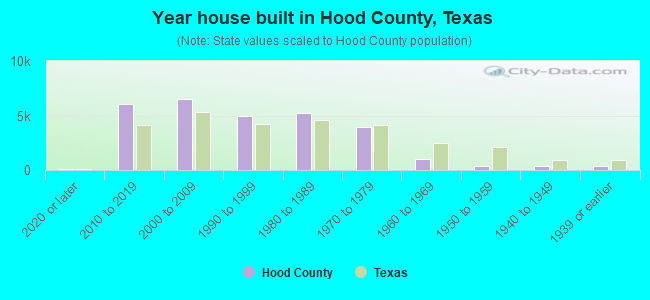
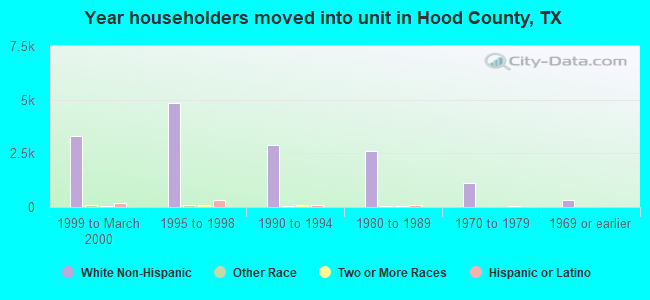
- Year house built in Hood County, Texas
- 1,2002020 or later
- 5,6062010 to 2019
- 6,7642000 to 2009
- 4,8511990 to 1999
- 5,8341980 to 1989
- 2,7201970 to 1979
- 5301960 to 1969
- 5941950 to 1959
- 4891940 to 1949
- 6501939 or earlier
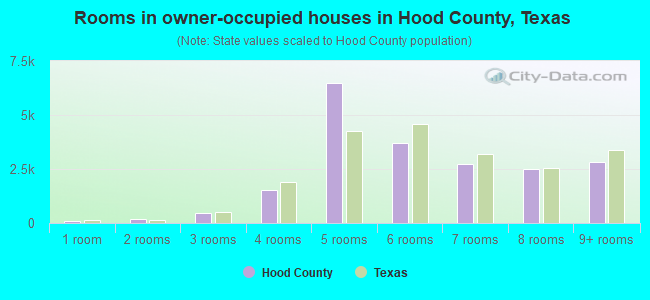
- Rooms in owner-occupied houses in Hood County, Texas
- 661 room
- 1332 rooms
- 6383 rooms
- 2,6504 rooms
- 3,2915 rooms
- 4,1876 rooms
- 3,5487 rooms
- 2,9018 rooms
- 3,3449+ rooms
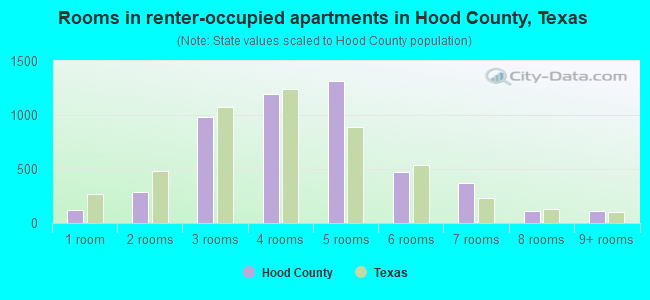
- Rooms in renter-occupied apartments in Hood County, Texas
- 2011 room
- 3242 rooms
- 1,0453 rooms
- 1,0034 rooms
- 4775 rooms
- 9306 rooms
- 6647 rooms
- 2988 rooms
- 09+ rooms
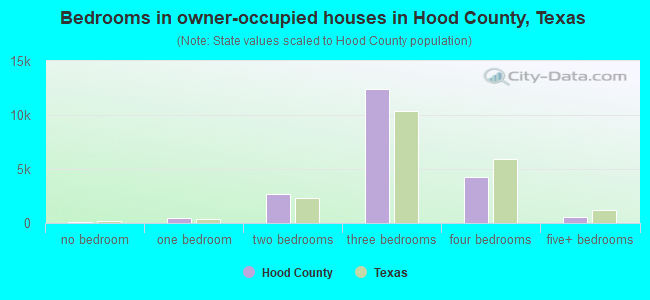
- Bedrooms in owner-occupied houses in Hood County, Texas
- 66no bedroom
- 5191 bedroom
- 3,4192 bedrooms
- 11,6803 bedrooms
- 4,8414 bedrooms
- 2335+ bedrooms
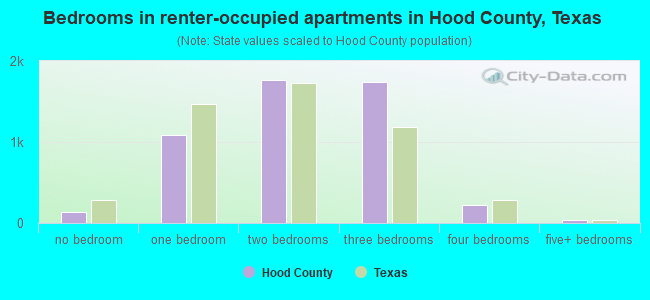
- Bedrooms in renter-occupied apartments in Hood County, Texas
- 201no bedroom
- 9601 bedroom
- 1,5292 bedrooms
- 1,4283 bedrooms
- 8244 bedrooms
- 05+ bedrooms
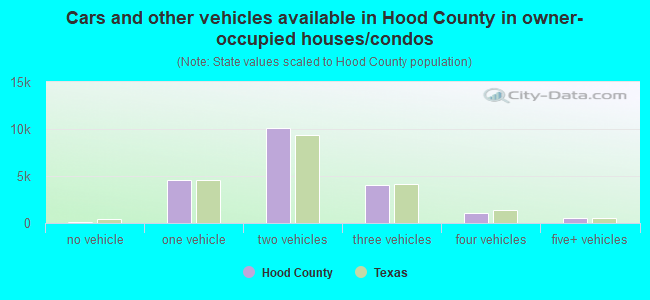
- Cars and other vehicles available in Hood County in owner-occupied houses/condos
- 280no vehicle
- 6,6261 vehicle
- 7,9722 vehicles
- 4,0143 vehicles
- 1,0994 vehicles
- 7675+ vehicles
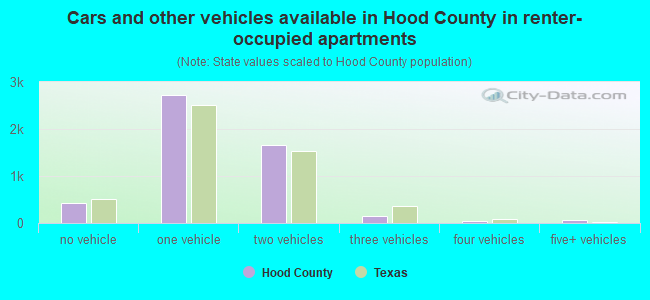
- Cars and other vehicles available in Hood County in renter-occupied apartments
- 586no vehicle
- 1,9081 vehicle
- 2,0032 vehicles
- 3023 vehicles
- 1434 vehicles
- 05+ vehicles
88.8% of Hood County residents lived in the same house 1 years ago.
Out of people who lived in different houses, 19% lived in this county.
Out of people who lived in different counties, 69% lived in Texas.
| Hood County: | 88.8% |
| State average: | 85.7% |
Place of birth for U.S.-born residents:
- This state: 38,773
- Other state: 23,359
- Northeast: 2,371
- Midwest: 7,243
- South: 6,768
- West: 6,977
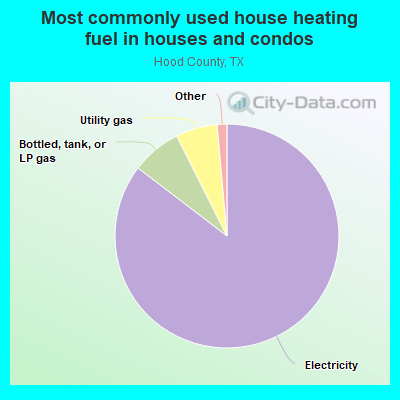
- 86.1%Electricity
- 7.1%Utility gas
- 5.2%Bottled, tank, or LP gas
- 0.9%Wood
- 0.4%Other fuel
- 0.1%Fuel oil, kerosene, etc.
- 0.1%No fuel used
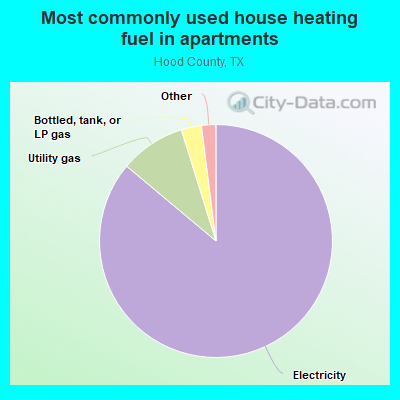
- 83.8%Electricity
- 10.2%Utility gas
- 3.2%Bottled, tank, or LP gas
- 1.0%Fuel oil, kerosene, etc.
- 0.7%Coal or coke
- 0.5%Other fuel
- 0.3%No fuel used
- 0.3%Wood
Private vs. public school enrollment:
| Here: | 9.2% |
| Texas: | 8.8% |
| Here: | 9.0% |
| Texas: | 8.0% |
| Here: | 18.7% |
| Texas: | 16.2% |
Hood County government finances - Expenditure in 2017:
- Bond Funds - Cash and Securities: $775,000
- Charges - Other: $3,360,000
- Construction - Sewerage: $35,000
- Current Operations - Police Protection: $5,656,000
Judicial and Legal Services: $4,682,000
Correctional Institutions: $3,636,000
Regular Highways: $3,100,000
Financial Administration: $2,330,000
Central Staff Services: $1,565,000
General - Other: $1,442,000
General Public Buildings: $894,000
Corrections - Other: $832,000
Health - Other: $783,000
Libraries: $549,000
Local Fire Protection: $540,000
Natural Resources - Other: $70,000
Public Welfare - Other: $67,000
- General - Interest on Debt: $754,000
- Long Term Debt - Beginning Outstanding - Unspecified Public Purpose: $21,493,000
Outstanding Unspecified Public Purpose: $20,368,000
Retired Unspecified Public Purpose: $2,225,000
- Miscellaneous - General Revenue - Other: $834,000
Donations From Private Sources: $774,000
Fines and Forfeits: $164,000
Interest Earnings: $60,000
Sale of Property: $44,000
- Other Capital Outlay - General - Other: $898,000
Police Protection: $542,000
- Other Funds - Cash and Securities: $17,529,000
- Sinking Funds - Cash and Securities: $772,000
- State Intergovernmental - Other: $1,364,000
Highways: $140,000
General Local Government Support: $112,000
Public Welfare: $64,000
Sewerage: $35,000
- Tax - Property: $22,765,000
General Sales and Gross Receipts: $4,021,000
Motor Vehicle License: $1,009,000
Hood County government finances - Revenue in 2017:
- Bond Funds - Cash and Securities: $775,000
- Charges - Other: $3,360,000
- Construction - Sewerage: $35,000
- Current Operations - Police Protection: $5,656,000
Judicial and Legal Services: $4,682,000
Correctional Institutions: $3,636,000
Regular Highways: $3,100,000
Financial Administration: $2,330,000
Central Staff Services: $1,565,000
General - Other: $1,442,000
General Public Buildings: $894,000
Corrections - Other: $832,000
Health - Other: $783,000
Libraries: $549,000
Local Fire Protection: $540,000
Natural Resources - Other: $70,000
Public Welfare - Other: $67,000
- General - Interest on Debt: $754,000
- Long Term Debt - Beginning Outstanding - Unspecified Public Purpose: $21,493,000
Outstanding Unspecified Public Purpose: $20,368,000
Retired Unspecified Public Purpose: $2,225,000
- Miscellaneous - General Revenue - Other: $834,000
Donations From Private Sources: $774,000
Fines and Forfeits: $164,000
Interest Earnings: $60,000
Sale of Property: $44,000
- Other Capital Outlay - General - Other: $898,000
Police Protection: $542,000
- Other Funds - Cash and Securities: $17,529,000
- Sinking Funds - Cash and Securities: $772,000
- State Intergovernmental - Other: $1,364,000
Highways: $140,000
General Local Government Support: $112,000
Public Welfare: $64,000
Sewerage: $35,000
- Tax - Property: $22,765,000
General Sales and Gross Receipts: $4,021,000
Motor Vehicle License: $1,009,000
Hood County government finances - Debt in 2017:
- Bond Funds - Cash and Securities: $775,000
- Charges - Other: $3,360,000
- Construction - Sewerage: $35,000
- Current Operations - Police Protection: $5,656,000
Judicial and Legal Services: $4,682,000
Correctional Institutions: $3,636,000
Regular Highways: $3,100,000
Financial Administration: $2,330,000
Central Staff Services: $1,565,000
General - Other: $1,442,000
General Public Buildings: $894,000
Corrections - Other: $832,000
Health - Other: $783,000
Libraries: $549,000
Local Fire Protection: $540,000
Natural Resources - Other: $70,000
Public Welfare - Other: $67,000
- General - Interest on Debt: $754,000
- Long Term Debt - Beginning Outstanding - Unspecified Public Purpose: $21,493,000
Outstanding Unspecified Public Purpose: $20,368,000
Retired Unspecified Public Purpose: $2,225,000
- Miscellaneous - General Revenue - Other: $834,000
Donations From Private Sources: $774,000
Fines and Forfeits: $164,000
Interest Earnings: $60,000
Sale of Property: $44,000
- Other Capital Outlay - General - Other: $898,000
Police Protection: $542,000
- Other Funds - Cash and Securities: $17,529,000
- Sinking Funds - Cash and Securities: $772,000
- State Intergovernmental - Other: $1,364,000
Highways: $140,000
General Local Government Support: $112,000
Public Welfare: $64,000
Sewerage: $35,000
- Tax - Property: $22,765,000
General Sales and Gross Receipts: $4,021,000
Motor Vehicle License: $1,009,000
Hood County government finances - Cash and Securities in 2017:
- Bond Funds - Cash and Securities: $775,000
- Charges - Other: $3,360,000
- Construction - Sewerage: $35,000
- Current Operations - Police Protection: $5,656,000
Judicial and Legal Services: $4,682,000
Correctional Institutions: $3,636,000
Regular Highways: $3,100,000
Financial Administration: $2,330,000
Central Staff Services: $1,565,000
General - Other: $1,442,000
General Public Buildings: $894,000
Corrections - Other: $832,000
Health - Other: $783,000
Libraries: $549,000
Local Fire Protection: $540,000
Natural Resources - Other: $70,000
Public Welfare - Other: $67,000
- General - Interest on Debt: $754,000
- Long Term Debt - Beginning Outstanding - Unspecified Public Purpose: $21,493,000
Outstanding Unspecified Public Purpose: $20,368,000
Retired Unspecified Public Purpose: $2,225,000
- Miscellaneous - General Revenue - Other: $834,000
Donations From Private Sources: $774,000
Fines and Forfeits: $164,000
Interest Earnings: $60,000
Sale of Property: $44,000
- Other Capital Outlay - General - Other: $898,000
Police Protection: $542,000
- Other Funds - Cash and Securities: $17,529,000
- Sinking Funds - Cash and Securities: $772,000
- State Intergovernmental - Other: $1,364,000
Highways: $140,000
General Local Government Support: $112,000
Public Welfare: $64,000
Sewerage: $35,000
- Tax - Property: $22,765,000
General Sales and Gross Receipts: $4,021,000
Motor Vehicle License: $1,009,000
Supplemental Security Income (SSI) in 2006:
- Total number of recipients: 533
- Number of aged recipients: 59
- Number of blind and disabled recipients: 474
- Number of recipients under 18: 86
- Number of recipients between 18 and 64: 344
- Number of recipients older than 64: 103
- Number of recipients also receiving OASDI: 198
- Amount of payments (thousands of dollars): 235
| Home Mortgage Disclosure Act Aggregated Statistics For Year 2003 (Based on 5 full tracts) | ||||||||||||
| A) FHA, FSA/RHS & VA Home Purchase Loans | B) Conventional Home Purchase Loans | C) Refinancings | D) Home Improvement Loans | E) Loans on Dwellings For 5+ Families | F) Non-occupant Loans on < 5 Family Dwellings (A B C & D) | |||||||
|---|---|---|---|---|---|---|---|---|---|---|---|---|
| Number | Average Value | Number | Average Value | Number | Average Value | Number | Average Value | Number | Average Value | Number | Average Value | |
| LOANS ORIGINATED | 147 | $101,619 | 944 | $108,500 | 1,719 | $127,734 | 244 | $21,816 | 3 | $146,667 | 375 | $96,197 |
| APPLICATIONS APPROVED, NOT ACCEPTED | 8 | $89,000 | 113 | $122,265 | 198 | $122,399 | 19 | $39,421 | 0 | $0 | 33 | $120,485 |
| APPLICATIONS DENIED | 31 | $83,871 | 235 | $81,481 | 559 | $104,360 | 88 | $22,034 | 0 | $0 | 87 | $87,759 |
| APPLICATIONS WITHDRAWN | 20 | $102,850 | 100 | $117,020 | 426 | $115,664 | 9 | $54,444 | 0 | $0 | 37 | $124,514 |
| FILES CLOSED FOR INCOMPLETENESS | 5 | $72,200 | 44 | $94,341 | 66 | $138,636 | 7 | $39,000 | 0 | $0 | 8 | $120,375 |
| Private Mortgage Insurance Companies Aggregated Statistics For Year 2003 (Based on 5 full tracts) | ||||||
| A) Conventional Home Purchase Loans | B) Refinancings | C) Non-occupant Loans on < 5 Family Dwellings (A & B) | ||||
|---|---|---|---|---|---|---|
| Number | Average Value | Number | Average Value | Number | Average Value | |
| LOANS ORIGINATED | 211 | $115,910 | 109 | $143,881 | 42 | $102,524 |
| APPLICATIONS APPROVED, NOT ACCEPTED | 38 | $127,316 | 39 | $152,205 | 7 | $92,286 |
| APPLICATIONS DENIED | 6 | $91,833 | 0 | $0 | 3 | $55,667 |
| APPLICATIONS WITHDRAWN | 4 | $102,500 | 5 | $108,000 | 1 | $119,000 |
| FILES CLOSED FOR INCOMPLETENESS | 7 | $133,571 | 0 | $0 | 4 | $141,000 |
| Most common first names in Hood County, TX among deceased individuals | ||
| Name | Count | Lived (average) |
|---|---|---|
| James | 252 | 73.9 years |
| William | 223 | 74.6 years |
| Mary | 214 | 80.1 years |
| John | 207 | 75.9 years |
| Robert | 159 | 73.7 years |
| Charles | 120 | 75.1 years |
| George | 91 | 75.0 years |
| Dorothy | 86 | 78.8 years |
| Richard | 74 | 71.3 years |
| Margaret | 68 | 80.0 years |
| Most common last names in Hood County, TX among deceased individuals | ||
| Last name | Count | Lived (average) |
|---|---|---|
| Smith | 120 | 77.4 years |
| Davis | 75 | 74.9 years |
| Johnson | 68 | 77.0 years |
| Jones | 67 | 77.2 years |
| Brown | 67 | 77.3 years |
| Williams | 61 | 79.7 years |
| Miller | 60 | 74.5 years |
| White | 54 | 78.0 years |
| Moore | 52 | 74.0 years |
| Wilson | 51 | 78.7 years |
| Businesses in Hood County, TX | ||||
| Name | Count | Name | Count | |
|---|---|---|---|---|
| AT&T | 1 | La-Z-Boy | 1 | |
| Arby's | 1 | Lane Furniture | 1 | |
| AutoZone | 1 | Long John Silver's | 1 | |
| Baymont Inn | 1 | Lowe's | 1 | |
| Best Western | 2 | Maurices | 1 | |
| Blockbuster | 1 | McDonald's | 2 | |
| Burger King | 1 | Payless | 1 | |
| CVS | 1 | Pizza Hut | 1 | |
| Chevrolet | 1 | RadioShack | 1 | |
| Chick-Fil-A | 1 | Rue21 | 1 | |
| Cinnabon | 1 | SONIC Drive-In | 3 | |
| Days Inn | 1 | Sears | 1 | |
| Discount Tire | 1 | Staples | 1 | |
| Domino's Pizza | 2 | Starbucks | 1 | |
| FedEx | 6 | Subway | 4 | |
| Ford | 1 | T-Mobile | 2 | |
| GNC | 1 | Taco Bell | 1 | |
| GameStop | 1 | Toyota | 1 | |
| H&R Block | 2 | U-Haul | 4 | |
| Home Depot | 1 | UPS | 11 | |
| Jack In The Box | 1 | Walgreens | 1 | |
| KFC | 1 | Walmart | 1 | |
| Kroger | 1 | Wendy's | 1 | |
| La Quinta | 1 | YMCA | 1 | |