Huntingdon County, Pennsylvania (PA)
County owner-occupied free and clear houses and condos in 2010: 5,820
County owner-occupied houses and condos in 2000: 12,999
Renter-occupied apartments: 4,144 (it was 3,760 in 2000)
| % of renters here: | 22% |
| State: | 30% |
Land area: 874 sq. mi.
Water area: 15.0 sq. mi.
Population density: 50 people per square mile (average).
Industries providing employment: Educational, health and social services (27.2%), Manufacturing (13.6%), Retail trade (11.1%).
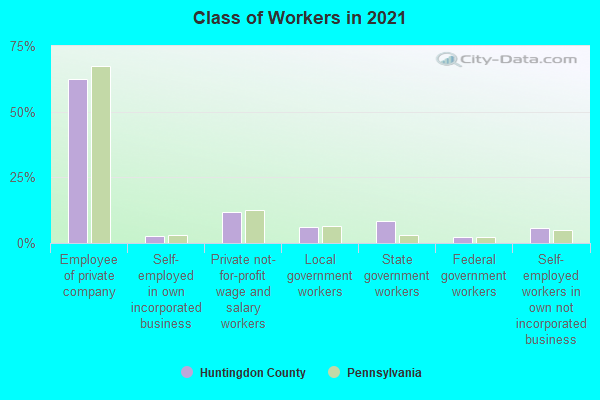
Type of workers:
- Private wage or salary: 77%
- Government: 17%
- Self-employed, not incorporated: 6%
- Unpaid family work: 0%
- OSM Map
- General Map
- Google Map
- MSN Map

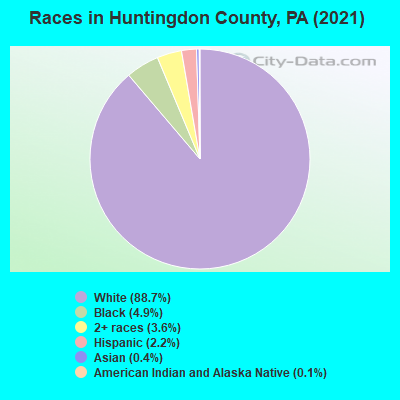
- 38,79688.6%White Non-Hispanic Alone
- 1,9294.4%Black Non-Hispanic Alone
- 1,7273.9%Two or more races
- 9842.2%Hispanic or Latino
- 1810.4%Asian alone
- 1170.3%American Indian and Alaska Native alone
- 460.1%Some other race alone
| Median resident age: | 43.7 years |
| Pennsylvania median age: | 40.9 years |
| Males: 23,566 | |
| Females: 20,498 |

 | PA City/Borough Population Estimates (2017) (28 replies) |
| What is the WORST city or town in Pennsylvania? (324 replies) |
| PA City and County Poverty Levels (37 replies) |
| What's with all the confederate flags? (109 replies) |
| Best PA town for vacation home - Log Cabin? (5 replies) |
| North of Harrisburg? (8 replies) |
| Huntingdon County: | 2.0 people |
| Pennsylvania: | 2 people |
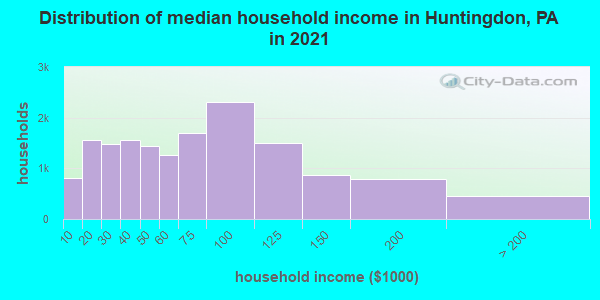
Estimated median household income in 2022: $60,150 ($33,313 in 1999)
| This county: | $60,150 |
| Pennsylvania: | $71,798 |
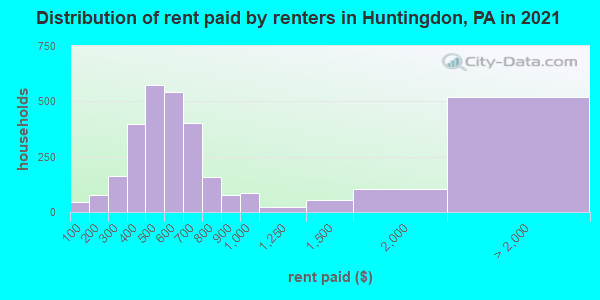
Median contract rent in 2022 for apartments: $549 (lower quartile is $419, upper quartile is $700)
| This county: | $549 |
| State: | $922 |
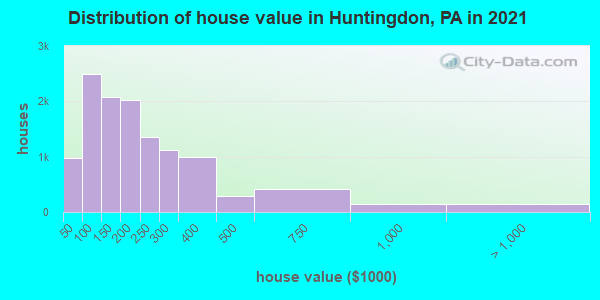
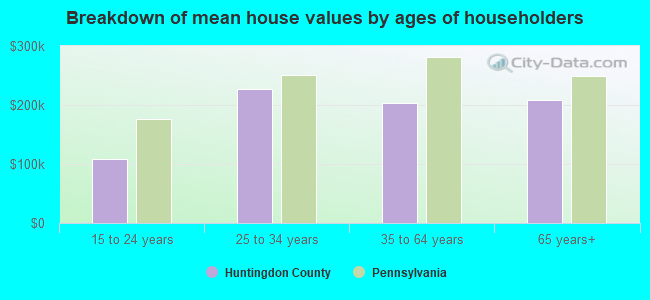
Estimated median house or condo value in 2022: $183,420 (it was $71,800 in 2000)
| Huntingdon: | $183,420 |
| Pennsylvania: | $245,500 |
Mean price in 2022:
Median monthly housing costs for homes and condos with a mortgage: $1,217Detached houses: $244,890
Here: $244,890 State: $317,202 Townhouses or other attached units: $136,587
Here: $136,587 State: $254,369 In 2-unit structures: $150,424
Here: $150,424 State: $249,182 In 3-to-4-unit structures: $590,848
Here: $590,848 State: $297,446 In 5-or-more-unit structures: $302,695
Here: $302,695 State: $320,068 Mobile homes: $107,696
Here: $107,696 State: $92,414 Occupied boats, RVs, vans, etc.: $23,995
Here: $23,995 State: $563,750
Median monthly housing costs for units without a mortgage: $456
Institutionalized population: 3,394
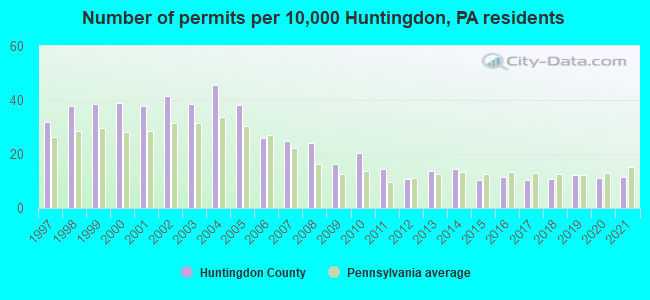
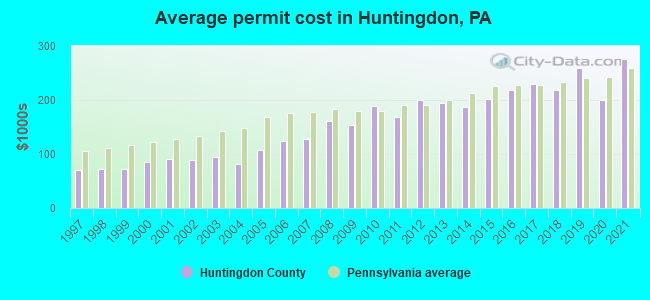
Single-family new house construction building permits:
- 2022: 87 buildings, average cost: $280,200
- 2021: 52 buildings, average cost: $275,900
- 2020: 50 buildings, average cost: $200,200
- 2019: 55 buildings, average cost: $259,500
- 2018: 49 buildings, average cost: $218,500
- 2017: 47 buildings, average cost: $229,100
- 2016: 52 buildings, average cost: $218,100
- 2015: 48 buildings, average cost: $201,100
- 2014: 65 buildings, average cost: $187,000
- 2013: 62 buildings, average cost: $195,300
- 2012: 49 buildings, average cost: $199,900
- 2011: 65 buildings, average cost: $167,700
- 2010: 93 buildings, average cost: $188,400
- 2009: 74 buildings, average cost: $153,400
- 2008: 110 buildings, average cost: $161,700
- 2007: 113 buildings, average cost: $127,600
- 2006: 119 buildings, average cost: $123,800
- 2005: 174 buildings, average cost: $106,700
- 2004: 207 buildings, average cost: $81,200
- 2003: 175 buildings, average cost: $95,200
- 2002: 189 buildings, average cost: $88,500
- 2001: 172 buildings, average cost: $90,200
- 2000: 178 buildings, average cost: $85,900
- 1999: 175 buildings, average cost: $72,200
- 1998: 173 buildings, average cost: $71,800
- 1997: 145 buildings, average cost: $70,500
Median real estate property taxes paid for housing units with mortgages in 2022: $1,650 (0.8%)
Median real estate property taxes paid for housing units with no mortgage in 2022: $1,472 (0.9%)
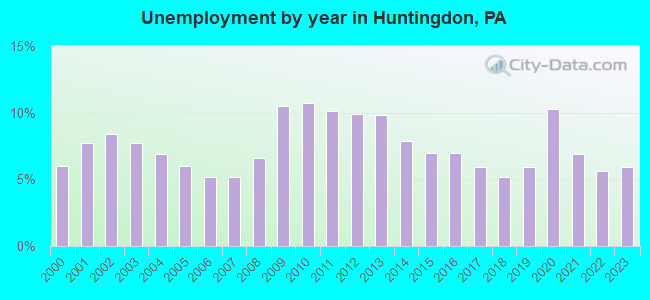
| Huntingdon County: | 11.3% |
| Pennsylvania: | 11.8% |
Median age of residents in 2022: 43.7 years old
(Males: 42.6 years old, Females: 45.5 years old)
(Median age for: White residents: 45.9 years old, Black residents: 39.1 years old, American Indian residents: 31.3 years old, Asian residents: 31.4 years old, Hispanic or Latino residents: 30.0 years old, Other race residents: 37.9 years old)
Fair market rent in 2006 for a 1-bedroom apartment in Huntingdon County is $395 a month.
Fair market rent for a 2-bedroom apartment is $491 a month.
Fair market rent for a 3-bedroom apartment is $634 a month.
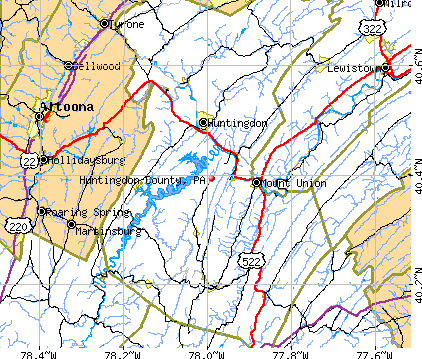
Cities in this county include: Huntingdon, Mount Union, McConnellstown, Mapleton, Petersburg, Three Springs, Orbisonia, Rockhill Furnace, Alexandria, Broad Top City.
Notable locations in this county outside city limits:
Notable locations in Huntingdon County: Celestine Locality (A), Allegrippus (B), Bennington (C), Greenwood Golf Course (D), Anderson Camp (E), Cove Forge (F), Chimney Rock Beagle Club (G), Sinking Valley Country Club (H), Horseshoe Curve (I), Kladder Station (J), Collier (K), Huntchinsons (L), Antis (M), South Burgoon Gap (N), Drab (O), Sparr (P), Stacy Knob (Q), Wopsononock Lookout (R), HealthSouth Rehabilitation Hospital of Altoona (S), Geeseytown Community Fire Company Station 30 (T). Display/hide their locations on the map
Shopping Center: Logan Valley Mall (1). Display/hide its location on the map
Churches in Huntingdon County include: Albright Church (A), Lower Claar Church (B), Asbury Church (C), Mardorf Church (D), West Loop Church (E), Dry Run Church (F), Diehls Crossroads Church (G), Frankstown Park Church (H), Morrel Chapel (I). Display/hide their locations on the map
Cemeteries: Agudath Achim Cemetery (1), Antis Cemetery (2), Baughman Cemetery (3), Bennington Cemetery (4), Biddle Cemetery (5), Williams Cemetery (6), Blacks Cemetery (7). Display/hide their locations on the map
Lakes and reservoirs: Ganister Blue Hole (A), Tyrone Reservoir Number One (B), Tyrone Reservoir Number Two (C), Tipton Reservoir (D), Williamsburg Reservoir (E), Duncansville Reservoir (F), Mill Run Reservoir (G), Homer Gap Reservoir (H). Display/hide their locations on the map
Streams, rivers, and creeks: Vanscoyoc Run (A), Scotch Gap Run (B), New Creek (C), Hutchinson Run (D), Township Run (E), Three Springs Run (F), Laurel Run (G), Halter Creek (H), Gypsy Run (I). Display/hide their locations on the map
Parks in Huntingdon County include: Westfall Park (1), Alto Rest Park (2), State Game Lands Number 278 (3), State Game Lands Number 198 (4), State Game Lands Number 267 (5), Williamsburg Sportsmens Park (6), Shawnee Park (7), Canoe Creek State Park (8), Blair Memorial Park (9). Display/hide their locations on the map
Neighboring counties: Cumberland County  , Mercer County, Ohio
  , Paulding County, Ohio , Seneca County, Ohio , Tazewell County, Illinois .
| Here: | 4.1% |
| Pennsylvania: | 2.9% |
Current college students: 2,034
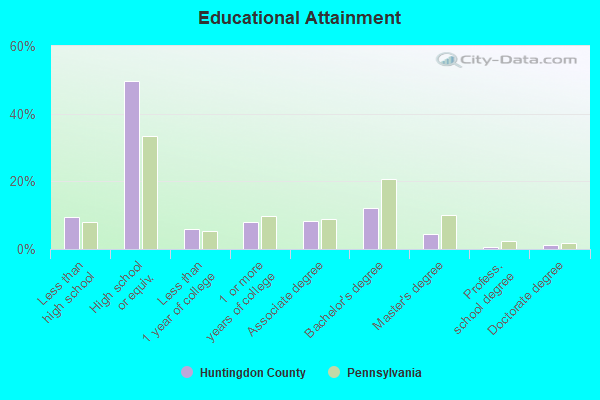
People 25 years of age or older with a high school degree or higher: 90.0%
People 25 years of age or older with a bachelor's degree or higher: 18.1%
Number of foreign born residents: 466 (39.5% naturalized citizens)
| Huntingdon County: | 1.1% |
| Whole state: | 7.5% |
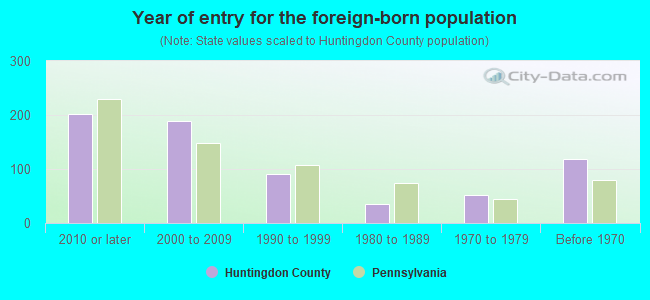
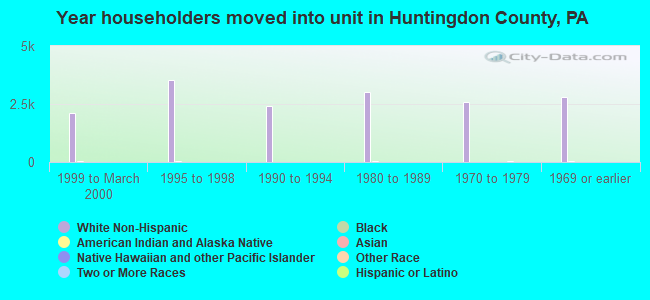
- Year of entry for the foreign-born population
- 1102010 or later
- 2122000 to 2009
- 801990 to 1999
- 351980 to 1989
- 511970 to 1979
- 118Before 1970
Mean travel time to work (commute): minutes
Percentage of county residents living and working in this county: 98.7%
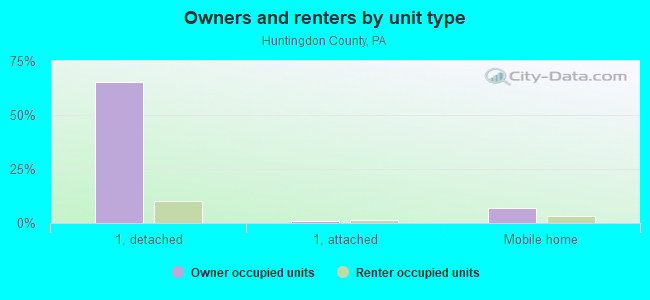
Housing units in structures:
- One, detached: 15,968
- One, attached: 416
- Two: 882
- 3 or 4: 464
- 5 to 9: 274
- 10 to 19: 97
- 20 to 49: 59
- 50 or more: 282
- Mobile homes: 2,636
- Boats, RVs, vans, etc.: 6
Housing units in Huntingdon County with a mortgage: 6,329 (842 second mortgage, 18 home equity loan, 759 both second mortgage and home equity loan)
Houses without a mortgage: 548
| Here: | 1.1% with mortgage |
| State: | 93.8% with mortgage |
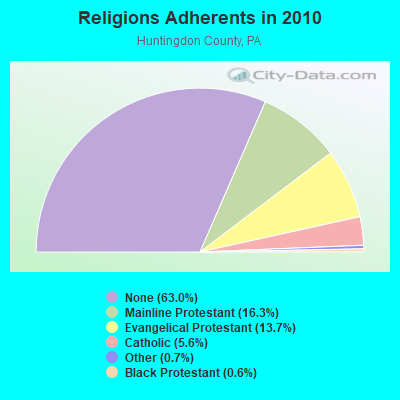
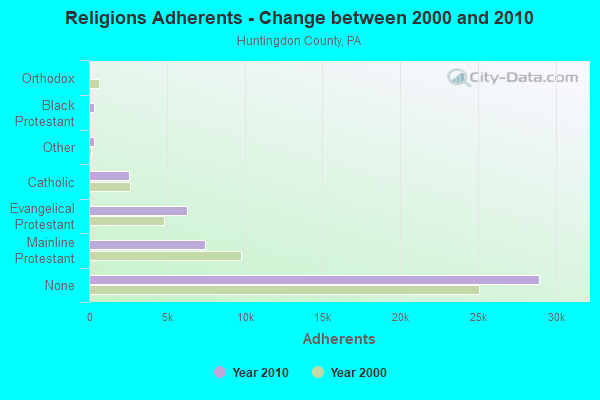
Religion statistics for Huntingdon County
| Religion | Adherents | Congregations |
|---|---|---|
| Mainline Protestant | 7,471 | 69 |
| Evangelical Protestant | 6,310 | 52 |
| Catholic | 2,572 | 4 |
| Other | 306 | 2 |
| Black Protestant | 295 | 2 |
| Orthodox | 20 | 2 |
| None | 28,939 | - |
Source: Clifford Grammich, Kirk Hadaway, Richard Houseal, Dale E.Jones, Alexei Krindatch, Richie Stanley and Richard H.Taylor. 2012. 2010 U.S.Religion Census: Religious Congregations & Membership Study. Association of Statisticians of American Religious Bodies. Jones, Dale E., et al. 2002. Congregations and Membership in the United States 2000. Nashville, TN: Glenmary Research Center.
Food Environment Statistics:
| Huntingdon County: | 1.54 / 10,000 pop. |
| State: | 2.04 / 10,000 pop. |
| This county: | 0.88 / 10,000 pop. |
| Pennsylvania: | 0.88 / 10,000 pop. |
| Huntingdon County: | 3.73 / 10,000 pop. |
| Pennsylvania: | 2.52 / 10,000 pop. |
| This county: | 5.71 / 10,000 pop. |
| State: | 7.12 / 10,000 pop. |
| Huntingdon County: | 10.4% |
| Pennsylvania: | 9.1% |
| Huntingdon County: | 28.8% |
| State: | 27.2% |
| Here: | 9.7% |
| State: | 11.5% |
Agriculture in Huntingdon County:
Average size of farms: 169 acresAverage value of agricultural products sold per farm: $51,238
Average value of crops sold per acre for harvested cropland: $100.90
The value of nursery, greenhouse, floriculture, and sod as a percentage of the total market value of agricultural products sold: 2.96%
The value of livestock, poultry, and their products as a percentage of the total market value of agricultural products sold: 85.62%
Average total farm production expenses per farm: $49,625
Harvested cropland as a percentage of land in farms: 43.29%
Average market value of all machinery and equipment per farm: $55,752
The percentage of farms operated by a family or individual: 94.69%
Average age of principal farm operators: 54 years
Average number of cattle and calves per 100 acres of all land in farms: 19.54
Milk cows as a percentage of all cattle and calves: 41.01%
Corn for grain: 7074 harvested acres
All wheat for grain: 1483 harvested acres
Soybeans for beans: 2803 harvested acres
Vegetables: 413 harvested acres
Land in orchards: 72 acres
Tornado activity:
Huntingdon County historical area-adjusted tornado activity is significantly below Pennsylvania state average. It is 22011777.5 times below overall U.S. average.Earthquake activity:
Huntingdon County-area historical earthquake activity is significantly above Pennsylvania state average. It is 61% smaller than the overall U.S. average.On 8/23/2011 at 17:51:04, a magnitude 5.8 (5.8 MW, Depth: 3.7 mi, Class: Moderate, Intensity: VI - VII) earthquake occurred 171.7 miles away from Huntingdon County center
On 9/25/1998 at 19:52:52, a magnitude 5.2 (4.8 MB, 4.3 MS, 5.2 LG, 4.5 MW, Depth: 3.1 mi) earthquake occurred 146.8 miles away from the county center
On 1/16/1994 at 01:49:16, a magnitude 4.6 (4.6 MB, 4.6 LG, Depth: 3.1 mi, Class: Light, Intensity: IV - V) earthquake occurred 103.1 miles away from the county center
On 1/31/1986 at 16:46:43, a magnitude 5.0 (5.0 MB) earthquake occurred 185.4 miles away from the county center
On 10/7/1983 at 10:18:46, a magnitude 5.3 (5.1 MB, 5.3 LG, 5.1 ML) earthquake occurred 309.2 miles away from Huntingdon County center
On 1/16/1994 at 00:42:43, a magnitude 4.2 (4.2 MB, 4.0 LG, Depth: 3.1 mi) earthquake occurred 104.7 miles away from the county center
Magnitude types: regional Lg-wave magnitude (LG), body-wave magnitude (MB), local magnitude (ML), surface-wave magnitude (MS), moment magnitude (MW)
Most recent natural disasters:
- Pennsylvania Covid-19 Pandemic, Incident Period: January 20, 2020, Major Disaster (Presidential) Declared DR-4506-PA: March 30, 2020, FEMA Id: 4506, Natural disaster type: Other
- Pennsylvania Severe Storms, Tornadoes, and Flooding, Incident Period: June 26, 2013 to July 12, 2013, Major Disaster (Presidential) Declared DR-4149: October 01, 2013, FEMA Id: 4149, Natural disaster type: Storm, Tornado, Flood
- Pennsylvania Hurricane Sandy, Incident Period: October 26, 2012 to November 08, 2012, Emergency Declared EM-3356: October 29, 2012, FEMA Id: 3356, Natural disaster type: Hurricane
- Pennsylvania Hurricane Sandy, Incident Period: October 26, 2012 to November 08, 2012, Major Disaster (Presidential) Declared DR-4099: January 10, 2013, FEMA Id: 4099, Natural disaster type: Hurricane
- Pennsylvania Remnants of Tropical Storm Lee, Incident Period: September 03, 2011 to October 15, 2011, Major Disaster (Presidential) Declared EM-3340: September 08, 2011, FEMA Id: 3340, Natural disaster type: Tropical Storm
- Pennsylvania Tropical Storm Lee, Incident Period: September 03, 2011 to October 15, 2011, Major Disaster (Presidential) Declared DR-4030: September 12, 2011, FEMA Id: 4030, Natural disaster type: Tropical Storm
- Pennsylvania Severe Winter Storms and Snowstorms, Incident Period: February 05, 2010 to February 11, 2010, Major Disaster (Presidential) Declared DR-1898: April 16, 2010, FEMA Id: 1898, Natural disaster type: Snowstorm, Winter Storm
- Pennsylvania Hurricane Katrina Evacuation, Incident Period: August 29, 2005 to October 01, 2005, Emergency Declared EM-3235: September 10, 2005, FEMA Id: 3235, Natural disaster type: Hurricane
- Pennsylvania Tropical Depression Ivan, Incident Period: September 17, 2004 to October 01, 2004, Major Disaster (Presidential) Declared DR-1557: September 19, 2004, FEMA Id: 1557, Natural disaster type: Tropical Depression
- Pennsylvania Severe Storms and Flooding associated with Tropical Depression Frances, Incident Period: September 08, 2004 to September 09, 2004, Major Disaster (Presidential) Declared DR-1555: September 19, 2004, FEMA Id: 1555, Natural disaster type: Storm, Flood, Tropical Depression
- 6 other natural disasters have been reported since 1953.
The number of natural disasters in Huntingdon County (16) is near the US average (15).
Major Disasters (Presidential) Declared: 12
Emergencies Declared: 4
Causes of natural disasters: Hurricanes: 4, Floods: 3, Tropical Storms: 3, Snowstorms: 2, Storms: 2, Tropical Depressions: 2, Winter Storms: 2, Blizzard: 1, Snowfall: 1, Tornado: 1, Other: 1 (Note: some incidents may be assigned to more than one category).
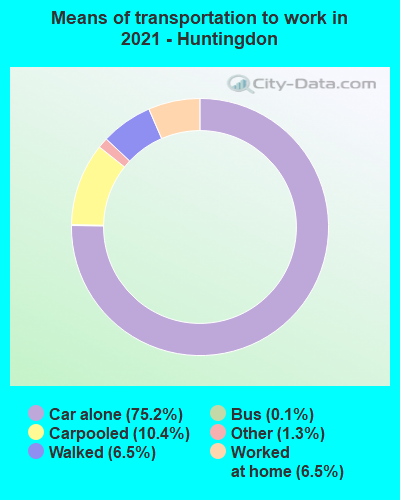
Means of transportation to work:
- Drove a car alone: 11,232 (73.9%)
- Carpooled: 1,298 (8.5%)
- Bus: 16 (0.1%)
- Taxicab, motorcycle, or other means: 224 (1.5%)
- Walked: 936 (6.2%)
- Worked at home: 1,365 (9.0%)
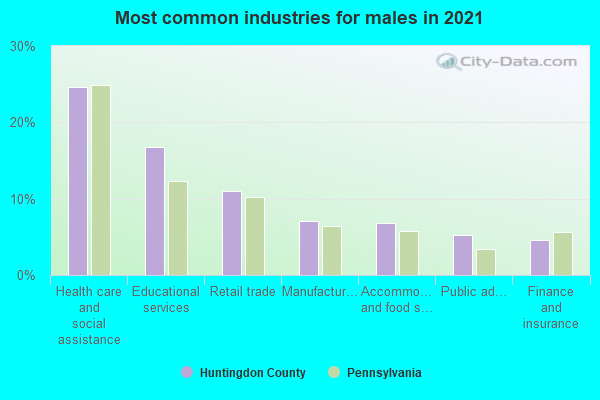
- Health care and social assistance (23%)
- Educational services (15%)
- Retail trade (11%)
- Accommodation and food services (8%)
- Manufacturing (7%)
- Public administration (5%)
- Other services, except public administration (4%)
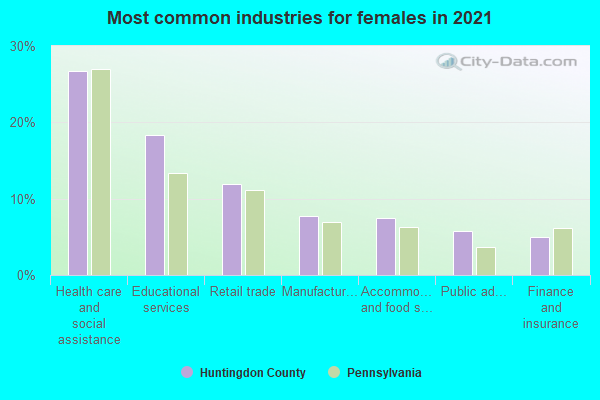
- Health care and social assistance (26%)
- Educational services (16%)
- Retail trade (12%)
- Accommodation and food services (9%)
- Manufacturing (8%)
- Public administration (5%)
- Other services, except public administration (4%)

- Construction and extraction occupations (13%)
- Production occupations (11%)
- Material moving occupations (10%)
- Management occupations (9%)
- Installation, maintenance, and repair occupations (7%)
- Transportation occupations (6%)
- Sales and related occupations (6%)
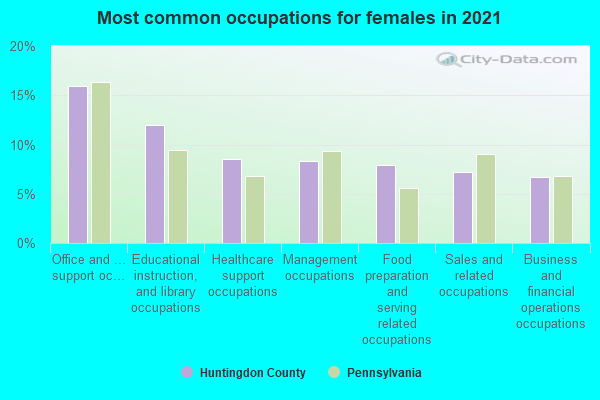
- Office and administrative support occupations (15%)
- Educational instruction, and library occupations (11%)
- Food preparation and serving related occupations (9%)
- Healthcare support occupations (8%)
- Management occupations (7%)
- Business and financial operations occupations (7%)
- Sales and related occupations (7%)
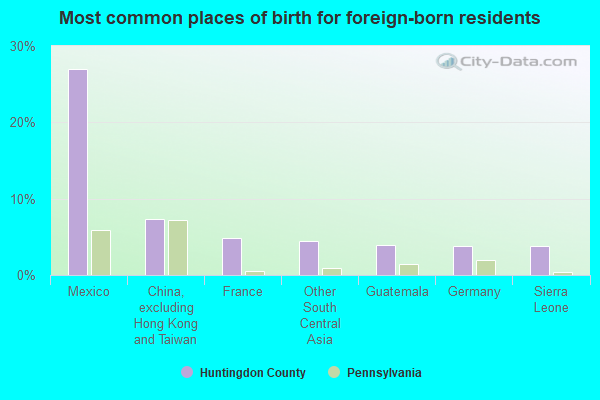
- Mexico (12%)
- Kenya (10%)
- Vietnam (9%)
- France (7%)
- Guatemala (7%)
- Philippines (5%)
- Germany (5%)
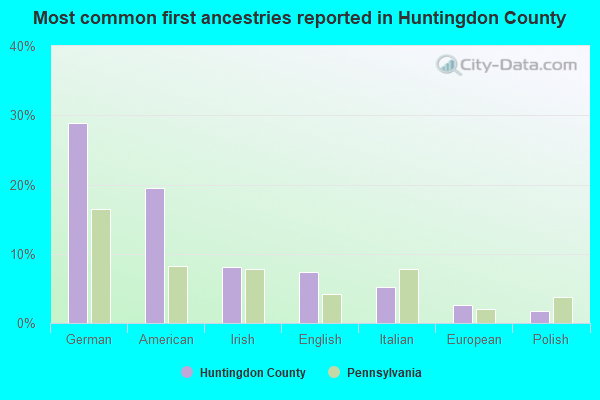
- German (28%)
- American (19%)
- Irish (8%)
- English (7%)
- Italian (5%)
- European (2%)
- Polish (2%)
People in group quarters in Huntingdon County, Pennsylvania in 2010:
- 3,169 people in state prisons
- 1,131 people in college/university student housing
- 134 people in nursing facilities/skilled-nursing facilities
- 54 people in local jails and other municipal confinement facilities
- 37 people in correctional facilities intended for juveniles
- 28 people in group homes intended for adults
- 10 people in emergency and transitional shelters (with sleeping facilities) for people experiencing homelessness
- 7 people in workers' group living quarters and job corps centers
People in group quarters in Huntingdon County, Pennsylvania in 2000:
- 3,140 people in state prisons
- 1,001 people in college dormitories (includes college quarters off campus)
- 331 people in nursing homes
- 69 people in training schools for juvenile delinquents
- 65 people in local jails and other confinement facilities (including police lockups)
- 30 people in other group homes
- 22 people in homes for the mentally retarded
- 18 people in other noninstitutional group quarters
- 6 people in homes for the mentally ill
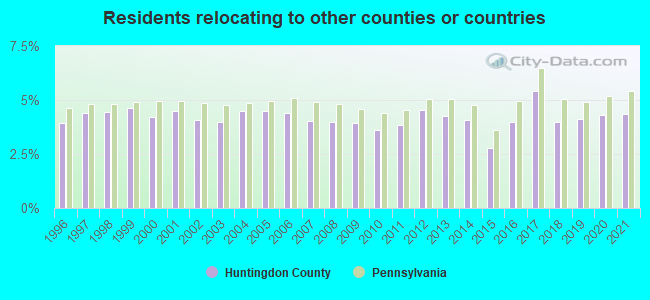
4.95% of this county's 2021 resident taxpayers lived in other counties in 2020 ($49,210 average adjusted gross income)
| Here: | 4.95% |
| Pennsylvania average: | 5.27% |
10 or fewer of this county's residents moved from foreign countries.
3.87% relocated from other counties in Pennsylvania ($37,478 average AGI)
1.08% relocated from other states ($11,732 average AGI)
Huntingdon County: 1.08% Pennsylvania average: 2.30%

Top counties from which taxpayers relocated into this county between 2020 and 2021:
| from Blair County, PA | |
| from Mifflin County, PA | |
| from Centre County, PA | |
| from Bedford County, PA | |
| from Lancaster County, PA | |
| from Franklin County, PA | |
| from Cumberland County, PA |
4.34% of this county's 2020 resident taxpayers moved to other counties in 2021 ($43,822 average adjusted gross income)
| Here: | 4.34% |
| Pennsylvania average: | 5.44% |
10 or fewer of this county's residents moved to foreign countries.
3.28% relocated to other counties in Pennsylvania ($31,101 average AGI)
1.06% relocated to other states ($12,721 average AGI)
Huntingdon County: 1.06% Pennsylvania average: 2.47%
Top counties to which taxpayers relocated from this county between 2020 and 2021:
| to Blair County, PA | |
| to Mifflin County, PA | |
| to Centre County, PA | |
| to Bedford County, PA | |
| to Cumberland County, PA | |
| to Franklin County, PA | |
| to Fulton County, PA |
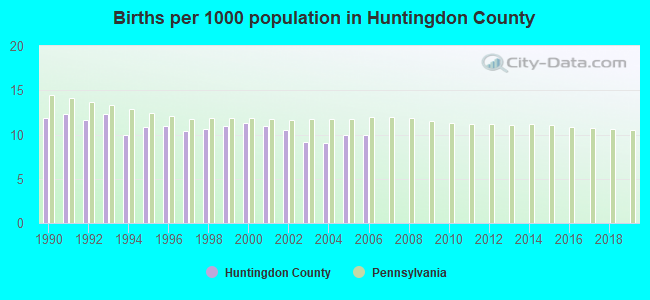
Births per 1000 population from 1990 to 1999: 11.2
Births per 1000 population from 2000 to 2006: 10.1
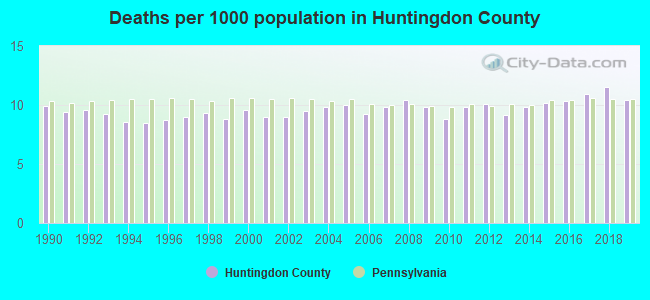
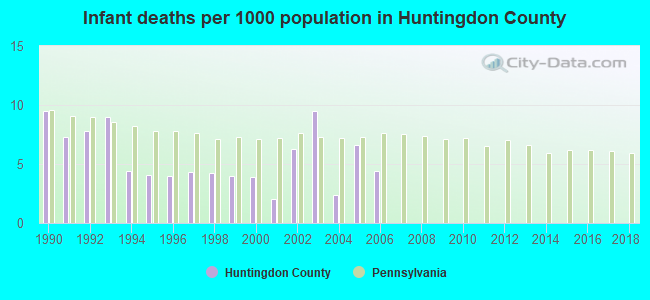
Deaths per 1000 population from 1990 to 1999: 9.1
Deaths per 1000 population from 2000 to 2009: 9.6
Deaths per 1000 population from 2010 to 2020: 10.3
Infant deaths per 1000 live births from 1990 to 1999: 5.9
Infant deaths per 1000 live births from 2000 to 2006: 5.0
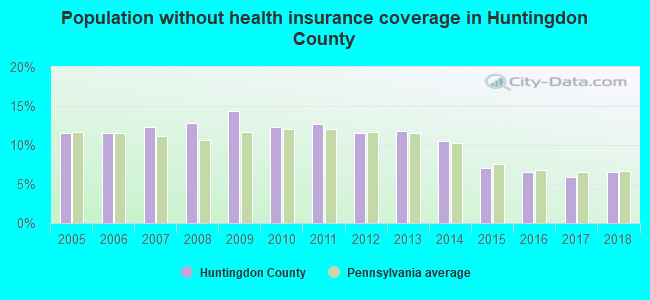
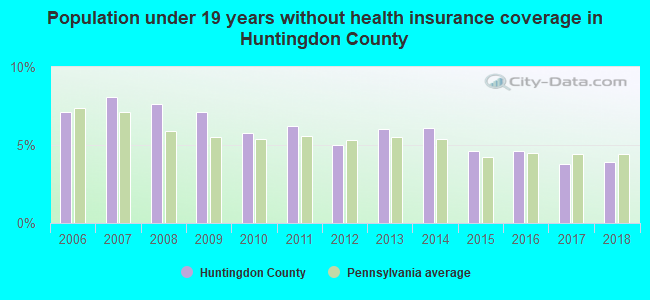
Persons under 19 years old without health insurance coverage in 2018: 3.9%

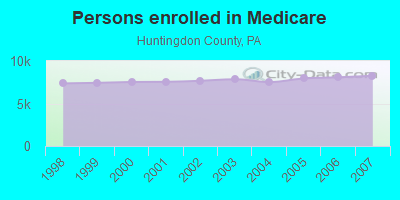
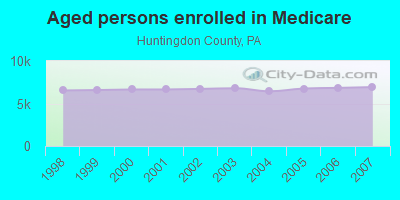
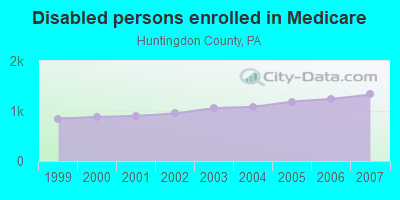
Persons enrolled in hospital insurance and/or supplemental medical insurance (Medicare) in July 1, 2007: 8,262 (6,931 aged, 1,331 disabled)
Children under 18 without health insurance coverage in 2007: 594 (6%)
Most common underlying causes of death in Huntingdon County, Pennsylvania in 1999 - 2019:
- Atherosclerotic heart disease (784)
- Acute myocardial infarction, unspecified (651)
- Bronchus or lung, unspecified - Malignant neoplasms (549)
- Chronic obstructive pulmonary disease, unspecified (375)
- Alzheimer disease, unspecified (229)
- Stroke, not specified as haemorrhage or infarction (223)
- Congestive heart failure (191)
- Unspecified dementia (168)
- Other ill-defined and unspecified causes of mortality (145)
- Colon, unspecified - Malignant neoplasms (88)
Population without health insurance coverage in 2000: 11%
Children under 18 without health insurance coverage in 2000: 8%
Short term general hospital admissions per 100,000 population in 2004: 7,266
Short term general hospital beds per 100,000 population in 2004: 154
Emergency room visits per 100,000 population in 2004: 31,127
General practice office based MDs per 100,000 population in 2005: 1,025
Medical specialist MDs per 100,000 population in 2005: 988
Dentists per 100,000 population in 1998: 13
Total births per 100,000 population, July 2005 - July 2006 : 34
Total deaths per 100,000 population, July 2005 - July 2006: 52
Limited-service eating places per 100,000 population in 2005 : 13
Suicides per 1,000,000 population from 2000 to 2006: 119.1. This is more than state average.
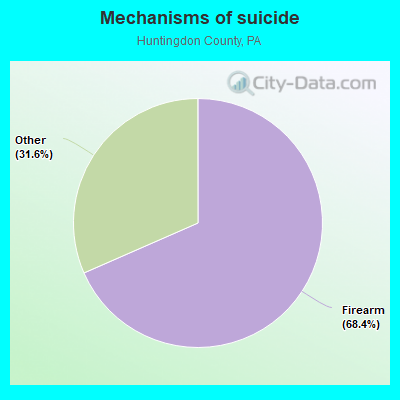
- Firearm - 81.5
- Other - 37.6
Household type by relationship:
Households: 44,064- Male householders: 7,779 (2,098 living alone), Female householders: 8,296 (2,506 living alone)
8,663 spouses (8,608 opposite-sex spouses), 906 unmarried partners, (869 opposite-sex unmarried partners), 10,649 children (9,835 natural, 206 adopted, 606 stepchildren), 884 grandchildren, 289 brothers or sisters, 350 parents, 17 foster children, 483 other relatives, 744 non-relatives
- In group quarters: 5,150
Size of family households: 5,546 2-persons, 2,149 3-persons, 1,807 4-persons, 773 5-persons, 284 6-persons, 174 7-or-more-persons.
Size of nonfamily households: 4,605 1-person, 629 2-persons, 43 3-persons, 27 4-persons, 14 6-persons.
5,020 married couples with children.
1,667 single-parent households (425 men, 1,242 women).
96.2% of residents of Huntingdon speak English at home.
1.7% of residents speak Spanish at home (64% speak English very well, 25% speak English well, 10% speak English not well).
1.3% of residents speak other Indo-European language at home (62% speak English very well, 36% speak English well, 1% speak English not well, 1% don't speak English at all).
0.2% of residents speak Asian or Pacific Island language at home (61% speak English very well, 23% speak English well, 16% speak English not well).
0.4% of residents speak other language at home (43% speak English very well, 57% speak English well).
In fiscal year 2004:
Federal Government expenditure: $248,455,000 ($5,402 per capita)
Department of Defense expenditure: $9,529,000
Federal direct payments to individuals for retirement and disability: $117,245,000
Federal other direct payments to individuals: $56,467,000
Federal direct payments not to individuals: $3,116,000
Federal grants: $58,389,000
Federal procurement contracts: $3,353,000 ($1,608,000 Department of Defense)
Federal salaries and wages: $9,886,000 ($3,027,000 Department of Defense)
Federal Government direct loans: $996,000
Federal guaranteed/insured loans: $6,123,000
Federal Government insurance: $36,157,000
Population change from April 1, 2000 to July 1, 2005:
Births: 2,381| Here: | 52 per 1000 residents |
| State: | 61 per 1000 residents |
Deaths: 2,204
| Here: | 48 per 1000 residents |
| State: | 54 per 1000 residents |
Net international migration: +75
| Here: | +2 per 1000 residents |
| State: | +8 per 1000 residents |
Net internal migration: +160
| Here: | |
| State: |
Total withdrawal of fresh water for public supply: 2.86 millions of gallons per day (15% from ground, 85% from surface)
| Here: | 6.4 |
| State: | 6.8 |
| Here: | 4.9 |
| State: | 4.3 |
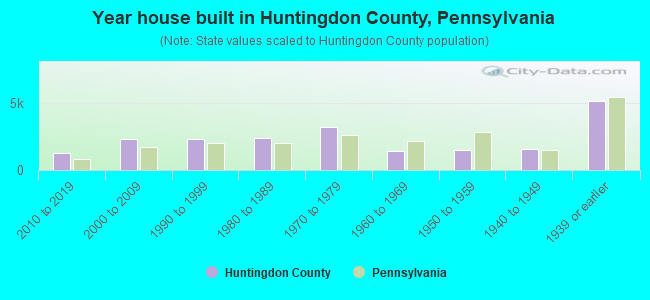
- Year house built in Huntingdon County, Pennsylvania
- 232020 or later
- 1,1662010 to 2019
- 2,4682000 to 2009
- 2,2731990 to 1999
- 2,3801980 to 1989
- 3,1611970 to 1979
- 1,5561960 to 1969
- 1,4641950 to 1959
- 1,4501940 to 1949
- 5,1151939 or earlier
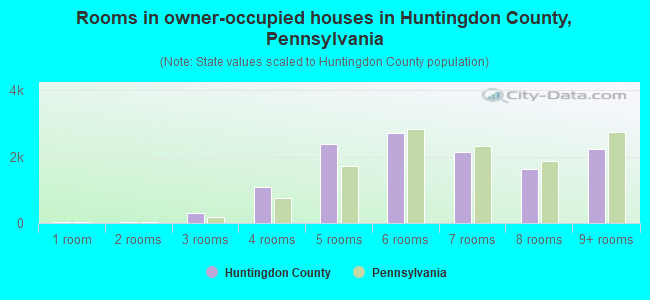
- Rooms in owner-occupied houses in Huntingdon County, Pennsylvania
- 441 room
- 582 rooms
- 3443 rooms
- 1,0524 rooms
- 2,3165 rooms
- 2,8496 rooms
- 2,0867 rooms
- 1,6298 rooms
- 2,2579+ rooms
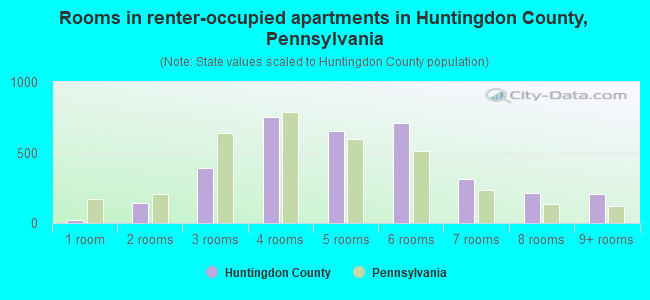
- Rooms in renter-occupied apartments in Huntingdon County, Pennsylvania
- 651 room
- 2142 rooms
- 3823 rooms
- 8014 rooms
- 6775 rooms
- 6526 rooms
- 2597 rooms
- 1748 rooms
- 2019+ rooms

- Bedrooms in owner-occupied houses in Huntingdon County, Pennsylvania
- 48no bedroom
- 4101 bedroom
- 2,3632 bedrooms
- 6,6873 bedrooms
- 2,5434 bedrooms
- 5535+ bedrooms
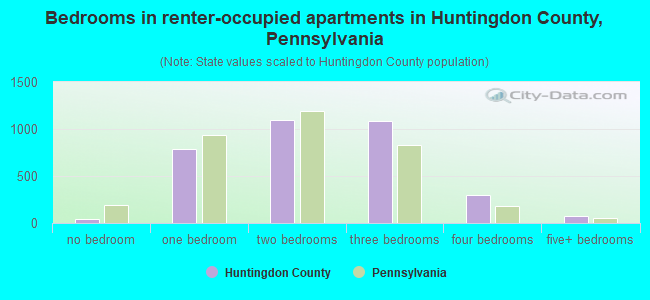
- Bedrooms in renter-occupied apartments in Huntingdon County, Pennsylvania
- 69no bedroom
- 8401 bedroom
- 1,2052 bedrooms
- 9763 bedrooms
- 2804 bedrooms
- 585+ bedrooms
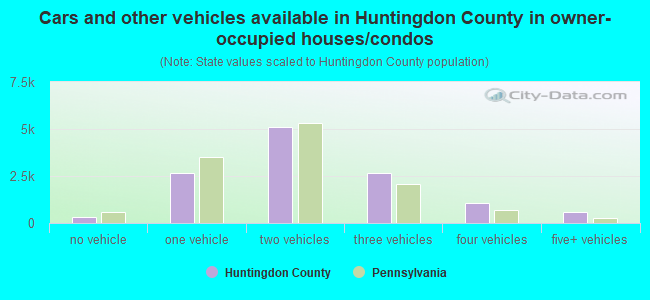
- Cars and other vehicles available in Huntingdon County in owner-occupied houses/condos
- 359no vehicle
- 2,7171 vehicle
- 5,1852 vehicles
- 2,5903 vehicles
- 1,0994 vehicles
- 5915+ vehicles
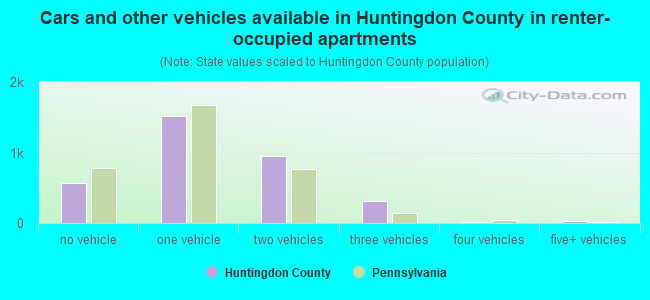
- Cars and other vehicles available in Huntingdon County in renter-occupied apartments
- 700no vehicle
- 1,4701 vehicle
- 9812 vehicles
- 2683 vehicles
- 84 vehicles
- 375+ vehicles
90.8% of Huntingdon County residents lived in the same house 1 years ago.
Out of people who lived in different houses, 30% lived in this county.
Out of people who lived in different counties, 78% lived in Pennsylvania.
| Huntingdon County: | 90.8% |
| State average: | 89.3% |
Place of birth for U.S.-born residents:
- This state: 36,953
- Other state: 6,083
- Northeast: 1,633
- Midwest: 1,031
- South: 2,934
- West: 481
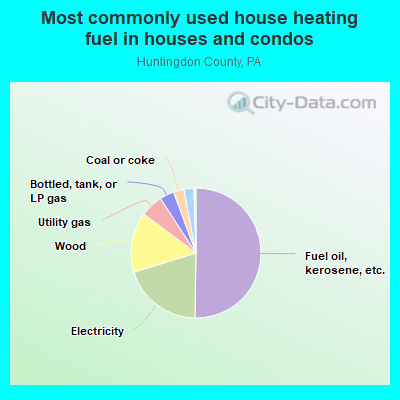
- 49.9%Fuel oil, kerosene, etc.
- 19.9%Electricity
- 15.5%Wood
- 5.7%Utility gas
- 4.2%Bottled, tank, or LP gas
- 2.2%Other fuel
- 2.1%Coal or coke
- 0.4%No fuel used
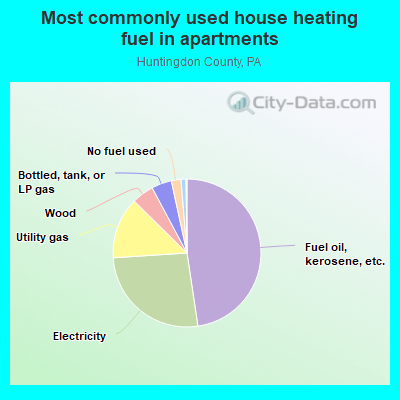
- 44.5%Fuel oil, kerosene, etc.
- 27.2%Electricity
- 14.0%Utility gas
- 6.4%Bottled, tank, or LP gas
- 4.3%Wood
- 2.2%No fuel used
- 1.0%Other fuel
- 0.3%Coal or coke
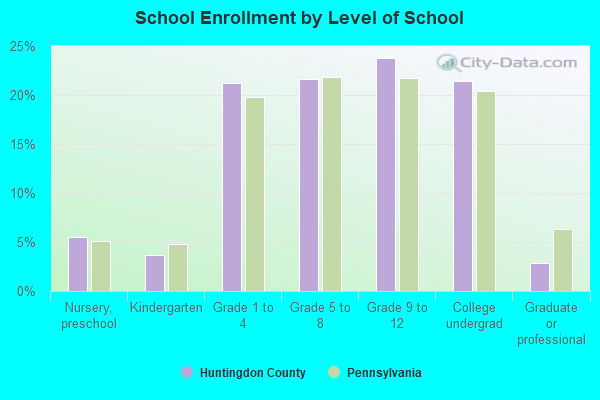
Private vs. public school enrollment:
| Here: | 11.3% |
| Pennsylvania: | 15.7% |
| Here: | 14.4% |
| Pennsylvania: | 13.4% |
| Here: | 64.1% |
| Pennsylvania: | 39.8% |
Huntingdon County government finances - Expenditure in 2018:
- Charges - Other: $2,334,000
- Current Operations - Public Welfare - Other: $5,009,000
Correctional Institutions: $3,379,000
Judicial and Legal Services: $3,145,000
Financial Administration: $2,816,000
Central Staff Services: $2,816,000
Police Protection: $2,176,000
Corrections - Other: $1,299,000
Health - Other: $1,235,000
Natural Resources - Other: $328,000
Parks and Recreation: $286,000
Regular Highways: $133,000
General - Other: $36,000
- Federal Intergovernmental - Other: $25,000
- General - Interest on Debt: $138,000
- Local Intergovernmental - General Local Government Support: $1,188,000
- Long Term Debt - Beginning Outstanding - Unspecified Public Purpose: $6,891,000
Outstanding Unspecified Public Purpose: $6,712,000
Retired Unspecified Public Purpose: $179,000
- Miscellaneous - General Revenue - Other: $311,000
Interest Earnings: $10,000
Rents: $9,000
Sale of Property: $1,000
- Other Capital Outlay - Health - Other: $39,000
- Other Funds - Cash and Securities: $4,060,000
- State Intergovernmental - General Local Government Support: $3,476,000
Other: $2,285,000
Highways: $194,000
- Tax - Property: $8,931,000
Other Selective Sales: $223,000
- Total Salaries and Wages: $6,245,000
Huntingdon County government finances - Revenue in 2018:
- Charges - Other: $2,334,000
- Current Operations - Public Welfare - Other: $5,009,000
Correctional Institutions: $3,379,000
Judicial and Legal Services: $3,145,000
Financial Administration: $2,816,000
Central Staff Services: $2,816,000
Police Protection: $2,176,000
Corrections - Other: $1,299,000
Health - Other: $1,235,000
Natural Resources - Other: $328,000
Parks and Recreation: $286,000
Regular Highways: $133,000
General - Other: $36,000
- Federal Intergovernmental - Other: $25,000
- General - Interest on Debt: $138,000
- Local Intergovernmental - General Local Government Support: $1,188,000
- Long Term Debt - Beginning Outstanding - Unspecified Public Purpose: $6,891,000
Outstanding Unspecified Public Purpose: $6,712,000
Retired Unspecified Public Purpose: $179,000
- Miscellaneous - General Revenue - Other: $311,000
Interest Earnings: $10,000
Rents: $9,000
Sale of Property: $1,000
- Other Capital Outlay - Health - Other: $39,000
- Other Funds - Cash and Securities: $4,060,000
- State Intergovernmental - General Local Government Support: $3,476,000
Other: $2,285,000
Highways: $194,000
- Tax - Property: $8,931,000
Other Selective Sales: $223,000
- Total Salaries and Wages: $6,245,000
Huntingdon County government finances - Debt in 2018:
- Charges - Other: $2,334,000
- Current Operations - Public Welfare - Other: $5,009,000
Correctional Institutions: $3,379,000
Judicial and Legal Services: $3,145,000
Financial Administration: $2,816,000
Central Staff Services: $2,816,000
Police Protection: $2,176,000
Corrections - Other: $1,299,000
Health - Other: $1,235,000
Natural Resources - Other: $328,000
Parks and Recreation: $286,000
Regular Highways: $133,000
General - Other: $36,000
- Federal Intergovernmental - Other: $25,000
- General - Interest on Debt: $138,000
- Local Intergovernmental - General Local Government Support: $1,188,000
- Long Term Debt - Beginning Outstanding - Unspecified Public Purpose: $6,891,000
Outstanding Unspecified Public Purpose: $6,712,000
Retired Unspecified Public Purpose: $179,000
- Miscellaneous - General Revenue - Other: $311,000
Interest Earnings: $10,000
Rents: $9,000
Sale of Property: $1,000
- Other Capital Outlay - Health - Other: $39,000
- Other Funds - Cash and Securities: $4,060,000
- State Intergovernmental - General Local Government Support: $3,476,000
Other: $2,285,000
Highways: $194,000
- Tax - Property: $8,931,000
Other Selective Sales: $223,000
- Total Salaries and Wages: $6,245,000
Huntingdon County government finances - Cash and Securities in 2018:
- Charges - Other: $2,334,000
- Current Operations - Public Welfare - Other: $5,009,000
Correctional Institutions: $3,379,000
Judicial and Legal Services: $3,145,000
Financial Administration: $2,816,000
Central Staff Services: $2,816,000
Police Protection: $2,176,000
Corrections - Other: $1,299,000
Health - Other: $1,235,000
Natural Resources - Other: $328,000
Parks and Recreation: $286,000
Regular Highways: $133,000
General - Other: $36,000
- Federal Intergovernmental - Other: $25,000
- General - Interest on Debt: $138,000
- Local Intergovernmental - General Local Government Support: $1,188,000
- Long Term Debt - Beginning Outstanding - Unspecified Public Purpose: $6,891,000
Outstanding Unspecified Public Purpose: $6,712,000
Retired Unspecified Public Purpose: $179,000
- Miscellaneous - General Revenue - Other: $311,000
Interest Earnings: $10,000
Rents: $9,000
Sale of Property: $1,000
- Other Capital Outlay - Health - Other: $39,000
- Other Funds - Cash and Securities: $4,060,000
- State Intergovernmental - General Local Government Support: $3,476,000
Other: $2,285,000
Highways: $194,000
- Tax - Property: $8,931,000
Other Selective Sales: $223,000
- Total Salaries and Wages: $6,245,000
Supplemental Security Income (SSI) in 2006:
- Total number of recipients: 1,137
- Number of aged recipients: 98
- Number of blind and disabled recipients: 1,039
- Number of recipients under 18: 183
- Number of recipients between 18 and 64: 745
- Number of recipients older than 64: 209
- Number of recipients also receiving OASDI: 415
- Amount of payments (thousands of dollars): 512
| Most common first names in Huntingdon County, PA among deceased individuals | ||
| Name | Count | Lived (average) |
|---|---|---|
| John | 315 | 73.6 years |
| Mary | 291 | 80.0 years |
| William | 232 | 72.0 years |
| Charles | 225 | 75.7 years |
| Robert | 212 | 69.6 years |
| James | 194 | 72.5 years |
| Helen | 158 | 78.5 years |
| George | 149 | 74.7 years |
| Anna | 128 | 79.6 years |
| Margaret | 123 | 80.9 years |
| Most common last names in Huntingdon County, PA among deceased individuals | ||
| Last name | Count | Lived (average) |
|---|---|---|
| Miller | 136 | 76.2 years |
| Smith | 104 | 75.2 years |
| Brown | 76 | 79.7 years |
| Wilson | 73 | 73.5 years |
| Snyder | 63 | 75.9 years |
| Price | 62 | 76.2 years |
| Moore | 56 | 70.0 years |
| Norris | 51 | 75.9 years |
| Grove | 49 | 74.0 years |
| Whitsel | 40 | 74.9 years |
| Businesses in Huntingdon County, PA | ||||
| Name | Count | Name | Count | |
|---|---|---|---|---|
| AT&T | 1 | H&R Block | 1 | |
| Ace Hardware | 1 | Jimmy John's | 1 | |
| Advance Auto Parts | 1 | Jones New York | 1 | |
| AutoZone | 1 | KFC | 1 | |
| Burger King | 1 | MasterBrand Cabinets | 4 | |
| Chevrolet | 1 | McDonald's | 1 | |
| Comfort Inn | 1 | Pizza Hut | 1 | |
| Curves | 1 | RadioShack | 1 | |
| Dairy Queen | 1 | Rite Aid | 1 | |
| Decora Cabinetry | 2 | Sears | 1 | |
| Domino's Pizza | 1 | Subway | 3 | |
| Fashion Bug | 1 | True Value | 2 | |
| FedEx | 1 | U-Haul | 1 | |
| Ford | 1 | UPS | 3 | |
| GNC | 1 | Walmart | 1 | |
| Giant | 1 | Wendy's | 1 | |
| Goodwill | 2 | |||
Huntingdon County on our top lists:
- #38 on the list of "Top 101 counties with the lowest percentage of residents relocating from other counties between 2010 and 2011"
- #53 on the list of "Top 101 counties with the lowest percentage of residents relocating to other counties in 2011"