Jasper County, Indiana (IN)
County owner-occupied free and clear houses and condos in 2010: 2,722
County owner-occupied houses and condos in 2000: 8,279
Renter-occupied apartments: 2,828 (it was 2,407 in 2000)
| % of renters here: | 23% |
| State: | 30% |
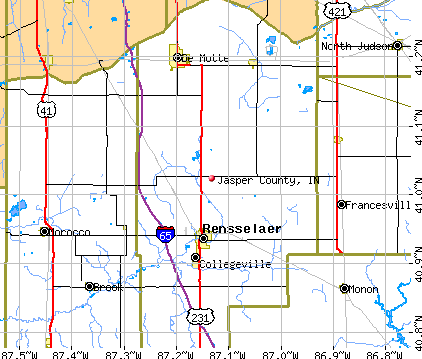
Land area: 560 sq. mi.
Water area: 1.4 sq. mi.
Population density: 59 people per square mile (average).
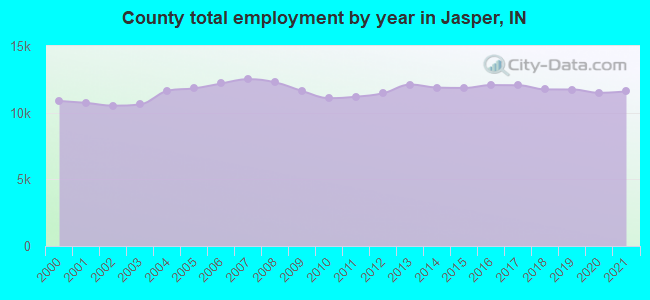
Industries providing employment: Educational, health and social services (20.0%), Manufacturing (18.9%), Construction (11.1%), Retail trade (10.9%).
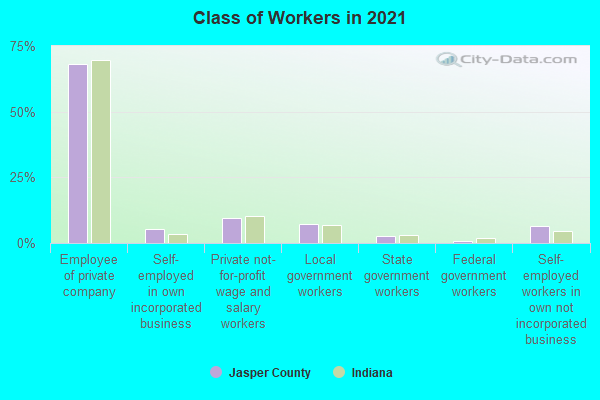
Type of workers:
- Private wage or salary: 84%
- Government: 10%
- Self-employed, not incorporated: 6%
- Unpaid family work: 0%
- OSM Map
- General Map
- Google Map
- MSN Map

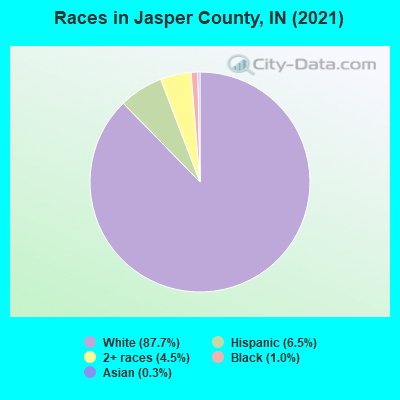
- 28,94587.0%White Non-Hispanic Alone
- 2,2486.8%Hispanic or Latino
- 1,6925.1%Two or more races
- 3171.0%Black Non-Hispanic Alone
- 520.2%Asian alone
- 110.03%American Indian and Alaska Native alone
| Median resident age: | 41.6 years |
| Indiana median age: | 38.2 years |
| Males: 16,727 | |
| Females: 16,554 |


| Jasper County: | 2.0 people |
| Indiana: | 3 people |
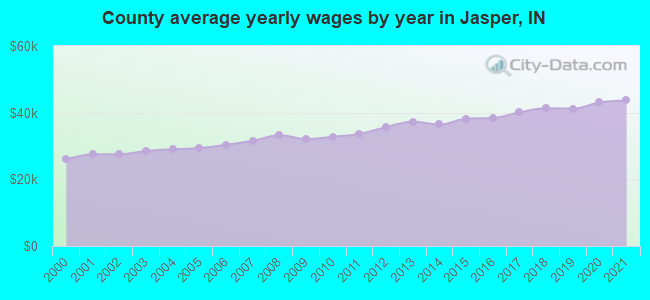
Estimated median household income in 2022: $77,327 ($43,369 in 1999)
| This county: | $77,327 |
| Indiana: | $66,785 |
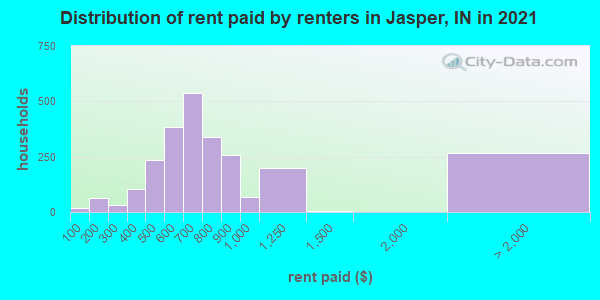
Median contract rent in 2022 for apartments: $705 (lower quartile is $584, upper quartile is $910)
| This county: | $705 |
| State: | $780 |
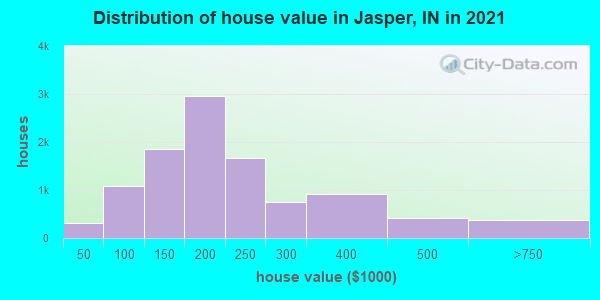
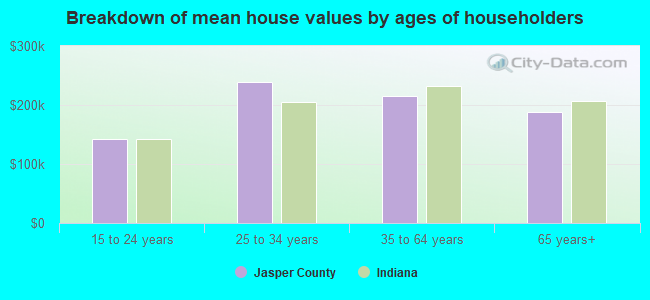
Estimated median house or condo value in 2022: $216,771 (it was $106,200 in 2000)
| Jasper: | $216,771 |
| Indiana: | $208,700 |
Median monthly housing costs for homes and condos with a mortgage: $1,297
Median monthly housing costs for units without a mortgage: $399
Institutionalized population: 338
Crime in 1989 (reported by the sheriff's office or county police, not the county total):
- Murders: 0
- Rapes: 0
- Robberies: 0
- Assaults: 0
- Burglaries: 6
- Thefts: 30
- Auto thefts: 0
Crime in 1988 (reported by the sheriff's office or county police, not the county total):
- Murders: 0
- Rapes: 0
- Robberies: 1
- Assaults: 2
- Burglaries: 26
- Thefts: 114
- Auto thefts: 0
Health of residents in Jasper County based on CDC Behavioral Risk Factor Surveillance System Survey Questionnaires from 2013 to 2021:
General health status score of residents in this county from 1 (poor) to 5 (excellent) is 3.5. This is about average.73.0% of residents exercised in the past month. This is about average.
40.5% of residents smoked 100+ cigarettes in their lives. This is less than average.
58.1% of adult residents drank alcohol in the past 30 days. This is less than average.
68.0% of residents visited a dentist within the past year. This is about average.
Average weight of males is 197 pounds. This is about average.
Average weight of females is 164 pounds. This is about average.
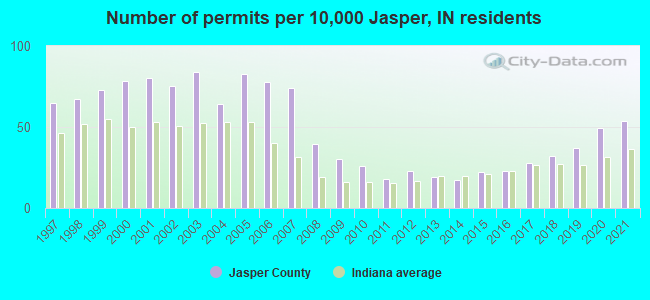
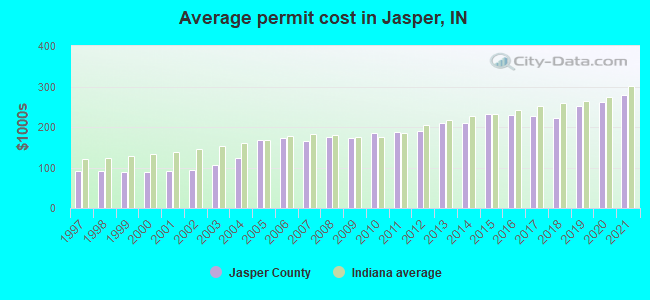
Single-family new house construction building permits:
- 2022: 84 buildings, average cost: $311,300
- 2021: 161 buildings, average cost: $278,800
- 2020: 149 buildings, average cost: $262,200
- 2019: 112 buildings, average cost: $251,400
- 2018: 97 buildings, average cost: $222,500
- 2017: 84 buildings, average cost: $225,700
- 2016: 69 buildings, average cost: $228,500
- 2015: 66 buildings, average cost: $231,700
- 2014: 51 buildings, average cost: $208,500
- 2013: 58 buildings, average cost: $209,200
- 2012: 68 buildings, average cost: $190,700
- 2011: 54 buildings, average cost: $186,500
- 2010: 78 buildings, average cost: $185,100
- 2009: 91 buildings, average cost: $174,300
- 2008: 118 buildings, average cost: $174,800
- 2007: 223 buildings, average cost: $166,200
- 2006: 234 buildings, average cost: $172,300
- 2005: 248 buildings, average cost: $169,300
- 2004: 193 buildings, average cost: $123,000
- 2003: 252 buildings, average cost: $106,700
- 2002: 226 buildings, average cost: $93,400
- 2001: 241 buildings, average cost: $91,000
- 2000: 236 buildings, average cost: $88,600
- 1999: 218 buildings, average cost: $89,700
- 1998: 203 buildings, average cost: $92,000
- 1997: 194 buildings, average cost: $91,000
Median real estate property taxes paid for housing units with mortgages in 2022: $1,053 (0.5%)
Median real estate property taxes paid for housing units with no mortgage in 2022: $940 (0.5%)

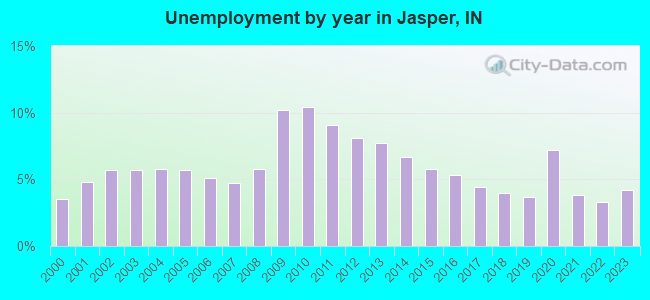
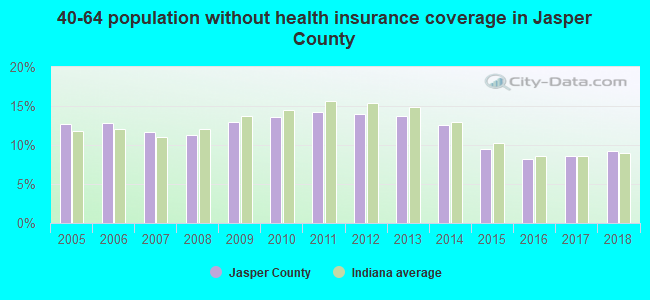
| Jasper County: | 7.7% |
| Indiana: | 12.6% |
Median age of residents in 2022: 41.6 years old
(Males: 40.2 years old, Females: 42.6 years old)
(Median age for: White residents: 43.4 years old, Black residents: 29.8 years old, American Indian residents: 38.6 years old, Asian residents: 29.1 years old, Hispanic or Latino residents: 30.3 years old, Other race residents: 30.9 years old)
Fair market rent in 2006 for a 1-bedroom apartment in Jasper County is $481 a month.
Fair market rent for a 2-bedroom apartment is $598 a month.
Fair market rent for a 3-bedroom apartment is $780 a month.
Cities in this county include: Rensselaer, De Motte, Remington, Collegeville, Wheatfield.
Neighboring counties: Dukes County, Massachusetts  , Cass County, Nebraska
  , Sussex County, New Jersey , La Salle County, Illinois , Wyandot County, Ohio .
| Here: | 3.0% |
| Indiana: | 2.8% |
Current college students: 1,392
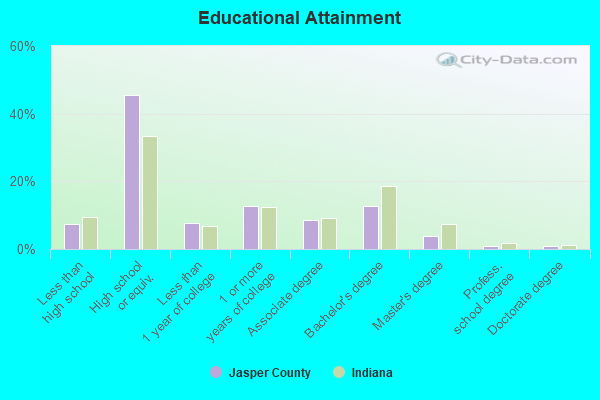
People 25 years of age or older with a high school degree or higher: 92.9%
People 25 years of age or older with a bachelor's degree or higher: 19.0%
Number of foreign born residents: 992 (47.7% naturalized citizens)
| Jasper County: | 3.0% |
| Whole state: | 6.1% |
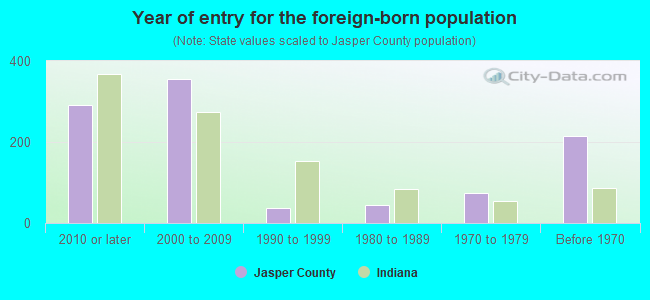
- Year of entry for the foreign-born population
- 3052010 or later
- 3782000 to 2009
- 531990 to 1999
- 451980 to 1989
- 731970 to 1979
- 214Before 1970
Mean travel time to work (commute): minutes
Percentage of county residents living and working in this county: 94.6%
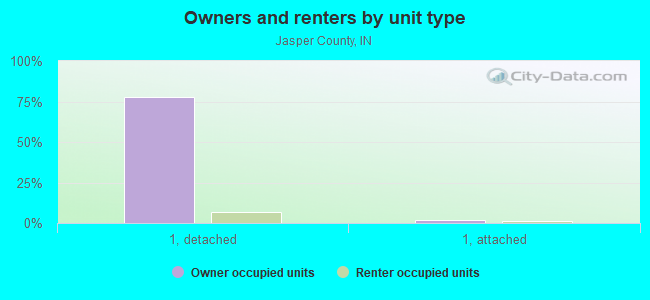
Housing units in structures:
- One, detached: 11,315
- One, attached: 435
- Two: 539
- 3 or 4: 392
- 5 to 9: 210
- 10 to 19: 57
- 20 to 49: 309
- 50 or more: 73
- Mobile homes: 459
- Boats, RVs, vans, etc.: 7
Housing units in Jasper County with a mortgage: 6,351 (553 second mortgage, 39 home equity loan, 443 both second mortgage and home equity loan)
Houses without a mortgage: 168
| Here: | 3.4% with mortgage |
| State: | 96.6% with mortgage |
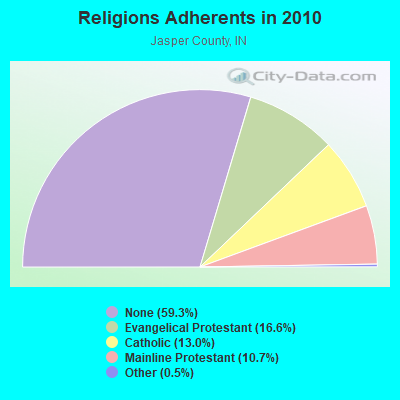
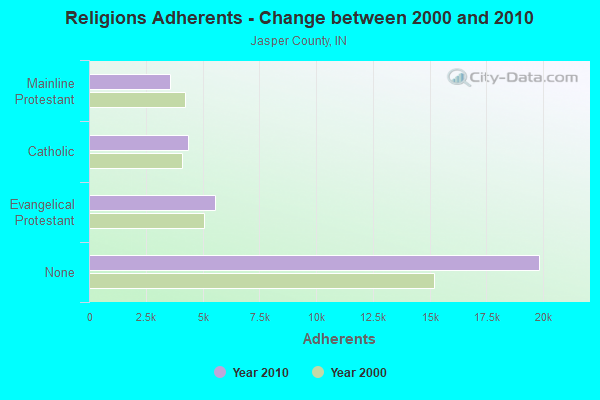
Religion statistics for Jasper County
| Religion | Adherents | Congregations |
|---|---|---|
| Evangelical Protestant | 5,554 | 43 |
| Catholic | 4,341 | 4 |
| Mainline Protestant | 3,587 | 10 |
| Other | 155 | 2 |
| None | 19,841 | - |
Source: Clifford Grammich, Kirk Hadaway, Richard Houseal, Dale E.Jones, Alexei Krindatch, Richie Stanley and Richard H.Taylor. 2012. 2010 U.S.Religion Census: Religious Congregations & Membership Study. Association of Statisticians of American Religious Bodies. Jones, Dale E., et al. 2002. Congregations and Membership in the United States 2000. Nashville, TN: Glenmary Research Center.
Food Environment Statistics:
| Jasper County: | 1.86 / 10,000 pop. |
| State: | 1.73 / 10,000 pop. |
| Jasper County: | 5.59 / 10,000 pop. |
| Indiana: | 3.57 / 10,000 pop. |
| This county: | 8.07 / 10,000 pop. |
| State: | 6.78 / 10,000 pop. |
| Jasper County: | 8.6% |
| Indiana: | 9.2% |
| Jasper County: | 28.6% |
| State: | 29.0% |
| Here: | 16.5% |
| State: | 14.3% |
Agriculture in Jasper County:
Average size of farms: 437 acresAverage value of agricultural products sold per farm: $207,341
Average value of crops sold per acre for harvested cropland: $286.72
The value of nursery, greenhouse, floriculture, and sod as a percentage of the total market value of agricultural products sold: 2.02%
The value of livestock, poultry, and their products as a percentage of the total market value of agricultural products sold: 45.85%
Average total farm production expenses per farm: $179,675
Harvested cropland as a percentage of land in farms: 89.53%
Irrigated harvested cropland as a percentage of land in farms: 8.21%
Average market value of all machinery and equipment per farm: $125,049
The percentage of farms operated by a family or individual: 84.24%
Average age of principal farm operators: 52 years
Average number of cattle and calves per 100 acres of all land in farms: 6.48
Milk cows as a percentage of all cattle and calves: 55.16%
Corn for grain: 133175 harvested acres
All wheat for grain: 1155 harvested acres
Soybeans for beans: 103723 harvested acres
Vegetables: 38 harvested acres
Earthquake activity:
Jasper County-area historical earthquake activity is significantly above Indiana state average. It is 47% greater than the overall U.S. average.On 4/18/2008 at 09:36:59, a magnitude 5.4 (5.1 MB, 4.8 MS, 5.4 MW, 5.2 MW, Class: Moderate, Intensity: VI - VII) earthquake occurred 182.2 miles away from Jasper County center
On 6/10/1987 at 23:48:54, a magnitude 5.1 (4.9 MB, 4.4 MS, 4.6 MS, 5.1 LG) earthquake occurred 157.4 miles away from the county center
On 4/18/2008 at 09:36:59, a magnitude 5.2 (5.2 MW, Depth: 8.9 mi) earthquake occurred 182.2 miles away from the county center
On 6/18/2002 at 17:37:15, a magnitude 5.0 (4.3 MB, 4.6 MW, 5.0 LG) earthquake occurred 212.7 miles away from the county center
On 4/18/2008 at 15:14:16, a magnitude 4.8 (4.5 MB, 4.8 MW, 4.6 MW, Class: Light, Intensity: IV - V) earthquake occurred 180.1 miles away from Jasper County center
On 7/27/1980 at 18:52:21, a magnitude 5.2 (5.1 MB, 4.7 MS, 5.0 UK, 5.2 UK) earthquake occurred 258.6 miles away from the county center
Magnitude types: regional Lg-wave magnitude (LG), body-wave magnitude (MB), surface-wave magnitude (MS), moment magnitude (MW)
Most recent natural disasters:
- Indiana Covid-19 Pandemic, Incident Period: January 31, 2020, FEMA Id: 4515, Natural disaster type: Other
- Indiana Severe Storms And Flooding, Incident Period: February 14, 2018 - March 4, 2018, FEMA Id: 4363, Natural disaster type: Storm, Flood
- Indiana Severe Winter Storm and Snowstorm, Incident Period: January 05, 2014 to January 09, 2014, Major Disaster (Presidential) Declared DR-4173: April 22, 2014, FEMA Id: 4173, Natural disaster type: Snowstorm, Winter Storm
- Indiana Severe Storms, Tornadoes, and Flooding, Incident Period: March 08, 2009 to March 14, 2009, Major Disaster (Presidential) Declared DR-1832: April 22, 2009, FEMA Id: 1832, Natural disaster type: Storm, Tornado, Flood
- Indiana Severe Storms and Flooding, Incident Period: September 12, 2008 to October 06, 2008, Major Disaster (Presidential) Declared DR-1795: September 23, 2008, FEMA Id: 1795, Natural disaster type: Storm, Flood
- Indiana Severe Storms and Flooding, Incident Period: January 07, 2008 to March 14, 2008, Major Disaster (Presidential) Declared DR-1740: January 30, 2008, FEMA Id: 1740, Natural disaster type: Storm, Flood
- Indiana Snow, Incident Period: February 12, 2007 to February 14, 2007, Emergency Declared EM-3274: March 12, 2007, FEMA Id: 3274, Natural disaster type: Snow
- Indiana Hurricane Katrina Evacuation, Incident Period: August 29, 2005 to October 01, 2005, Emergency Declared EM-3238: September 10, 2005, FEMA Id: 3238, Natural disaster type: Hurricane
- Indiana Severe Winter Storms and Flooding, Incident Period: January 01, 2005 to February 11, 2005, Major Disaster (Presidential) Declared DR-1573: January 21, 2005, FEMA Id: 1573, Natural disaster type: Winter Storm, Flood
- Indiana Severe Storms, Tornadoes, and Flooding, Incident Period: May 25, 2004 to June 25, 2004, Major Disaster (Presidential) Declared DR-1520: June 03, 2004, FEMA Id: 1520, Natural disaster type: Storm, Tornado, Flood
- 6 other natural disasters have been reported since 1953.
The number of natural disasters in Jasper County (16) is near the US average (15).
Major Disasters (Presidential) Declared: 10
Emergencies Declared: 4
Causes of natural disasters: Floods: 8, Storms: 8, Winter Storms: 5, Tornadoes: 3, Hurricane: 1, Ice Storm: 1, Snow: 1, Snowstorm: 1, Other: 1 (Note: some incidents may be assigned to more than one category).
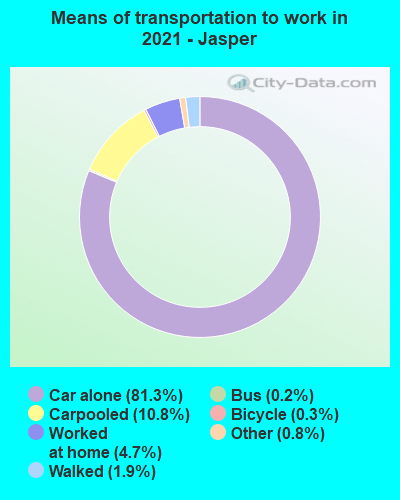
Means of transportation to work:
- Drove a car alone: 9,512 (78.0%)
- Carpooled: 1,430 (11.7%)
- Bus: 21 (0.2%)
- Taxicab, motorcycle, or other means: 46 (0.4%)
- Bicycle: 34 (0.3%)
- Walked: 144 (1.2%)
- Worked at home: 917 (7.5%)
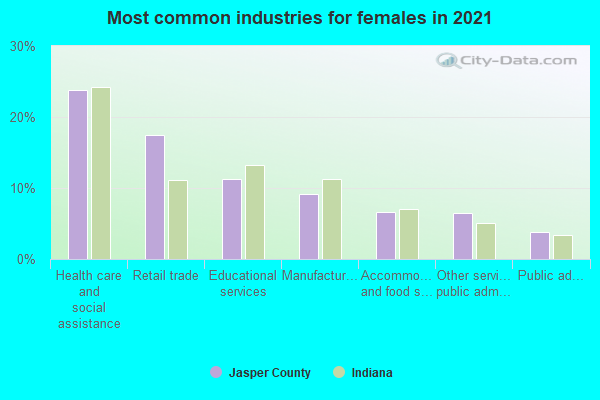
- Health care and social assistance (21%)
- Retail trade (12%)
- Educational services (9%)
- Manufacturing (7%)
- Accommodation and food services (5%)
- Other services, except public administration (4%)
- Professional, scientific, and technical services (4%)
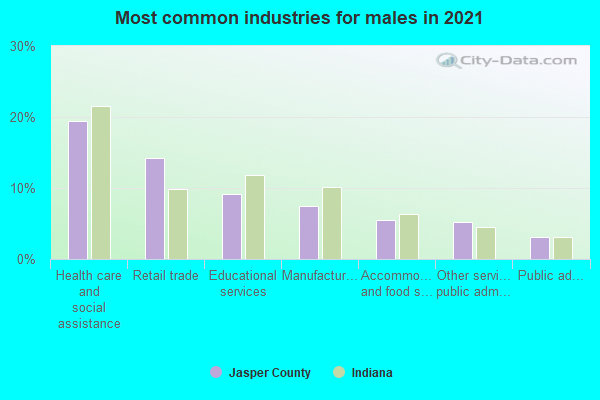
- Health care and social assistance (26%)
- Retail trade (15%)
- Educational services (11%)
- Manufacturing (9%)
- Accommodation and food services (6%)
- Other services, except public administration (5%)
- Professional, scientific, and technical services (4%)
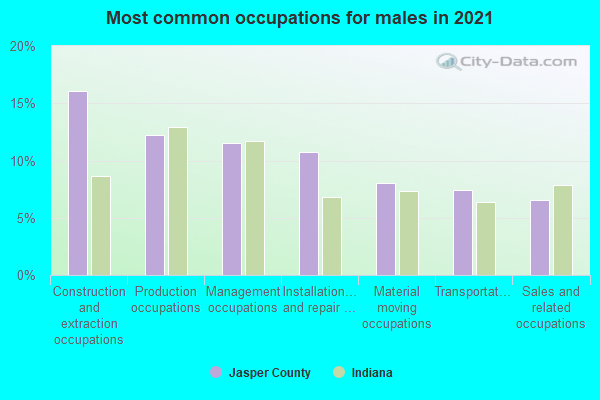
- Construction and extraction occupations (15%)
- Production occupations (13%)
- Management occupations (13%)
- Installation, maintenance, and repair occupations (10%)
- Sales and related occupations (9%)
- Transportation occupations (8%)
- Material moving occupations (6%)
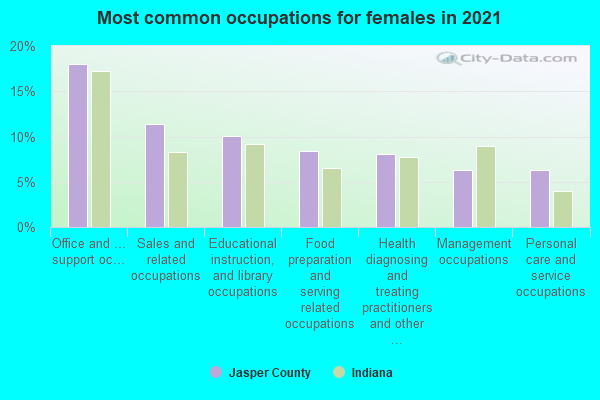
- Office and administrative support occupations (18%)
- Sales and related occupations (11%)
- Health diagnosing and treating practitioners and other technical occupations (9%)
- Educational instruction, and library occupations (9%)
- Management occupations (8%)
- Food preparation and serving related occupations (7%)
- Business and financial operations occupations (6%)
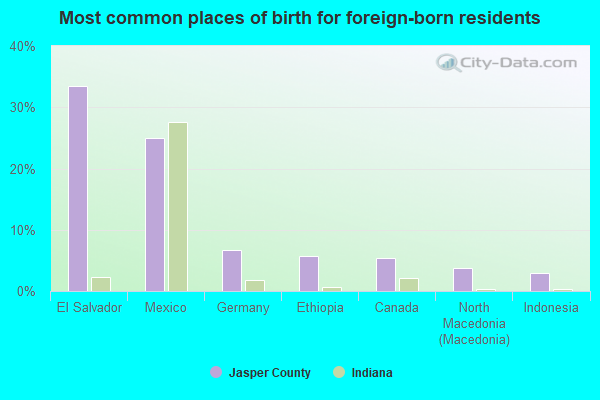
- Mexico (36%)
- El Salvador (21%)
- Germany (7%)
- Ethiopia (7%)
- Canada (5%)
- Honduras (3%)
- Colombia (3%)
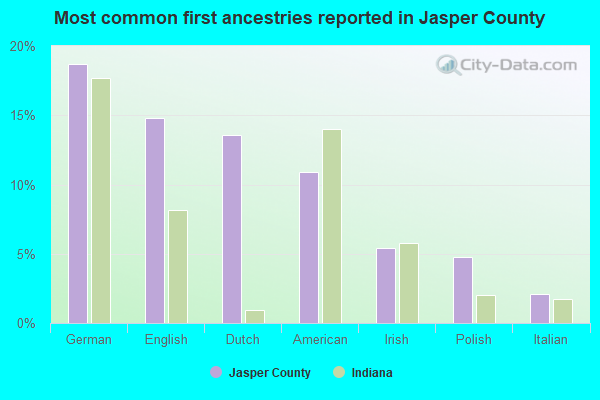
- German (18%)
- Dutch (14%)
- American (14%)
- English (11%)
- Irish (8%)
- Polish (4%)
- European (2%)
People in group quarters in Jasper County, Indiana in 2010:
- 588 people in college/university student housing
- 171 people in nursing facilities/skilled-nursing facilities
- 76 people in local jails and other municipal confinement facilities
- 72 people in residential treatment centers for juveniles (non-correctional)
- 19 people in correctional residential facilities
People in group quarters in Jasper County, Indiana in 2000:
- 654 people in college dormitories (includes college quarters off campus)
- 199 people in nursing homes
- 71 people in homes for abused, dependent, and neglected children
- 36 people in local jails and other confinement facilities (including police lockups)
- 23 people in other types of correctional institutions
- 3 people in religious group quarters
- 2 people in other noninstitutional group quarters
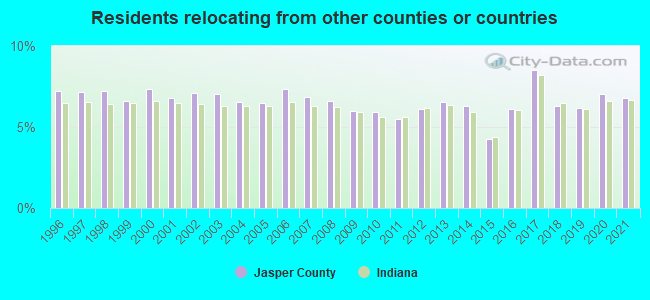
6.80% of this county's 2021 resident taxpayers lived in other counties in 2020 ($53,134 average adjusted gross income)
| Here: | 6.80% |
| Indiana average: | 6.66% |
10 or fewer of this county's residents moved from foreign countries.
4.94% relocated from other counties in Indiana ($37,113 average AGI)
1.85% relocated from other states ($16,021 average AGI)
Jasper County: 1.85% Indiana average: 2.58%
Top counties from which taxpayers relocated into this county between 2020 and 2021:
| from Lake County, IN | |
| from Porter County, IN | |
| from Newton County, IN | |
| from Cook County, IL | |
| from White County, IN | |
| from Tippecanoe County, IN | |
| from Pulaski County, IN |
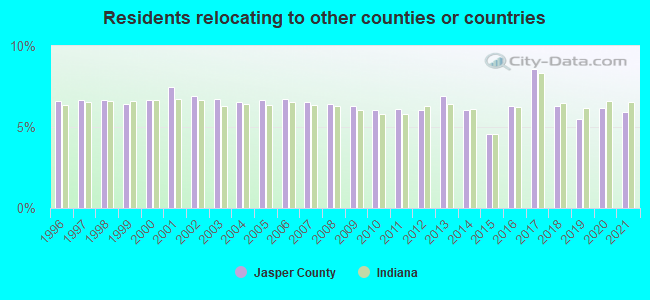
5.92% of this county's 2020 resident taxpayers moved to other counties in 2021 ($49,598 average adjusted gross income)
| Here: | 5.92% |
| Indiana average: | 6.55% |
10 or fewer of this county's residents moved to foreign countries.
4.33% relocated to other counties in Indiana ($35,246 average AGI)
1.59% relocated to other states ($14,352 average AGI)
Jasper County: 1.59% Indiana average: 2.46%
Top counties to which taxpayers relocated from this county between 2020 and 2021:
| to Lake County, IN | |
| to Newton County, IN | |
| to Porter County, IN | |
| to Tippecanoe County, IN | |
| to Pulaski County, IN | |
| to White County, IN | |
| to LaPorte County, IN |
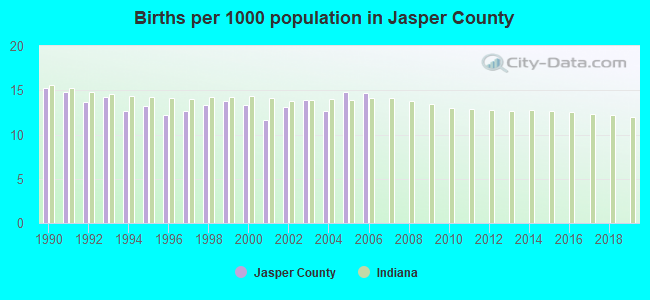
Births per 1000 population from 1990 to 1999: 13.6
Births per 1000 population from 2000 to 2006: 13.4
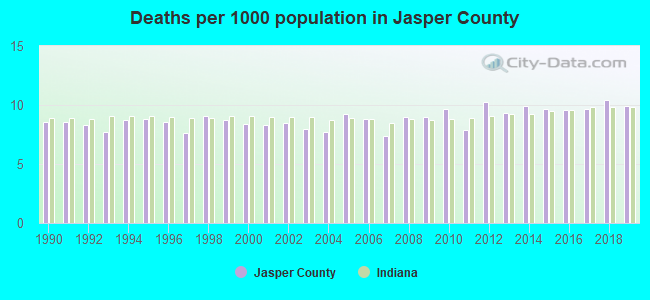
Deaths per 1000 population from 1990 to 1999: 8.5
Deaths per 1000 population from 2000 to 2009: 8.4
Deaths per 1000 population from 2010 to 2020: 9.9
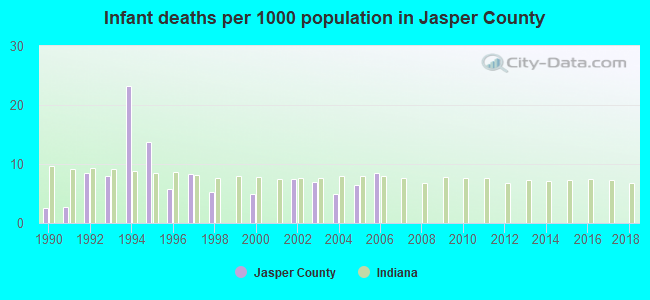
Infant deaths per 1000 live births from 1990 to 1999: 7.8
Infant deaths per 1000 live births from 2000 to 2006: 5.6
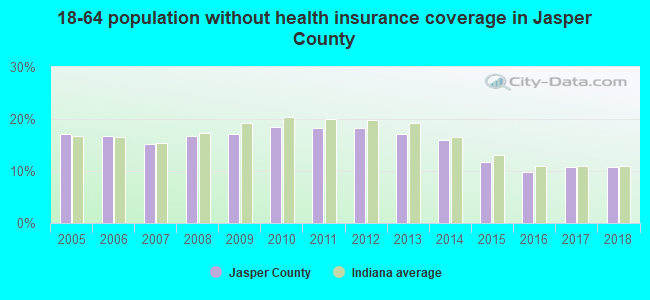
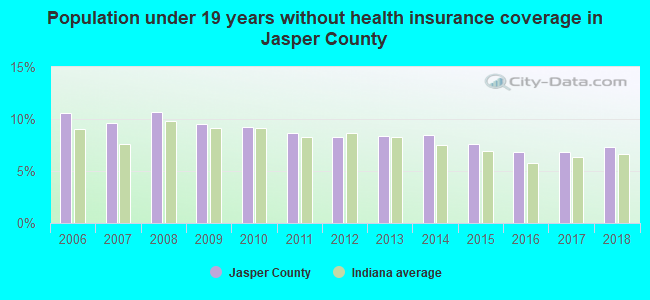
Persons under 19 years old without health insurance coverage in 2018: 7.3%
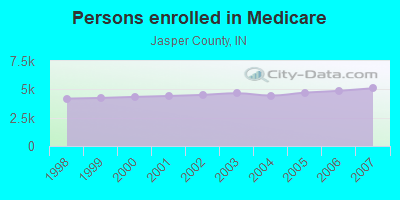
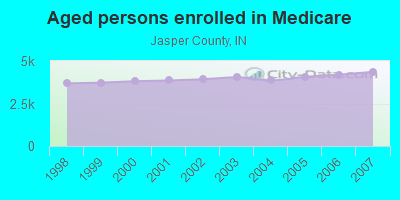
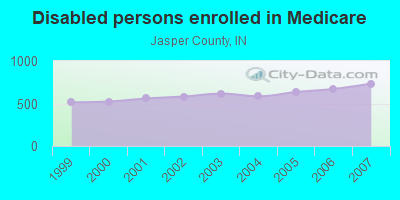
Persons enrolled in hospital insurance and/or supplemental medical insurance (Medicare) in July 1, 2007: 5,094 (4,360 aged, 734 disabled)
Children under 18 without health insurance coverage in 2007: 763 (9%)
Most common underlying causes of death in Jasper County, Indiana in 1999 - 2019:
- Acute myocardial infarction, unspecified (652)
- Bronchus or lung, unspecified - Malignant neoplasms (479)
- Atherosclerotic heart disease (326)
- Chronic obstructive pulmonary disease, unspecified (206)
- Congestive heart failure (158)
- Stroke, not specified as haemorrhage or infarction (144)
- Unspecified dementia (143)
- Alzheimer disease, unspecified (33)
- Senile degeneration of brain, not elsewhere classified (32)
- Septicaemia, unspecified (26)
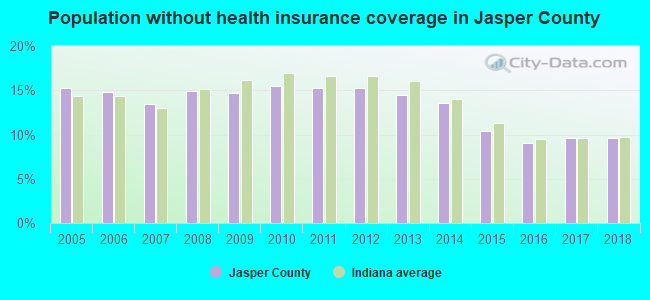
Population without health insurance coverage in 2000: 11%
Children under 18 without health insurance coverage in 2000: 8%
Short term general hospital admissions per 100,000 population in 2004: 4,965
Short term general hospital beds per 100,000 population in 2004: 209
Emergency room visits per 100,000 population in 2004: 23,963
General practice office based MDs per 100,000 population in 2005: 1,293
Medical specialist MDs per 100,000 population in 2005: 769
Dentists per 100,000 population in 1998: 9
Total births per 100,000 population, July 2005 - July 2006 : 24
Total deaths per 100,000 population, July 2005 - July 2006: 78
Limited-service eating places per 100,000 population in 2005 : 9
Suicides per 1,000,000 population from 2000 to 2006: 106.7. This is less than state average.
Household type by relationship:
Households: 33,281- Male householders: 6,466 (1,436 living alone), Female householders: 6,431 (2,012 living alone)
7,060 spouses (7,030 opposite-sex spouses), 975 unmarried partners, (940 opposite-sex unmarried partners), 9,972 children (8,903 natural, 541 adopted, 534 stepchildren), 476 grandchildren, 150 brothers or sisters, 164 parents, 9 foster children, 435 other relatives, 544 non-relatives
- In group quarters: 648
Size of family households: 4,317 2-persons, 1,706 3-persons, 1,883 4-persons, 602 5-persons, 237 6-persons, 184 7-or-more-persons.
Size of nonfamily households: 3,451 1-person, 491 2-persons, 11 3-persons.
5,381 married couples with children.
1,641 single-parent households (675 men, 966 women).
95.6% of residents of Jasper speak English at home.
3.3% of residents speak Spanish at home (62% speak English very well, 18% speak English well, 15% speak English not well, 6% don't speak English at all).
0.4% of residents speak other Indo-European language at home (87% speak English very well, 2% speak English well, 11% speak English not well).
0.1% of residents speak Asian or Pacific Island language at home (37% speak English very well, 63% speak English well).
0.1% of residents speak other language at home (67% speak English very well, 33% speak English well).
In fiscal year 2004:
Federal Government expenditure: $140,307,000 ($4,437 per capita)
Department of Defense expenditure: $2,780,000
Federal direct payments to individuals for retirement and disability: $73,383,000
Federal other direct payments to individuals: $30,969,000
Federal direct payments not to individuals: $15,003,000
Federal grants: $12,060,000
Federal procurement contracts: $3,298,000 ($804,000 Department of Defense)
Federal salaries and wages: $5,594,000 ($716,000 Department of Defense)
Federal Government direct loans: $1,967,000
Federal guaranteed/insured loans: $21,051,000
Federal Government insurance: $61,289,000
Population change from April 1, 2000 to July 1, 2005:
Births: 2,103| Here: | 66 per 1000 residents |
| State: | 72 per 1000 residents |
Deaths: 1,334
| Here: | 42 per 1000 residents |
| State: | 47 per 1000 residents |
Net international migration: +71
| Here: | +2 per 1000 residents |
| State: | +9 per 1000 residents |
Net internal migration: +1,036
| Here: | |
| State: |
Total withdrawal of fresh water for public supply: 1.04 millions of gallons per day (all from ground)
| Here: | 6.4 |
| State: | 6.6 |
| Here: | 4.6 |
| State: | 4.3 |
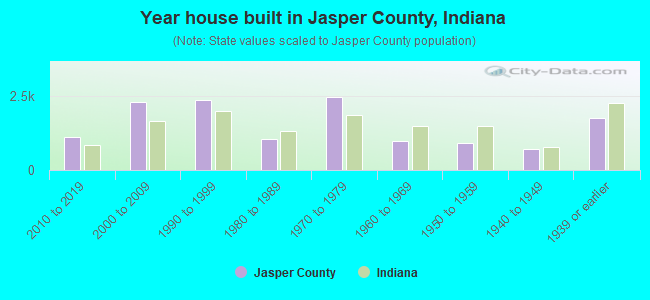
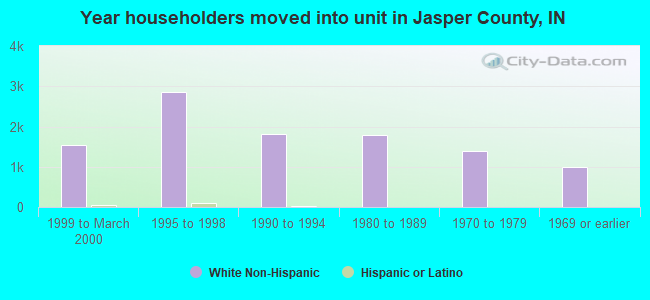
- Year house built in Jasper County, Indiana
- 162020 or later
- 1,2222010 to 2019
- 2,6352000 to 2009
- 2,5891990 to 1999
- 1,0631980 to 1989
- 2,1931970 to 1979
- 9821960 to 1969
- 8561950 to 1959
- 5741940 to 1949
- 1,5631939 or earlier
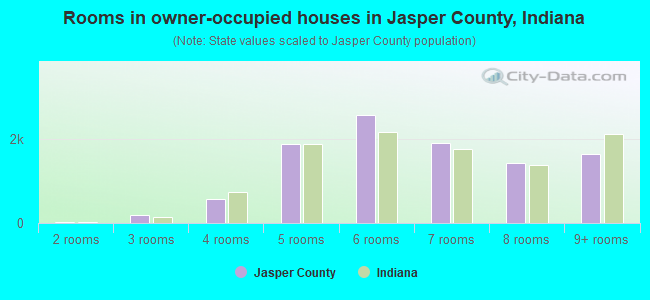
- Rooms in owner-occupied houses in Jasper County, Indiana
- 01 room
- 292 rooms
- 1353 rooms
- 6024 rooms
- 1,9705 rooms
- 2,7116 rooms
- 2,1367 rooms
- 1,3878 rooms
- 1,5679+ rooms
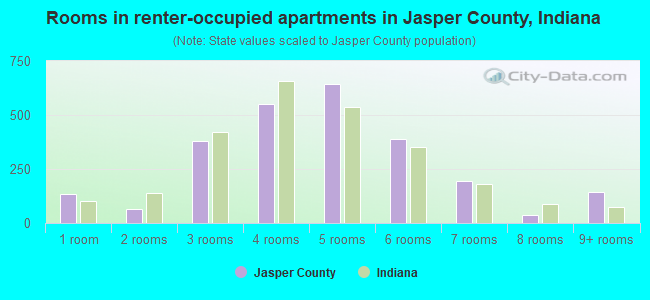
- Rooms in renter-occupied apartments in Jasper County, Indiana
- 1601 room
- 652 rooms
- 3553 rooms
- 4964 rooms
- 6245 rooms
- 3276 rooms
- 1107 rooms
- 178 rooms
- 1949+ rooms
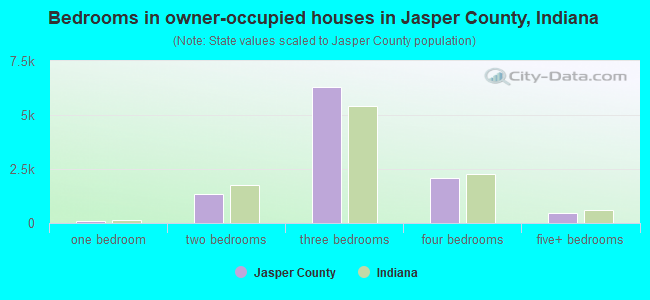
- Bedrooms in owner-occupied houses in Jasper County, Indiana
- 0no bedroom
- 691 bedroom
- 1,3662 bedrooms
- 6,5413 bedrooms
- 2,1884 bedrooms
- 3955+ bedrooms
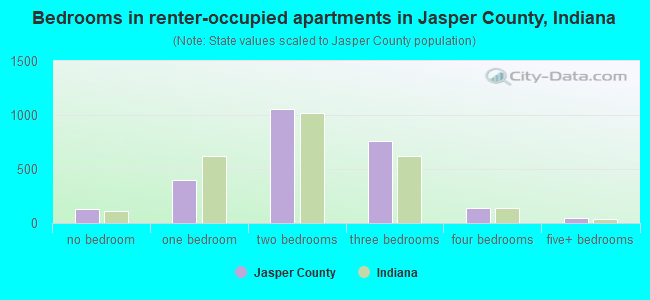
- Bedrooms in renter-occupied apartments in Jasper County, Indiana
- 166no bedroom
- 3591 bedroom
- 1,0492 bedrooms
- 6113 bedrooms
- 1504 bedrooms
- 285+ bedrooms
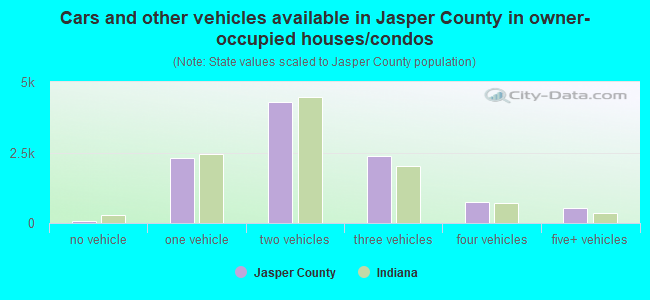
- Cars and other vehicles available in Jasper County in owner-occupied houses/condos
- 111no vehicle
- 2,4871 vehicle
- 3,9712 vehicles
- 2,5173 vehicles
- 8624 vehicles
- 5645+ vehicles
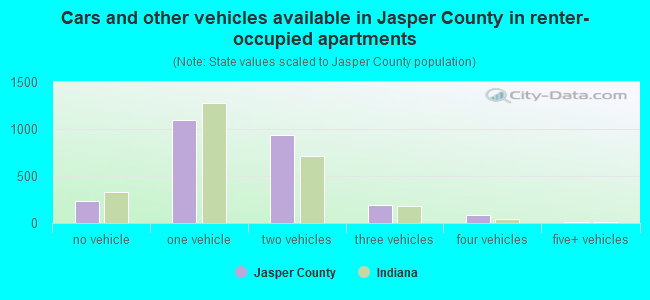
- Cars and other vehicles available in Jasper County in renter-occupied apartments
- 275no vehicle
- 1,0171 vehicle
- 7432 vehicles
- 1923 vehicles
- 1154 vehicles
- 135+ vehicles
92.9% of Jasper County residents lived in the same house 1 years ago.
Out of people who lived in different houses, 32% lived in this county.
Out of people who lived in different counties, 50% lived in Indiana.
| Jasper County: | 92.9% |
| State average: | 87.1% |
Place of birth for U.S.-born residents:
- This state: 23,360
- Other state: 8,760
- Northeast: 533
- Midwest: 6,118
- South: 1,544
- West: 590
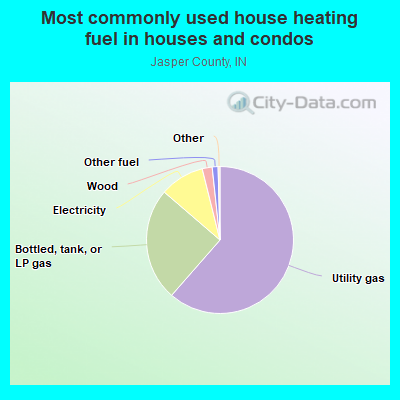
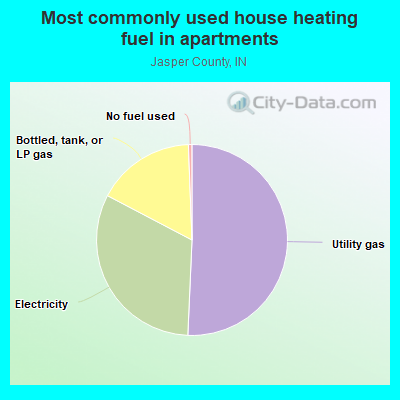
- 65.2%Utility gas
- 23.0%Bottled, tank, or LP gas
- 9.2%Electricity
- 1.5%Wood
- 0.8%Other fuel
- 0.4%No fuel used
- 50.5%Utility gas
- 30.5%Electricity
- 18.4%Bottled, tank, or LP gas
- 0.5%Fuel oil, kerosene, etc.
Private vs. public school enrollment:
| Here: | 20.2% |
| Indiana: | 14.9% |
| Here: | 17.0% |
| Indiana: | 11.4% |
| Here: | 30.3% |
| Indiana: | 22.3% |
Jasper County government finances - Expenditure in 2020:
- Bond Funds - Cash and Securities: $7,107,000
Cash and Securities: $6,935,000
- Charges - Other: $770,000
Other: $749,000
Air Transportation: $275,000
Air Transportation: $204,000
- Construction - General - Other: $701,000
General - Other: $483,000
Regular Highways: $427,000
Air Transportation: $228,000
Regular Highways: $189,000
Police Protection: $70,000
Air Transportation: $26,000
Correctional Institutions: $13,000
- Current Operations - General - Other: $38,134,000
Regular Highways: $5,948,000
Central Staff Services: $5,743,000
General - Other: $5,288,000
Central Staff Services: $4,907,000
Regular Highways: $2,997,000
Police Protection: $2,854,000
Police Protection: $2,697,000
Libraries: $2,693,000
Judicial and Legal Services: $2,479,000
Judicial and Legal Services: $2,312,000
Correctional Institutions: $1,437,000
Health - Other: $1,114,000
Health - Other: $1,082,000
Correctional Institutions: $1,064,000
Financial Administration: $763,000
Natural Resources - Other: $700,000
Financial Administration: $670,000
Air Transportation: $585,000
Corrections - Other: $521,000
Natural Resources - Other: $477,000
Corrections - Other: $407,000
Air Transportation: $221,000
Parks and Recreation: $186,000
Sewerage: $47,000
Sewerage: $47,000
General Public Buildings: $25,000
General Public Buildings: $19,000
- Federal Intergovernmental - Highways: $618,000
Air Transportation: $450,000
Air Transportation: $129,000
General Local Government Support: $5,000
- Intergovernmental to Local - Other - Central Staff Services: $120,409,000
Other - Air Transportation: $18,000
- Intergovernmental to State - Air Transportation: $20,000
Air Transportation: $15,000
- Local Intergovernmental - Highways: $622,000
Highways: $454,000
- Long Term Debt - Beginning Outstanding - Public Debt for Private Purpose: $53,305,000
Outstanding Nonguaranteed - Industrial Revenue: $48,305,000
Beginning Outstanding - Public Debt for Private Purpose: $43,305,000
Outstanding Nonguaranteed - Industrial Revenue: $38,305,000
Retired Nonguaranteed - Public Debt for Private Purpose: $5,000,000
Retired Nonguaranteed - Public Debt for Private Purpose: $5,000,000
Beginning Outstanding - Unspecified Public Purpose: $840,000
Outstanding Unspecified Public Purpose: $840,000
Outstanding Unspecified Public Purpose: $383,000
Beginning Outstanding - Unspecified Public Purpose: $383,000
- Miscellaneous - Fines and Forfeits: $3,340,000
Fines and Forfeits: $3,104,000
Interest Earnings: $1,207,000
General Revenue - Other: $502,000
General Revenue - Other: $361,000
Sale of Property: $331,000
Interest Earnings: $240,000
Donations From Private Sources: $11,000
Rents: $6,000
Donations From Private Sources: $6,000
Rents: $4,000
Special Assessments: $1,000
- Other Capital Outlay - Air Transportation: $1,253,000
Regular Highways: $663,000
General - Other: $587,000
Judicial and Legal Services: $102,000
Air Transportation: $92,000
Corrections - Other: $57,000
Police Protection: $18,000
Police Protection: $16,000
Corrections - Other: $15,000
General - Other: $6,000
Health - Other: $6,000
Central Staff Services: $5,000
Central Staff Services: $4,000
Judicial and Legal Services: $3,000
Health - Other: $2,000
Natural Resources - Other: $1,000
- Other Funds - Cash and Securities: $45,476,000
Cash and Securities: $43,487,000
- Short Term Debt Outstanding - Beginning: $840,000
End of Fiscal Year: $840,000
- Sinking Funds - Cash and Securities: $48,372,000
Cash and Securities: $38,372,000
- State Intergovernmental - Other: $23,137,000
Other: $22,148,000
Highways: $7,511,000
General Local Government Support: $5,888,000
General Local Government Support: $5,267,000
Highways: $4,616,000
Health and Hospitals: $32,000
Public Welfare: $18,000
- Tax - Property: $42,198,000
Property: $7,835,000
Motor Vehicle License: $6,988,000
Public Utilities Sales: $524,000
Public Utilities Sales: $502,000
Other Selective Sales: $205,000
Other Selective Sales: $186,000
Other: $179,000
Other: $162,000
Other License: $156,000
Other License: $121,000
- Total Salaries and Wages: $8,610,000
: $63,000
Jasper County government finances - Revenue in 2020:
- Bond Funds - Cash and Securities: $7,107,000
Cash and Securities: $6,935,000
- Charges - Other: $770,000
Other: $749,000
Air Transportation: $275,000
Air Transportation: $204,000
- Construction - General - Other: $701,000
General - Other: $483,000
Regular Highways: $427,000
Air Transportation: $228,000
Regular Highways: $189,000
Police Protection: $70,000
Air Transportation: $26,000
Correctional Institutions: $13,000
- Current Operations - General - Other: $38,134,000
Regular Highways: $5,948,000
Central Staff Services: $5,743,000
General - Other: $5,288,000
Central Staff Services: $4,907,000
Regular Highways: $2,997,000
Police Protection: $2,854,000
Police Protection: $2,697,000
Libraries: $2,693,000
Judicial and Legal Services: $2,479,000
Judicial and Legal Services: $2,312,000
Correctional Institutions: $1,437,000
Health - Other: $1,114,000
Health - Other: $1,082,000
Correctional Institutions: $1,064,000
Financial Administration: $763,000
Natural Resources - Other: $700,000
Financial Administration: $670,000
Air Transportation: $585,000
Corrections - Other: $521,000
Natural Resources - Other: $477,000
Corrections - Other: $407,000
Air Transportation: $221,000
Parks and Recreation: $186,000
Sewerage: $47,000
Sewerage: $47,000
General Public Buildings: $25,000
General Public Buildings: $19,000
- Federal Intergovernmental - Highways: $618,000
Air Transportation: $450,000
Air Transportation: $129,000
General Local Government Support: $5,000
- Intergovernmental to Local - Other - Central Staff Services: $120,409,000
Other - Air Transportation: $18,000
- Intergovernmental to State - Air Transportation: $20,000
Air Transportation: $15,000
- Local Intergovernmental - Highways: $622,000
Highways: $454,000
- Long Term Debt - Beginning Outstanding - Public Debt for Private Purpose: $53,305,000
Outstanding Nonguaranteed - Industrial Revenue: $48,305,000
Beginning Outstanding - Public Debt for Private Purpose: $43,305,000
Outstanding Nonguaranteed - Industrial Revenue: $38,305,000
Retired Nonguaranteed - Public Debt for Private Purpose: $5,000,000
Retired Nonguaranteed - Public Debt for Private Purpose: $5,000,000
Beginning Outstanding - Unspecified Public Purpose: $840,000
Outstanding Unspecified Public Purpose: $840,000
Outstanding Unspecified Public Purpose: $383,000
Beginning Outstanding - Unspecified Public Purpose: $383,000
- Miscellaneous - Fines and Forfeits: $3,340,000
Fines and Forfeits: $3,104,000
Interest Earnings: $1,207,000
General Revenue - Other: $502,000
General Revenue - Other: $361,000
Sale of Property: $331,000
Interest Earnings: $240,000
Donations From Private Sources: $11,000
Rents: $6,000
Donations From Private Sources: $6,000
Rents: $4,000
Special Assessments: $1,000
- Other Capital Outlay - Air Transportation: $1,253,000
Regular Highways: $663,000
General - Other: $587,000
Judicial and Legal Services: $102,000
Air Transportation: $92,000
Corrections - Other: $57,000
Police Protection: $18,000
Police Protection: $16,000
Corrections - Other: $15,000
General - Other: $6,000
Health - Other: $6,000
Central Staff Services: $5,000
Central Staff Services: $4,000
Judicial and Legal Services: $3,000
Health - Other: $2,000
Natural Resources - Other: $1,000
- Other Funds - Cash and Securities: $45,476,000
Cash and Securities: $43,487,000
- Short Term Debt Outstanding - Beginning: $840,000
End of Fiscal Year: $840,000
- Sinking Funds - Cash and Securities: $48,372,000
Cash and Securities: $38,372,000
- State Intergovernmental - Other: $23,137,000
Other: $22,148,000
Highways: $7,511,000
General Local Government Support: $5,888,000
General Local Government Support: $5,267,000
Highways: $4,616,000
Health and Hospitals: $32,000
Public Welfare: $18,000
- Tax - Property: $42,198,000
Property: $7,835,000
Motor Vehicle License: $6,988,000
Public Utilities Sales: $524,000
Public Utilities Sales: $502,000
Other Selective Sales: $205,000
Other Selective Sales: $186,000
Other: $179,000
Other: $162,000
Other License: $156,000
Other License: $121,000
- Total Salaries and Wages: $8,610,000
: $63,000
Jasper County government finances - Debt in 2020:
- Bond Funds - Cash and Securities: $7,107,000
Cash and Securities: $6,935,000
- Charges - Other: $770,000
Other: $749,000
Air Transportation: $275,000
Air Transportation: $204,000
- Construction - General - Other: $701,000
General - Other: $483,000
Regular Highways: $427,000
Air Transportation: $228,000
Regular Highways: $189,000
Police Protection: $70,000
Air Transportation: $26,000
Correctional Institutions: $13,000
- Current Operations - General - Other: $38,134,000
Regular Highways: $5,948,000
Central Staff Services: $5,743,000
General - Other: $5,288,000
Central Staff Services: $4,907,000
Regular Highways: $2,997,000
Police Protection: $2,854,000
Police Protection: $2,697,000
Libraries: $2,693,000
Judicial and Legal Services: $2,479,000
Judicial and Legal Services: $2,312,000
Correctional Institutions: $1,437,000
Health - Other: $1,114,000
Health - Other: $1,082,000
Correctional Institutions: $1,064,000
Financial Administration: $763,000
Natural Resources - Other: $700,000
Financial Administration: $670,000
Air Transportation: $585,000
Corrections - Other: $521,000
Natural Resources - Other: $477,000
Corrections - Other: $407,000
Air Transportation: $221,000
Parks and Recreation: $186,000
Sewerage: $47,000
Sewerage: $47,000
General Public Buildings: $25,000
General Public Buildings: $19,000
- Federal Intergovernmental - Highways: $618,000
Air Transportation: $450,000
Air Transportation: $129,000
General Local Government Support: $5,000
- Intergovernmental to Local - Other - Central Staff Services: $120,409,000
Other - Air Transportation: $18,000
- Intergovernmental to State - Air Transportation: $20,000
Air Transportation: $15,000
- Local Intergovernmental - Highways: $622,000
Highways: $454,000
- Long Term Debt - Beginning Outstanding - Public Debt for Private Purpose: $53,305,000
Outstanding Nonguaranteed - Industrial Revenue: $48,305,000
Beginning Outstanding - Public Debt for Private Purpose: $43,305,000
Outstanding Nonguaranteed - Industrial Revenue: $38,305,000
Retired Nonguaranteed - Public Debt for Private Purpose: $5,000,000
Retired Nonguaranteed - Public Debt for Private Purpose: $5,000,000
Beginning Outstanding - Unspecified Public Purpose: $840,000
Outstanding Unspecified Public Purpose: $840,000
Outstanding Unspecified Public Purpose: $383,000
Beginning Outstanding - Unspecified Public Purpose: $383,000
- Miscellaneous - Fines and Forfeits: $3,340,000
Fines and Forfeits: $3,104,000
Interest Earnings: $1,207,000
General Revenue - Other: $502,000
General Revenue - Other: $361,000
Sale of Property: $331,000
Interest Earnings: $240,000
Donations From Private Sources: $11,000
Rents: $6,000
Donations From Private Sources: $6,000
Rents: $4,000
Special Assessments: $1,000
- Other Capital Outlay - Air Transportation: $1,253,000
Regular Highways: $663,000
General - Other: $587,000
Judicial and Legal Services: $102,000
Air Transportation: $92,000
Corrections - Other: $57,000
Police Protection: $18,000
Police Protection: $16,000
Corrections - Other: $15,000
General - Other: $6,000
Health - Other: $6,000
Central Staff Services: $5,000
Central Staff Services: $4,000
Judicial and Legal Services: $3,000
Health - Other: $2,000
Natural Resources - Other: $1,000
- Other Funds - Cash and Securities: $45,476,000
Cash and Securities: $43,487,000
- Short Term Debt Outstanding - Beginning: $840,000
End of Fiscal Year: $840,000
- Sinking Funds - Cash and Securities: $48,372,000
Cash and Securities: $38,372,000
- State Intergovernmental - Other: $23,137,000
Other: $22,148,000
Highways: $7,511,000
General Local Government Support: $5,888,000
General Local Government Support: $5,267,000
Highways: $4,616,000
Health and Hospitals: $32,000
Public Welfare: $18,000
- Tax - Property: $42,198,000
Property: $7,835,000
Motor Vehicle License: $6,988,000
Public Utilities Sales: $524,000
Public Utilities Sales: $502,000
Other Selective Sales: $205,000
Other Selective Sales: $186,000
Other: $179,000
Other: $162,000
Other License: $156,000
Other License: $121,000
- Total Salaries and Wages: $8,610,000
: $63,000
Jasper County government finances - Cash and Securities in 2020:
- Bond Funds - Cash and Securities: $7,107,000
Cash and Securities: $6,935,000
- Charges - Other: $770,000
Other: $749,000
Air Transportation: $275,000
Air Transportation: $204,000
- Construction - General - Other: $701,000
General - Other: $483,000
Regular Highways: $427,000
Air Transportation: $228,000
Regular Highways: $189,000
Police Protection: $70,000
Air Transportation: $26,000
Correctional Institutions: $13,000
- Current Operations - General - Other: $38,134,000
Regular Highways: $5,948,000
Central Staff Services: $5,743,000
General - Other: $5,288,000
Central Staff Services: $4,907,000
Regular Highways: $2,997,000
Police Protection: $2,854,000
Police Protection: $2,697,000
Libraries: $2,693,000
Judicial and Legal Services: $2,479,000
Judicial and Legal Services: $2,312,000
Correctional Institutions: $1,437,000
Health - Other: $1,114,000
Health - Other: $1,082,000
Correctional Institutions: $1,064,000
Financial Administration: $763,000
Natural Resources - Other: $700,000
Financial Administration: $670,000
Air Transportation: $585,000
Corrections - Other: $521,000
Natural Resources - Other: $477,000
Corrections - Other: $407,000
Air Transportation: $221,000
Parks and Recreation: $186,000
Sewerage: $47,000
Sewerage: $47,000
General Public Buildings: $25,000
General Public Buildings: $19,000
- Federal Intergovernmental - Highways: $618,000
Air Transportation: $450,000
Air Transportation: $129,000
General Local Government Support: $5,000
- Intergovernmental to Local - Other - Central Staff Services: $120,409,000
Other - Air Transportation: $18,000
- Intergovernmental to State - Air Transportation: $20,000
Air Transportation: $15,000
- Local Intergovernmental - Highways: $622,000
Highways: $454,000
- Long Term Debt - Beginning Outstanding - Public Debt for Private Purpose: $53,305,000
Outstanding Nonguaranteed - Industrial Revenue: $48,305,000
Beginning Outstanding - Public Debt for Private Purpose: $43,305,000
Outstanding Nonguaranteed - Industrial Revenue: $38,305,000
Retired Nonguaranteed - Public Debt for Private Purpose: $5,000,000
Retired Nonguaranteed - Public Debt for Private Purpose: $5,000,000
Beginning Outstanding - Unspecified Public Purpose: $840,000
Outstanding Unspecified Public Purpose: $840,000
Outstanding Unspecified Public Purpose: $383,000
Beginning Outstanding - Unspecified Public Purpose: $383,000
- Miscellaneous - Fines and Forfeits: $3,340,000
Fines and Forfeits: $3,104,000
Interest Earnings: $1,207,000
General Revenue - Other: $502,000
General Revenue - Other: $361,000
Sale of Property: $331,000
Interest Earnings: $240,000
Donations From Private Sources: $11,000
Rents: $6,000
Donations From Private Sources: $6,000
Rents: $4,000
Special Assessments: $1,000
- Other Capital Outlay - Air Transportation: $1,253,000
Regular Highways: $663,000
General - Other: $587,000
Judicial and Legal Services: $102,000
Air Transportation: $92,000
Corrections - Other: $57,000
Police Protection: $18,000
Police Protection: $16,000
Corrections - Other: $15,000
General - Other: $6,000
Health - Other: $6,000
Central Staff Services: $5,000
Central Staff Services: $4,000
Judicial and Legal Services: $3,000
Health - Other: $2,000
Natural Resources - Other: $1,000
- Other Funds - Cash and Securities: $45,476,000
Cash and Securities: $43,487,000
- Short Term Debt Outstanding - Beginning: $840,000
End of Fiscal Year: $840,000
- Sinking Funds - Cash and Securities: $48,372,000
Cash and Securities: $38,372,000
- State Intergovernmental - Other: $23,137,000
Other: $22,148,000
Highways: $7,511,000
General Local Government Support: $5,888,000
General Local Government Support: $5,267,000
Highways: $4,616,000
Health and Hospitals: $32,000
Public Welfare: $18,000
- Tax - Property: $42,198,000
Property: $7,835,000
Motor Vehicle License: $6,988,000
Public Utilities Sales: $524,000
Public Utilities Sales: $502,000
Other Selective Sales: $205,000
Other Selective Sales: $186,000
Other: $179,000
Other: $162,000
Other License: $156,000
Other License: $121,000
- Total Salaries and Wages: $8,610,000
: $63,000
Supplemental Security Income (SSI) in 2006:
- Total number of recipients: 285
- Number of aged recipients: 25
- Number of blind and disabled recipients: 260
- Number of recipients under 18: 49
- Number of recipients between 18 and 64: 203
- Number of recipients older than 64: 33
- Number of recipients also receiving OASDI: 95
- Amount of payments (thousands of dollars): 124
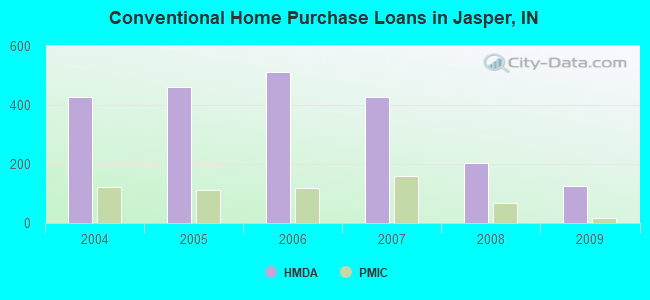
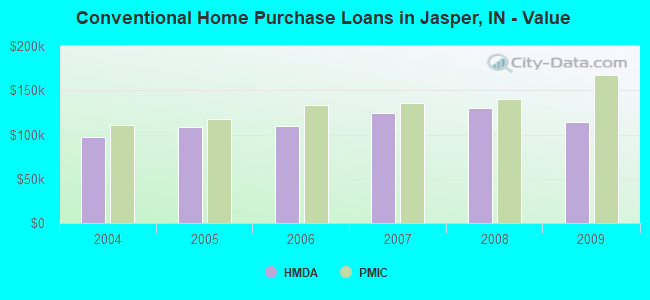
| Home Mortgage Disclosure Act Aggregated Statistics For Year 2009 (Based on 7 full tracts) | ||||||||||||
| A) FHA, FSA/RHS & VA Home Purchase Loans | B) Conventional Home Purchase Loans | C) Refinancings | D) Home Improvement Loans | F) Non-occupant Loans on < 5 Family Dwellings (A B C & D) | G) Loans On Manufactured Home Dwelling (A B C & D) | |||||||
|---|---|---|---|---|---|---|---|---|---|---|---|---|
| Number | Average Value | Number | Average Value | Number | Average Value | Number | Average Value | Number | Average Value | Number | Average Value | |
| LOANS ORIGINATED | 140 | $132,421 | 125 | $114,056 | 813 | $132,627 | 67 | $39,209 | 55 | $83,982 | 43 | $81,302 |
| APPLICATIONS APPROVED, NOT ACCEPTED | 8 | $125,625 | 7 | $181,286 | 73 | $139,521 | 7 | $46,571 | 2 | $69,000 | 3 | $96,333 |
| APPLICATIONS DENIED | 36 | $132,806 | 25 | $107,640 | 316 | $136,690 | 20 | $55,600 | 9 | $85,889 | 15 | $71,000 |
| APPLICATIONS WITHDRAWN | 6 | $119,000 | 16 | $116,438 | 136 | $139,449 | 11 | $91,818 | 1 | $189,000 | 2 | $116,500 |
| FILES CLOSED FOR INCOMPLETENESS | 10 | $111,400 | 4 | $105,250 | 48 | $147,958 | 5 | $88,600 | 2 | $83,000 | 4 | $96,250 |
| Private Mortgage Insurance Companies Aggregated Statistics For Year 2009 (Based on 6 full tracts) | ||||||
| A) Conventional Home Purchase Loans | B) Refinancings | D) Loans On Manufactured Home Dwelling (A & B) | ||||
|---|---|---|---|---|---|---|
| Number | Average Value | Number | Average Value | Number | Average Value | |
| LOANS ORIGINATED | 16 | $167,062 | 20 | $142,600 | 0 | $0 |
| APPLICATIONS APPROVED, NOT ACCEPTED | 12 | $169,333 | 10 | $200,500 | 0 | $0 |
| APPLICATIONS DENIED | 7 | $149,286 | 11 | $155,909 | 1 | $152,000 |
| APPLICATIONS WITHDRAWN | 1 | $198,000 | 3 | $141,000 | 0 | $0 |
| FILES CLOSED FOR INCOMPLETENESS | 0 | $0 | 1 | $242,000 | 0 | $0 |
| Most common first names in Jasper County, IN among deceased individuals | ||
| Name | Count | Lived (average) |
|---|---|---|
| John | 221 | 76.4 years |
| Mary | 150 | 79.6 years |
| Robert | 145 | 70.6 years |
| William | 126 | 74.4 years |
| James | 124 | 70.7 years |
| Charles | 109 | 75.0 years |
| George | 103 | 75.9 years |
| Helen | 79 | 81.9 years |
| Richard | 67 | 67.9 years |
| Ruth | 67 | 78.7 years |
| Most common last names in Jasper County, IN among deceased individuals | ||
| Last name | Count | Lived (average) |
|---|---|---|
| Smith | 53 | 74.8 years |
| Williams | 44 | 73.9 years |
| Miller | 39 | 77.0 years |
| Schultz | 38 | 77.6 years |
| Davis | 30 | 74.0 years |
| Martin | 27 | 73.7 years |
| Brown | 27 | 73.8 years |
| Myers | 25 | 73.5 years |
| Moore | 24 | 75.1 years |
| Johnson | 24 | 82.0 years |
| Businesses in Jasper County, IN | ||||
| Name | Count | Name | Count | |
|---|---|---|---|---|
| Ace Hardware | 1 | Knights Inn | 1 | |
| Alco Stores | 1 | La-Z-Boy | 1 | |
| Arby's | 2 | Lane Furniture | 1 | |
| AutoZone | 2 | MasterBrand Cabinets | 2 | |
| Blockbuster | 2 | McDonald's | 4 | |
| Burger King | 1 | Pizza Hut | 2 | |
| CVS | 3 | Quiznos | 1 | |
| Chevrolet | 1 | RadioShack | 2 | |
| Curves | 2 | Sears | 1 | |
| Dairy Queen | 2 | Subway | 2 | |
| Decora Cabinetry | 1 | Super 8 | 1 | |
| Fashion Bug | 1 | True Value | 2 | |
| FedEx | 5 | U-Haul | 3 | |
| Ford | 1 | UPS | 4 | |
| H&R Block | 2 | Walgreens | 2 | |
| Holiday Inn | 1 | Walmart | 1 | |
| KFC | 3 | |||