Kiowa County, Kansas (KS)
County owner-occupied free and clear houses and condos in 2010: 377
County owner-occupied houses and condos in 2000: 980
Renter-occupied apartments: 307 (it was 385 in 2000)
| % of renters here: | 28% |
| State: | 32% |
Land area: 722 sq. mi.
Water area: 0.2 sq. mi.
Population density: 3 people per square mile (very low).
Industries providing employment: Educational, health and social services (25.5%), Agriculture,forestry,fishing and hunting, and mining (15.8%).
Type of workers:
- Private wage or salary: 59%
- Government: 23%
- Self-employed, not incorporated: 17%
- Unpaid family work: 1%
- OSM Map
- General Map
- Google Map
- MSN Map

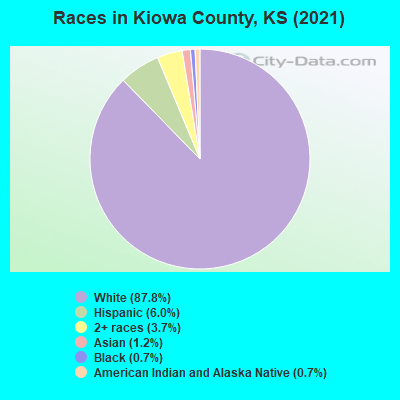
- 2,12887.7%White Non-Hispanic Alone
- 1415.8%Hispanic or Latino
- 622.6%Two or more races
- 602.5%Asian alone
- 160.7%Black Non-Hispanic Alone
- 120.5%American Indian and Alaska Native alone
- 70.3%Some other race alone
| Median resident age: | 42.1 years |
| Kansas median age: | 37.6 years |
| Males: 1,149 | |
| Females: 1,297 |

 | Sad about Greensburg,KS (53 replies) |
| Kiowa County: | 2.0 people |
| Kansas: | 2 people |
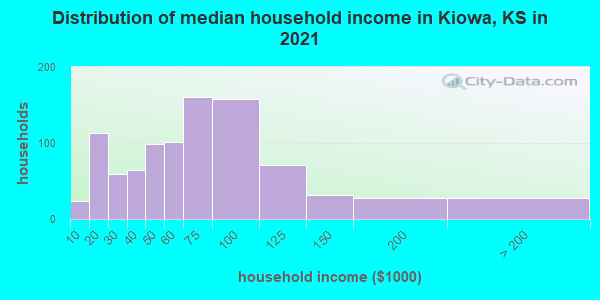
Estimated median household income in 2022: $69,517 ($31,576 in 1999)
| This county: | $69,517 |
| Kansas: | $68,925 |
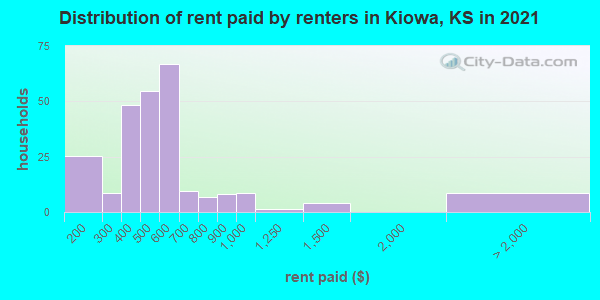
Median contract rent in 2022 for apartments: $498 (lower quartile is $404, upper quartile is $586)
| This county: | $498 |
| State: | $772 |
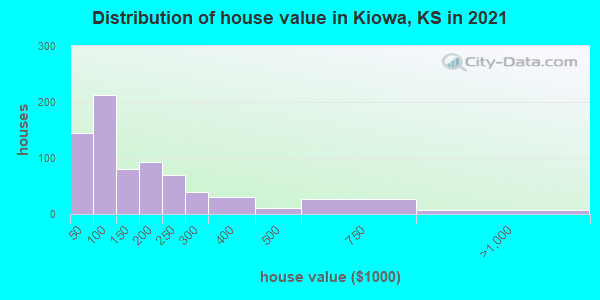
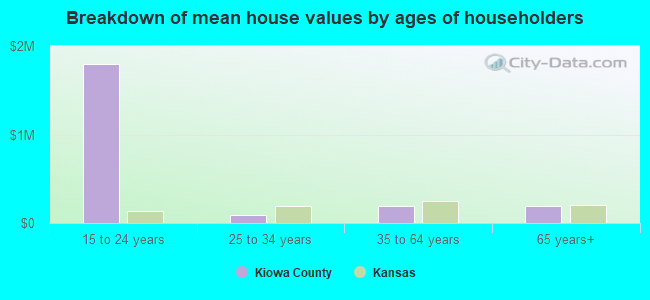
Estimated median house or condo value in 2022: $132,713 (it was $43,600 in 2000)
| Kiowa: | $132,713 |
| Kansas: | $206,600 |
Mean price in 2022:
Median monthly housing costs for homes and condos with a mortgage: $1,346Detached houses: $222,337
Here: $222,337 State: $264,181 Townhouses or other attached units: $248,838
Here: $248,838 State: $219,178 In 5-or-more-unit structures: $145,275
Here: $145,275 State: $267,030 Mobile homes: $58,630
Here: $58,630 State: $74,712
Median monthly housing costs for units without a mortgage: $477
Institutionalized population: 48
Crime in 2021 (reported by the sheriff's office or county police, not the county total):
- Murders: 0
- Rapes: 0
- Robberies: 0
- Assaults: 1
- Burglaries: 2
- Thefts: 5
- Auto thefts: 0
Crime in 2020 (reported by the sheriff's office or county police, not the county total):
- Murders: 0
- Rapes: 0
- Robberies: 0
- Assaults: 6
- Burglaries: 10
- Thefts: 7
- Auto thefts: 2
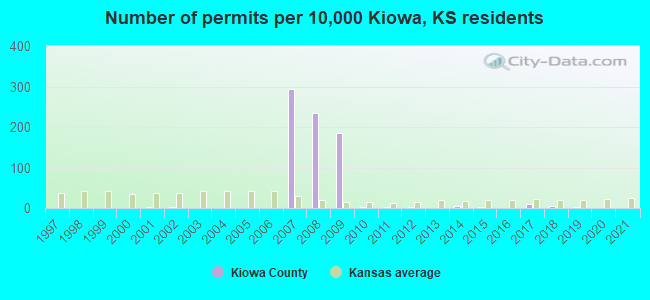
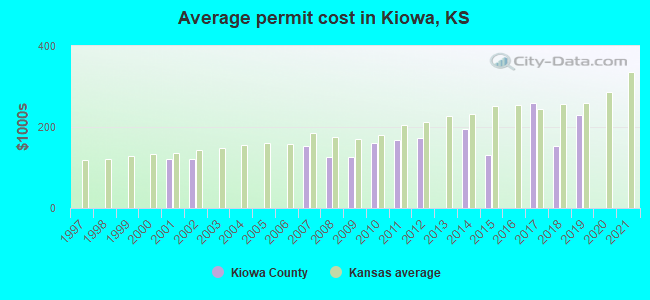
Single-family new house construction building permits:
- 2022: 1 building, cost: $30,000
- 2021: 0 buildings
- 2020: 0 buildings
- 2019: 1 building, cost: $230,000
- 2018: 2 buildings, average cost: $153,000
- 2017: 3 buildings, average cost: $258,700
- 2016: 0 buildings
- 2015: 1 building, cost: $130,000
- 2014: 2 buildings, average cost: $194,700
- 2013: 0 buildings
- 2012: 1 building, cost: $172,600
- 2011: 1 building, cost: $167,300
- 2010: 1 building, cost: $160,200
- 2009: 61 buildings, average cost: $125,000
- 2008: 77 buildings, average cost: $125,000
- 2007: 96 buildings, average cost: $152,800
- 2006: 0 buildings
- 2005: 0 buildings
- 2004: 0 buildings
- 2003: 0 buildings
- 2002: 1 building, cost: $120,000
- 2001: 1 building, cost: $120,000
- 2000: 0 buildings
- 1999: 0 buildings
- 1998: 0 buildings
- 1997: 0 buildings
Median real estate property taxes paid for housing units with mortgages in 2022: $2,542 (1.3%)
Median real estate property taxes paid for housing units with no mortgage in 2022: $1,389 (1.6%)
| Kiowa County: | 5.4% |
| Kansas: | 12.0% |
Median age of residents in 2022: 42.1 years old
(Males: 43.7 years old, Females: 40.1 years old)
(Median age for: White residents: 42.8 years old, Black residents: 39.6 years old, American Indian residents: 22.0 years old, Asian residents: 29.6 years old, Hispanic or Latino residents: 48.3 years old, Other race residents: 15.5 years old)
Fair market rent in 2006 for a 1-bedroom apartment in Kiowa County is $381 a month.
Fair market rent for a 2-bedroom apartment is $497 a month.
Fair market rent for a 3-bedroom apartment is $647 a month.
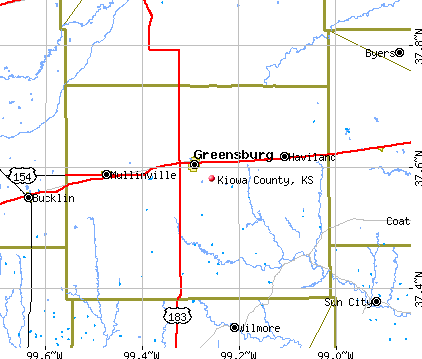
Cities in this county include: Greensburg, Haviland, Mullinville.
Notable locations in this county outside city limits:
Notable locations in Kiowa County: Neodesha Water Plant (A), Altoona Sewer Treatment Plant (B), Kansas Department of Transportation Neodesha Rest Area (C), Westminster Woods Camp (D), Camp Cauble (E), Fredonia Wastewater Treatment Plant (F), Buffalo Wastewater Treatment Plant (G), Fredonia Country Club (H), Hidden Haven Camp (I), Camp Crawford (J), Wilson County Rural Fire District Station 7 (K), Wilson County Rural Fire District Station 6 (L), Wilson County Rural Fire District Station 4 (M), Wilson County Rural Fire District Station 3 (N), Wilson County Rural Fire District Station 17 (O), Wilson County Rural Fire District Station 15 (P), Wilson County Rural Fire District Station 13 (Q), Wilson County Rural Fire District Station 11 (R), Wilson County Rural Fire District Station 10 (S), Wilson County Rural Fire District Station 1 (T). Display/hide their locations on the map
Churches in Kiowa County include: Zion Church (A), Colfax Baptist Church (B), Center Ridge Church (C), Pleasant Valley Church (D), Buxton Christian Church (E), Maple Grove Bethel Church of God (F), Harrison Church (G), Emmanuel Church of God in Christ Mennonite Church (H), First Southern Baptist Church (I). Display/hide their locations on the map
Cemeteries: Star Cemetery (1), Ross Cemetery (2), Varner Cemetery (3), Grandview Cemetery (4), Butner Cemetery (5), Mount Pleasant Cemetery (6), Bachelder Cemetery (7). Display/hide their locations on the map
Lakes and reservoirs: Leonards Lake (A), Shafer Lake (B), Wilson County State Lake (C). Display/hide their locations on the map
Streams, rivers, and creeks: Chetopa Creek (A), Dry Creek (B), Washington Branch (C), East Rainbow Creek (D), West Rainbow Creek (E), Middle Duck Creek (F), South Duck Creek (G), Willow Creek (H), Pumpkin Creek (I). Display/hide their locations on the map
Parks in Kiowa County include: Wilson State Fishing Lake (1), Wilson County State Park (2). Display/hide their locations on the map
Neighboring counties: Bedford County, Virginia  , Breckinridge County, Kentucky , Somerset County, Maryland , Reno County
  , Seward County
  , Wilson County .
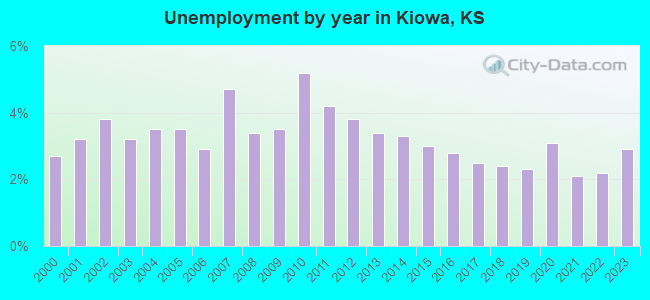
| Here: | 1.7% |
| Kansas: | 2.0% |
Current college students: 150
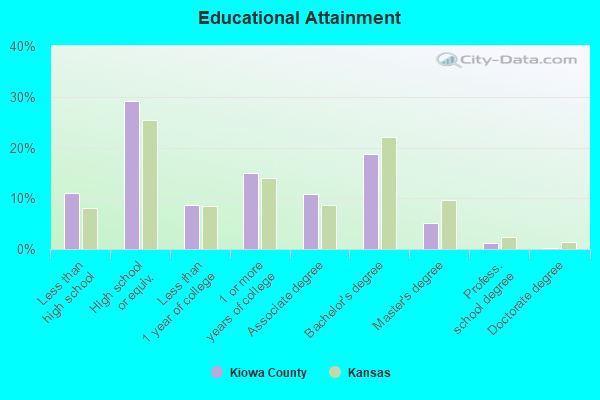
People 25 years of age or older with a high school degree or higher: 89.0%
People 25 years of age or older with a bachelor's degree or higher: 25.3%
Number of foreign born residents: 111 (27.4% naturalized citizens)
| Kiowa County: | 4.5% |
| Whole state: | 7.1% |
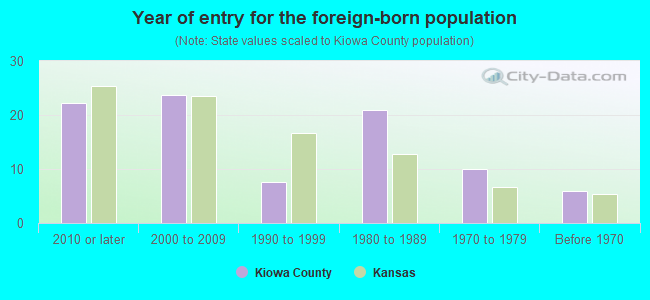
- Year of entry for the foreign-born population
- 752010 or later
- 282000 to 2009
- 101990 to 1999
- 211980 to 1989
- 101970 to 1979
- 6Before 1970
Mean travel time to work (commute): minutes
Percentage of county residents living and working in this county: 100.2%


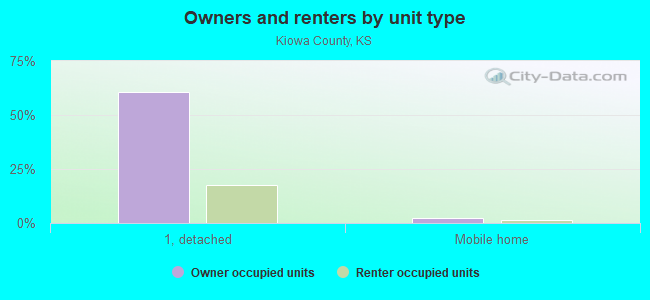
Housing units in structures:
- One, detached: 1,010
- One, attached: 6
- Two: 9
- 3 or 4: 41
- 5 to 9: 12
- 10 to 19: 17
- 20 or more: 5
- Mobile homes: 61
Housing units in Kiowa County with a mortgage: 247 (11 second mortgage, 0 home equity loan, 9 both second mortgage and home equity loan)
Houses without a mortgage: 4
| Here: | 98.4% with mortgage |
| State: | 97.8% with mortgage |
Religion statistics for Kiowa County
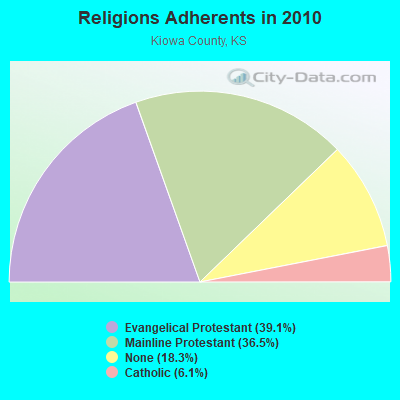
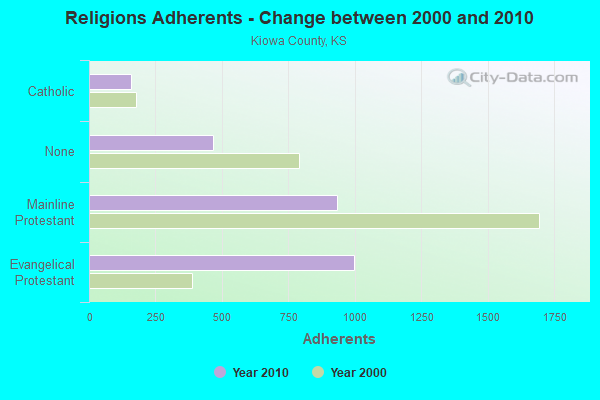
| Religion | Adherents | Congregations |
|---|---|---|
| Evangelical Protestant | 997 | 7 |
| Mainline Protestant | 932 | 5 |
| Catholic | 157 | 1 |
| Other | 1 | - |
| None | 466 | - |
Source: Clifford Grammich, Kirk Hadaway, Richard Houseal, Dale E.Jones, Alexei Krindatch, Richie Stanley and Richard H.Taylor. 2012. 2010 U.S.Religion Census: Religious Congregations & Membership Study. Association of Statisticians of American Religious Bodies. Jones, Dale E., et al. 2002. Congregations and Membership in the United States 2000. Nashville, TN: Glenmary Research Center.
Food Environment Statistics:
| Kiowa County: | 3.41 / 10,000 pop. |
| State: | 1.96 / 10,000 pop. |
| Kiowa County: | 3.41 / 10,000 pop. |
| Kansas: | 3.84 / 10,000 pop. |
| This county: | 6.82 / 10,000 pop. |
| State: | 7.33 / 10,000 pop. |
| Kiowa County: | 10.1% |
| Kansas: | 8.1% |
| Kiowa County: | 28.5% |
| State: | 27.9% |
Agriculture in Kiowa County:
Average size of farms: 1147 acresAverage value of agricultural products sold per farm: $96,282
Average value of crops sold per acre for harvested cropland: $169.51
The value of livestock, poultry, and their products as a percentage of the total market value of agricultural products sold: 43.87%
Average total farm production expenses per farm: $89,167
Harvested cropland as a percentage of land in farms: 27.79%
Average market value of all machinery and equipment per farm: $115,282
The percentage of farms operated by a family or individual: 85.22%
Average age of principal farm operators: 62 years
Average number of cattle and calves per 100 acres of all land in farms: 6.99
Corn for grain: 24236 harvested acres
All wheat for grain: 55749 harvested acres
Upland cotton: 1885 harvested acres
Soybeans for beans: 10354 harvested acres
Tornado activity:
Kiowa County historical area-adjusted tornado activity is significantly below Kansas state average. It is 7156658.6 times below overall U.S. average.Earthquake activity:
Kiowa County-area historical earthquake activity is significantly above Kansas state average. It is 779% greater than the overall U.S. average.On 9/3/2016 at 12:02:44, a magnitude 5.8 (5.8 MW, Depth: 3.5 mi, Class: Moderate, Intensity: VI - VII) earthquake occurred 151.4 miles away from Kiowa County center
On 11/6/2011 at 03:53:10, a magnitude 5.7 (5.7 MW, Depth: 3.2 mi) earthquake occurred 198.1 miles away from the county center
On 2/13/2016 at 17:07:06, a magnitude 5.1 (5.1 MW, Depth: 5.2 mi) earthquake occurred 81.2 miles away from the county center
On 11/12/2014 at 21:40:00, a magnitude 4.9 (4.9 MW, Depth: 2.5 mi, Class: Light, Intensity: IV - V) earthquake occurred 92.4 miles away from the county center
On 11/19/2015 at 07:42:12, a magnitude 4.7 (4.7 MW, Depth: 3.7 mi) earthquake occurred 77.3 miles away from Kiowa County center
On 1/7/2016 at 04:27:57, a magnitude 4.7 (4.7 MW, Depth: 2.5 mi) earthquake occurred 80.5 miles away from the county center
Magnitude types: moment magnitude (MW)
Most recent natural disasters:
- Kansas Covid-19 Pandemic, Incident Period: January 20, 2020, FEMA Id: 4504, Natural disaster type: Other
- Kansas Severe Storms, Straight-line Winds, And Flooding, Incident Period: September 1, 2018 - September 8, 2018, FEMA Id: 4403, Natural disaster type: Storm, Flood, Wind
- Kansas Severe Winter Storm, Incident Period: January 13, 2017 - January 16, 2017, FEMA Id: 4304, Natural disaster type: Winter Storm
- Kansas Severe Storms, Straight-line Winds, Tornadoes, and Flooding, Incident Period: July 22, 2013 to August 16, 2013, Major Disaster (Presidential) Declared DR-4150: October 22, 2013, FEMA Id: 4150, Natural disaster type: Storm, Tornado, Flood, Wind
- Kansas Severe Storms, Tornadoes, Straight-line Winds, and Flooding, Incident Period: April 14, 2012 to April 16, 2012, Major Disaster (Presidential) Declared DR-4063: May 24, 2012, FEMA Id: 4063, Natural disaster type: Storm, Tornado, Flood, Wind
- Kansas Severe Storms, Flooding, and Tornadoes, Incident Period: June 07, 2010 to July 21, 2010, Major Disaster (Presidential) Declared DR-1932: August 10, 2010, FEMA Id: 1932, Natural disaster type: Storm, Tornado, Flood
- Kansas Severe Storms, Flooding, and Tornadoes, Incident Period: May 22, 2008 to June 16, 2008, Major Disaster (Presidential) Declared DR-1776: July 09, 2008, FEMA Id: 1776, Natural disaster type: Storm, Tornado, Flood
- Kansas Severe Winter Storms, Incident Period: December 06, 2007 to December 19, 2007, Major Disaster (Presidential) Declared DR-1741: February 01, 2008, FEMA Id: 1741, Natural disaster type: Winter Storm
- Kansas Severe Winter Storms, Incident Period: December 06, 2007 to December 19, 2007, Emergency Declared EM-3282: December 12, 2007, FEMA Id: 3282, Natural disaster type: Winter Storm
- Kansas Severe Storms, Tornadoes, and Flooding, Incident Period: May 04, 2007 to June 01, 2007, Major Disaster (Presidential) Declared DR-1699: May 06, 2007, FEMA Id: 1699, Natural disaster type: Storm, Tornado, Flood
- 4 other natural disasters have been reported since 1953.
The number of natural disasters in Kiowa County (14) is near the US average (15).
Major Disasters (Presidential) Declared: 9
Emergencies Declared: 2
Causes of natural disasters: Floods: 7, Storms: 7, Tornadoes: 5, Winter Storms: 4, Winds: 3, Hurricane: 1, Ice Storm: 1, Other: 1 (Note: some incidents may be assigned to more than one category).
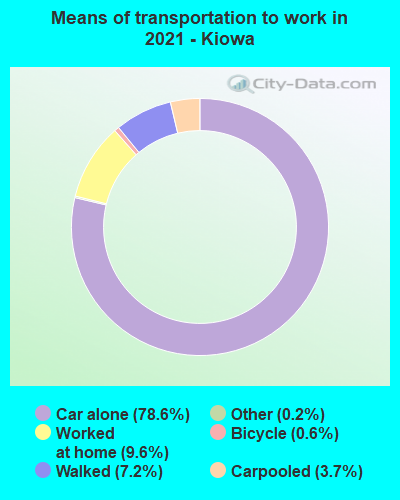
Means of transportation to work:
- Drove a car alone: 870 (72.1%)
- Carpooled: 67 (5.6%)
- Bus: 4 (0.3%)
- Bicycle: 11 (0.9%)
- Walked: 120 (9.9%)
- Worked at home: 130 (10.8%)

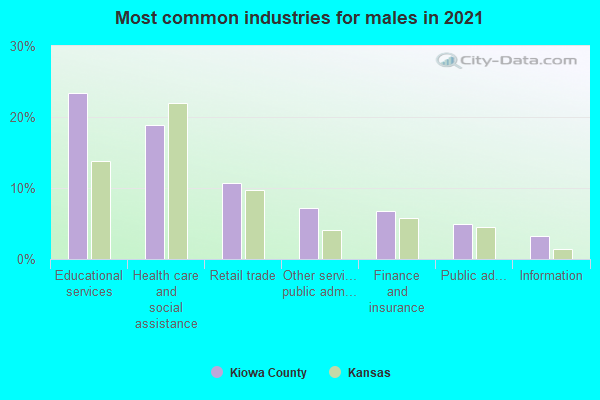
- Educational services (26%)
- Health care and social assistance (15%)
- Retail trade (10%)
- Other services, except public administration (7%)
- Finance and insurance (7%)
- Accommodation and food services (6%)
- Public administration (4%)
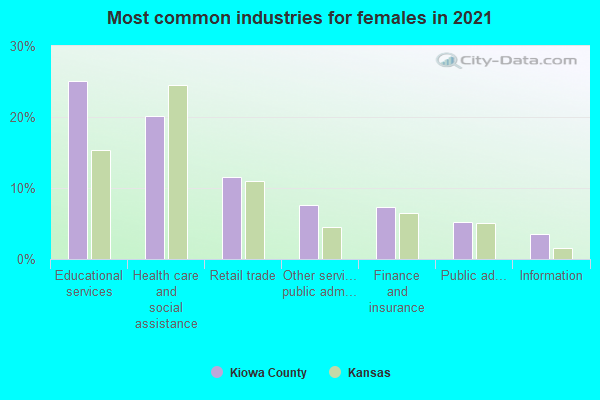
- Educational services (27%)
- Health care and social assistance (16%)
- Retail trade (11%)
- Other services, except public administration (7%)
- Finance and insurance (7%)
- Accommodation and food services (6%)
- Public administration (5%)
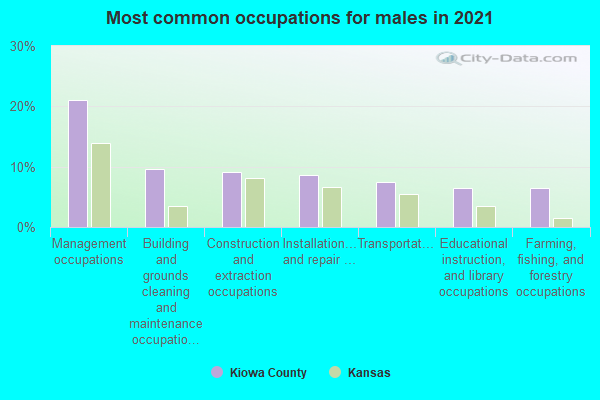
- Management occupations (20%)
- Transportation occupations (9%)
- Construction and extraction occupations (8%)
- Building and grounds cleaning and maintenance occupations (8%)
- Installation, maintenance, and repair occupations (8%)
- Farming, fishing, and forestry occupations (6%)
- Sales and related occupations (6%)
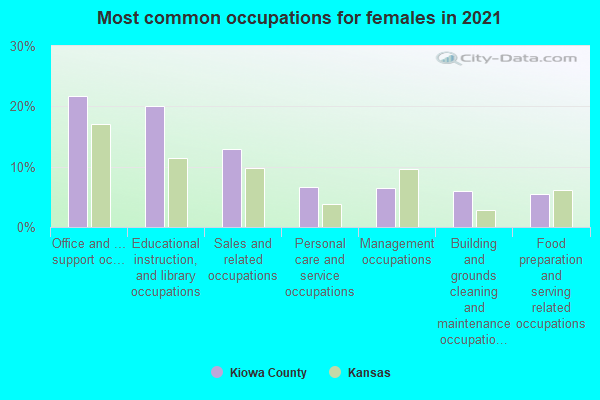
- Educational instruction, and library occupations (23%)
- Office and administrative support occupations (18%)
- Sales and related occupations (11%)
- Food preparation and serving related occupations (9%)
- Management occupations (6%)
- Building and grounds cleaning and maintenance occupations (5%)
- Personal care and service occupations (5%)
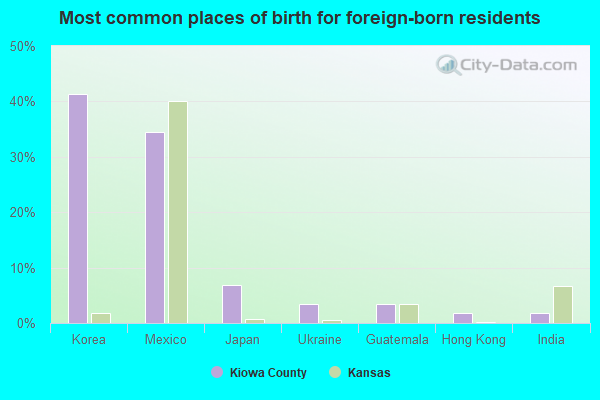
- India (35%)
- Mexico (23%)
- Korea (15%)
- Germany (9%)
- El Salvador (4%)
- Japan (3%)
- Ukraine (2%)
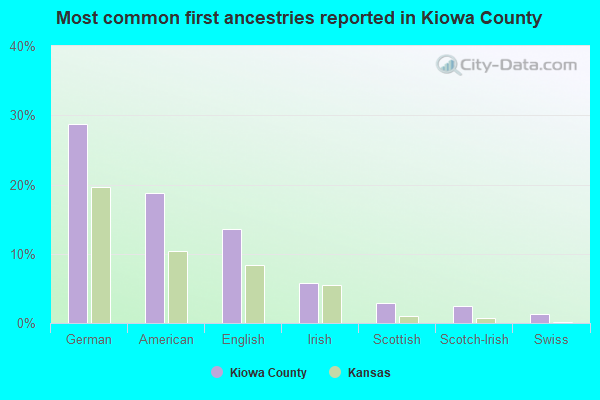
- German (28%)
- American (19%)
- English (11%)
- Irish (8%)
- Scottish (3%)
- Scotch-Irish (3%)
- Swiss (2%)
People in group quarters in Kiowa County, Kansas in 2010:
- 97 people in college/university student housing
- 46 people in nursing facilities/skilled-nursing facilities
- 2 people in hospitals with patients who have no usual home elsewhere
- 2 people in group homes intended for adults
- 2 people in workers' group living quarters and job corps centers
People in group quarters in Kiowa County, Kansas in 2000:
- 55 people in nursing homes
- 48 people in college dormitories (includes college quarters off campus)
- 4 people in local jails and other confinement facilities (including police lockups)
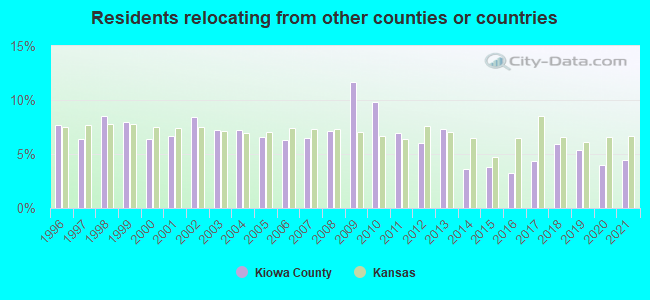
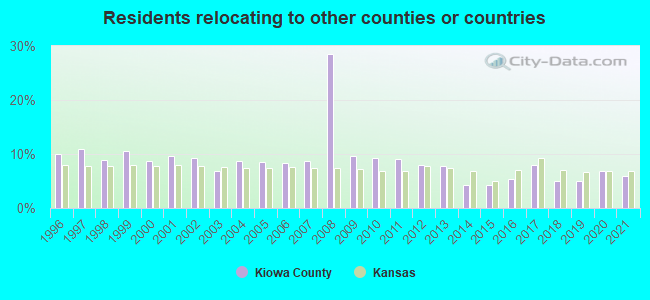
4.40% of this county's 2021 resident taxpayers lived in other counties in 2020 ($17,027 average adjusted gross income)
| Here: | 4.40% |
| Kansas average: | 6.64% |
10 or fewer of this county's residents moved from foreign countries.
4.40% relocated from other counties in Kansas ($17,027 average AGI)
10 or fewer of this county's residents relocated from other states.
5.86% of this county's 2020 resident taxpayers moved to other counties in 2021 ($38,940 average adjusted gross income)
| Here: | 5.86% |
| Kansas average: | 6.88% |
10 or fewer of this county's residents moved to foreign countries.
5.86% relocated to other counties in Kansas ($38,940 average AGI)
10 or fewer of this county's residents relocated to other states.
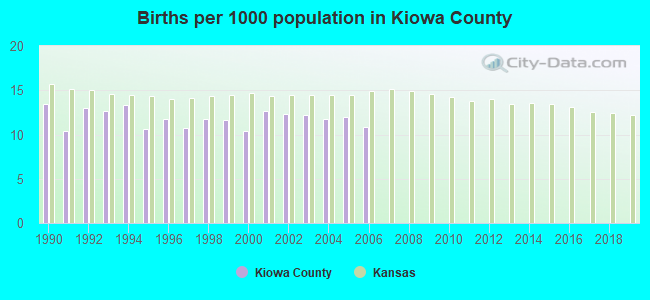
Births per 1000 population from 1990 to 1999: 11.9
Births per 1000 population from 2000 to 2006: 11.7
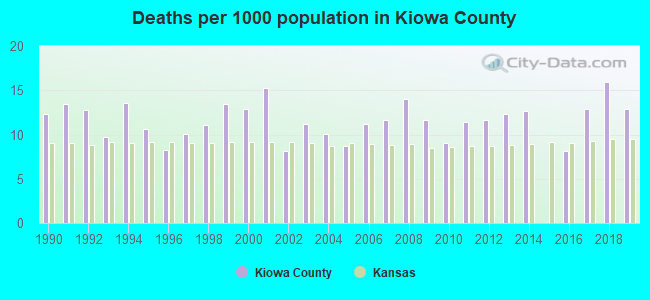
Deaths per 1000 population from 1990 to 1999: 11.5
Deaths per 1000 population from 2000 to 2009: 11.5
Deaths per 1000 population from 2010 to 2020: 10.9
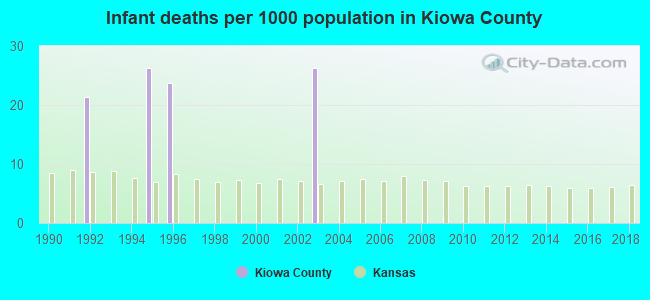
Infant deaths per 1000 live births from 1990 to 1999: 7.1
Infant deaths per 1000 live births from 2000 to 2006: 3.8
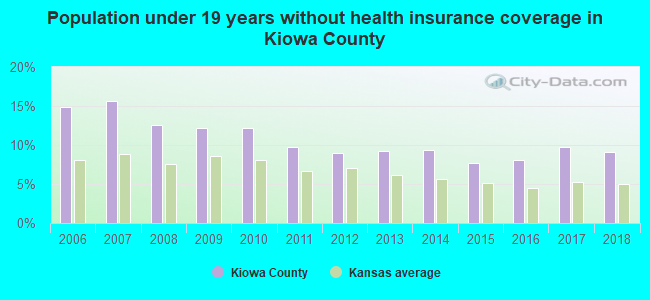
Persons under 19 years old without health insurance coverage in 2018: 9.1%

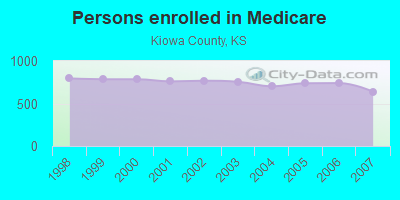
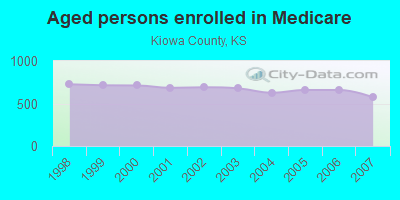
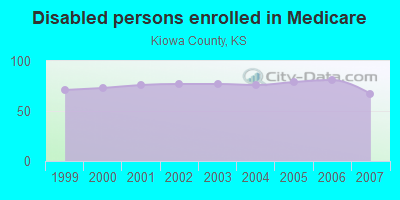
Persons enrolled in hospital insurance and/or supplemental medical insurance (Medicare) in July 1, 2007: 641 (574 aged, 67 disabled)
Children under 18 without health insurance coverage in 2007: 71 (15%)
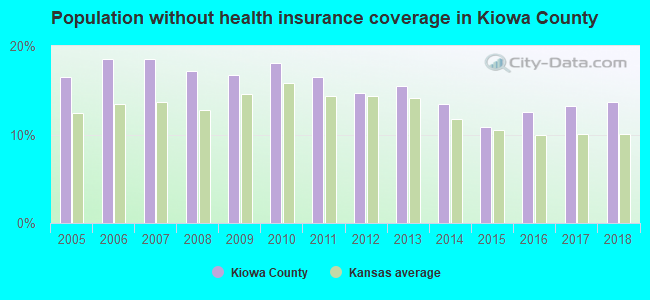
Population without health insurance coverage in 2000: 13%
Children under 18 without health insurance coverage in 2000: 11%
Short term general hospital admissions per 100,000 population in 2004: 18,936
Short term general hospital beds per 100,000 population in 2004: 811
Emergency room visits per 100,000 population in 2004: 29,864
General practice office based MDs per 100,000 population in 2005: 1,307
Medical specialist MDs per 100,000 population in 2005: 1,206
Total births per 100,000 population, July 2005 - July 2006 : 29
Total deaths per 100,000 population, July 2005 - July 2006: 67
Household type by relationship:
Households: 2,446- Male householders: 490 (187 living alone), Female householders: 457 (135 living alone)
546 spouses (542 opposite-sex spouses), 8 unmarried partners, (8 opposite-sex unmarried partners), 581 children (563 natural, 11 adopted, 7 stepchildren), 28 grandchildren, 11 brothers or sisters, 20 parents, 0 foster children, 19 other relatives, 64 non-relatives
- In group quarters: 216
Size of family households: 387 2-persons, 87 3-persons, 49 4-persons, 57 5-persons, 16 6-persons, 4 7-or-more-persons.
Size of nonfamily households: 322 1-person, 21 2-persons, 2 7-or-more-persons.
483 married couples with children.
42 single-parent households (20 men, 22 women).
92.7% of residents of Kiowa speak English at home.
3.7% of residents speak Spanish at home (70% speak English very well, 7% speak English well, 17% speak English not well, 6% don't speak English at all).
3.5% of residents speak other Indo-European language at home (98% speak English very well, 2% speak English well).
0.4% of residents speak Asian or Pacific Island language at home (90% speak English very well, 10% speak English well).
In fiscal year 2004:
Federal Government expenditure: $27,461,000 ($8,904 per capita)
Department of Defense expenditure: $270,000
Federal direct payments to individuals for retirement and disability: $9,955,000
Federal other direct payments to individuals: $7,016,000
Federal direct payments not to individuals: $6,060,000
Federal grants: $2,933,000
Federal procurement contracts: $299,000 ($0,000 Department of Defense)
Federal salaries and wages: $1,198,000 ($0,000 Department of Defense)
Federal Government direct loans: $564,000
Federal guaranteed/insured loans: $168,000
Federal Government insurance: $15,228,000
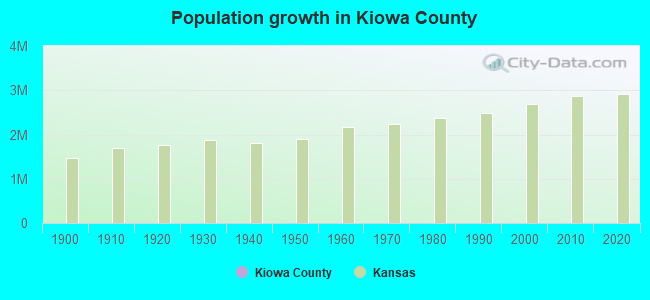
Population change from April 1, 2000 to July 1, 2005:
Births: 199| Here: | 67 per 1000 residents |
| State: | 75 per 1000 residents |
Deaths: 190
| Here: | 64 per 1000 residents |
| State: | 47 per 1000 residents |
Net international migration: +11
| Here: | +4 per 1000 residents |
| State: | +14 per 1000 residents |
Net internal migration: -308
| Here: | |
| State: |
Total withdrawal of fresh water for public supply: 0.43 millions of gallons per day (all from ground)
| Here: | 7.7 |
| State: | 6.9 |
| Here: | 5.3 |
| State: | 4.4 |
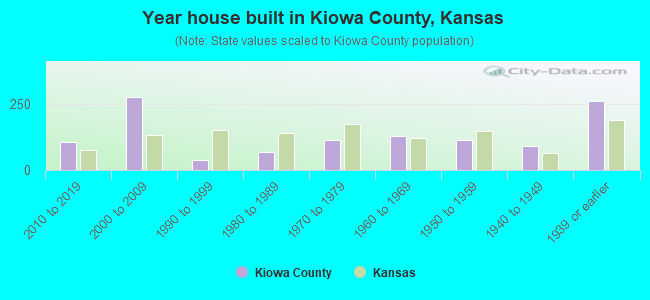
- Year house built in Kiowa County, Kansas
- 02020 or later
- 1182010 to 2019
- 2822000 to 2009
- 381990 to 1999
- 671980 to 1989
- 941970 to 1979
- 1241960 to 1969
- 901950 to 1959
- 801940 to 1949
- 2861939 or earlier
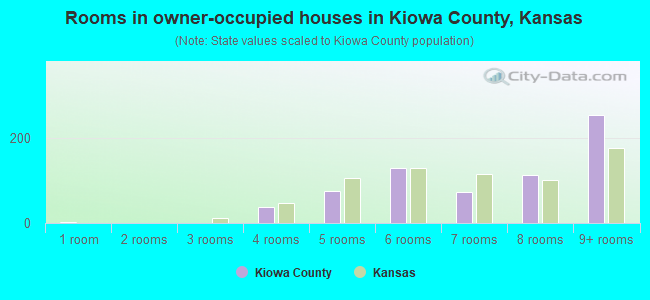
- Rooms in owner-occupied houses in Kiowa County, Kansas
- 51 room
- 02 rooms
- 43 rooms
- 404 rooms
- 995 rooms
- 1116 rooms
- 737 rooms
- 1258 rooms
- 2719+ rooms
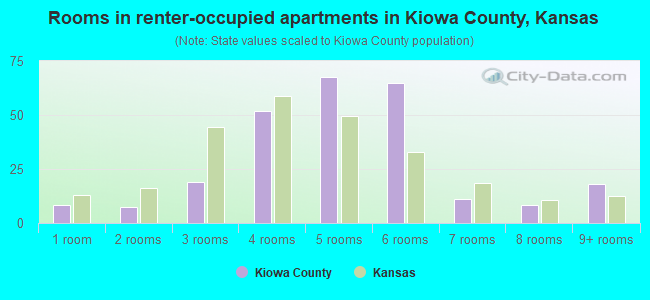
- Rooms in renter-occupied apartments in Kiowa County, Kansas
- 11 room
- 72 rooms
- 143 rooms
- 494 rooms
- 515 rooms
- 756 rooms
- 87 rooms
- 108 rooms
- 129+ rooms
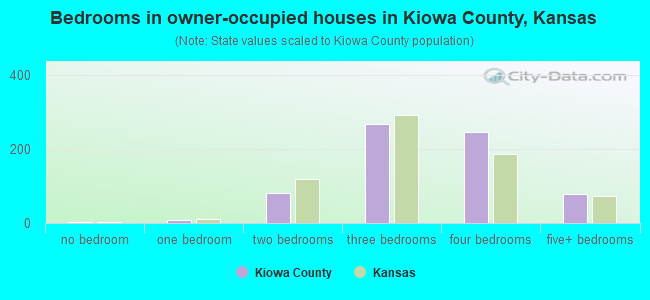
- Bedrooms in owner-occupied houses in Kiowa County, Kansas
- 4no bedroom
- 91 bedroom
- 832 bedrooms
- 2783 bedrooms
- 2694 bedrooms
- 835+ bedrooms
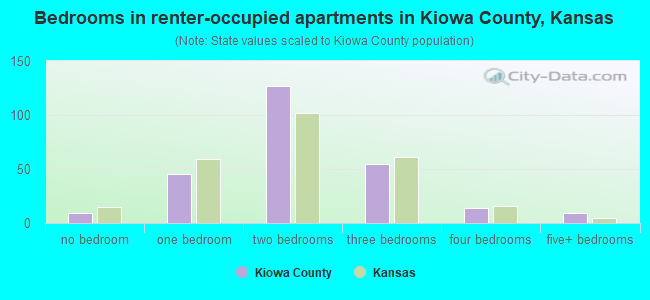
- Bedrooms in renter-occupied apartments in Kiowa County, Kansas
- 1no bedroom
- 361 bedroom
- 1132 bedrooms
- 593 bedrooms
- 144 bedrooms
- 35+ bedrooms
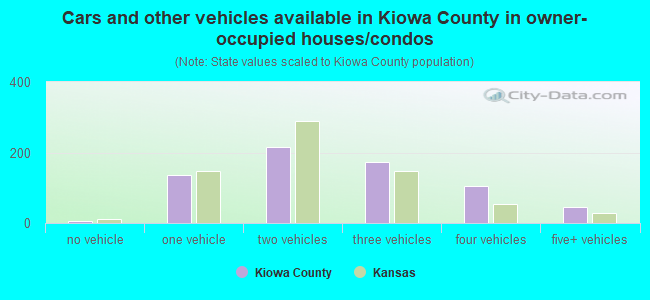
- Cars and other vehicles available in Kiowa County in owner-occupied houses/condos
- 3no vehicle
- 1531 vehicle
- 2352 vehicles
- 1633 vehicles
- 1064 vehicles
- 615+ vehicles
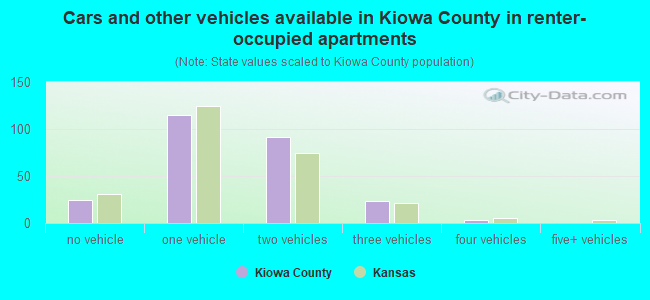
- Cars and other vehicles available in Kiowa County in renter-occupied apartments
- 24no vehicle
- 841 vehicle
- 852 vehicles
- 313 vehicles
- 34 vehicles
- 05+ vehicles
92.6% of Kiowa County residents lived in the same house 1 years ago.
Out of people who lived in different houses, 31% lived in this county.
Out of people who lived in different counties, 27% lived in Kansas.
| Kiowa County: | 92.6% |
| State average: | 85.3% |
Place of birth for U.S.-born residents:
- This state: 1,553
- Other state: 758
- Northeast: 46
- Midwest: 233
- South: 212
- West: 273
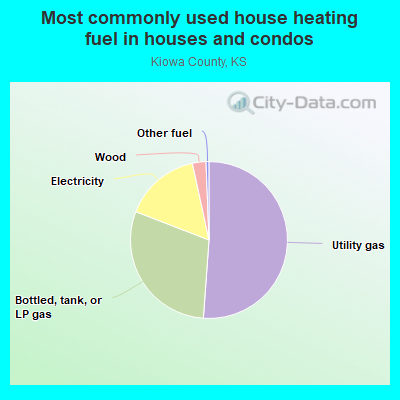
- 48.1%Utility gas
- 32.9%Bottled, tank, or LP gas
- 16.2%Electricity
- 2.3%Wood
- 0.6%Other fuel
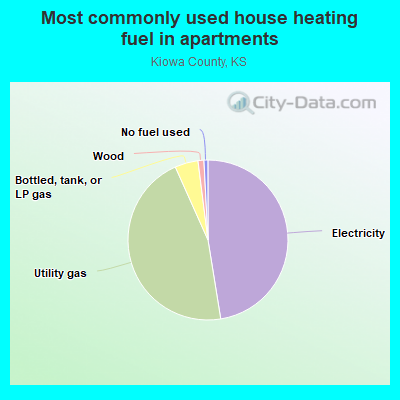
- 47.8%Electricity
- 44.7%Utility gas
- 6.6%Bottled, tank, or LP gas
- 0.9%Wood
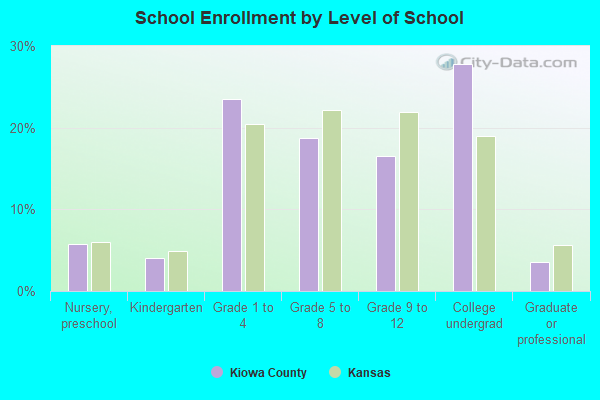
Private vs. public school enrollment:
| Here: | 20.5% |
| Kansas: | 14.1% |
| Here: | 16.7% |
| Kansas: | 10.8% |
| Here: | 54.9% |
| Kansas: | 15.4% |
Kiowa County government finances - Expenditure in 2017:
- Current Operations - Regular Highways: $2,305,000
General - Other: $2,053,000
Financial Administration: $883,000
Police Protection: $704,000
Health - Other: $455,000
Central Staff Services: $388,000
Correctional Institutions: $269,000
Local Fire Protection: $201,000
Judicial and Legal Services: $184,000
Solid Waste Management: $181,000
General Public Buildings: $93,000
Libraries: $75,000
Parks and Recreation: $10,000
- General - Interest on Debt: $92,000
- Long Term Debt - Beginning Outstanding - Unspecified Public Purpose: $2,301,000
Outstanding Unspecified Public Purpose: $1,691,000
Retired Unspecified Public Purpose: $610,000
- Miscellaneous - General Revenue - Other: $700,000
Interest Earnings: $16,000
- Other Capital Outlay - Regular Highways: $103,000
- Other Funds - Cash and Securities: $7,539,000
- State Intergovernmental - Highways: $282,000
Health and Hospitals: $154,000
- Tax - Property: $5,698,000
General Sales and Gross Receipts: $176,000
- Total Salaries and Wages: $2,124,000
Kiowa County government finances - Revenue in 2017:
- Current Operations - Regular Highways: $2,305,000
General - Other: $2,053,000
Financial Administration: $883,000
Police Protection: $704,000
Health - Other: $455,000
Central Staff Services: $388,000
Correctional Institutions: $269,000
Local Fire Protection: $201,000
Judicial and Legal Services: $184,000
Solid Waste Management: $181,000
General Public Buildings: $93,000
Libraries: $75,000
Parks and Recreation: $10,000
- General - Interest on Debt: $92,000
- Long Term Debt - Beginning Outstanding - Unspecified Public Purpose: $2,301,000
Outstanding Unspecified Public Purpose: $1,691,000
Retired Unspecified Public Purpose: $610,000
- Miscellaneous - General Revenue - Other: $700,000
Interest Earnings: $16,000
- Other Capital Outlay - Regular Highways: $103,000
- Other Funds - Cash and Securities: $7,539,000
- State Intergovernmental - Highways: $282,000
Health and Hospitals: $154,000
- Tax - Property: $5,698,000
General Sales and Gross Receipts: $176,000
- Total Salaries and Wages: $2,124,000
Kiowa County government finances - Debt in 2017:
- Current Operations - Regular Highways: $2,305,000
General - Other: $2,053,000
Financial Administration: $883,000
Police Protection: $704,000
Health - Other: $455,000
Central Staff Services: $388,000
Correctional Institutions: $269,000
Local Fire Protection: $201,000
Judicial and Legal Services: $184,000
Solid Waste Management: $181,000
General Public Buildings: $93,000
Libraries: $75,000
Parks and Recreation: $10,000
- General - Interest on Debt: $92,000
- Long Term Debt - Beginning Outstanding - Unspecified Public Purpose: $2,301,000
Outstanding Unspecified Public Purpose: $1,691,000
Retired Unspecified Public Purpose: $610,000
- Miscellaneous - General Revenue - Other: $700,000
Interest Earnings: $16,000
- Other Capital Outlay - Regular Highways: $103,000
- Other Funds - Cash and Securities: $7,539,000
- State Intergovernmental - Highways: $282,000
Health and Hospitals: $154,000
- Tax - Property: $5,698,000
General Sales and Gross Receipts: $176,000
- Total Salaries and Wages: $2,124,000
Kiowa County government finances - Cash and Securities in 2017:
- Current Operations - Regular Highways: $2,305,000
General - Other: $2,053,000
Financial Administration: $883,000
Police Protection: $704,000
Health - Other: $455,000
Central Staff Services: $388,000
Correctional Institutions: $269,000
Local Fire Protection: $201,000
Judicial and Legal Services: $184,000
Solid Waste Management: $181,000
General Public Buildings: $93,000
Libraries: $75,000
Parks and Recreation: $10,000
- General - Interest on Debt: $92,000
- Long Term Debt - Beginning Outstanding - Unspecified Public Purpose: $2,301,000
Outstanding Unspecified Public Purpose: $1,691,000
Retired Unspecified Public Purpose: $610,000
- Miscellaneous - General Revenue - Other: $700,000
Interest Earnings: $16,000
- Other Capital Outlay - Regular Highways: $103,000
- Other Funds - Cash and Securities: $7,539,000
- State Intergovernmental - Highways: $282,000
Health and Hospitals: $154,000
- Tax - Property: $5,698,000
General Sales and Gross Receipts: $176,000
- Total Salaries and Wages: $2,124,000
Supplemental Security Income (SSI) in 2006:
- Total number of recipients: 72
- Number of aged recipients: 4
- Number of blind and disabled recipients: 68
- Number of recipients under 18: 0
- Number of recipients between 18 and 64: 61
- Number of recipients older than 64: 0
- Number of recipients also receiving OASDI: 38
- Amount of payments (thousands of dollars): 22
| Most common first names in Kiowa County, KS among deceased individuals | ||
| Name | Count | Lived (average) |
|---|---|---|
| William | 38 | 79.7 years |
| John | 34 | 74.7 years |
| James | 24 | 75.0 years |
| Mary | 22 | 80.9 years |
| George | 19 | 77.0 years |
| Ethel | 19 | 81.2 years |
| Ruth | 18 | 78.2 years |
| Charles | 17 | 81.3 years |
| Myrtle | 15 | 86.1 years |
| Florence | 15 | 83.4 years |
| Most common last names in Kiowa County, KS among deceased individuals | ||
| Last name | Count | Lived (average) |
|---|---|---|
| Schmidt | 29 | 79.0 years |
| Miller | 23 | 80.7 years |
| Smith | 20 | 75.3 years |
| Koehn | 17 | 77.8 years |
| Brown | 16 | 72.9 years |
| Williams | 15 | 77.9 years |
| Unruh | 15 | 80.6 years |
| Barnes | 13 | 76.4 years |
| Thompson | 13 | 82.5 years |
| Price | 12 | 74.7 years |
| Businesses in Kiowa County, KS | ||||
| Name | Count | Name | Count | |
|---|---|---|---|---|
| Best Western | 1 | MasterBrand Cabinets | 1 | |
| Chevrolet | 1 | UPS | 1 | |
| Kroger | 1 | |||
Kiowa County on our top lists:
- #68 on the list of "Top 101 counties with highest percentage of residents voting for Romney (Republican) in the 2012 Presidential Election"