Lake County, Oregon (OR)
County owner-occupied free and clear houses and condos in 2010: 1,166
County owner-occupied houses and condos in 2000: 2,123
Renter-occupied apartments: 1,076 (it was 961 in 2000)
| % of renters here: | 31% |
| State: | 38% |
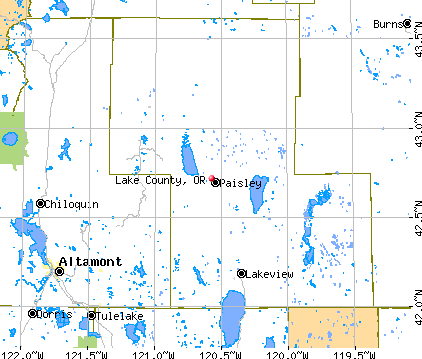
Land area: 8136 sq. mi.
Water area: 222.7 sq. mi.
Population density: 1 people per square mile (very low).
Industries providing employment: Educational, health and social services (25.4%), Agriculture,forestry,fishing and hunting, and mining (17.9%), Arts, entertainment, recreation, accommodation and food services (10.0%).
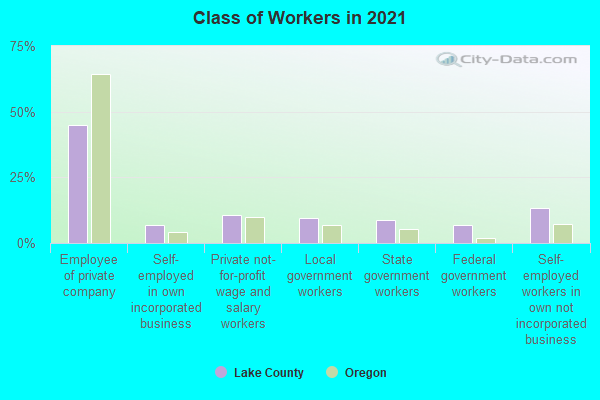
Type of workers:
- Private wage or salary: 61%
- Government: 26%
- Self-employed, not incorporated: 13%
- Unpaid family work: 0%
- OSM Map
- General Map
- Google Map
- MSN Map

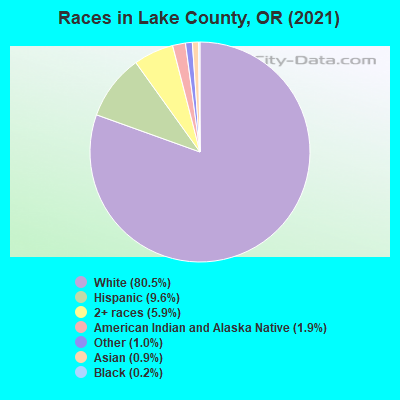
- 6,60380.9%White Non-Hispanic Alone
- 8099.9%Hispanic or Latino
- 4425.4%Two or more races
- 1581.9%American Indian and Alaska Native alone
- 730.9%Asian alone
- 590.7%Some other race alone
- 210.3%Black Non-Hispanic Alone
| Median resident age: | 46.8 years |
| Oregon median age: | 40.5 years |
| Males: 4,482 | |
| Females: 3,739 |

 | Roseburg Oregon, for retirement? (66 replies) |
| Is the Coos Bay/Florence area the "Last Hidden Gem" of Oregon?? (106 replies) |
| Need potable water delivery asap (30 replies) |
| Is there a non-Portland city/town in Oregon that suits me? (21 replies) |
| Deep Freeze Coming (100 replies) |
| how can I find a farmer or rancher with a small house rent? (14 replies) |
| Lake County: | 2.0 people |
| Oregon: | 2 people |
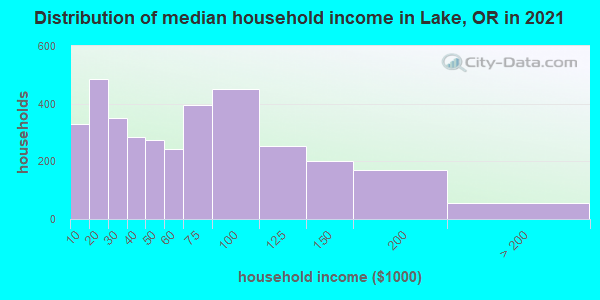
Estimated median household income in 2022: $53,967 ($29,506 in 1999)
| This county: | $53,967 |
| Oregon: | $75,657 |
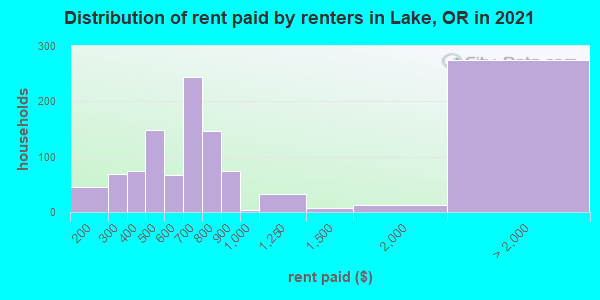
Median contract rent in 2022 for apartments: $683 (lower quartile is $488, upper quartile is $756)
| This county: | $683 |
| State: | $1235 |
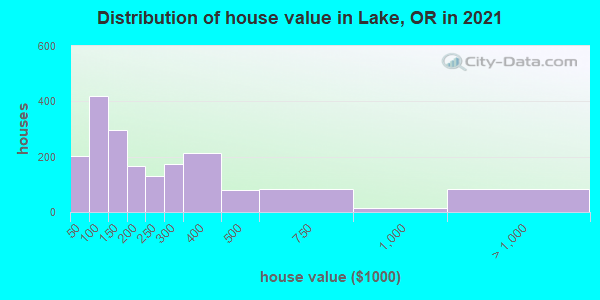
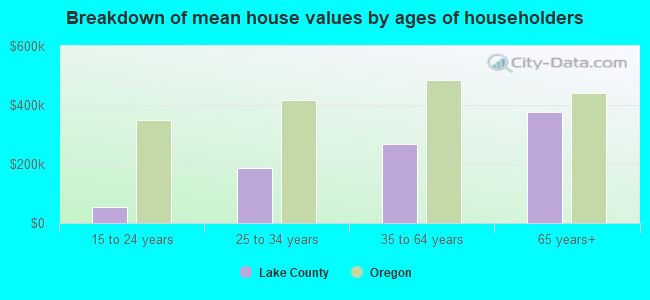
Estimated median house or condo value in 2022: $189,970 (it was $65,800 in 2000)
| Lake: | $189,970 |
| Oregon: | $475,600 |
Median monthly housing costs for homes and condos with a mortgage: $1,303
Median monthly housing costs for units without a mortgage: $356
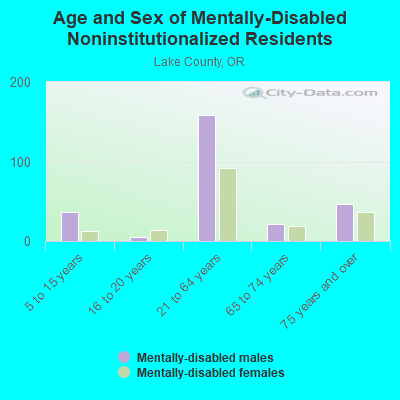
Institutionalized population: 430
Crime in 2021 (reported by the sheriff's office or county police, not the county total):
- Murders: 0
- Rapes: 7
- Robberies: 1
- Assaults: 24
- Burglaries: 39
- Thefts: 62
- Auto thefts: 22
Crime in 2020 (reported by the sheriff's office or county police, not the county total):
- Murders: 0
- Rapes: 0
- Robberies: 0
- Assaults: 15
- Burglaries: 8
- Thefts: 25
- Auto thefts: 5
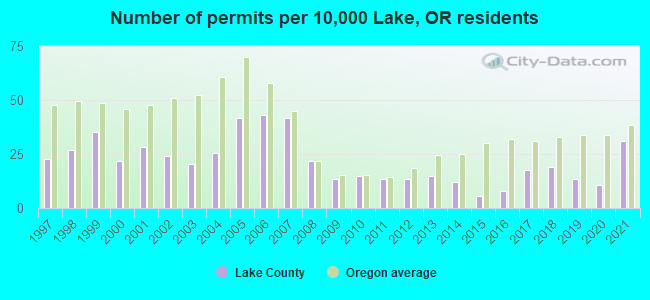
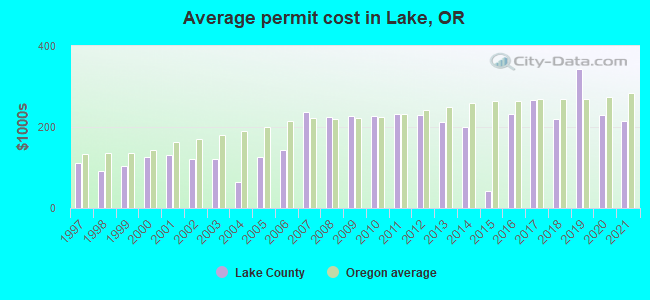
Single-family new house construction building permits:
- 2022: 21 buildings, average cost: $216,900
- 2021: 23 buildings, average cost: $214,600
- 2020: 8 buildings, average cost: $230,100
- 2019: 10 buildings, average cost: $342,400
- 2018: 14 buildings, average cost: $220,000
- 2017: 13 buildings, average cost: $266,800
- 2016: 6 buildings, average cost: $233,100
- 2015: 4 buildings, average cost: $42,400
- 2014: 9 buildings, average cost: $201,400
- 2013: 11 buildings, average cost: $212,000
- 2012: 10 buildings, average cost: $230,200
- 2011: 10 buildings, average cost: $231,200
- 2010: 11 buildings, average cost: $226,400
- 2009: 10 buildings, average cost: $227,000
- 2008: 16 buildings, average cost: $224,600
- 2007: 31 buildings, average cost: $236,800
- 2006: 32 buildings, average cost: $141,900
- 2005: 31 buildings, average cost: $127,100
- 2004: 19 buildings, average cost: $63,300
- 2003: 15 buildings, average cost: $122,400
- 2002: 18 buildings, average cost: $120,100
- 2001: 21 buildings, average cost: $130,400
- 2000: 16 buildings, average cost: $126,300
- 1999: 26 buildings, average cost: $104,000
- 1998: 20 buildings, average cost: $90,700
- 1997: 17 buildings, average cost: $112,400
Median real estate property taxes paid for housing units with mortgages in 2022: $1,553 (0.7%)
Median real estate property taxes paid for housing units with no mortgage in 2022: $1,230 (0.8%)
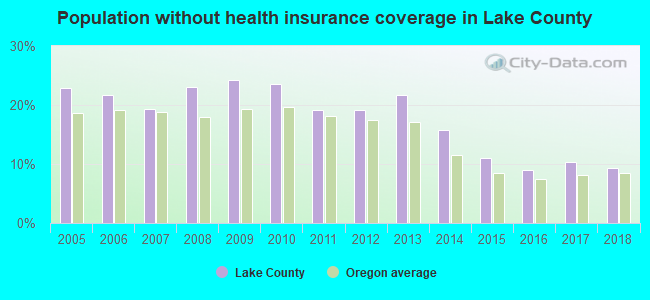
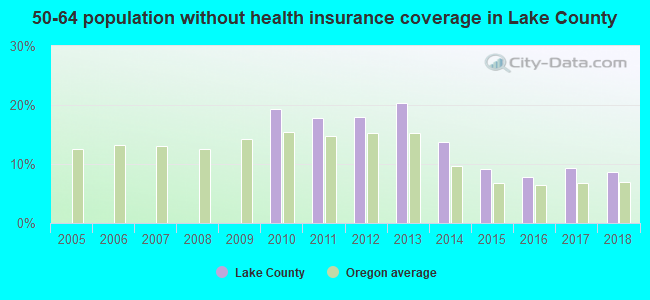
| Lake County: | 19.9% |
| Oregon: | 12.1% |
Median age of residents in 2022: 46.8 years old
(Males: 46.9 years old, Females: 46.7 years old)
(Median age for: White residents: 50.1 years old, Black residents: 54.6 years old, American Indian residents: 43.5 years old, Asian residents: 33.4 years old, Hispanic or Latino residents: 31.4 years old, Other race residents: 70.1 years old)
Fair market rent in 2006 for a 1-bedroom apartment in Lake County is $429 a month.
Fair market rent for a 2-bedroom apartment is $540 a month.
Fair market rent for a 3-bedroom apartment is $746 a month.
Cities in this county include: Lakeview, Silver Lake-Fort Rock, Summer Lake, Warner Valley, Paisley, Silver Lake, Plush.
2023 air pollution in Lake County:
Particulate Matter (PM2.5) Annual: 5.4 µg/m3(standard limit: 15.0 µg/m3). Below U.S. average.
Notable locations in this county outside city limits:
Notable locations in Lake County: Lamm Camp (A), Kittredge Ranch (B), King Spruce Camp (C), Princess Creek Campground Boat Ramp (D), King Cole (E), Trapper Creek Boat Ramp (F), McCartie Ranch (G), Shelter Cove Boat Ramp (H), Beaver Marsh Guard Station (I), Mazama Junction (J), Rainbow Bay Boat Launch (K), Aspen Point Campground Boat Ramp (L), Johnson Meadow Guard Station (M), Johnson Barn (N), Crescent Lake Resort Boat Ramp (O), Sunset Cove Campground Boat Ramp (P), Jamison Ranch (Q), Jackson Creek Guard Station (R), Jack Creek Corral (S), Ivory Pine Mill (T). Display/hide their locations on the map
Church in Lake County: Williamson River Mission (A). Display/hide its location on the map
Cemeteries: Way Cemetery (1), Spencer Cemetery (2), Paiute Cemetery (3), Masekesket Cemetery (4), Merrill IOOF Cemetery (5), Indian Burial Ground (6), Bedfield Cemetery (7). Display/hide their locations on the map
Lakes, reservoirs, and swamps: Lake Francis (A), Freye Lake (B), Frog Lake (C), White Pine Lake (D), Lake Gladys (E), Grass Lake (F), Mystic Lake (G), Lake Harriette (H). Display/hide their locations on the map
Streams, rivers, and creeks: Yaden Creek (A), Yoss Creek (B), Knight Creek (C), Johnston Creek (D), Jackson Creek (E), Jack Creek (F), Irving Creek (G), Middle Fork Copeland Creek (H), Munson Creek (I). Display/hide their locations on the map
Parks in Lake County include: Eagle Ridge County Park (1), Fort Klamath Park Museum (2), Warford Park (3), Antelope Reservoir Day-Use Area (4), Collier Memorial State Park (5), Foster Field (6), Jackson F Kimball State Park (7), Sinnott Memorial (8), Upper Klamath National Wildlife Refuge (9). Display/hide their locations on the map
Neighboring counties: Addison County, Vermont  , Bingham County, Idaho , Lincoln County, Maine , Boyd County, Nebraska , Washoe County, Nevada
  , Jefferson County, New York , Sullivan County, New York .
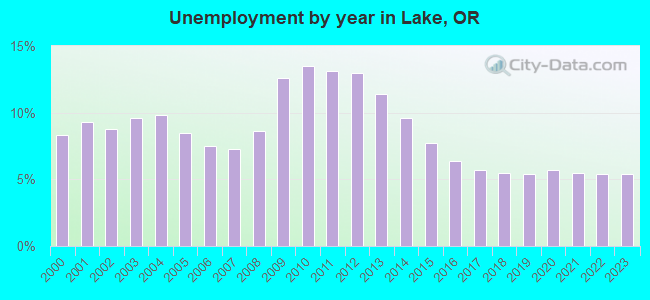
| Here: | 5.6% |
| Oregon: | 3.9% |
Current college students: 101
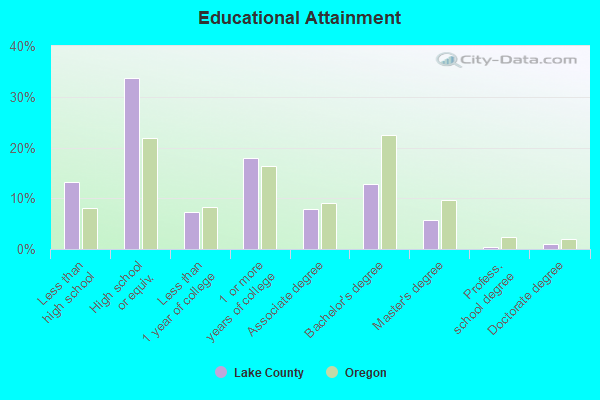
People 25 years of age or older with a high school degree or higher: 87.0%
People 25 years of age or older with a bachelor's degree or higher: 19.8%
Number of foreign born residents: 531 (23.5% naturalized citizens)
| Lake County: | 6.5% |
| Whole state: | 9.9% |
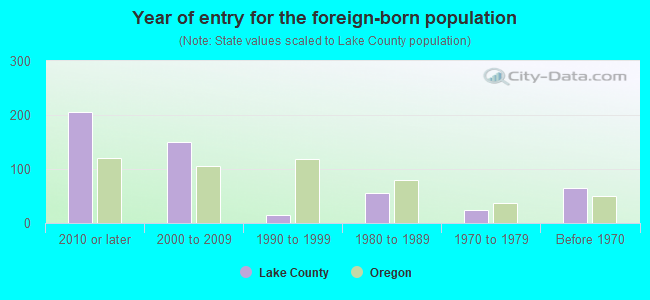
- Year of entry for the foreign-born population
- 2462010 or later
- 1692000 to 2009
- 111990 to 1999
- 551980 to 1989
- 241970 to 1979
- 64Before 1970
Mean travel time to work (commute): minutes
Percentage of county residents living and working in this county: 98.6%

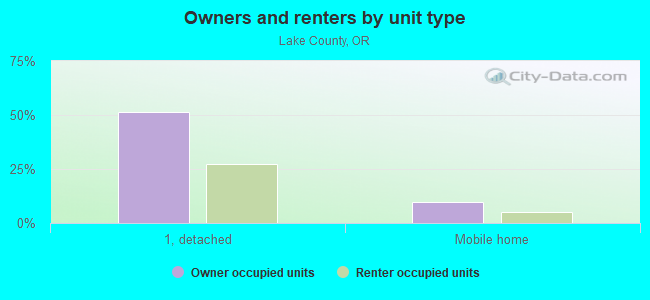
Housing units in structures:
- One, detached: 3,145
- One, attached: 39
- Two: 46
- 3 or 4: 48
- 5 to 9: 50
- 10 to 19: 68
- 20 or more: 11
- Mobile homes: 789
- Boats, RVs, vans, etc.: 52
Housing units in Lake County with a mortgage: 924 (72 second mortgage, 0 home equity loan, 42 both second mortgage and home equity loan)
Houses without a mortgage: 5
| Here: | 99.5% with mortgage |
| State: | 98.0% with mortgage |
Religion statistics for Lake County
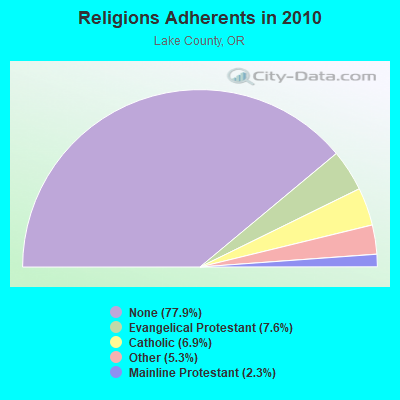
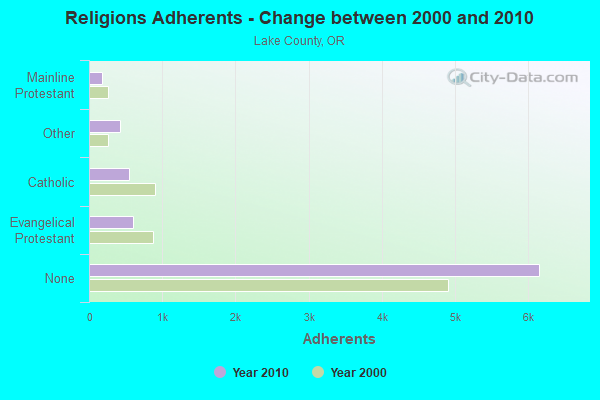
| Religion | Adherents | Congregations |
|---|---|---|
| Evangelical Protestant | 597 | 14 |
| Catholic | 548 | 5 |
| Other | 417 | 3 |
| Mainline Protestant | 183 | 4 |
| None | 6,150 | - |
Source: Clifford Grammich, Kirk Hadaway, Richard Houseal, Dale E.Jones, Alexei Krindatch, Richie Stanley and Richard H.Taylor. 2012. 2010 U.S.Religion Census: Religious Congregations & Membership Study. Association of Statisticians of American Religious Bodies. Jones, Dale E., et al. 2002. Congregations and Membership in the United States 2000. Nashville, TN: Glenmary Research Center.
Food Environment Statistics:
| Lake County: | 4.14 / 10,000 pop. |
| State: | 2.03 / 10,000 pop. |
| This county: | 1.38 / 10,000 pop. |
| Oregon: | 2.01 / 10,000 pop. |
| Lake County: | 4.14 / 10,000 pop. |
| Oregon: | 1.69 / 10,000 pop. |
| This county: | 12.42 / 10,000 pop. |
| State: | 9.93 / 10,000 pop. |
| Lake County: | 8.7% |
| Oregon: | 7.4% |
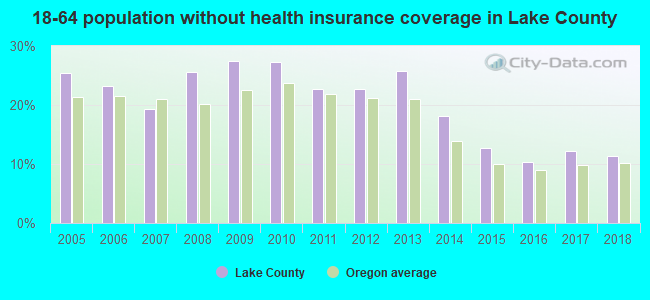
| Lake County: | 24.5% |
| State: | 25.6% |
| Here: | 11.0% |
| State: | 14.2% |
Agriculture in Lake County:
Average size of farms: 1619 acresAverage value of agricultural products sold per farm: $123,350
Average value of crops sold per acre for harvested cropland: $174.50
The value of livestock, poultry, and their products as a percentage of the total market value of agricultural products sold: 52.72%
Average total farm production expenses per farm: $110,256
Harvested cropland as a percentage of land in farms: 20.65%
Irrigated harvested cropland as a percentage of land in farms: 92.49%
Average market value of all machinery and equipment per farm: $136,503
The percentage of farms operated by a family or individual: 82.47%
Average age of principal farm operators: 56 years
Average number of cattle and calves per 100 acres of all land in farms: 11.46
Tornado activity:
Lake County historical area-adjusted tornado activity is significantly below Oregon state average. It is 827797273.8 times below overall U.S. average.Earthquake activity:
Lake County-area historical earthquake activity is significantly above Oregon state average. It is 3297% greater than the overall U.S. average.On 10/3/1915 at 06:52:48, a magnitude 7.6 (7.6 UK, Class: Major, Intensity: VIII - XII) earthquake occurred 220.8 miles away from Lake County center
On 4/18/1906 at 13:12:21, a magnitude 7.9 (7.9 UK) earthquake occurred 350.1 miles away from the county center, causing $524,000,000 total damage
On 1/31/1922 at 13:17:28, a magnitude 7.6 (7.6 UK) earthquake occurred 292.2 miles away from the county center
On 11/8/1980 at 10:27:34, a magnitude 7.2 (6.2 MB, 7.2 MS, 7.2 MW, 7.0 ML) earthquake occurred 221.4 miles away from the county center
On 4/25/1992 at 18:06:04, a magnitude 7.2 (6.3 MB, 7.1 MS, 7.2 MW, 7.1 MW, Depth: 9.4 mi) earthquake occurred 243.7 miles away from Lake County center, causing $75,000,000 total damage
On 8/17/1991 at 22:17:14, a magnitude 7.1 (6.2 MB, 7.1 MS, 7.1 MW, 6.8 ML, Depth: 8.4 mi) earthquake occurred 265.0 miles away from the county center
Magnitude types: body-wave magnitude (MB), local magnitude (ML), surface-wave magnitude (MS), moment magnitude (MW)
Most recent natural disasters:
- Oregon Wildfires And Straight-line Winds, Incident Period: September 7, 2020 - November 3, 2020, FEMA Id: 4562, Natural disaster type: Fire, Wind
- Oregon Covid-19 Pandemic, Incident Period: January 20, 2020, Major Disaster (Presidential) Declared DR-4499-OR: March 28, 2020, FEMA Id: 4499, Natural disaster type: Other
- Oregon Hurricane Katrina Evacuation, Incident Period: August 29, 2005 to October 01, 2005, Emergency Declared EM-3228: September 07, 2005, FEMA Id: 3228, Natural disaster type: Hurricane
- Oregon Severe Winter Storms, Incident Period: December 26, 2003 to January 14, 2004, Major Disaster (Presidential) Declared DR-1510: February 19, 2004, FEMA Id: 1510, Natural disaster type: Winter Storm
- Oregon Winter Fire, Incident Period: July 15, 2002 to July 25, 2002, Fire Management Assistance Declared: July 16, 2002, FEMA Id: 2444, Natural disaster type: Fire
- Oregon Severe Winter Storms/Flooding, Incident Period: December 25, 1996 to January 06, 1997, Major Disaster (Presidential) Declared DR-1160: January 23, 1997, FEMA Id: 1160, Natural disaster type: Winter Storm, Flood
- Oregon Drought, Incident Period: April 29, 1977, Emergency Declared EM-3039: April 29, 1977, FEMA Id: 3039, Natural disaster type: Drought
- Oregon Heavy Rains & Flooding, Incident Period: December 24, 1964, Major Disaster (Presidential) Declared DR-184: December 24, 1964, FEMA Id: 184, Natural disaster type: Flood, Heavy Rain
The number of natural disasters in Lake County (8) is smaller than the US average (15).
Major Disasters (Presidential) Declared: 4
Emergencies Declared: 2
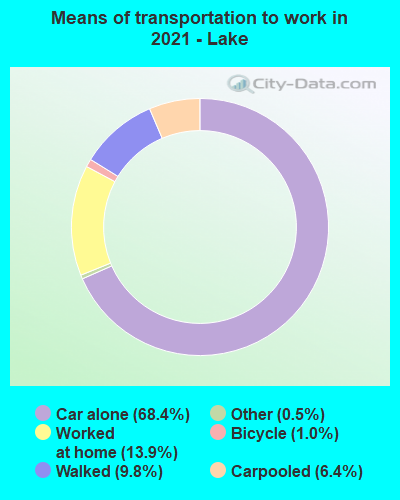
Means of transportation to work:
- Drove a car alone: 2,147 (65.6%)
- Carpooled: 285 (8.7%)
- Taxicab, motorcycle, or other means: 3 (0.1%)
- Bicycle: 28 (0.9%)
- Walked: 327 (10.0%)
- Worked at home: 497 (15.2%)
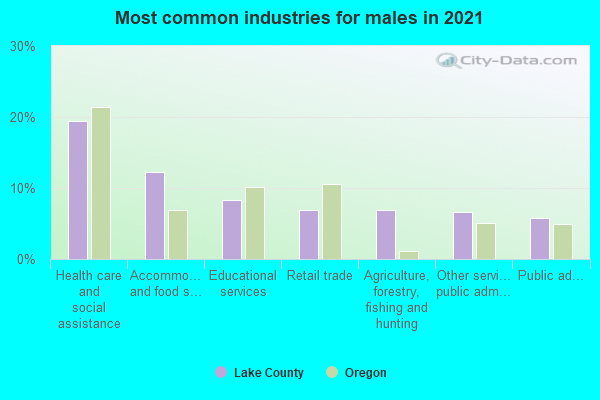
- Health care and social assistance (19%)
- Educational services (11%)
- Agriculture, forestry, fishing and hunting (10%)
- Accommodation and food services (9%)
- Retail trade (8%)
- Other services, except public administration (4%)
- Professional, scientific, and technical services (3%)
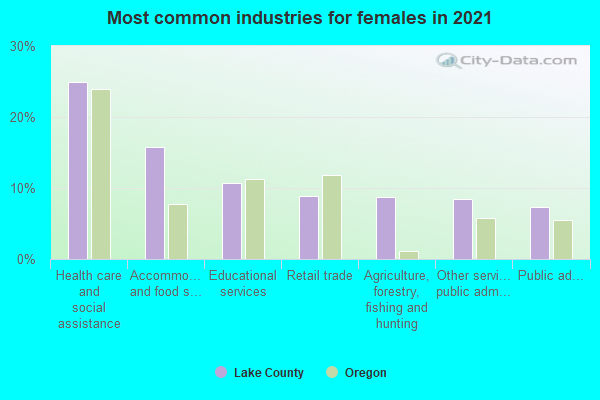
- Health care and social assistance (25%)
- Educational services (14%)
- Agriculture, forestry, fishing and hunting (13%)
- Accommodation and food services (12%)
- Retail trade (11%)
- Other services, except public administration (6%)
- Professional, scientific, and technical services (4%)
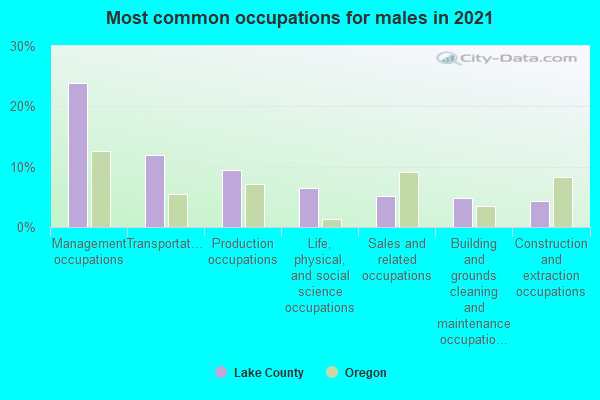
- Management occupations (18%)
- Transportation occupations (11%)
- Farming, fishing, and forestry occupations (8%)
- Production occupations (6%)
- Sales and related occupations (6%)
- Construction and extraction occupations (5%)
- Life, physical, and social science occupations (5%)
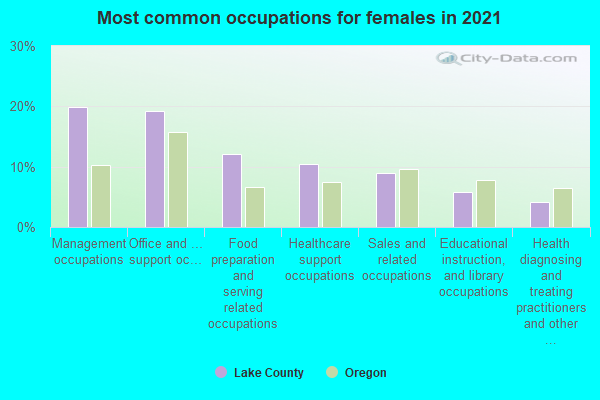
- Management occupations (18%)
- Office and administrative support occupations (16%)
- Healthcare support occupations (12%)
- Food preparation and serving related occupations (10%)
- Educational instruction, and library occupations (10%)
- Sales and related occupations (10%)
- Health diagnosing and treating practitioners and other technical occupations (5%)
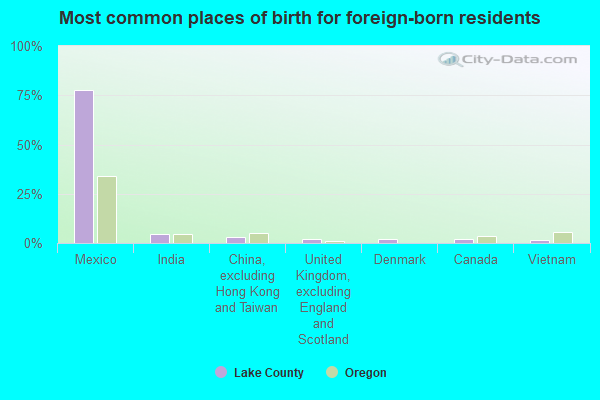
- Mexico (80%)
- India (5%)
- Denmark (2%)
- Canada (2%)
- Ireland (2%)
- France (2%)
- United Kingdom, excluding England and Scotland (2%)
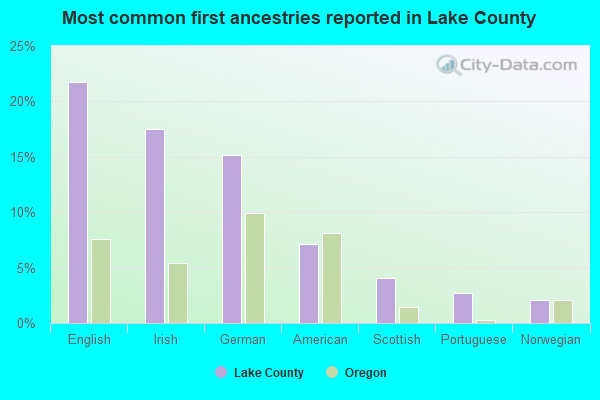
- Irish (21%)
- English (18%)
- German (11%)
- American (10%)
- Scottish (3%)
- European (3%)
- Portuguese (2%)
People in group quarters in Lake County, Oregon in 2010:
- 394 people in state prisons
- 23 people in nursing facilities/skilled-nursing facilities
- 22 people in group homes intended for adults
- 13 people in local jails and other municipal confinement facilities
- 2 people in workers' group living quarters and job corps centers
People in group quarters in Lake County, Oregon in 2000:
- 35 people in orthopedic wards and institutions for the physically handicapped
- 7 people in other group homes
- 6 people in local jails and other confinement facilities (including police lockups)
- 5 people in agriculture workers' dormitories on farms
- 2 people in hospitals or wards for drug/alcohol abuse
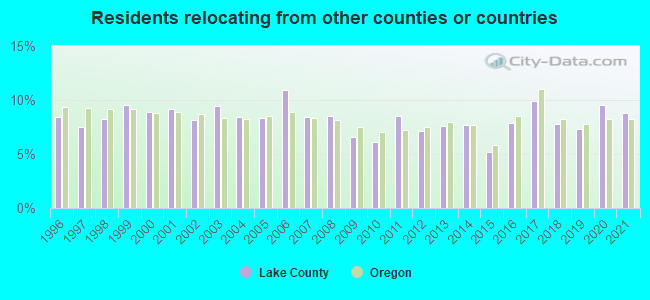
8.84% of this county's 2021 resident taxpayers lived in other counties in 2020 ($44,233 average adjusted gross income)
| Here: | 8.84% |
| Oregon average: | 8.20% |
10 or fewer of this county's residents moved from foreign countries.
5.26% relocated from other counties in Oregon ($23,847 average AGI)
3.59% relocated from other states ($20,386 average AGI)
Lake County: 3.59% Oregon average: 3.99%
Top counties from which taxpayers relocated into this county between 2020 and 2021:
| from Deschutes County, OR |
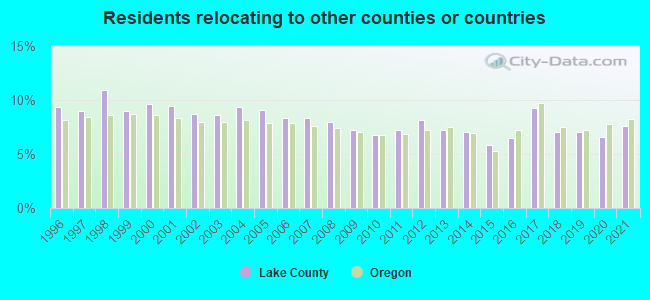
7.63% of this county's 2020 resident taxpayers moved to other counties in 2021 ($39,505 average adjusted gross income)
| Here: | 7.63% |
| Oregon average: | 8.24% |
10 or fewer of this county's residents moved to foreign countries.
4.32% relocated to other counties in Oregon ($20,816 average AGI)
3.31% relocated to other states ($18,689 average AGI)
Lake County: 3.31% Oregon average: 4.04%
Top counties to which taxpayers relocated from this county between 2020 and 2021:
| to Klamath County, OR |
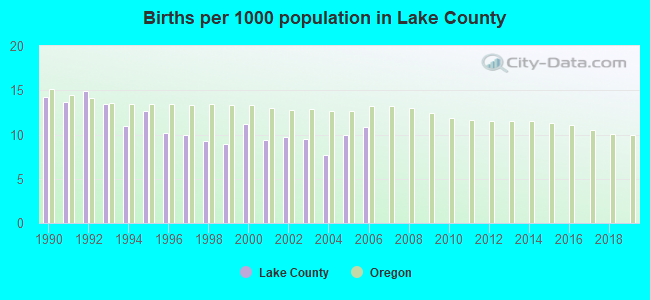
Births per 1000 population from 1990 to 1999: 11.8
Births per 1000 population from 2000 to 2006: 9.8
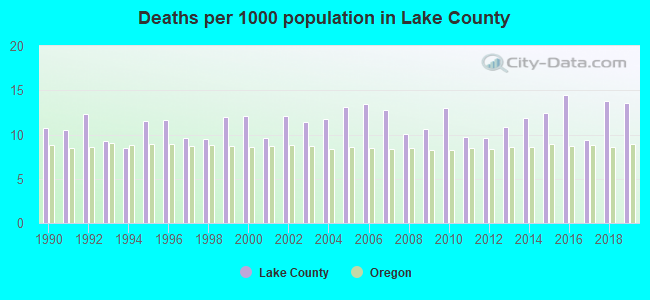
Deaths per 1000 population from 1990 to 1999: 10.5
Deaths per 1000 population from 2000 to 2009: 11.7
Deaths per 1000 population from 2010 to 2020: 12.1
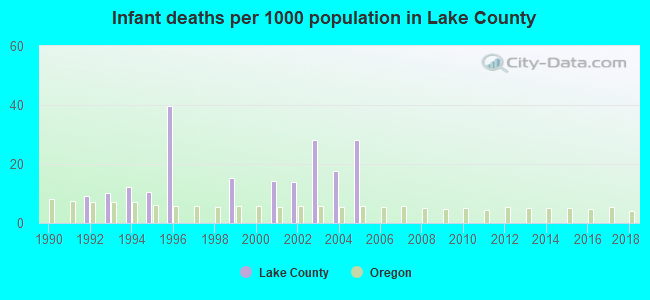
Infant deaths per 1000 live births from 1990 to 1999: 9.7
Infant deaths per 1000 live births from 2000 to 2006: 14.6
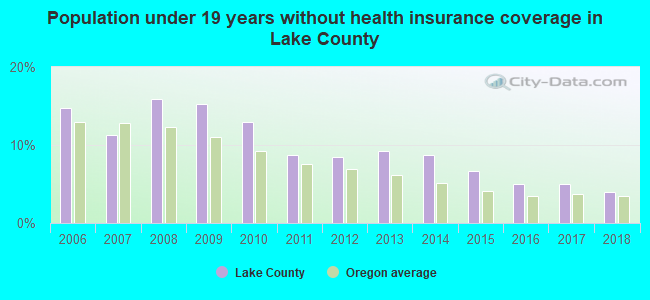
Persons under 19 years old without health insurance coverage in 2018: 4.0%

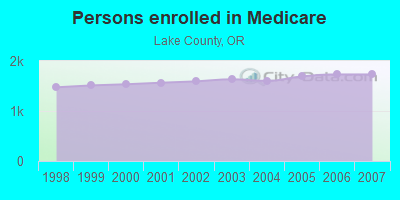
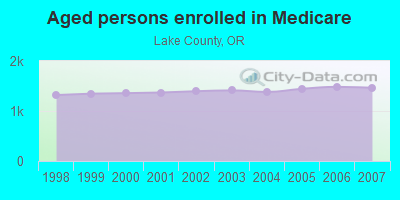
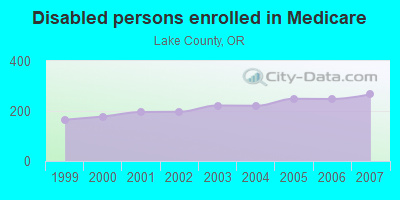
Persons enrolled in hospital insurance and/or supplemental medical insurance (Medicare) in July 1, 2007: 1,731 (1,464 aged, 267 disabled)
Children under 18 without health insurance coverage in 2007: 266 (19%)
Most common underlying causes of death in Lake County, Oregon in 1999 - 2019:
- Acute myocardial infarction, unspecified (12)
- Atherosclerotic heart disease (10)
Population without health insurance coverage in 2000: 20%
Children under 18 without health insurance coverage in 2000: 17%
Short term general hospital admissions per 100,000 population in 2004: 9,577
Short term general hospital beds per 100,000 population in 2004: 921
Emergency room visits per 100,000 population in 2004: 33,568
General practice office based MDs per 100,000 population in 2005: 752
Medical specialist MDs per 100,000 population in 2005: 1,176
Dentists per 100,000 population in 1998: 14
Total births per 100,000 population, July 2005 - July 2006 : 56
Total deaths per 100,000 population, July 2005 - July 2006: 109
Limited-service eating places per 100,000 population in 2005 : 14
Beer, wine & liquor stores per 100,000 population in 2005: 1
Household type by relationship:
Households: 8,221- Male householders: 1,850 (709 living alone), Female householders: 1,598 (554 living alone)
1,529 spouses (1,434 opposite-sex spouses), 206 unmarried partners, (193 opposite-sex unmarried partners), 1,734 children (1,639 natural, 9 adopted, 85 stepchildren), 93 grandchildren, 130 brothers or sisters, 149 parents, 0 foster children, 228 other relatives, 179 non-relatives
- In group quarters: 539
Size of family households: 1,158 2-persons, 251 3-persons, 333 4-persons, 61 5-persons, 87 6-persons, 37 7-or-more-persons.
Size of nonfamily households: 1,263 1-person, 289 2-persons.
1,072 married couples with children.
246 single-parent households (29 men, 217 women).
90.9% of residents of Lake speak English at home.
7.6% of residents speak Spanish at home (59% speak English very well, 11% speak English well, 7% speak English not well, 22% don't speak English at all).
1.2% of residents speak other Indo-European language at home (100% speak English very well).
0.1% of residents speak Asian or Pacific Island language at home (100% speak English very well).
0.2% of residents speak other language at home (100% speak English very well).
In fiscal year 2004:
Federal Government expenditure: $60,665,000 ($8,218 per capita)
Department of Defense expenditure: $1,026,000
Federal direct payments to individuals for retirement and disability: $26,467,000
Federal other direct payments to individuals: $8,904,000
Federal direct payments not to individuals: $345,000
Federal grants: $5,280,000
Federal procurement contracts: $6,217,000 ($0,000 Department of Defense)
Federal salaries and wages: $13,452,000 ($0,000 Department of Defense)
Federal Government direct loans: $438,000
Federal guaranteed/insured loans: $938,000
Federal Government insurance: $4,634,000
Population change from April 1, 2000 to July 1, 2005:
Births: 380| Here: | 52 per 1000 residents |
| State: | 65 per 1000 residents |
Deaths: 426
| Here: | 58 per 1000 residents |
| State: | 44 per 1000 residents |
Net international migration: +47
| Here: | +6 per 1000 residents |
| State: | +20 per 1000 residents |
Net internal migration: -95
| Here: | |
| State: |
Total withdrawal of fresh water for public supply: 2.18 millions of gallons per day (85% from ground, 15% from surface)
| Here: | 5.5 |
| State: | 6.2 |
| Here: | 4.5 |
| State: | 4.0 |
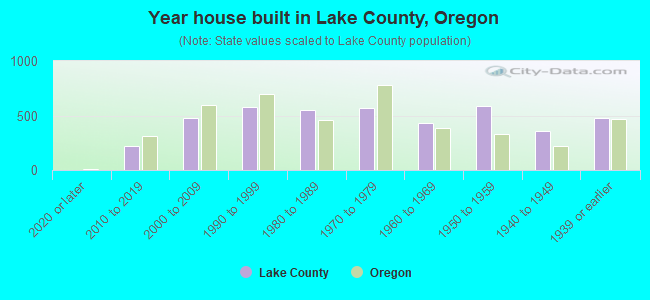
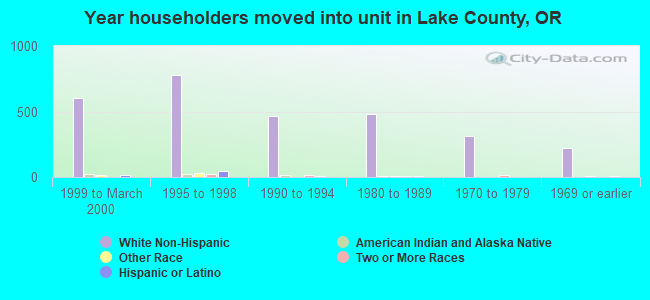
- Year house built in Lake County, Oregon
- 02020 or later
- 1232010 to 2019
- 4732000 to 2009
- 4931990 to 1999
- 6201980 to 1989
- 5961970 to 1979
- 5001960 to 1969
- 4681950 to 1959
- 3971940 to 1949
- 5221939 or earlier
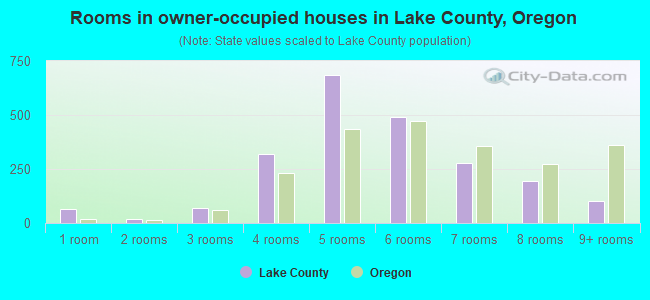
- Rooms in owner-occupied houses in Lake County, Oregon
- 351 room
- 162 rooms
- 793 rooms
- 3444 rooms
- 6035 rooms
- 5306 rooms
- 2147 rooms
- 2368 rooms
- 959+ rooms
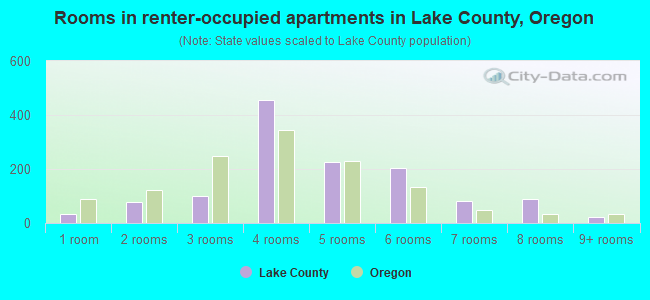
- Rooms in renter-occupied apartments in Lake County, Oregon
- 351 room
- 1022 rooms
- 873 rooms
- 4194 rooms
- 2495 rooms
- 2326 rooms
- 917 rooms
- 618 rooms
- 159+ rooms
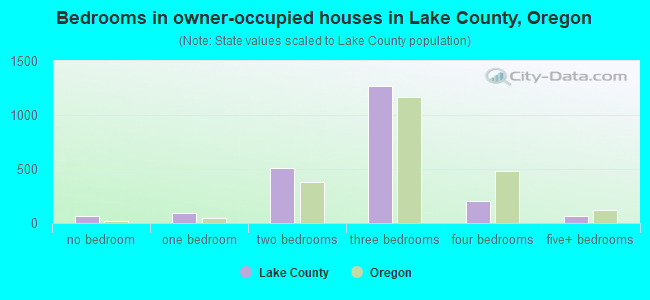
- Bedrooms in owner-occupied houses in Lake County, Oregon
- 35no bedroom
- 1251 bedroom
- 5292 bedrooms
- 1,2163 bedrooms
- 1734 bedrooms
- 595+ bedrooms
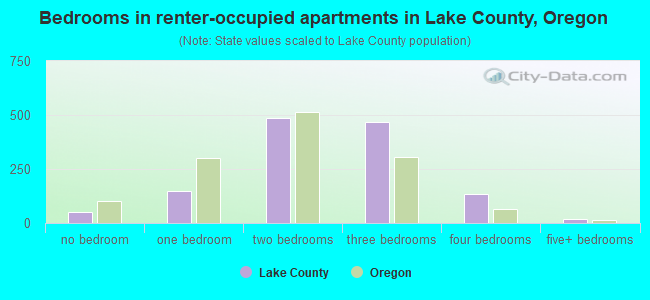
- Bedrooms in renter-occupied apartments in Lake County, Oregon
- 56no bedroom
- 1821 bedroom
- 4252 bedrooms
- 4953 bedrooms
- 1284 bedrooms
- 125+ bedrooms
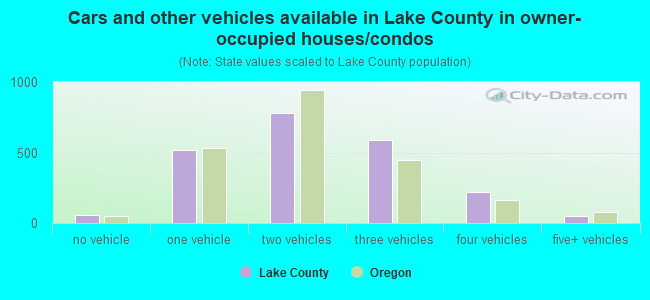
- Cars and other vehicles available in Lake County in owner-occupied houses/condos
- 57no vehicle
- 5481 vehicle
- 7512 vehicles
- 5233 vehicles
- 2204 vehicles
- 465+ vehicles
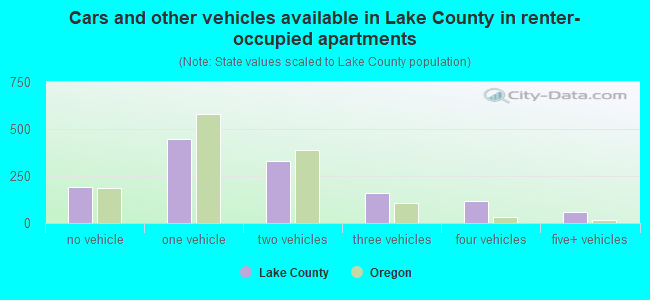
- Cars and other vehicles available in Lake County in renter-occupied apartments
- 215no vehicle
- 4851 vehicle
- 3002 vehicles
- 1433 vehicles
- 994 vehicles
- 745+ vehicles
84.5% of Lake County residents lived in the same house 1 years ago.
Out of people who lived in different houses, 32% lived in this county.
Out of people who lived in different counties, 86% lived in Oregon.
| Lake County: | 84.5% |
| State average: | 85.5% |
Place of birth for U.S.-born residents:
- This state: 4,020
- Other state: 3,639
- Northeast: 159
- Midwest: 484
- South: 525
- West: 2,480
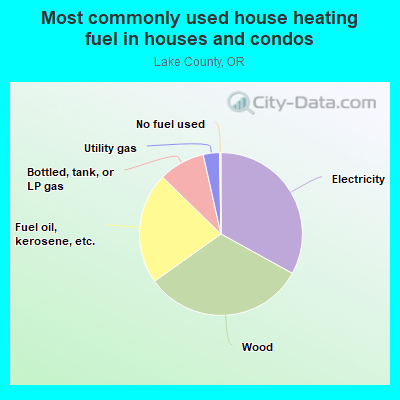
- 36.2%Wood
- 29.9%Electricity
- 21.3%Fuel oil, kerosene, etc.
- 8.3%Bottled, tank, or LP gas
- 3.7%Utility gas
- 0.4%No fuel used
- 0.2%Other fuel
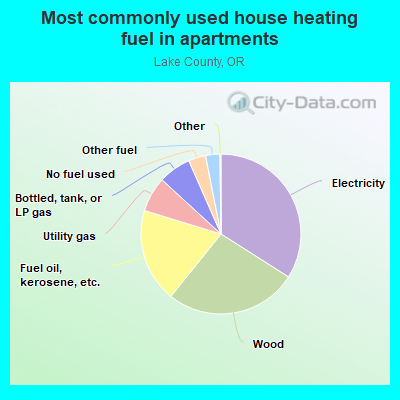
- 34.9%Electricity
- 26.3%Wood
- 18.6%Fuel oil, kerosene, etc.
- 6.8%Bottled, tank, or LP gas
- 6.7%Utility gas
- 5.0%Other fuel
- 1.7%No fuel used
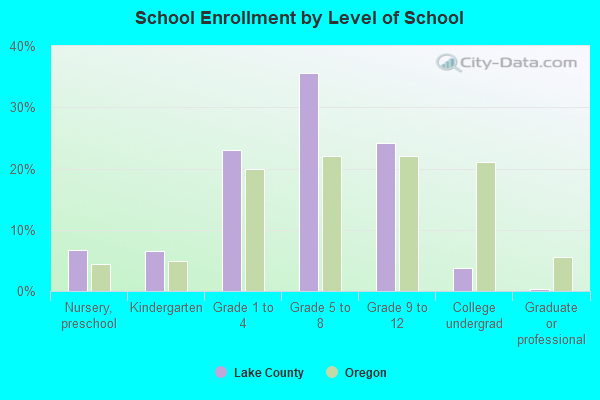
Private vs. public school enrollment:
| Here: | 5.6% |
| Oregon: | 13.7% |
| Here: | 5.9% |
| Oregon: | 8.8% |
| Here: | 10.7% |
| Oregon: | 17.7% |
Lake County government finances - Expenditure in 2018:
- Charges - Other: $642,000
Air Transportation: $285,000
Housing and Community Development: $203,000
Natural Resources - Other: $164,000
Regular Highways: $105,000
Parks and Recreation: $17,000
- Construction - Regular Highways: $1,497,000
Air Transportation: $281,000
Parks and Recreation: $20,000
- Current Operations - Police Protection: $2,268,000
Regular Highways: $1,998,000
General - Other: $1,431,000
Central Staff Services: $1,319,000
Correctional Institutions: $996,000
Financial Administration: $987,000
Health - Other: $625,000
Parks and Recreation: $508,000
Air Transportation: $314,000
Transit Utilities: $286,000
Housing and Community Development: $272,000
General Public Buildings: $256,000
Judicial and Legal Services: $197,000
Solid Waste Management: $142,000
Miscellaneous Commercial Activities - Other: $105,000
Natural Resources - Other: $58,000
- Federal Intergovernmental - Highways: $1,509,000
General Local Government Support: $1,201,000
Air Transportation: $185,000
Other: $34,000
- Intergovernmental to Local - Other - Health - Other: $1,042,000
Other - Corrections: $42,000
- Miscellaneous - Interest Earnings: $412,000
Sale of Property: $121,000
Rents: $53,000
General Revenue - Other: $35,000
Royalties: $12,000
Donations From Private Sources: $10,000
- Other Capital Outlay - Regular Highways: $197,000
Police Protection: $102,000
- Other Funds - Cash and Securities: $27,426,000
- State Intergovernmental - Highways: $3,604,000
Other: $1,272,000
Health and Hospitals: $558,000
General Local Government Support: $337,000
Public Welfare: $125,000
Transit Utilities: $109,000
- Tax - Property: $3,606,000
Other License: $175,000
Other Selective Sales: $173,000
- Total Salaries and Wages: $4,125,000
Lake County government finances - Revenue in 2018:
- Charges - Other: $642,000
Air Transportation: $285,000
Housing and Community Development: $203,000
Natural Resources - Other: $164,000
Regular Highways: $105,000
Parks and Recreation: $17,000
- Construction - Regular Highways: $1,497,000
Air Transportation: $281,000
Parks and Recreation: $20,000
- Current Operations - Police Protection: $2,268,000
Regular Highways: $1,998,000
General - Other: $1,431,000
Central Staff Services: $1,319,000
Correctional Institutions: $996,000
Financial Administration: $987,000
Health - Other: $625,000
Parks and Recreation: $508,000
Air Transportation: $314,000
Transit Utilities: $286,000
Housing and Community Development: $272,000
General Public Buildings: $256,000
Judicial and Legal Services: $197,000
Solid Waste Management: $142,000
Miscellaneous Commercial Activities - Other: $105,000
Natural Resources - Other: $58,000
- Federal Intergovernmental - Highways: $1,509,000
General Local Government Support: $1,201,000
Air Transportation: $185,000
Other: $34,000
- Intergovernmental to Local - Other - Health - Other: $1,042,000
Other - Corrections: $42,000
- Miscellaneous - Interest Earnings: $412,000
Sale of Property: $121,000
Rents: $53,000
General Revenue - Other: $35,000
Royalties: $12,000
Donations From Private Sources: $10,000
- Other Capital Outlay - Regular Highways: $197,000
Police Protection: $102,000
- Other Funds - Cash and Securities: $27,426,000
- State Intergovernmental - Highways: $3,604,000
Other: $1,272,000
Health and Hospitals: $558,000
General Local Government Support: $337,000
Public Welfare: $125,000
Transit Utilities: $109,000
- Tax - Property: $3,606,000
Other License: $175,000
Other Selective Sales: $173,000
- Total Salaries and Wages: $4,125,000
Lake County government finances - Debt in 2018:
- Charges - Other: $642,000
Air Transportation: $285,000
Housing and Community Development: $203,000
Natural Resources - Other: $164,000
Regular Highways: $105,000
Parks and Recreation: $17,000
- Construction - Regular Highways: $1,497,000
Air Transportation: $281,000
Parks and Recreation: $20,000
- Current Operations - Police Protection: $2,268,000
Regular Highways: $1,998,000
General - Other: $1,431,000
Central Staff Services: $1,319,000
Correctional Institutions: $996,000
Financial Administration: $987,000
Health - Other: $625,000
Parks and Recreation: $508,000
Air Transportation: $314,000
Transit Utilities: $286,000
Housing and Community Development: $272,000
General Public Buildings: $256,000
Judicial and Legal Services: $197,000
Solid Waste Management: $142,000
Miscellaneous Commercial Activities - Other: $105,000
Natural Resources - Other: $58,000
- Federal Intergovernmental - Highways: $1,509,000
General Local Government Support: $1,201,000
Air Transportation: $185,000
Other: $34,000
- Intergovernmental to Local - Other - Health - Other: $1,042,000
Other - Corrections: $42,000
- Miscellaneous - Interest Earnings: $412,000
Sale of Property: $121,000
Rents: $53,000
General Revenue - Other: $35,000
Royalties: $12,000
Donations From Private Sources: $10,000
- Other Capital Outlay - Regular Highways: $197,000
Police Protection: $102,000
- Other Funds - Cash and Securities: $27,426,000
- State Intergovernmental - Highways: $3,604,000
Other: $1,272,000
Health and Hospitals: $558,000
General Local Government Support: $337,000
Public Welfare: $125,000
Transit Utilities: $109,000
- Tax - Property: $3,606,000
Other License: $175,000
Other Selective Sales: $173,000
- Total Salaries and Wages: $4,125,000
Lake County government finances - Cash and Securities in 2018:
- Charges - Other: $642,000
Air Transportation: $285,000
Housing and Community Development: $203,000
Natural Resources - Other: $164,000
Regular Highways: $105,000
Parks and Recreation: $17,000
- Construction - Regular Highways: $1,497,000
Air Transportation: $281,000
Parks and Recreation: $20,000
- Current Operations - Police Protection: $2,268,000
Regular Highways: $1,998,000
General - Other: $1,431,000
Central Staff Services: $1,319,000
Correctional Institutions: $996,000
Financial Administration: $987,000
Health - Other: $625,000
Parks and Recreation: $508,000
Air Transportation: $314,000
Transit Utilities: $286,000
Housing and Community Development: $272,000
General Public Buildings: $256,000
Judicial and Legal Services: $197,000
Solid Waste Management: $142,000
Miscellaneous Commercial Activities - Other: $105,000
Natural Resources - Other: $58,000
- Federal Intergovernmental - Highways: $1,509,000
General Local Government Support: $1,201,000
Air Transportation: $185,000
Other: $34,000
- Intergovernmental to Local - Other - Health - Other: $1,042,000
Other - Corrections: $42,000
- Miscellaneous - Interest Earnings: $412,000
Sale of Property: $121,000
Rents: $53,000
General Revenue - Other: $35,000
Royalties: $12,000
Donations From Private Sources: $10,000
- Other Capital Outlay - Regular Highways: $197,000
Police Protection: $102,000
- Other Funds - Cash and Securities: $27,426,000
- State Intergovernmental - Highways: $3,604,000
Other: $1,272,000
Health and Hospitals: $558,000
General Local Government Support: $337,000
Public Welfare: $125,000
Transit Utilities: $109,000
- Tax - Property: $3,606,000
Other License: $175,000
Other Selective Sales: $173,000
- Total Salaries and Wages: $4,125,000
Supplemental Security Income (SSI) in 2006:
- Total number of recipients: 184
- Number of aged recipients: 20
- Number of blind and disabled recipients: 164
- Number of recipients under 18: 13
- Number of recipients between 18 and 64: 132
- Number of recipients older than 64: 39
- Number of recipients also receiving OASDI: 83
- Amount of payments (thousands of dollars): 96
| Most common first names in Lake County, OR among deceased individuals | ||
| Name | Count | Lived (average) |
|---|---|---|
| John | 43 | 76.4 years |
| Mary | 42 | 81.7 years |
| William | 40 | 76.1 years |
| James | 36 | 74.4 years |
| Robert | 35 | 74.1 years |
| George | 27 | 78.6 years |
| Frank | 26 | 75.6 years |
| Charles | 22 | 72.6 years |
| Donald | 19 | 73.4 years |
| Clarence | 19 | 78.0 years |
| Most common last names in Lake County, OR among deceased individuals | ||
| Last name | Count | Lived (average) |
|---|---|---|
| Murphy | 16 | 76.1 years |
| Williams | 13 | 76.3 years |
| Johnson | 12 | 76.4 years |
| Smith | 12 | 71.7 years |
| Lewis | 10 | 77.2 years |
| Jones | 10 | 75.0 years |
| Oconnor | 10 | 76.0 years |
| Wood | 10 | 70.0 years |
| Clark | 10 | 71.0 years |
| Peterson | 9 | 82.2 years |
| Businesses in Lake County, OR | ||||
| Name | Count | Name | Count | |
|---|---|---|---|---|
| Best Western | 1 | RadioShack | 1 | |
| Chevrolet | 1 | True Value | 1 | |
| Curves | 1 | U-Haul | 1 | |
| FedEx | 1 | U.S. Cellular | 1 | |
| Ford | 1 | UPS | 1 | |
| Lane Furniture | 1 | Vons | 1 | |