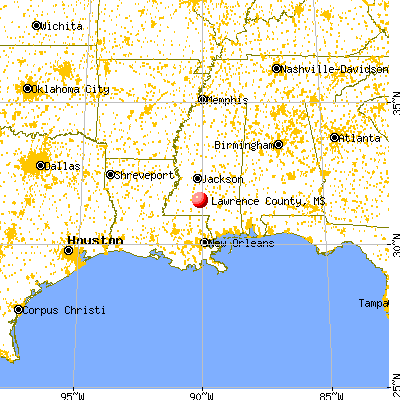
Lawrence County, Mississippi (MS)
County owner-occupied free and clear houses and condos in 2010: 2,080
County owner-occupied houses and condos in 2000: 4,247
Renter-occupied apartments: 909 (it was 793 in 2000)
| % of renters here: | 16% |
| State: | 30% |
Land area: 431 sq. mi.
Water area: 5.1 sq. mi.
Population density: 28 people per square mile (low).
Industries providing employment: Educational, health and social services (22.0%), Retail trade (14.3%), Manufacturing (11.2%).
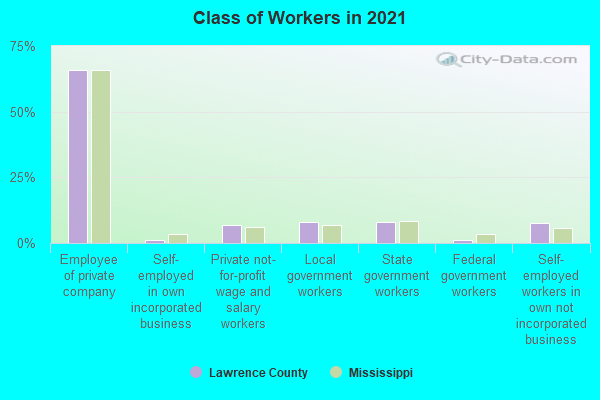
Type of workers:
- Private wage or salary: 72%
- Government: 20%
- Self-employed, not incorporated: 7%
- Unpaid family work: 0%
- OSM Map
- General Map
- Google Map
- MSN Map

- 7,52263.6%White Non-Hispanic Alone
- 3,66731.0%Black Non-Hispanic Alone
- 2812.4%Hispanic or Latino
- 2792.4%Two or more races
- 460.4%American Indian and Alaska Native alone
- 210.2%Asian alone
- 60.05%Some other race alone

| Median resident age: | 42.0 years |
| Mississippi median age: | 38.9 years |
| Males: 5,794 | |
| Females: 6,063 |

| Lawrence County: | 2.0 people |
| Mississippi: | 3 people |
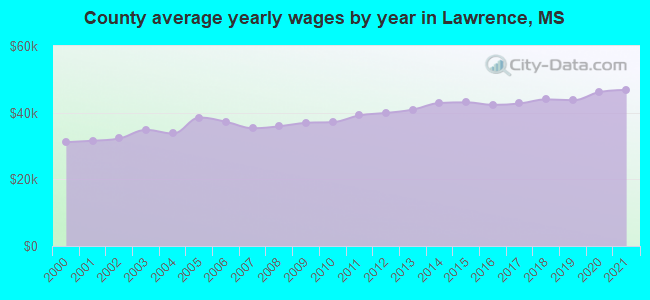
Estimated median household income in 2022: $40,889 ($28,495 in 1999)
| This county: | $40,889 |
| Mississippi: | $52,719 |
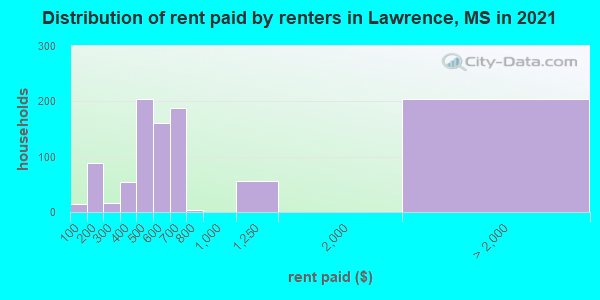
Median contract rent in 2022 for apartments: $501 (lower quartile is $395, upper quartile is $630)
| This county: | $501 |
| State: | $656 |
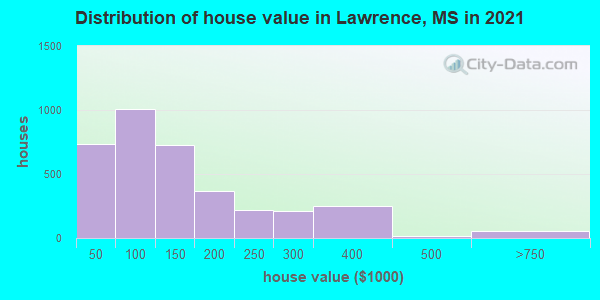
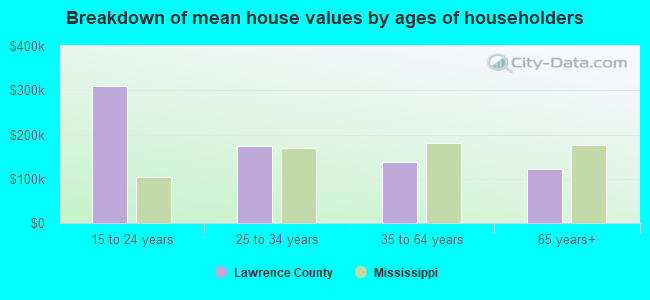
Estimated median house or condo value in 2022: $112,243 (it was $51,300 in 2000)
| Lawrence: | $112,243 |
| Mississippi: | $162,500 |
Mean price in 2022:
Median monthly housing costs for homes and condos with a mortgage: $1,075Detached houses: $162,867
Here: $162,867 State: $226,494 Townhouses or other attached units: $400,418
Here: $400,418 State: $254,198 Mobile homes: $79,702
Here: $79,702 State: $73,695 Occupied boats, RVs, vans, etc.: $24,698
Here: $24,698 State: $99,840
Median monthly housing costs for units without a mortgage: $379
Institutionalized population: 0
Crime in 1996 (reported by the sheriff's office or county police, not the county total):
- Murders: 0
- Rapes: 1
- Robberies: 0
- Assaults: 2
- Burglaries: 2
- Thefts: 1
- Auto thefts: 0
Crime in 1987 (reported by the sheriff's office or county police, not the county total):
- Murders: 0
- Rapes: 1
- Robberies: 0
- Assaults: 0
- Burglaries: 3
- Thefts: 3
- Auto thefts: 0
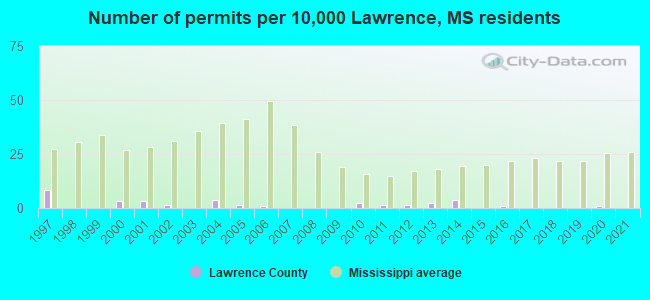
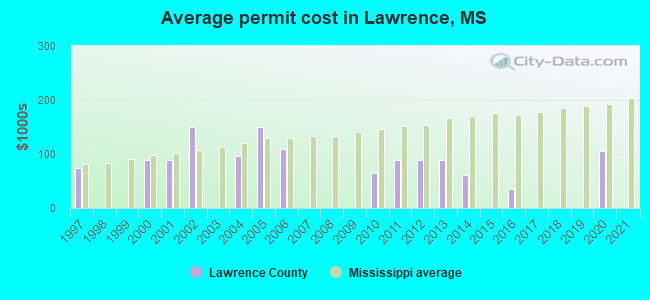
Single-family new house construction building permits:
- 2022: 0 buildings
- 2021: 0 buildings
- 2020: 1 building, cost: $105,000
- 2019: 0 buildings
- 2018: 0 buildings
- 2017: 0 buildings
- 2016: 1 building, cost: $35,000
- 2015: 0 buildings
- 2014: 5 buildings, average cost: $61,200
- 2013: 3 buildings, average cost: $87,500
- 2012: 2 buildings, average cost: $87,500
- 2011: 2 buildings, average cost: $87,500
- 2010: 3 buildings, average cost: $63,700
- 2009: 0 buildings
- 2008: 0 buildings
- 2007: 0 buildings
- 2006: 1 building, cost: $110,000
- 2005: 2 buildings, average cost: $150,200
- 2004: 5 buildings, average cost: $96,900
- 2003: 0 buildings
- 2002: 2 buildings, average cost: $150,000
- 2001: 4 buildings, average cost: $87,500
- 2000: 4 buildings, average cost: $87,500
- 1999: 0 buildings
- 1998: 0 buildings
- 1997: 11 buildings, average cost: $75,100
Median real estate property taxes paid for housing units with mortgages in 2022: $1,019 (0.7%)
Median real estate property taxes paid for housing units with no mortgage in 2022: $584 (0.6%)

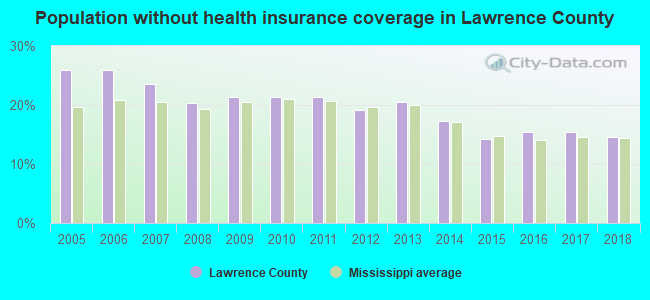
| Lawrence County: | 22.5% |
| Mississippi: | 19.1% |
Median age of residents in 2022: 42.0 years old
(Males: 41.2 years old, Females: 43.5 years old)
(Median age for: White residents: 43.2 years old, Black residents: 43.5 years old, American Indian residents: 49.9 years old, Hispanic or Latino residents: 14.7 years old, Other race residents: 15.6 years old)
Fair market rent in 2006 for a 1-bedroom apartment in Lawrence County is $379 a month.
Fair market rent for a 2-bedroom apartment is $455 a month.
Fair market rent for a 3-bedroom apartment is $571 a month.
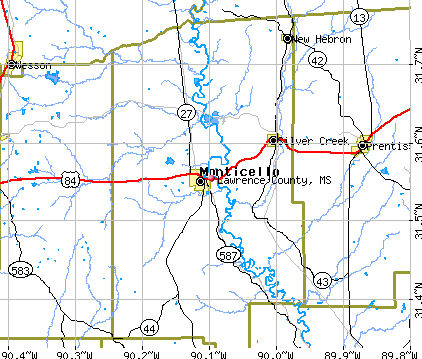
Cities in this county include: Monticello, New Hebron, Silver Creek.
Notable locations in this county outside city limits:
Notable locations in Lawrence County: Alloway Landing (A), Parker Landing (B), Pandella Landing (C), Natchez Country Club (D), Cowpen Point Landing (E), Jackson Point Landing (F), Kienstra Landing (G), Natchez-Adams County Port (H), Giles Landing (I), Eureka Landing (J), Cerro Gordo Landing (K), Briar Landing (L), Carthage Landing (M), Liberty Road Volunteer Fire Department (N), Foster Mound Volunteer Fire Department (O), Lake Montrose Volunteer Fire Department (P), Kingston Volunteer Fire Department (Q). Display/hide their locations on the map
Churches in Lawrence County include: Pilgrim Church (A), Pine Mount Church (B), Pine Ridge Presbyterian Church (C), Providence Missionary Baptist Church (D), Saint James Church (E), Riverside Church (F), Washington Baptist Church (G), Washington United Methodist Church (H), Saint James Church (I). Display/hide their locations on the map
Cemeteries: Tate Cemetery (1), Mount Olive Cemetery (2), Clemont Cemetery (3), Foster Cemetery (4), Rucker Cemetery (5), Roaring Dale Cemetery (6), Farrar Cemetery (7). Display/hide their locations on the map
Lakes and swamps: Fields Lake (A), Blue Hole (B), Pipe Lake (C), Thornburg Lake (D), Long Lake (E), Marengo Lake (F), Briars Chute (G), Forked Lake (H). Display/hide their locations on the map
Streams, rivers, and creeks: Becks Bay (A), Anthony Branch (B), Cane Bayou (C), Washout Bayou (D), Saragossa Bayou (E), Sandy Bayou (F), Saint Catherine Creek (G), Wades Bayou (H), Tango Bayou (I). Display/hide their locations on the map
Parks in Lawrence County include: Sandy Creek State Creek Wildlife Management Area (1), Natchez State Park (2), Natchez Trace Parkway (3), Pipes Lake Recreation Area (4). Display/hide their locations on the map
Neighboring counties: Comanche County, Texas  , Wayne County
  , Irwin County, Georgia , Sabine County, Texas , Trinity County, Texas .
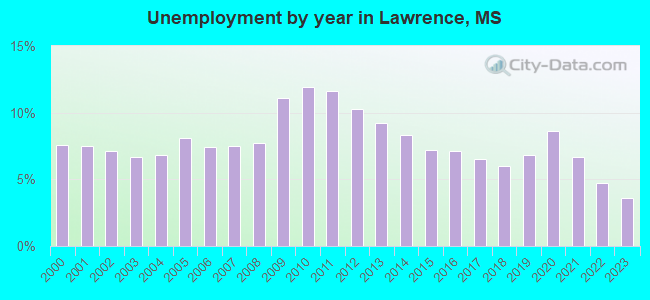
| Here: | 3.4% |
| Mississippi: | 2.6% |
Current college students: 458
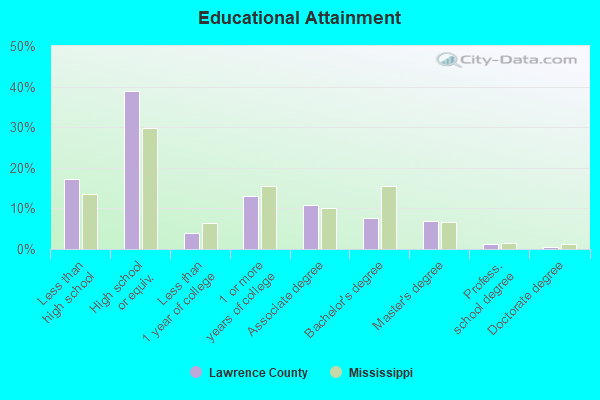
People 25 years of age or older with a high school degree or higher: 82.9%
People 25 years of age or older with a bachelor's degree or higher: 13.9%
Number of foreign born residents: 78 (30.9% naturalized citizens)
| Lawrence County: | 0.7% |
| Whole state: | 2.2% |
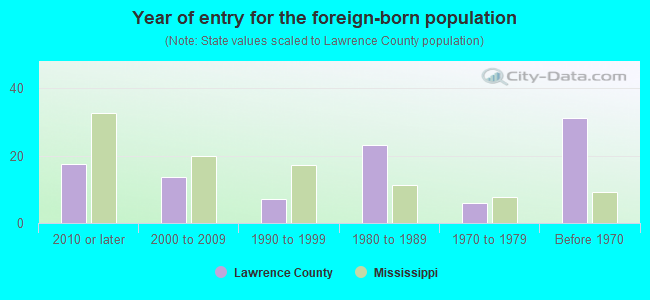
- Year of entry for the foreign-born population
- 422010 or later
- 152000 to 2009
- 111990 to 1999
- 231980 to 1989
- 61970 to 1979
- 31Before 1970
Mean travel time to work (commute): " minutes
Percentage of county residents living and working in this county: 90.7%
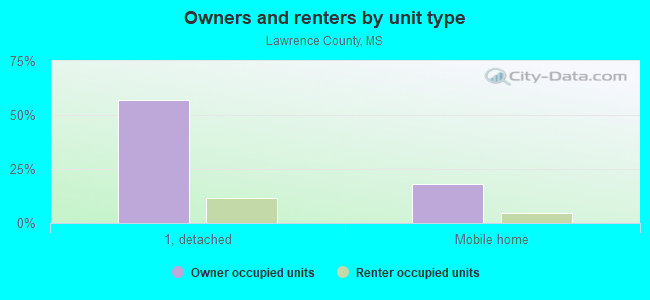
Housing units in structures:
- One, detached: 3,847
- One, attached: 122
- Two: 100
- 3 or 4: 12
- 5 to 9: 90
- 10 to 19: 18
- Mobile homes: 1,659
- Boats, RVs, vans, etc.: 26
Housing units in Lawrence County with a mortgage: 1,209 (102 second mortgage, 13 home equity loan, 83 both second mortgage and home equity loan)
Houses without a mortgage: 64
| Here: | 1.5% with mortgage |
| State: | 97.5% with mortgage |
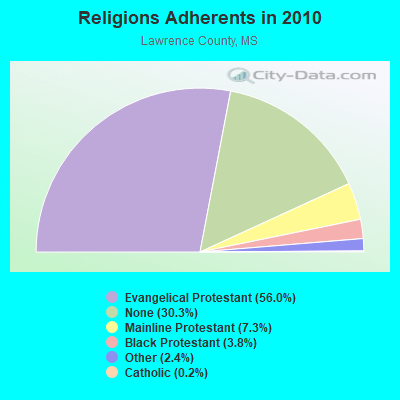
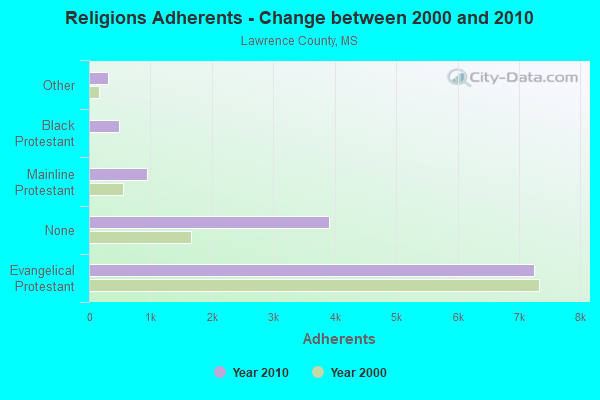
Religion statistics for Lawrence County
| Religion | Adherents | Congregations |
|---|---|---|
| Evangelical Protestant | 7,240 | 35 |
| Mainline Protestant | 947 | 5 |
| Black Protestant | 495 | 2 |
| Other | 311 | 1 |
| Catholic | 22 | 1 |
| None | 3,914 | - |
Source: Clifford Grammich, Kirk Hadaway, Richard Houseal, Dale E.Jones, Alexei Krindatch, Richie Stanley and Richard H.Taylor. 2012. 2010 U.S.Religion Census: Religious Congregations & Membership Study. Association of Statisticians of American Religious Bodies. Jones, Dale E., et al. 2002. Congregations and Membership in the United States 2000. Nashville, TN: Glenmary Research Center.
Food Environment Statistics:
| Lawrence County: | 3.00 / 10,000 pop. |
| State: | 2.08 / 10,000 pop. |
| This county: | 1.50 / 10,000 pop. |
| Mississippi: | 0.80 / 10,000 pop. |
| Lawrence County: | 6.75 / 10,000 pop. |
| Mississippi: | 6.36 / 10,000 pop. |
| This county: | 3.75 / 10,000 pop. |
| State: | 5.03 / 10,000 pop. |
| Lawrence County: | 13.4% |
| Mississippi: | 12.3% |
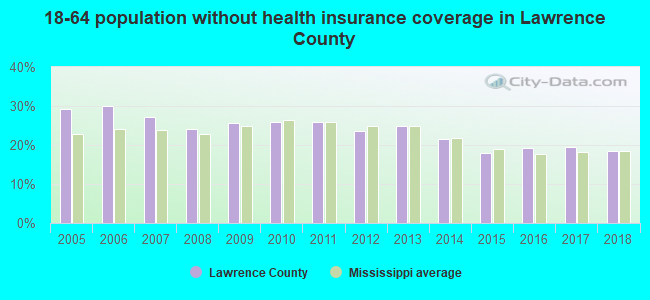
| Lawrence County: | 32.1% |
| State: | 33.1% |
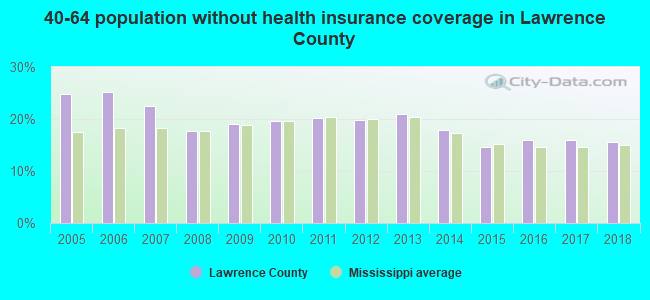
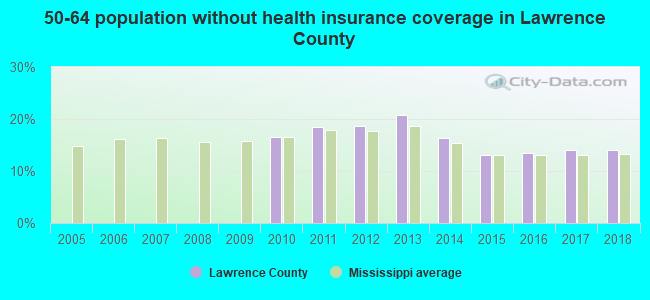
| Here: | 15.0% |
| State: | 14.4% |
Agriculture in Lawrence County:
Average size of farms: 156 acresAverage value of agricultural products sold per farm: $77,484
Average value of crops sold per acre for harvested cropland: $125.55
The value of nursery, greenhouse, floriculture, and sod as a percentage of the total market value of agricultural products sold: 0.39%
The value of livestock, poultry, and their products as a percentage of the total market value of agricultural products sold: 94.59%
Average total farm production expenses per farm: $56,050
Harvested cropland as a percentage of land in farms: 21.35%
Average market value of all machinery and equipment per farm: $42,058
The percentage of farms operated by a family or individual: 96.93%
Average age of principal farm operators: 55 years
Average number of cattle and calves per 100 acres of all land in farms: 17.08
Milk cows as a percentage of all cattle and calves: 7.81%
Corn for grain: 2921 harvested acres
Vegetables: 6 harvested acres
Tornado activity:
Lawrence County historical area-adjusted tornado activity is significantly below Mississippi state average. It is 4794873.1 times below overall U.S. average.Tornadoes in this county have caused 4 injuries recorded between 1950 and 2004.
On 3/17/1987, a category 1 (max. wind speeds 73-112 mph) tornado injured 4 people and caused between $500,000 and $5,000,000 in damages.
Earthquake activity:
Lawrence County-area historical earthquake activity is significantly above Mississippi state average. It is 150% greater than the overall U.S. average.On 10/24/1997 at 08:35:17, a magnitude 4.9 (4.8 MB, 4.2 MS, 4.9 LG, Depth: 6.2 mi, Class: Light, Intensity: IV - V) earthquake occurred 169.5 miles away from Lawrence County center
On 1/18/1999 at 07:00:53, a magnitude 4.8 (4.8 MB, 4.0 LG, Depth: 0.6 mi) earthquake occurred 209.5 miles away from the county center
On 11/7/2004 at 11:20:21, a magnitude 4.3 (4.3 MW, Depth: 3.1 mi) earthquake occurred 147.7 miles away from the county center
On 3/25/1976 at 00:41:20, a magnitude 5.0 (4.9 MB, 5.0 LG, Class: Moderate, Intensity: VI - VII) earthquake occurred 282.8 miles away from the county center
On 5/17/2012 at 08:12:00, a magnitude 4.8 (4.8 MW, Depth: 3.1 mi) earthquake occurred 252.6 miles away from Lawrence County center
On 6/24/1975 at 11:11:36, a magnitude 4.5 (4.5 MB) earthquake occurred 199.3 miles away from the county center
Magnitude types: regional Lg-wave magnitude (LG), body-wave magnitude (MB), surface-wave magnitude (MS), moment magnitude (MW)
Most recent natural disasters:
- Mississippi Severe Storms, Tornadoes, Straight-line Winds, And Flooding, Incident Period: April 22, 2020 - April 23, 2020, Major Disaster (Presidential) Declared DR-4551-MS: July 9, 2020, FEMA Id: 4551, Natural disaster type: Storm, Tornado, Flood, Wind
- Mississippi Severe Storms, Tornadoes, Straight-line Winds, And Flooding, Incident Period: April 12, 2020, FEMA Id: 4536, Natural disaster type: Storm, Tornado, Flood, Wind
- Mississippi Covid-19 Pandemic, Incident Period: January 20, 2020, FEMA Id: 4528, Natural disaster type: Other
- Mississippi Severe Storms and Flooding, Incident Period: March 09, 2016 to March 29, 2016, Major Disaster (Presidential) Declared DR-4268: March 25, 2016, FEMA Id: 4268, Natural disaster type: Storm, Flood
- Mississippi Tropical Storm Isaac, Incident Period: August 26, 2012 to September 11, 2012, Emergency Declared EM-3348: August 28, 2012, FEMA Id: 3348, Natural disaster type: Tropical Storm
- Mississippi Hurricane Isaac, Incident Period: August 26, 2012 to September 11, 2012, Major Disaster (Presidential) Declared DR-4081: August 29, 2012, FEMA Id: 4081, Natural disaster type: Hurricane
- Mississippi Severe Storms, Flooding, and Tornadoes, Incident Period: March 25, 2009 to March 28, 2009, Major Disaster (Presidential) Declared DR-1837: May 12, 2009, FEMA Id: 1837, Natural disaster type: Storm, Tornado, Flood
- Mississippi Hurricane Gustav, Incident Period: August 28, 2008 to September 08, 2008, Major Disaster (Presidential) Declared DR-1794: September 22, 2008, FEMA Id: 1794, Natural disaster type: Hurricane
- Mississippi Hurricane Katrina, Incident Period: August 29, 2005 to October 14, 2005, Major Disaster (Presidential) Declared DR-1604: August 29, 2005, FEMA Id: 1604, Natural disaster type: Hurricane
- Mississippi Severe Storms, Tornadoes and Flooding, Incident Period: April 06, 2003 to April 25, 2003, Major Disaster (Presidential) Declared DR-1459: April 24, 2003, FEMA Id: 1459, Natural disaster type: Storm, Tornado, Flood
- 9 other natural disasters have been reported since 1953.
The number of natural disasters in Lawrence County (19) is greater than the US average (15).
Major Disasters (Presidential) Declared: 14
Emergencies Declared: 3
Causes of natural disasters: Floods: 11, Storms: 8, Tornadoes: 8, Hurricanes: 5, Heavy Rains: 3, Winds: 2, Drought: 1, Freeze: 1, Tropical Storm: 1, Other: 1 (Note: some incidents may be assigned to more than one category).
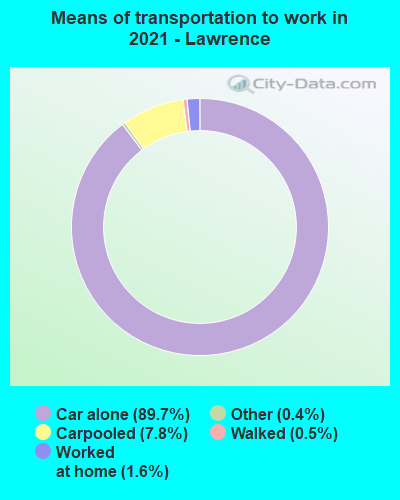
Means of transportation to work:
- Drove a car alone: 2,487 (86.3%)
- Carpooled: 269 (9.3%)
- Taxicab, motorcycle, or other means: 8 (0.3%)
- Walked: 14 (0.5%)
- Worked at home: 81 (2.8%)
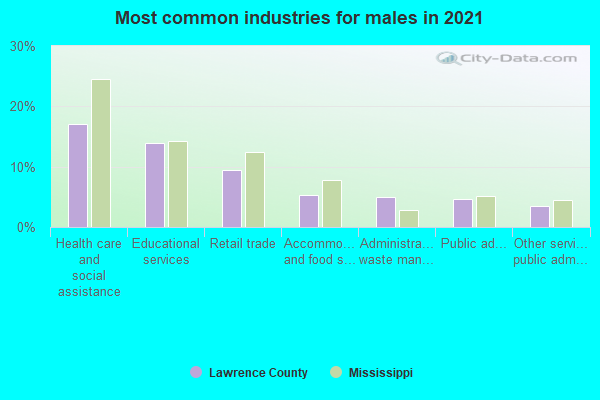
- Health care and social assistance (18%)
- Educational services (11%)
- Retail trade (9%)
- Accommodation and food services (6%)
- Administrative and support and waste management services (6%)
- Other services, except public administration (4%)
- Public administration (4%)
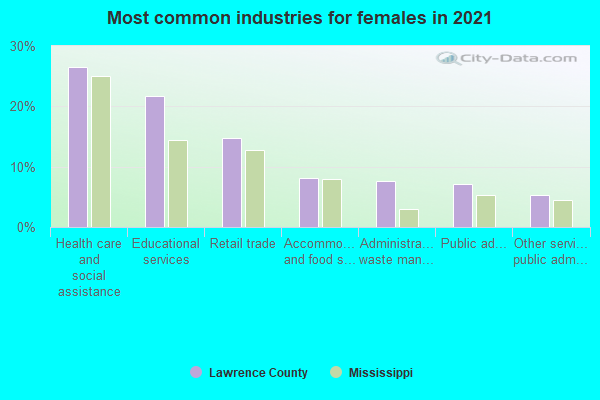
- Health care and social assistance (28%)
- Educational services (16%)
- Retail trade (14%)
- Accommodation and food services (9%)
- Administrative and support and waste management services (9%)
- Other services, except public administration (7%)
- Public administration (5%)
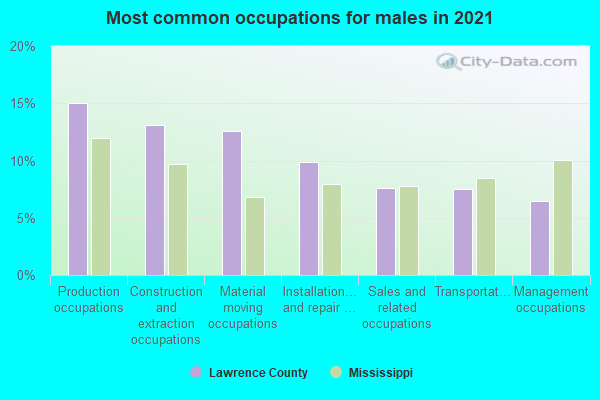
- Construction and extraction occupations (18%)
- Installation, maintenance, and repair occupations (13%)
- Production occupations (10%)
- Transportation occupations (9%)
- Material moving occupations (9%)
- Sales and related occupations (8%)
- Management occupations (4%)
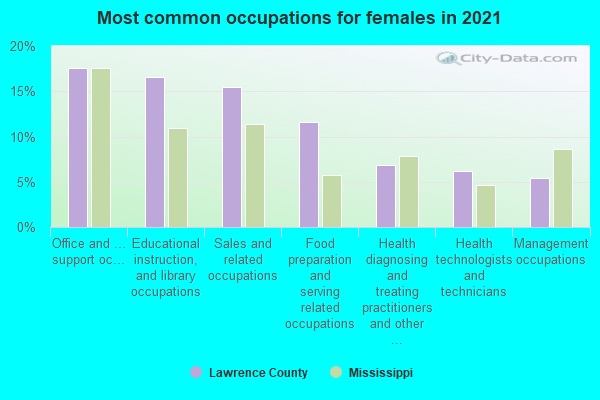
- Office and administrative support occupations (18%)
- Sales and related occupations (16%)
- Educational instruction, and library occupations (13%)
- Food preparation and serving related occupations (13%)
- Healthcare support occupations (8%)
- Health diagnosing and treating practitioners and other technical occupations (7%)
- Management occupations (5%)
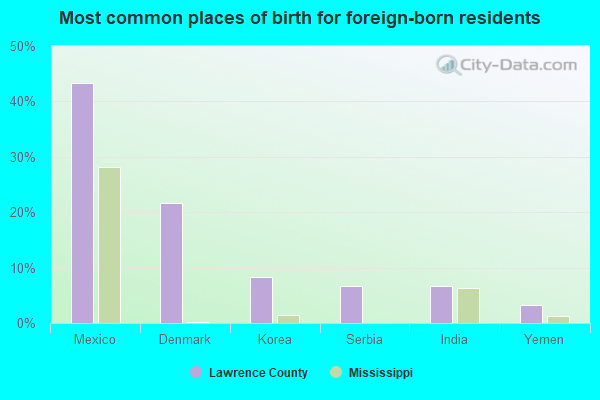
- Mexico (54%)
- Denmark (19%)
- Serbia (12%)
- Korea (8%)
- Norway (0%)
- Sweden (0%)
- United Kingdom, excluding England and Scotland (0%)
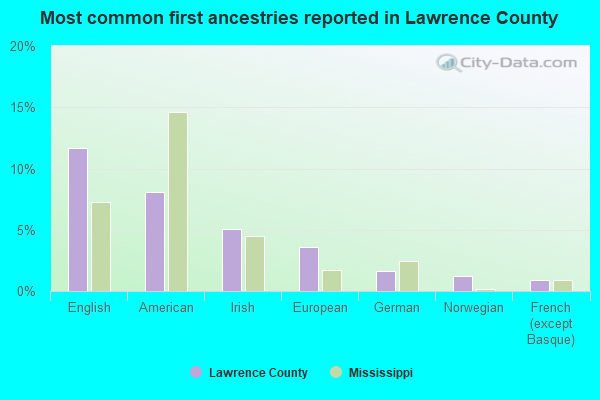
- English (13%)
- American (9%)
- Irish (6%)
- European (3%)
- French (except Basque) (2%)
- German (2%)
- Scottish (1%)
35 people in local jails and other confinement facilities (including police lockups)
5.63% of this county's 2021 resident taxpayers lived in other counties in 2020 ($39,304 average adjusted gross income)
| Here: | 5.63% |
| Mississippi average: | 6.85% |
10 or fewer of this county's residents moved from foreign countries.
4.33% relocated from other counties in Mississippi ($28,148 average AGI)
1.30% relocated from other states ($11,161 average AGI)
Lawrence County: 1.30% Mississippi average: 2.80%
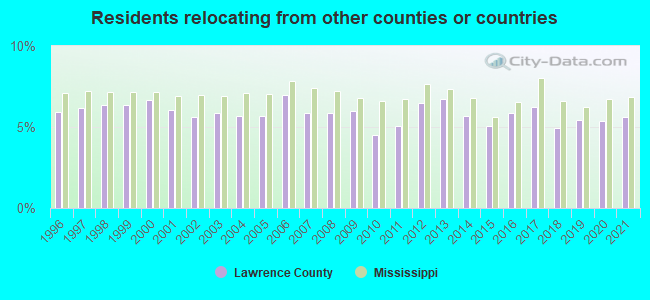
Top counties from which taxpayers relocated into this county between 2020 and 2021:
| from Lincoln County, MS | |
| from Jefferson Davis County, MS |
5.86% of this county's 2020 resident taxpayers moved to other counties in 2021 ($35,675 average adjusted gross income)
| Here: | 5.86% |
| Mississippi average: | 7.03% |
10 or fewer of this county's residents moved to foreign countries.
4.54% relocated to other counties in Mississippi ($27,896 average AGI)
1.32% relocated to other states ($7,779 average AGI)
Lawrence County: 1.32% Mississippi average: 2.99%
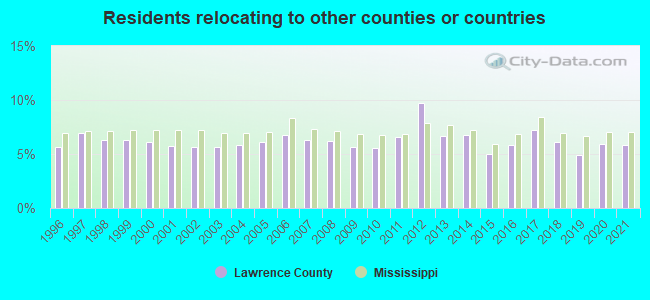
Top counties to which taxpayers relocated from this county between 2020 and 2021:
| to Lincoln County, MS | |
| to Jefferson Davis County, MS |
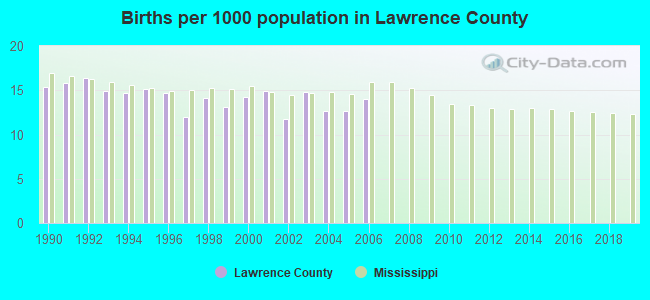
Births per 1000 population from 1990 to 1999: 14.6
Births per 1000 population from 2000 to 2006: 13.6
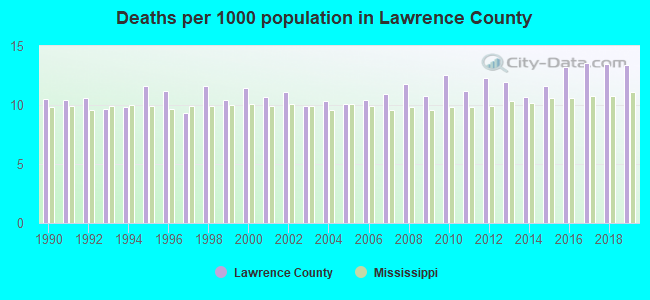
Deaths per 1000 population from 1990 to 1999: 10.5
Deaths per 1000 population from 2000 to 2009: 10.7
Deaths per 1000 population from 2010 to 2020: 12.7
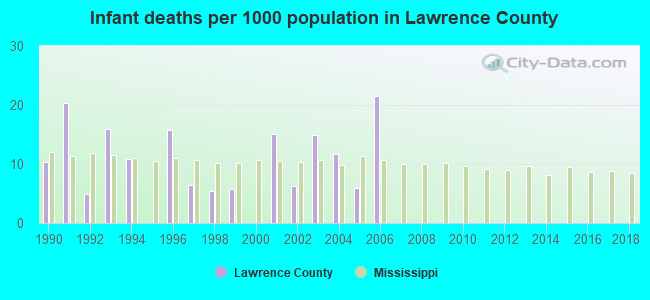
Infant deaths per 1000 live births from 1990 to 1999: 9.6
Infant deaths per 1000 live births from 2000 to 2006: 10.8
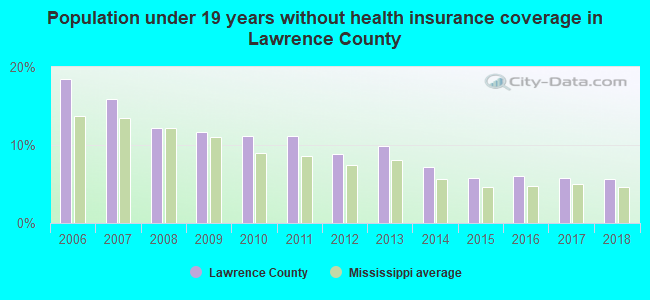
Persons under 19 years old without health insurance coverage in 2018: 5.6%
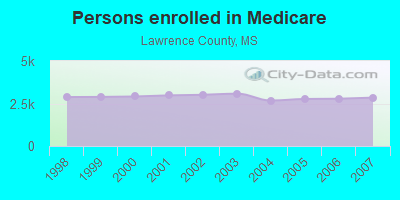
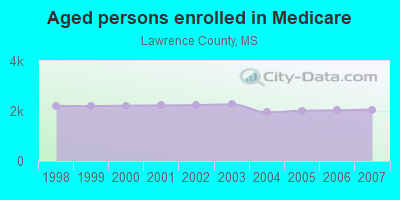
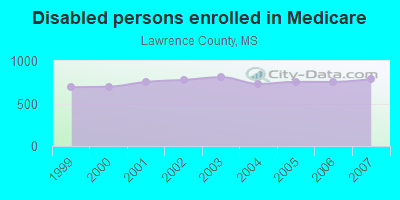
Persons enrolled in hospital insurance and/or supplemental medical insurance (Medicare) in July 1, 2007: 2,846 (2,058 aged, 788 disabled)
Children under 18 without health insurance coverage in 2007: 495 (14%)
Most common underlying causes of death in Lawrence County, Mississippi in 1999 - 2019:
- Bronchus or lung, unspecified - Malignant neoplasms (158)
- Atherosclerotic heart disease (102)
- Atherosclerotic cardiovascular disease, so described (54)
- Acute myocardial infarction, unspecified (40)
- Chronic obstructive pulmonary disease, unspecified (14)
- Congestive heart failure (10)
- Heart disease, unspecified (10)
- Sudden cardiac death, so described (10)
Population without health insurance coverage in 2000: 16%
Children under 18 without health insurance coverage in 2000: 12%
Short term general hospital admissions per 100,000 population in 2004: 4,998
Short term general hospital beds per 100,000 population in 2004: 186
Emergency room visits per 100,000 population in 2004: 44,321
General practice office based MDs per 100,000 population in 2005: 1,355
Medical specialist MDs per 100,000 population in 2005: 1,118
Total births per 100,000 population, July 2005 - July 2006 : 23
Total deaths per 100,000 population, July 2005 - July 2006: 52
Limited-service eating places per 100,000 population in 2005 : 7
Household type by relationship:
Households: 11,857- Male householders: 2,331 (628 living alone), Female householders: 2,244 (783 living alone)
2,197 spouses (2,194 opposite-sex spouses), 169 unmarried partners, (145 opposite-sex unmarried partners), 3,838 children (3,626 natural, 95 adopted, 121 stepchildren), 402 grandchildren, 111 brothers or sisters, 338 parents, 3 foster children, 195 other relatives, 37 non-relatives
- In group quarters: 14
Size of family households: 1,422 2-persons, 761 3-persons, 323 4-persons, 397 5-persons, 90 6-persons, 50 7-or-more-persons.
Size of nonfamily households: 1,411 1-person, 93 2-persons, 35 3-persons.
1,653 married couples with children.
855 single-parent households (145 men, 710 women).
97.4% of residents of Lawrence speak English at home.
2.2% of residents speak Spanish at home (78% speak English very well, 22% speak English not well).
0.4% of residents speak other Indo-European language at home (100% speak English very well).
0.2% of residents speak Asian or Pacific Island language at home (100% speak English very well).
In fiscal year 2004:
Federal Government expenditure: $97,360,000 ($7,241 per capita)
Department of Defense expenditure: $4,160,000
Federal direct payments to individuals for retirement and disability: $46,923,000
Federal other direct payments to individuals: $23,410,000
Federal direct payments not to individuals: $316,000
Federal grants: $21,200,000
Federal procurement contracts: $646,000 ($0,000 Department of Defense)
Federal salaries and wages: $4,864,000 ($2,146,000 Department of Defense)
Federal Government direct loans: $557,000
Federal guaranteed/insured loans: $3,430,000
Federal Government insurance: $4,175,000
Population change from April 1, 2000 to July 1, 2005:
Births: 1,013| Here: | 75 per 1000 residents |
| State: | 78 per 1000 residents |
Deaths: 722
| Here: | 53 per 1000 residents |
| State: | 51 per 1000 residents |
Net international migration: +11
| Here: | +1 per 1000 residents |
| State: | +4 per 1000 residents |
Net internal migration: -36
| Here: | |
| State: |
Total withdrawal of fresh water for public supply: 1.00 millions of gallons per day (all from ground)
| Here: | 5.7 |
| State: | 6.3 |
| Here: | 4.7 |
| State: | 4.8 |
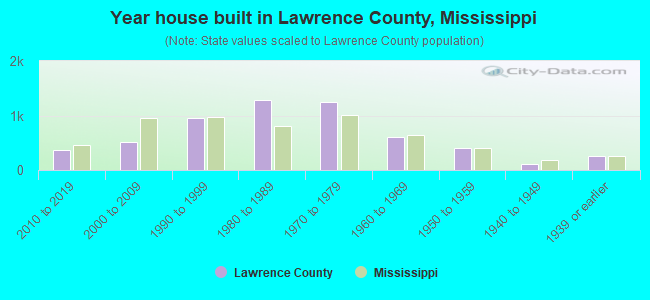
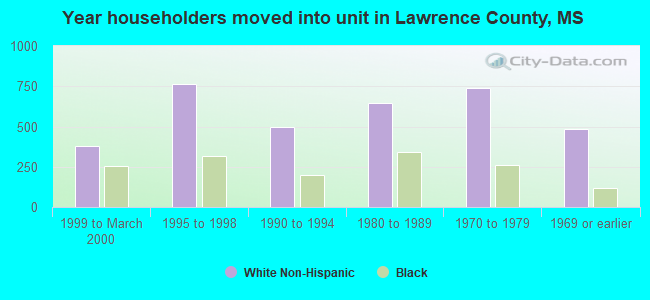
- Year house built in Lawrence County, Mississippi
- 92020 or later
- 5402010 to 2019
- 5672000 to 2009
- 8211990 to 1999
- 1,0841980 to 1989
- 1,5301970 to 1979
- 5951960 to 1969
- 2971950 to 1959
- 1111940 to 1949
- 1941939 or earlier
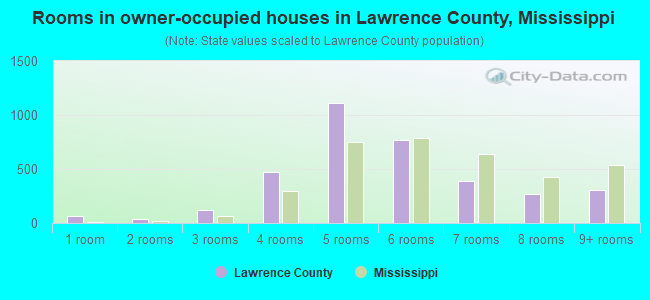
- Rooms in owner-occupied houses in Lawrence County, Mississippi
- 821 room
- 02 rooms
- 1143 rooms
- 4874 rooms
- 9765 rooms
- 9086 rooms
- 4227 rooms
- 2758 rooms
- 3749+ rooms
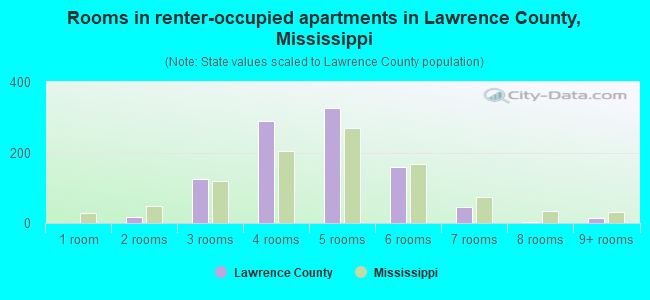
- Rooms in renter-occupied apartments in Lawrence County, Mississippi
- 01 room
- 72 rooms
- 1543 rooms
- 2824 rooms
- 2955 rooms
- 1306 rooms
- 517 rooms
- 48 rooms
- 99+ rooms
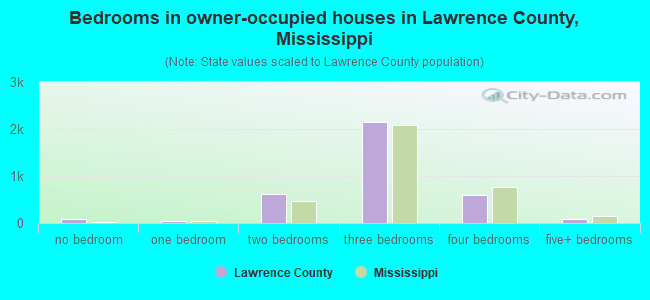
- Bedrooms in owner-occupied houses in Lawrence County, Mississippi
- 85no bedroom
- 221 bedroom
- 5792 bedrooms
- 2,2213 bedrooms
- 5884 bedrooms
- 1335+ bedrooms
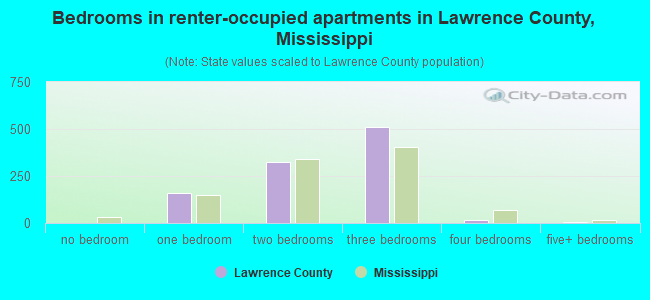
- Bedrooms in renter-occupied apartments in Lawrence County, Mississippi
- 0no bedroom
- 1051 bedroom
- 2762 bedrooms
- 5583 bedrooms
- 224 bedrooms
- 15+ bedrooms
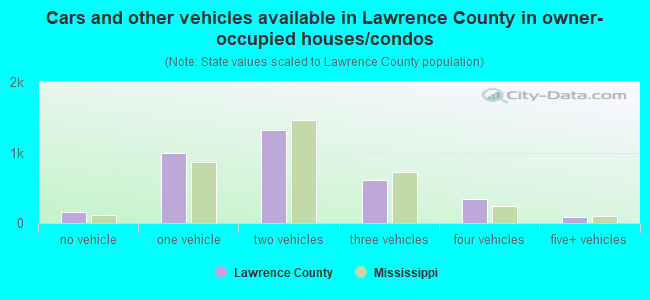
- Cars and other vehicles available in Lawrence County in owner-occupied houses/condos
- 218no vehicle
- 9661 vehicle
- 1,4422 vehicles
- 5673 vehicles
- 3804 vehicles
- 735+ vehicles
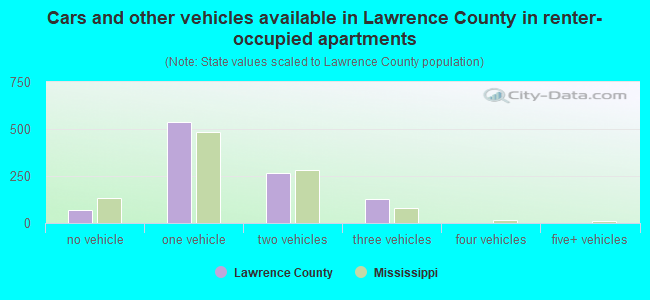
- Cars and other vehicles available in Lawrence County in renter-occupied apartments
- 41no vehicle
- 4831 vehicle
- 2922 vehicles
- 1523 vehicles
- 14 vehicles
- 05+ vehicles
93.3% of Lawrence County residents lived in the same house 1 years ago.
Out of people who lived in different houses, 29% lived in this county.
Out of people who lived in different counties, 74% lived in Mississippi.
| Lawrence County: | 93.3% |
| State average: | 88.9% |
Place of birth for U.S.-born residents:
- This state: 9,569
- Other state: 2,135
- Northeast: 23
- Midwest: 297
- South: 1,702
- West: 93
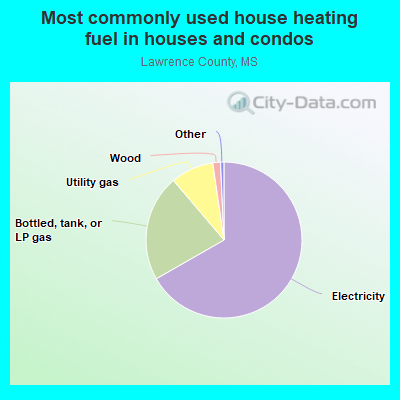
- 67.7%Electricity
- 21.1%Bottled, tank, or LP gas
- 8.6%Utility gas
- 1.5%Wood
- 0.5%Other fuel
- 0.4%Fuel oil, kerosene, etc.
- 0.3%No fuel used
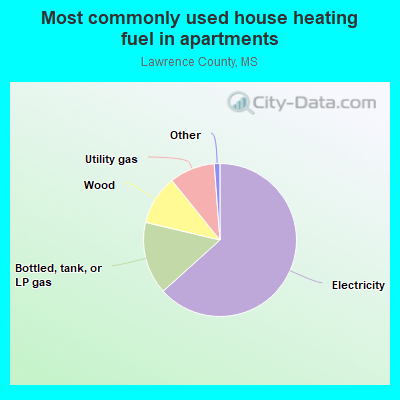
- 61.8%Electricity
- 19.1%Bottled, tank, or LP gas
- 10.3%Wood
- 7.5%Utility gas
- 1.2%Fuel oil, kerosene, etc.
- 0.1%No fuel used
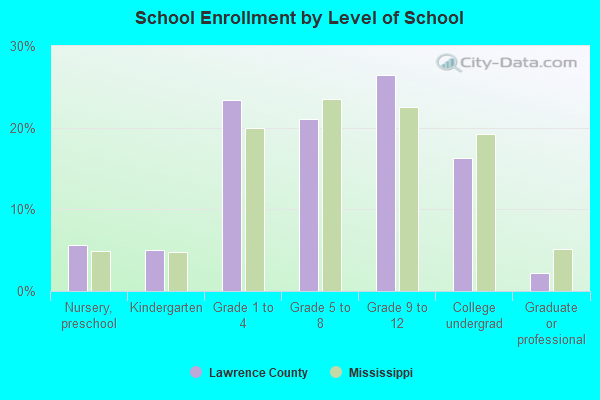
Private vs. public school enrollment:
| Here: | 17.6% |
| Mississippi: | 16.1% |
| Here: | 24.9% |
| Mississippi: | 14.6% |
| Here: | 9.7% |
| Mississippi: | 12.8% |

Lawrence County government finances - Expenditure in 2018:
- Charges - Other: $275,000
- Current Operations - Regular Highways: $2,495,000
Central Staff Services: $2,493,000
Police Protection: $2,179,000
Solid Waste Management: $518,000
Health - Other: $250,000
General - Other: $115,000
Natural Resources - Other: $70,000
Parks and Recreation: $13,000
- Federal Intergovernmental - Highways: $27,000
- General - Interest on Debt: $79,000
- Local Intergovernmental - Health and Hospitals: $23,000
- Long Term Debt - Beginning Outstanding - Unspecified Public Purpose: $1,924,000
Outstanding Unspecified Public Purpose: $1,594,000
Retired Unspecified Public Purpose: $573,000
Issue, Unspecified Public Purpose: $244,000
- Miscellaneous - General Revenue - Other: $322,000
Fines and Forfeits: $103,000
Interest Earnings: $8,000
- Other Capital Outlay - General - Other: $572,000
- Other Funds - Cash and Securities: $7,404,000
- State Intergovernmental - Other: $738,000
General Local Government Support: $566,000
Health and Hospitals: $140,000
Highways: $75,000
- Tax - Property: $6,952,000
Other License: $122,000
- Total Salaries and Wages: $288,000
Lawrence County government finances - Revenue in 2018:
- Charges - Other: $275,000
- Current Operations - Regular Highways: $2,495,000
Central Staff Services: $2,493,000
Police Protection: $2,179,000
Solid Waste Management: $518,000
Health - Other: $250,000
General - Other: $115,000
Natural Resources - Other: $70,000
Parks and Recreation: $13,000
- Federal Intergovernmental - Highways: $27,000
- General - Interest on Debt: $79,000
- Local Intergovernmental - Health and Hospitals: $23,000
- Long Term Debt - Beginning Outstanding - Unspecified Public Purpose: $1,924,000
Outstanding Unspecified Public Purpose: $1,594,000
Retired Unspecified Public Purpose: $573,000
Issue, Unspecified Public Purpose: $244,000
- Miscellaneous - General Revenue - Other: $322,000
Fines and Forfeits: $103,000
Interest Earnings: $8,000
- Other Capital Outlay - General - Other: $572,000
- Other Funds - Cash and Securities: $7,404,000
- State Intergovernmental - Other: $738,000
General Local Government Support: $566,000
Health and Hospitals: $140,000
Highways: $75,000
- Tax - Property: $6,952,000
Other License: $122,000
- Total Salaries and Wages: $288,000
Lawrence County government finances - Debt in 2018:
- Charges - Other: $275,000
- Current Operations - Regular Highways: $2,495,000
Central Staff Services: $2,493,000
Police Protection: $2,179,000
Solid Waste Management: $518,000
Health - Other: $250,000
General - Other: $115,000
Natural Resources - Other: $70,000
Parks and Recreation: $13,000
- Federal Intergovernmental - Highways: $27,000
- General - Interest on Debt: $79,000
- Local Intergovernmental - Health and Hospitals: $23,000
- Long Term Debt - Beginning Outstanding - Unspecified Public Purpose: $1,924,000
Outstanding Unspecified Public Purpose: $1,594,000
Retired Unspecified Public Purpose: $573,000
Issue, Unspecified Public Purpose: $244,000
- Miscellaneous - General Revenue - Other: $322,000
Fines and Forfeits: $103,000
Interest Earnings: $8,000
- Other Capital Outlay - General - Other: $572,000
- Other Funds - Cash and Securities: $7,404,000
- State Intergovernmental - Other: $738,000
General Local Government Support: $566,000
Health and Hospitals: $140,000
Highways: $75,000
- Tax - Property: $6,952,000
Other License: $122,000
- Total Salaries and Wages: $288,000
Lawrence County government finances - Cash and Securities in 2018:
- Charges - Other: $275,000
- Current Operations - Regular Highways: $2,495,000
Central Staff Services: $2,493,000
Police Protection: $2,179,000
Solid Waste Management: $518,000
Health - Other: $250,000
General - Other: $115,000
Natural Resources - Other: $70,000
Parks and Recreation: $13,000
- Federal Intergovernmental - Highways: $27,000
- General - Interest on Debt: $79,000
- Local Intergovernmental - Health and Hospitals: $23,000
- Long Term Debt - Beginning Outstanding - Unspecified Public Purpose: $1,924,000
Outstanding Unspecified Public Purpose: $1,594,000
Retired Unspecified Public Purpose: $573,000
Issue, Unspecified Public Purpose: $244,000
- Miscellaneous - General Revenue - Other: $322,000
Fines and Forfeits: $103,000
Interest Earnings: $8,000
- Other Capital Outlay - General - Other: $572,000
- Other Funds - Cash and Securities: $7,404,000
- State Intergovernmental - Other: $738,000
General Local Government Support: $566,000
Health and Hospitals: $140,000
Highways: $75,000
- Tax - Property: $6,952,000
Other License: $122,000
- Total Salaries and Wages: $288,000
Supplemental Security Income (SSI) in 2006:
- Total number of recipients: 593
- Number of aged recipients: 66
- Number of blind and disabled recipients: 527
- Number of recipients under 18: 83
- Number of recipients between 18 and 64: 352
- Number of recipients older than 64: 158
- Number of recipients also receiving OASDI: 263
- Amount of payments (thousands of dollars): 264
| Most common first names in Lawrence County, MS among deceased individuals | ||
| Name | Count | Lived (average) |
|---|---|---|
| James | 128 | 70.7 years |
| John | 99 | 73.0 years |
| Willie | 72 | 74.0 years |
| Mary | 71 | 78.7 years |
| William | 63 | 70.5 years |
| Robert | 52 | 71.8 years |
| Charles | 42 | 68.5 years |
| George | 40 | 74.6 years |
| Annie | 40 | 76.3 years |
| Thomas | 33 | 70.9 years |
| Most common last names in Lawrence County, MS among deceased individuals | ||
| Last name | Count | Lived (average) |
|---|---|---|
| Smith | 139 | 72.6 years |
| Davis | 61 | 68.1 years |
| Brown | 54 | 74.5 years |
| Bridges | 50 | 71.5 years |
| Berry | 45 | 77.0 years |
| Lambert | 45 | 73.2 years |
| Wilson | 45 | 76.3 years |
| Williams | 44 | 76.0 years |
| Lee | 40 | 79.1 years |
| King | 38 | 74.6 years |
Businesses in Lawrence County, MS
- Ace Hardware: 1
- SONIC Drive-In: 1
- Subway: 1
Lawrence County on our top lists:
- #61 on the list of "Top 101 counties with the smallest number of children under 18 without health insurance coverage in 2000"