Lincoln County, Oklahoma (OK)
County owner-occupied free and clear houses and condos in 2010: 4,514
County owner-occupied houses and condos in 2000: 9,749
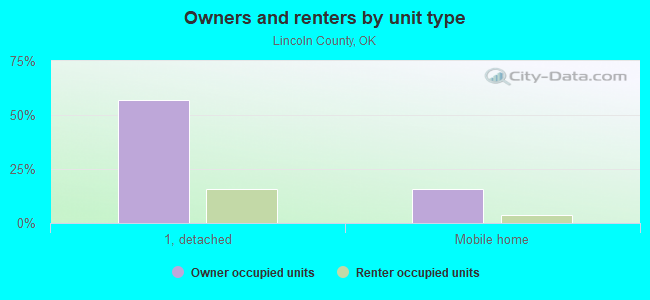
Renter-occupied apartments: 2,837 (it was 2,429 in 2000)
| % of renters here: | 20% |
| State: | 33% |
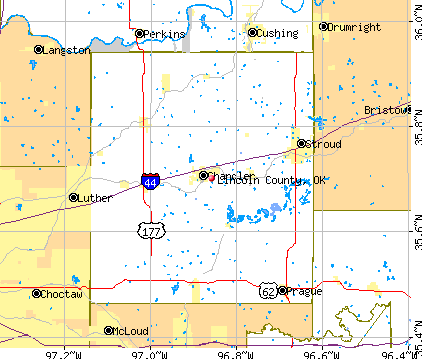
Land area: 958 sq. mi.
Water area: 7.9 sq. mi.
Population density: 36 people per square mile (low).
Industries providing employment: Educational, health and social services (18.4%), Retail trade (12.8%), Construction (11.2%).
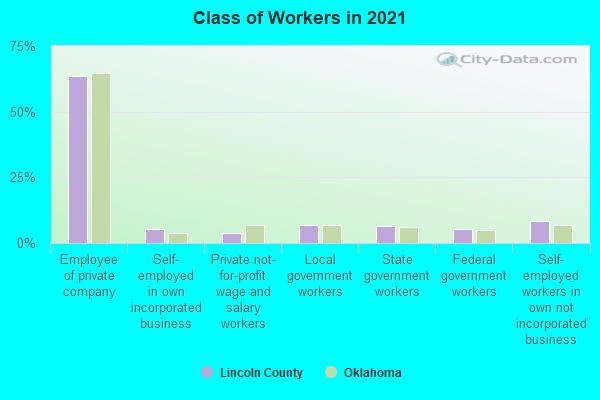
Type of workers:
- Private wage or salary: 73%
- Government: 18%
- Self-employed, not incorporated: 9%
- Unpaid family work: 0%
- OSM Map
- General Map
- Google Map
- MSN Map

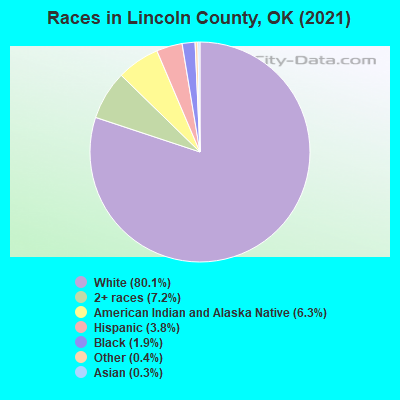
- 27,10379.8%White Non-Hispanic Alone
- 2,6397.8%Two or more races
- 2,0236.0%American Indian and Alaska Native alone
- 1,3303.9%Hispanic or Latino
- 5861.7%Black Non-Hispanic Alone
- 1440.4%Asian alone
- 1110.3%Some other race alone
- 190.06%Native Hawaiian and Other
Pacific Islander alone
| Median resident age: | 41.2 years |
| Oklahoma median age: | 37.1 years |
| Males: 17,139 | |
| Females: 17,013 |

 | Recent tornadoes discourage people from choosing Oklahoma? (54 replies) |
| I lived in Cushing for 19 years but now I can never go back (54 replies) |
| Seven days and six nights in wonderful OKC! (23 replies) |
| Prague Earthquake (37 replies) |
| From Oklahoma City to San Diego, CA best route? (6 replies) |
| A nice city between OKC and DFW? (8 replies) |
| Lincoln County: | 2.0 people |
| Oklahoma: | 2 people |
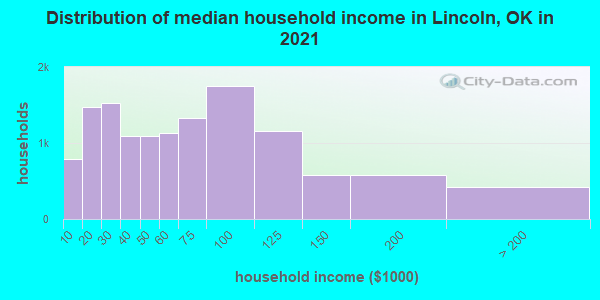
Estimated median household income in 2022: $56,067 ($31,187 in 1999)
| This county: | $56,067 |
| Oklahoma: | $59,673 |
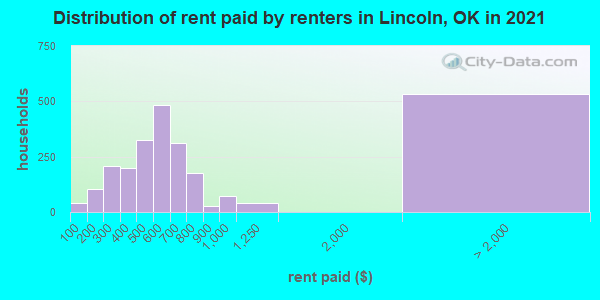
Median contract rent in 2022 for apartments: $550 (lower quartile is $408, upper quartile is $672)
| This county: | $550 |
| State: | $744 |
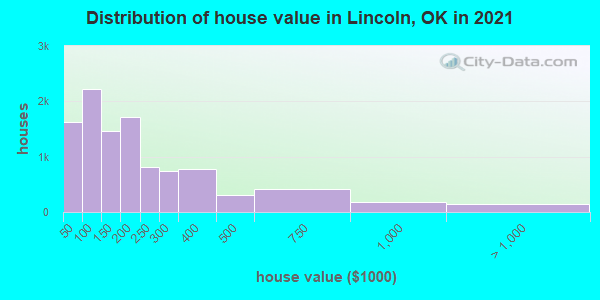
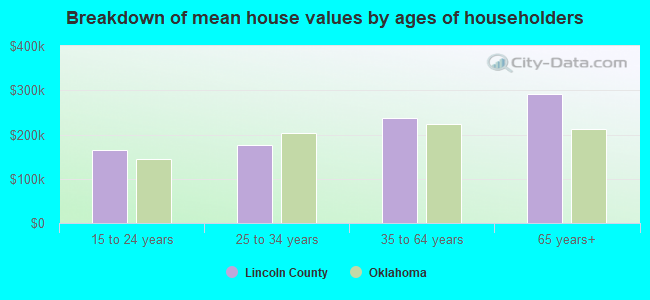
Estimated median house or condo value in 2022: $158,982 (it was $55,600 in 2000)
| Lincoln: | $158,982 |
| Oklahoma: | $191,700 |
Mean price in 2022:
Median monthly housing costs for homes and condos with a mortgage: $1,238Detached houses: $239,930
Here: $239,930 State: $255,409 Townhouses or other attached units: $227,893
Here: $227,893 State: $206,466 Mobile homes: $96,247
Here: $96,247 State: $110,804 Occupied boats, RVs, vans, etc.: $192,647
Here: $192,647 State: $68,690
Median monthly housing costs for units without a mortgage: $380
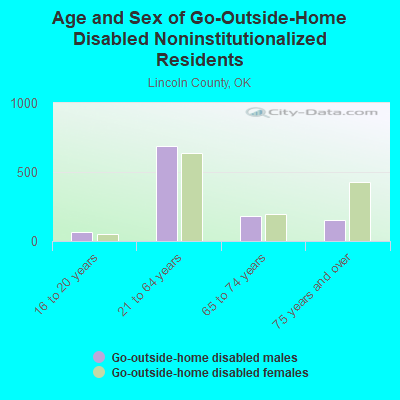
Institutionalized population: 342
Crime in 2021 (reported by the sheriff's office or county police, not the county total):
- Murders: 3
- Rapes: 8
- Robberies: 1
- Assaults: 45
- Burglaries: 104
- Thefts: 151
- Auto thefts: 34
Crime in 2020 (reported by the sheriff's office or county police, not the county total):
- Murders: 1
- Rapes: 8
- Robberies: 1
- Assaults: 45
- Burglaries: 118
- Thefts: 142
- Auto thefts: 65
Health of residents in Lincoln County based on CDC Behavioral Risk Factor Surveillance System Survey Questionnaires from 2013 to 2021:
General health status score of residents in this county from 1 (poor) to 5 (excellent) is 3.4. This is worse than average.68.3% of residents exercised in the past month. This is less than average.
43.2% of residents smoked 100+ cigarettes in their lives. This is about average.
42.2% of adult residents drank alcohol in the past 30 days. This is less than average.
65.3% of residents visited a dentist within the past year. This is less than average.
Average weight of males is 202 pounds. This is more than average.
Average weight of females is 167 pounds. This is more than average.
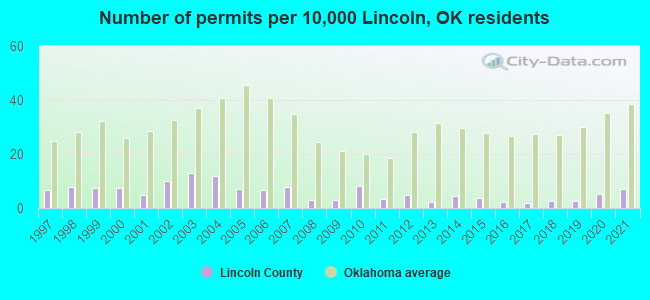
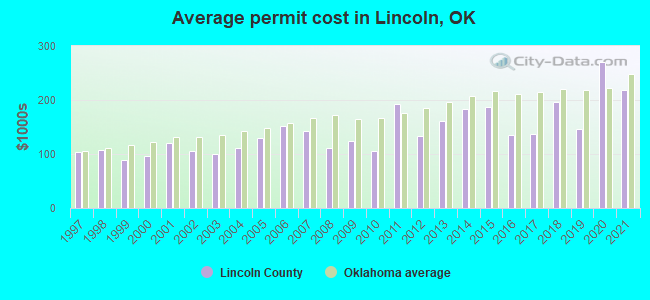
Single-family new house construction building permits:
- 2022: 11 buildings, average cost: $256,200
- 2021: 23 buildings, average cost: $218,700
- 2020: 17 buildings, average cost: $270,000
- 2019: 8 buildings, average cost: $146,100
- 2018: 8 buildings, average cost: $196,500
- 2017: 6 buildings, average cost: $136,500
- 2016: 7 buildings, average cost: $134,900
- 2015: 12 buildings, average cost: $187,100
- 2014: 14 buildings, average cost: $183,200
- 2013: 7 buildings, average cost: $161,100
- 2012: 15 buildings, average cost: $133,800
- 2011: 11 buildings, average cost: $191,500
- 2010: 26 buildings, average cost: $104,700
- 2009: 10 buildings, average cost: $123,500
- 2008: 10 buildings, average cost: $112,200
- 2007: 25 buildings, average cost: $142,800
- 2006: 21 buildings, average cost: $151,500
- 2005: 22 buildings, average cost: $129,700
- 2004: 38 buildings, average cost: $111,700
- 2003: 41 buildings, average cost: $99,500
- 2002: 32 buildings, average cost: $104,500
- 2001: 16 buildings, average cost: $119,800
- 2000: 24 buildings, average cost: $96,500
- 1999: 24 buildings, average cost: $88,300
- 1998: 25 buildings, average cost: $108,200
- 1997: 21 buildings, average cost: $103,300
Median real estate property taxes paid for housing units with mortgages in 2022: $1,131 (0.6%)
Median real estate property taxes paid for housing units with no mortgage in 2022: $592 (0.5%)
| Lincoln County: | 14.7% |
| Oklahoma: | 15.7% |
Median age of residents in 2022: 41.2 years old
(Males: 40.5 years old, Females: 42.3 years old)
(Median age for: White residents: 44.2 years old, Black residents: 42.2 years old, American Indian residents: 32.6 years old, Asian residents: 30.9 years old, Hispanic or Latino residents: 26.2 years old, Other race residents: 27.0 years old)
Fair market rent in 2006 for a 1-bedroom apartment in Lincoln County is $374 a month.
Fair market rent for a 2-bedroom apartment is $451 a month.
Fair market rent for a 3-bedroom apartment is $594 a month.
Cities in this county include: Northeast Lincoln, Northwest Lincoln, Chandler, Stroud, Prague, Meeker, Davenport, Wellston, Carney, Tryon.
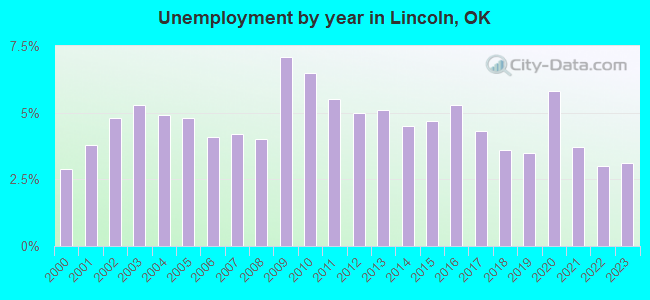
| Here: | 3.0% |
| Oklahoma: | 3.2% |
Current college students: 883
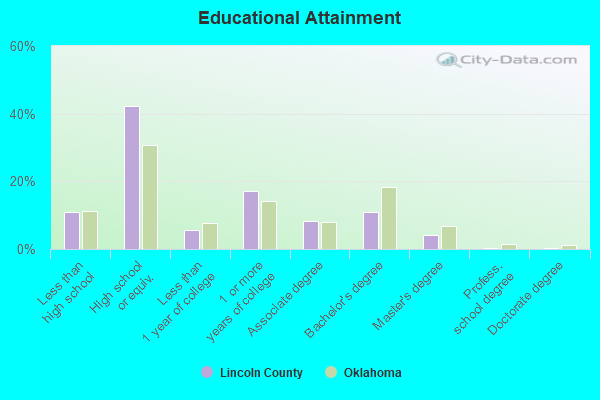
People 25 years of age or older with a high school degree or higher: 89.1%
People 25 years of age or older with a bachelor's degree or higher: 15.9%
Number of foreign born residents: 357 (44.2% naturalized citizens)
| Lincoln County: | 1.0% |
| Whole state: | 6.0% |
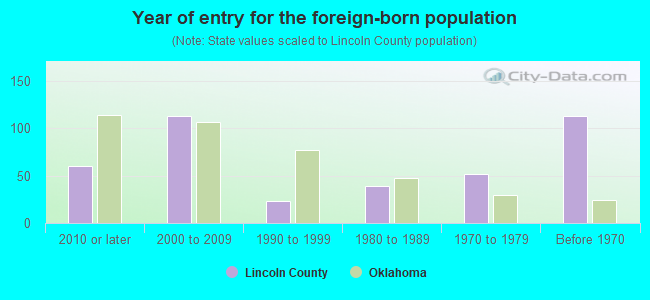
- Year of entry for the foreign-born population
- 662010 or later
- 1382000 to 2009
- 471990 to 1999
- 391980 to 1989
- 521970 to 1979
- 113Before 1970
Mean travel time to work (commute): minutes
Percentage of county residents living and working in this county: 98.5%
Housing units in structures:
- One, detached: 10,737
- One, attached: 99
- Two: 175
- 3 or 4: 167
- 5 to 9: 267
- 10 to 19: 24
- 20 to 49: 31
- 50 or more: 3
- Mobile homes: 3,024
- Boats, RVs, vans, etc.: 96
Housing units in Lincoln County with a mortgage: 5,094 (205 second mortgage, 7 home equity loan, 75 both second mortgage and home equity loan)
Houses without a mortgage: 56
| Here: | 8.2% with mortgage |
| State: | 98.5% with mortgage |
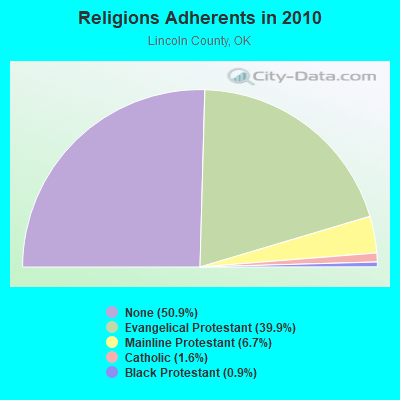
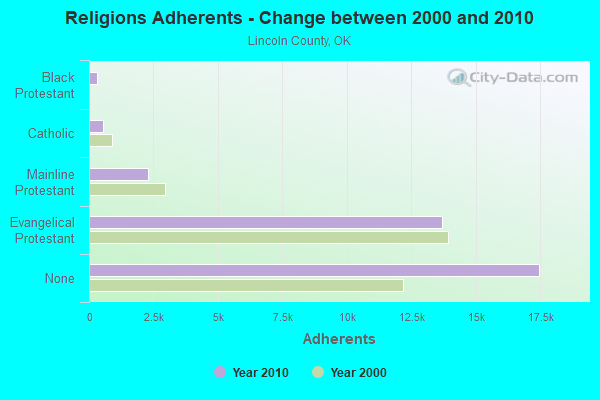
Religion statistics for Lincoln County
| Religion | Adherents | Congregations |
|---|---|---|
| Evangelical Protestant | 13,686 | 62 |
| Mainline Protestant | 2,280 | 16 |
| Catholic | 532 | 4 |
| Black Protestant | 310 | 2 |
| Other | 5 | 1 |
| None | 17,460 | - |
Source: Clifford Grammich, Kirk Hadaway, Richard Houseal, Dale E.Jones, Alexei Krindatch, Richie Stanley and Richard H.Taylor. 2012. 2010 U.S.Religion Census: Religious Congregations & Membership Study. Association of Statisticians of American Religious Bodies. Jones, Dale E., et al. 2002. Congregations and Membership in the United States 2000. Nashville, TN: Glenmary Research Center.
Food Environment Statistics:
| Lincoln County: | 1.55 / 10,000 pop. |
| State: | 1.97 / 10,000 pop. |
| This county: | 0.62 / 10,000 pop. |
| Oklahoma: | 0.76 / 10,000 pop. |
| Lincoln County: | 4.97 / 10,000 pop. |
| Oklahoma: | 4.35 / 10,000 pop. |
| This county: | 5.28 / 10,000 pop. |
| State: | 6.89 / 10,000 pop. |
| Lincoln County: | 11.3% |
| Oklahoma: | 10.3% |
| Lincoln County: | 30.3% |
| State: | 29.2% |
Agriculture in Lincoln County:
Average size of farms: 213 acresAverage value of agricultural products sold per farm: $11,385
Average value of crops sold per acre for harvested cropland: $46.15
The value of nursery, greenhouse, floriculture, and sod as a percentage of the total market value of agricultural products sold: 0.66%
The value of livestock, poultry, and their products as a percentage of the total market value of agricultural products sold: 86.03%
Average total farm production expenses per farm: $15,072
Harvested cropland as a percentage of land in farms: 16.18%
Irrigated harvested cropland as a percentage of land in farms: 0.43%
Average market value of all machinery and equipment per farm: $26,071
The percentage of farms operated by a family or individual: 96.12%
Average age of principal farm operators: 56 years
Average number of cattle and calves per 100 acres of all land in farms: 14.28
Milk cows as a percentage of all cattle and calves: 2.57%
All wheat for grain: 2251 harvested acres
Soybeans for beans: 405 harvested acres
Vegetables: 108 harvested acres
Land in orchards: 2,894 acres
Earthquake activity:
Lincoln County-area historical earthquake activity is significantly above Oklahoma state average. It is 864% greater than the overall U.S. average.On 11/6/2011 at 03:53:10, a magnitude 5.7 (5.7 MW, Depth: 3.2 mi, Class: Moderate, Intensity: VI - VII) earthquake occurred 12.7 miles away from Lincoln County center
On 9/3/2016 at 12:02:44, a magnitude 5.8 (5.8 MW, Depth: 3.5 mi) earthquake occurred 50.3 miles away from the county center
On 11/7/2016 at 01:44:24, a magnitude 5.0 (5.0 MW, Depth: 2.8 mi) earthquake occurred 20.4 miles away from the county center
On 11/5/2011 at 07:12:45, a magnitude 4.8 (4.8 MW, Depth: 1.9 mi, Class: Light, Intensity: IV - V) earthquake occurred 11.6 miles away from the county center
On 11/8/2011 at 02:46:57, a magnitude 4.8 (4.8 MW, Depth: 3.1 mi) earthquake occurred 12.3 miles away from Lincoln County center
On 2/13/2016 at 17:07:06, a magnitude 5.1 (5.1 MW, Depth: 5.2 mi) earthquake occurred 116.9 miles away from the county center
Magnitude types: moment magnitude (MW)
Most recent natural disasters:
- Oklahoma Covid-19 Pandemic, Incident Period: January 20, 2020, FEMA Id: 4530, Natural disaster type: Other
- Oklahoma Severe Storms, Tornadoes, Straight-line Winds, And Flooding, Incident Period: April 30, 2019 - May 1, 2019, FEMA Id: 4453, Natural disaster type: Storm, Tornado, Flood, Wind
- Oklahoma Severe Storms, Tornadoes, And Flooding, Incident Period: April 28, 2017 - May 2, 2017, FEMA Id: 4315, Natural disaster type: Storm, Tornado, Flood
- Oklahoma Severe Storms, Tornadoes, Straight-line Winds, and Flooding, Incident Period: May 05, 2015 to June 22, 2015, Major Disaster (Presidential) Declared DR-4222: May 26, 2015, FEMA Id: 4222, Natural disaster type: Storm, Tornado, Flood, Wind
- Oklahoma Severe Storms and Tornadoes, Incident Period: May 18, 2013 to June 02, 2013, Major Disaster (Presidential) Declared DR-4117: May 20, 2013, FEMA Id: 4117, Natural disaster type: Storm, Tornado
- Oklahoma Severe Winter Storm, Incident Period: January 31, 2011 to February 05, 2011, Emergency Declared EM-3316: February 02, 2011, FEMA Id: 3316, Natural disaster type: Winter Storm
- Oklahoma Severe Storms, Tornadoes, Straight-line Winds, and Flooding, Incident Period: June 13, 2010 to June 15, 2010, Major Disaster (Presidential) Declared DR-1926: July 26, 2010, FEMA Id: 1926, Natural disaster type: Storm, Tornado, Flood, Wind
- Oklahoma Severe Winter Storm, Incident Period: January 28, 2010 to January 30, 2010, Major Disaster (Presidential) Declared DR-1883: March 05, 2010, FEMA Id: 1883, Natural disaster type: Winter Storm
- Oklahoma Severe Winter Storm, Incident Period: January 28, 2010 to January 30, 2010, Emergency Declared EM-3308: January 30, 2010, FEMA Id: 3308, Natural disaster type: Winter Storm
- Oklahoma Severe Winter Storm, Incident Period: December 24, 2009 to December 25, 2009, Major Disaster (Presidential) Declared DR-1876: February 25, 2010, FEMA Id: 1876, Natural disaster type: Winter Storm
- 25 other natural disasters have been reported since 1953.
The number of natural disasters in Lincoln County (35) is a lot greater than the US average (15).
Major Disasters (Presidential) Declared: 25
Emergencies Declared: 6
Causes of natural disasters: Storms: 19, Floods: 18, Tornadoes: 15, Winter Storms: 9, Fires: 3, Winds: 3, Heavy Rain: 1, Hurricane: 1, Ice Storm: 1, Snow: 1, Other: 1 (Note: some incidents may be assigned to more than one category).
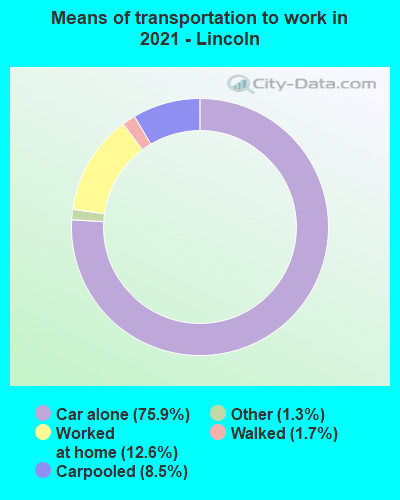
Means of transportation to work:
- Drove a car alone: 6,580 (72.1%)
- Carpooled: 827 (9.1%)
- Taxicab, motorcycle, or other means: 150 (1.6%)
- Walked: 194 (2.1%)
- Worked at home: 1,521 (16.7%)
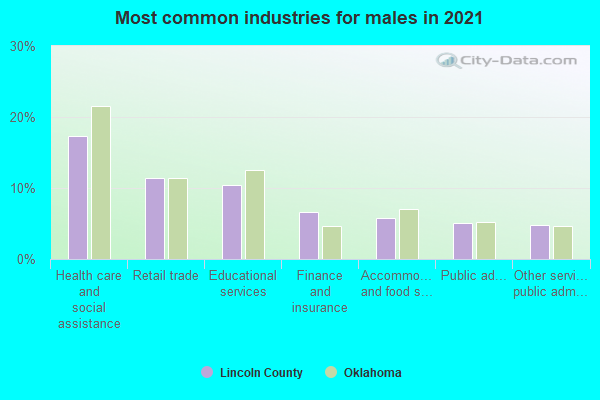
- Health care and social assistance (17%)
- Retail trade (11%)
- Educational services (11%)
- Finance and insurance (6%)
- Accommodation and food services (6%)
- Public administration (6%)
- Other services, except public administration (5%)
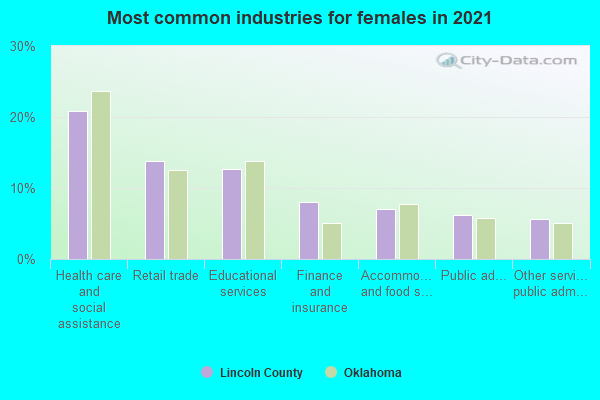
- Health care and social assistance (20%)
- Retail trade (14%)
- Educational services (13%)
- Finance and insurance (8%)
- Accommodation and food services (7%)
- Public administration (7%)
- Other services, except public administration (6%)
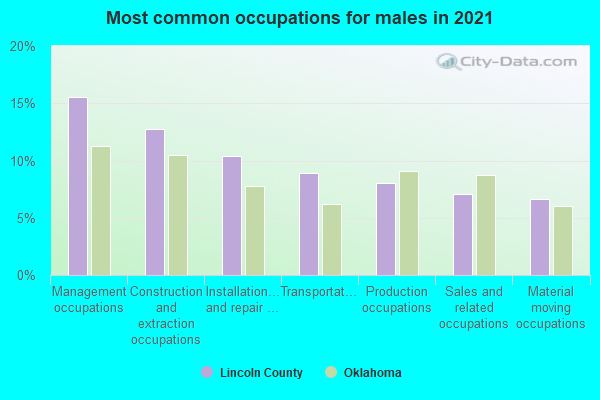
- Management occupations (14%)
- Construction and extraction occupations (13%)
- Installation, maintenance, and repair occupations (10%)
- Production occupations (9%)
- Transportation occupations (8%)
- Sales and related occupations (8%)
- Material moving occupations (6%)
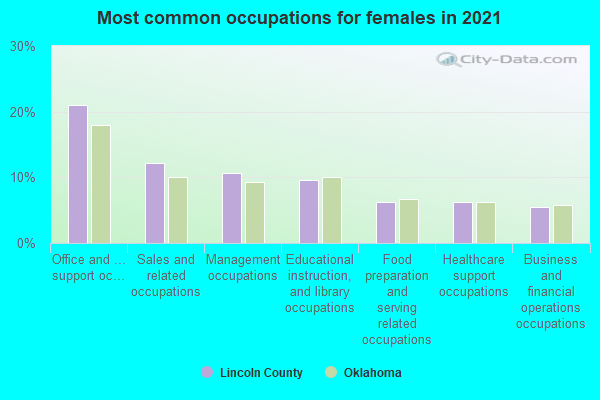
- Office and administrative support occupations (22%)
- Sales and related occupations (13%)
- Management occupations (11%)
- Educational instruction, and library occupations (11%)
- Healthcare support occupations (6%)
- Food preparation and serving related occupations (6%)
- Health diagnosing and treating practitioners and other technical occupations (6%)
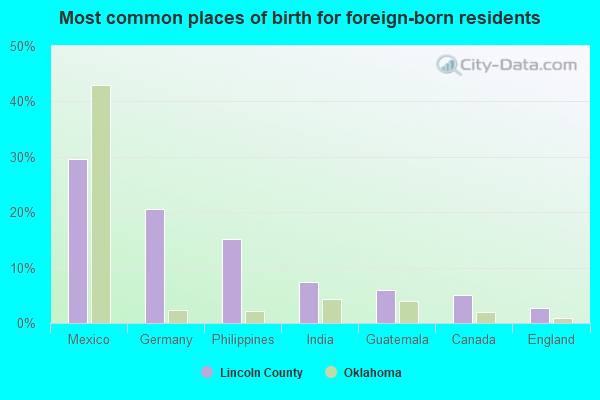
- Mexico (32%)
- Germany (14%)
- Cambodia (11%)
- Philippines (9%)
- Guatemala (5%)
- Brazil (4%)
- Canada (3%)
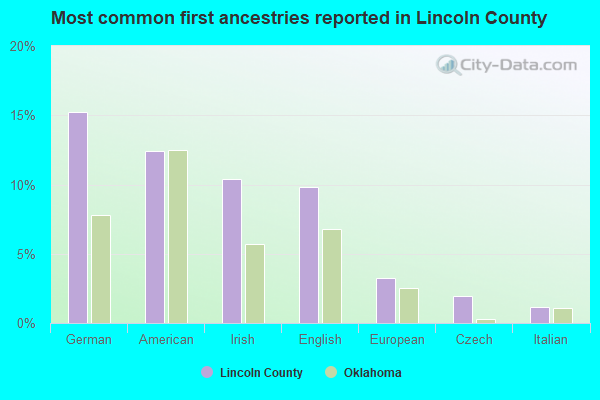
- American (13%)
- German (13%)
- English (11%)
- Irish (10%)
- European (3%)
- Czech (2%)
- Polish (1%)
People in group quarters in Lincoln County, Oklahoma in 2010:
- 208 people in nursing facilities/skilled-nursing facilities
- 105 people in local jails and other municipal confinement facilities
- 22 people in group homes intended for adults
- 22 people in workers' group living quarters and job corps centers
- 16 people in group homes for juveniles (non-correctional)
- 13 people in correctional facilities intended for juveniles
People in group quarters in Lincoln County, Oklahoma in 2000:
- 214 people in nursing homes
- 163 people in other noninstitutional group quarters
- 44 people in homes for the mentally ill
- 41 people in local jails and other confinement facilities (including police lockups)
- 16 people in homes or halfway houses for drug/alcohol abuse
- 2 people in other nonhousehold living situations
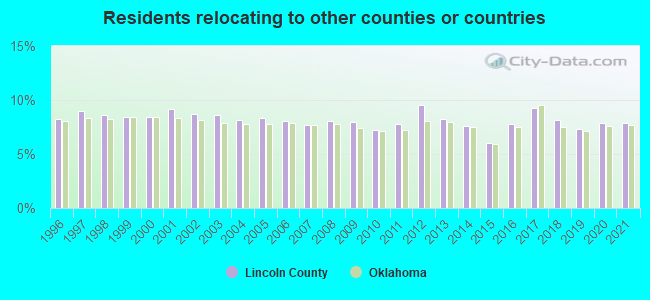
9.46% of this county's 2021 resident taxpayers lived in other counties in 2020 ($49,483 average adjusted gross income)
| Here: | 9.46% |
| Oklahoma average: | 8.28% |
10 or fewer of this county's residents moved from foreign countries.
6.87% relocated from other counties in Oklahoma ($33,454 average AGI)
2.60% relocated from other states ($16,029 average AGI)
Lincoln County: 2.60% Oklahoma average: 3.37%

Top counties from which taxpayers relocated into this county between 2020 and 2021:
| from Oklahoma County, OK | |
| from Pottawatomie County, OK | |
| from Payne County, OK | |
| from Cleveland County, OK | |
| from Canadian County, OK | |
| from Creek County, OK | |
| from Tulsa County, OK |
7.85% of this county's 2020 resident taxpayers moved to other counties in 2021 ($44,557 average adjusted gross income)
| Here: | 7.85% |
| Oklahoma average: | 7.66% |
10 or fewer of this county's residents moved to foreign countries.
6.40% relocated to other counties in Oklahoma ($36,768 average AGI)
1.45% relocated to other states ($7,788 average AGI)
Lincoln County: 1.45% Oklahoma average: 2.72%
Top counties to which taxpayers relocated from this county between 2020 and 2021:
| to Oklahoma County, OK | |
| to Pottawatomie County, OK | |
| to Payne County, OK | |
| to Cleveland County, OK | |
| to Creek County, OK | |
| to Tulsa County, OK |
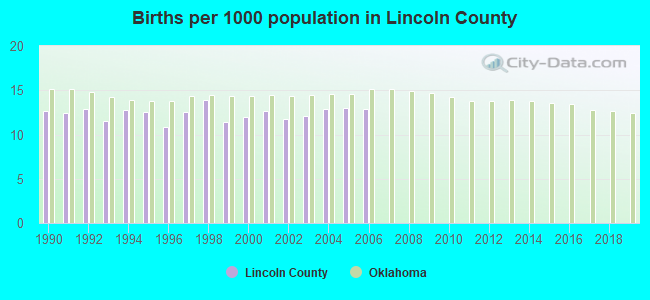
Births per 1000 population from 1990 to 1999: 12.3
Births per 1000 population from 2000 to 2006: 12.5
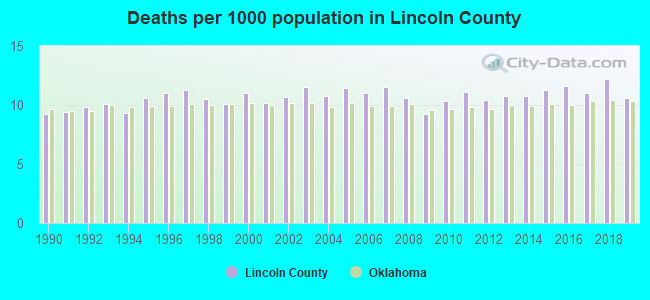
Deaths per 1000 population from 1990 to 1999: 10.1
Deaths per 1000 population from 2000 to 2009: 10.8
Deaths per 1000 population from 2010 to 2020: 11.2
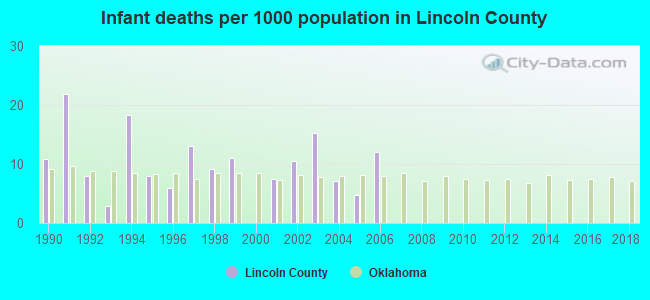
Infant deaths per 1000 live births from 1990 to 1999: 10.9
Infant deaths per 1000 live births from 2000 to 2006: 8.2
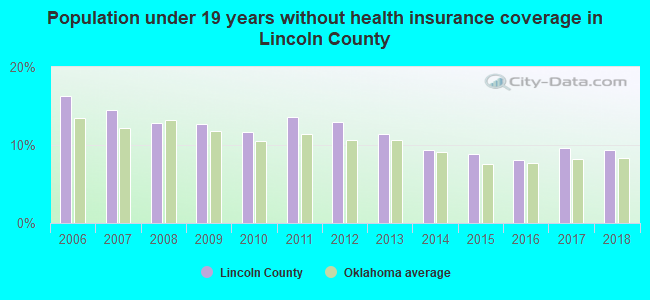
Persons under 19 years old without health insurance coverage in 2018: 9.3%
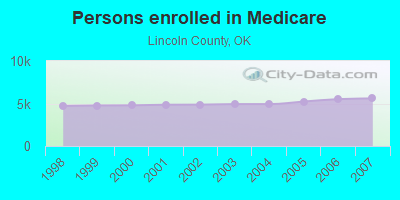
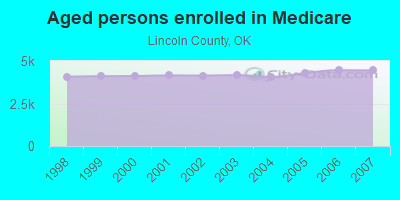
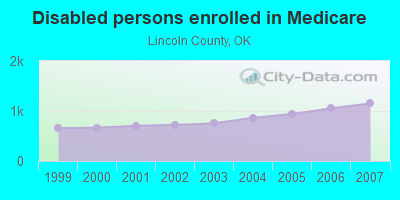
Persons enrolled in hospital insurance and/or supplemental medical insurance (Medicare) in July 1, 2007: 5,597 (4,445 aged, 1,152 disabled)
Children under 18 without health insurance coverage in 2007: 1,090 (14%)
Most common underlying causes of death in Lincoln County, Oklahoma in 1999 - 2019:
- Atherosclerotic heart disease (604)
- Bronchus or lung, unspecified - Malignant neoplasms (528)
- Chronic obstructive pulmonary disease, unspecified (377)
- Acute myocardial infarction, unspecified (329)
- Atherosclerotic cardiovascular disease, so described (185)
- Stroke, not specified as haemorrhage or infarction (168)
- Congestive heart failure (159)
- Unspecified dementia (146)
- Pneumonia, unspecified (84)
- Alzheimer disease, unspecified (82)
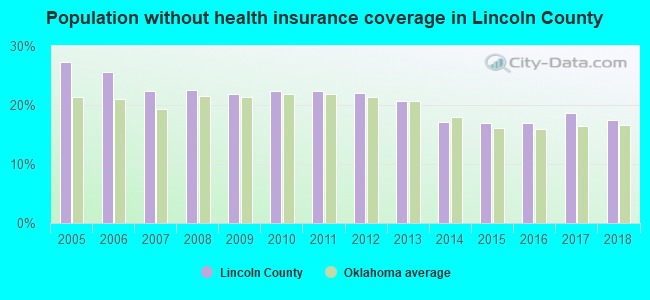
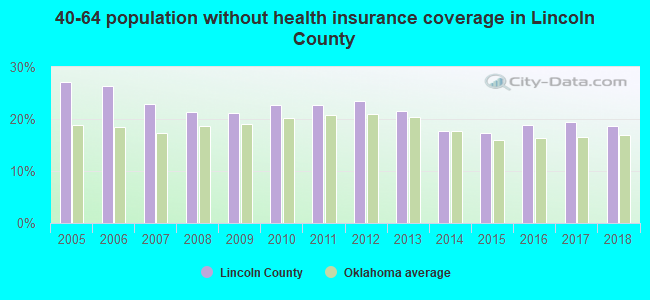
Population without health insurance coverage in 2000: 17%
Children under 18 without health insurance coverage in 2000: 14%
Short term general hospital admissions per 100,000 population in 2004: 2,483
Short term general hospital beds per 100,000 population in 2004: 136
Emergency room visits per 100,000 population in 2004: 18,968
General practice office based MDs per 100,000 population in 2005: 1,390
Medical specialist MDs per 100,000 population in 2005: 1,096
Dentists per 100,000 population in 1998: 12
Total births per 100,000 population, July 2005 - July 2006 : 22
Total deaths per 100,000 population, July 2005 - July 2006: 59
Suicides per 1,000,000 population from 2000 to 2006: 209.3. This is more than state average.
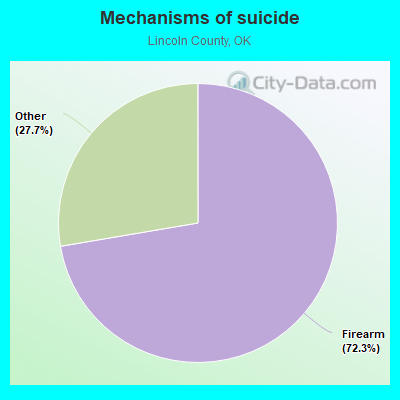
- Firearm - 151.4
- Other - 57.9
Household type by relationship:
Households: 34,152- Male householders: 6,763 (1,805 living alone), Female householders: 6,434 (1,660 living alone)
7,047 spouses (6,993 opposite-sex spouses), 592 unmarried partners, (530 opposite-sex unmarried partners), 9,658 children (8,558 natural, 399 adopted, 701 stepchildren), 1,154 grandchildren, 222 brothers or sisters, 424 parents, 55 foster children, 559 other relatives, 851 non-relatives
- In group quarters: 367
Size of family households: 4,347 2-persons, 1,959 3-persons, 1,587 4-persons, 643 5-persons, 352 6-persons, 197 7-or-more-persons.
Size of nonfamily households: 3,465 1-person, 594 2-persons, 34 3-persons, 25 4-persons.
4,989 married couples with children.
1,690 single-parent households (554 men, 1,136 women).
98.4% of residents of Lincoln speak English at home.
1.0% of residents speak Spanish at home (76% speak English very well, 8% speak English well, 12% speak English not well, 4% don't speak English at all).
0.1% of residents speak other Indo-European language at home (60% speak English very well, 37% speak English well, 3% speak English not well).
0.2% of residents speak Asian or Pacific Island language at home (8% speak English very well, 88% speak English well, 4% speak English not well).
0.3% of residents speak other language at home (76% speak English very well, 24% speak English well).
In fiscal year 2004:
Federal Government expenditure: $191,234,000 ($5,905 per capita)
Department of Defense expenditure: $6,447,000
Federal direct payments to individuals for retirement and disability: $93,030,000
Federal other direct payments to individuals: $33,548,000
Federal direct payments not to individuals: $2,864,000
Federal grants: $54,192,000
Federal procurement contracts: $1,228,000 ($45,000 Department of Defense)
Federal salaries and wages: $6,371,000 ($1,443,000 Department of Defense)
Federal Government direct loans: $174,000
Federal guaranteed/insured loans: $10,791,000
Federal Government insurance: $1,696,000
Population change from April 1, 2000 to July 1, 2005:
Births: 2,053| Here: | 64 per 1000 residents |
| State: | 75 per 1000 residents |
Deaths: 1,844
| Here: | 57 per 1000 residents |
| State: | 52 per 1000 residents |
Net international migration: +40
| Here: | +1 per 1000 residents |
| State: | +10 per 1000 residents |
Net internal migration: +45
| Here: | |
| State: |
Total withdrawal of fresh water for public supply: 1.39 millions of gallons per day (24% from ground, 76% from surface)
| Here: | 5.9 |
| State: | 6.1 |
| Here: | 4.8 |
| State: | 4.5 |
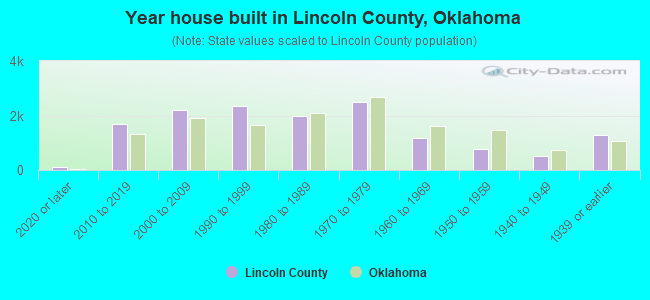
- Year house built in Lincoln County, Oklahoma
- 1452020 or later
- 1,7382010 to 2019
- 2,2442000 to 2009
- 2,3861990 to 1999
- 1,9661980 to 1989
- 2,4191970 to 1979
- 1,0861960 to 1969
- 7801950 to 1959
- 4521940 to 1949
- 1,2881939 or earlier
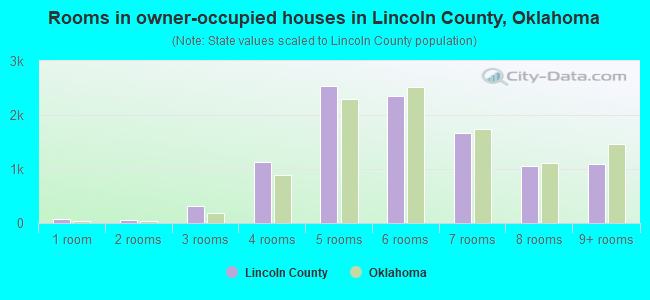
- Rooms in owner-occupied houses in Lincoln County, Oklahoma
- 1081 room
- 912 rooms
- 3423 rooms
- 1,2284 rooms
- 2,6275 rooms
- 2,2606 rooms
- 1,7777 rooms
- 1,0158 rooms
- 1,1489+ rooms
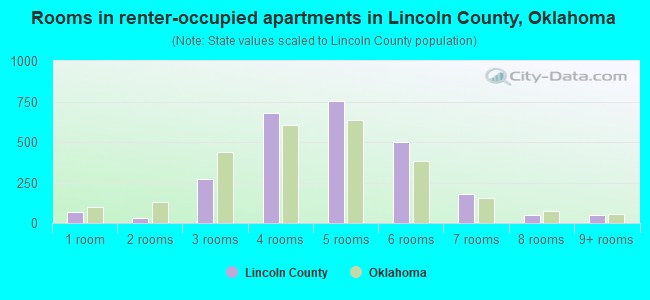
- Rooms in renter-occupied apartments in Lincoln County, Oklahoma
- 721 room
- 352 rooms
- 2583 rooms
- 7044 rooms
- 6945 rooms
- 4686 rooms
- 2157 rooms
- 858 rooms
- 449+ rooms
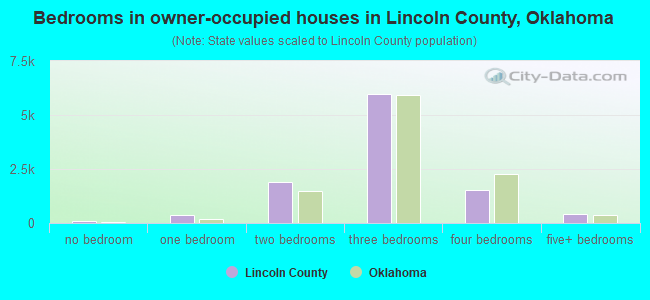
- Bedrooms in owner-occupied houses in Lincoln County, Oklahoma
- 138no bedroom
- 4641 bedroom
- 1,9482 bedrooms
- 5,9773 bedrooms
- 1,6564 bedrooms
- 3945+ bedrooms
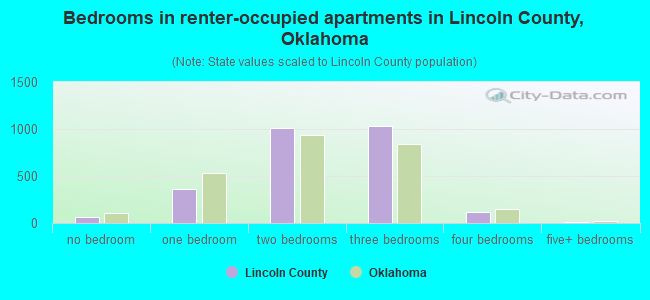
- Bedrooms in renter-occupied apartments in Lincoln County, Oklahoma
- 76no bedroom
- 3571 bedroom
- 1,0222 bedrooms
- 1,0083 bedrooms
- 1294 bedrooms
- 45+ bedrooms
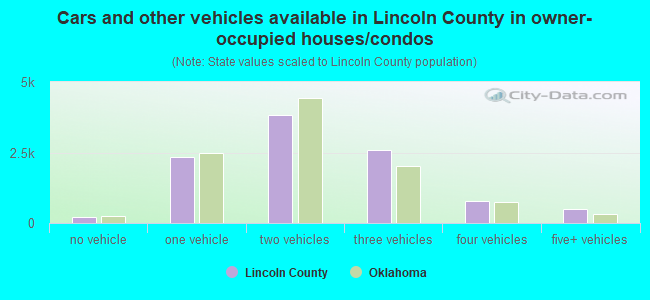
- Cars and other vehicles available in Lincoln County in owner-occupied houses/condos
- 203no vehicle
- 2,3191 vehicle
- 4,0402 vehicles
- 2,7203 vehicles
- 6954 vehicles
- 5635+ vehicles
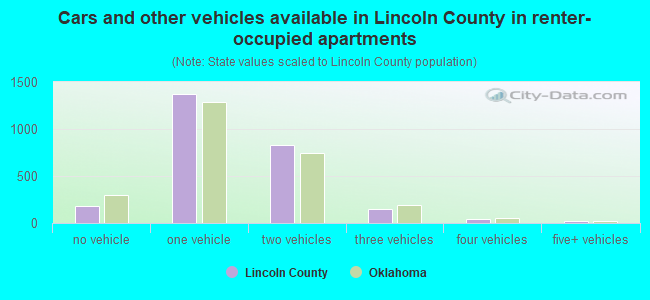
- Cars and other vehicles available in Lincoln County in renter-occupied apartments
- 182no vehicle
- 1,3661 vehicle
- 7842 vehicles
- 1883 vehicles
- 654 vehicles
- 215+ vehicles
91.7% of Lincoln County residents lived in the same house 1 years ago.
Out of people who lived in different houses, 29% lived in this county.
Out of people who lived in different counties, 75% lived in Oklahoma.
| Lincoln County: | 91.7% |
| State average: | 85.5% |
Place of birth for U.S.-born residents:
- This state: 24,248
- Other state: 9,340
- Northeast: 453
- Midwest: 2,806
- South: 2,958
- West: 3,160
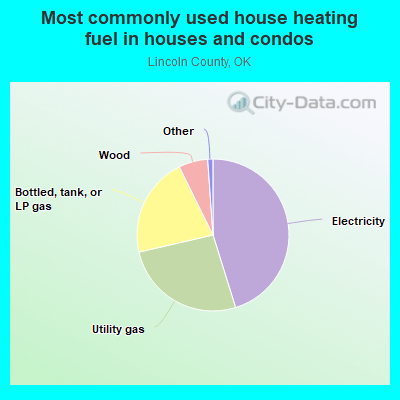
- 45.1%Electricity
- 25.0%Utility gas
- 22.5%Bottled, tank, or LP gas
- 6.4%Wood
- 0.6%Other fuel
- 0.2%No fuel used
- 0.1%Fuel oil, kerosene, etc.
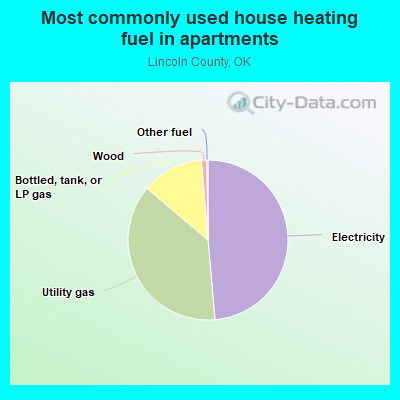
- 45.3%Electricity
- 41.4%Utility gas
- 12.2%Bottled, tank, or LP gas
- 0.8%Wood
- 0.2%Other fuel
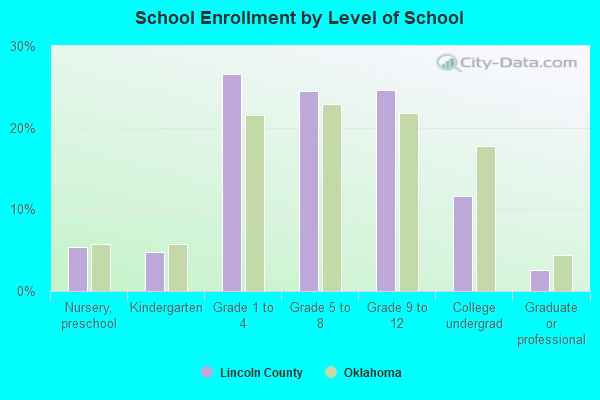
Private vs. public school enrollment:
| Here: | 14.1% |
| Oklahoma: | 11.7% |
| Here: | 12.6% |
| Oklahoma: | 11.7% |
| Here: | 24.3% |
| Oklahoma: | 19.3% |
Lincoln County government finances - Expenditure in 2018:
- Charges - Other: $2,002,000
Regular Highways: $324,000
Hospital Public: $295,000
Parks and Recreation: $41,000
Solid Waste Management: $6,000
Miscellaneous Commercial Activities: $1,000
- Construction - Police Protection: $92,000
Regular Highways: $68,000
General - Other: $2,000
Central Staff Services: $2,000
- Current Operations - General - Other: $3,025,000
Central Staff Services: $2,143,000
Judicial and Legal Services: $1,230,000
Police Protection: $1,185,000
Health - Other: $965,000
Financial Administration: $794,000
Regular Highways: $414,000
Local Fire Protection: $222,000
Correctional Institutions: $37,000
Parks and Recreation: $27,000
Solid Waste Management: $8,000
- Local Intergovernmental - Other: $302,000
- Miscellaneous - General Revenue - Other: $502,000
Interest Earnings: $89,000
Donations From Private Sources: $23,000
Fines and Forfeits: $3,000
- Other Funds - Cash and Securities: $6,411,000
- State Intergovernmental - Highways: $4,142,000
Other: $135,000
- Tax - Property: $42,235,000
Property: $34,356,000
General Sales and Gross Receipts: $2,781,000
Lincoln County government finances - Revenue in 2018:
- Charges - Other: $2,002,000
Regular Highways: $324,000
Hospital Public: $295,000
Parks and Recreation: $41,000
Solid Waste Management: $6,000
Miscellaneous Commercial Activities: $1,000
- Construction - Police Protection: $92,000
Regular Highways: $68,000
General - Other: $2,000
Central Staff Services: $2,000
- Current Operations - General - Other: $3,025,000
Central Staff Services: $2,143,000
Judicial and Legal Services: $1,230,000
Police Protection: $1,185,000
Health - Other: $965,000
Financial Administration: $794,000
Regular Highways: $414,000
Local Fire Protection: $222,000
Correctional Institutions: $37,000
Parks and Recreation: $27,000
Solid Waste Management: $8,000
- Local Intergovernmental - Other: $302,000
- Miscellaneous - General Revenue - Other: $502,000
Interest Earnings: $89,000
Donations From Private Sources: $23,000
Fines and Forfeits: $3,000
- Other Funds - Cash and Securities: $6,411,000
- State Intergovernmental - Highways: $4,142,000
Other: $135,000
- Tax - Property: $42,235,000
Property: $34,356,000
General Sales and Gross Receipts: $2,781,000
Lincoln County government finances - Debt in 2018:
- Charges - Other: $2,002,000
Regular Highways: $324,000
Hospital Public: $295,000
Parks and Recreation: $41,000
Solid Waste Management: $6,000
Miscellaneous Commercial Activities: $1,000
- Construction - Police Protection: $92,000
Regular Highways: $68,000
General - Other: $2,000
Central Staff Services: $2,000
- Current Operations - General - Other: $3,025,000
Central Staff Services: $2,143,000
Judicial and Legal Services: $1,230,000
Police Protection: $1,185,000
Health - Other: $965,000
Financial Administration: $794,000
Regular Highways: $414,000
Local Fire Protection: $222,000
Correctional Institutions: $37,000
Parks and Recreation: $27,000
Solid Waste Management: $8,000
- Local Intergovernmental - Other: $302,000
- Miscellaneous - General Revenue - Other: $502,000
Interest Earnings: $89,000
Donations From Private Sources: $23,000
Fines and Forfeits: $3,000
- Other Funds - Cash and Securities: $6,411,000
- State Intergovernmental - Highways: $4,142,000
Other: $135,000
- Tax - Property: $42,235,000
Property: $34,356,000
General Sales and Gross Receipts: $2,781,000
Lincoln County government finances - Cash and Securities in 2018:
- Charges - Other: $2,002,000
Regular Highways: $324,000
Hospital Public: $295,000
Parks and Recreation: $41,000
Solid Waste Management: $6,000
Miscellaneous Commercial Activities: $1,000
- Construction - Police Protection: $92,000
Regular Highways: $68,000
General - Other: $2,000
Central Staff Services: $2,000
- Current Operations - General - Other: $3,025,000
Central Staff Services: $2,143,000
Judicial and Legal Services: $1,230,000
Police Protection: $1,185,000
Health - Other: $965,000
Financial Administration: $794,000
Regular Highways: $414,000
Local Fire Protection: $222,000
Correctional Institutions: $37,000
Parks and Recreation: $27,000
Solid Waste Management: $8,000
- Local Intergovernmental - Other: $302,000
- Miscellaneous - General Revenue - Other: $502,000
Interest Earnings: $89,000
Donations From Private Sources: $23,000
Fines and Forfeits: $3,000
- Other Funds - Cash and Securities: $6,411,000
- State Intergovernmental - Highways: $4,142,000
Other: $135,000
- Tax - Property: $42,235,000
Property: $34,356,000
General Sales and Gross Receipts: $2,781,000
Supplemental Security Income (SSI) in 2006:
- Total number of recipients: 716
- Number of aged recipients: 72
- Number of blind and disabled recipients: 644
- Number of recipients under 18: 110
- Number of recipients between 18 and 64: 461
- Number of recipients older than 64: 145
- Number of recipients also receiving OASDI: 285
- Amount of payments (thousands of dollars): 309
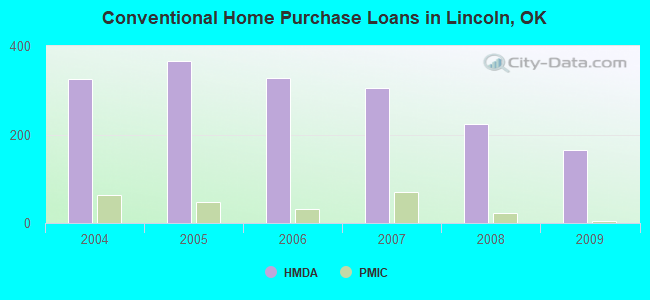
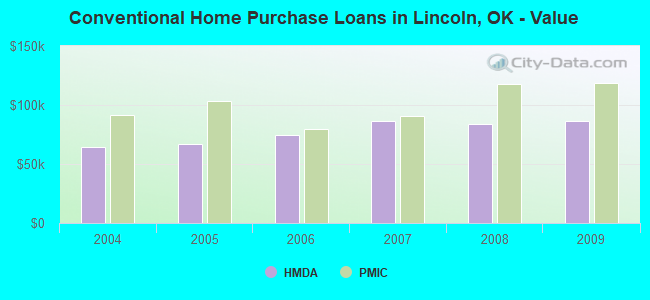
| Home Mortgage Disclosure Act Aggregated Statistics For Year 2009 (Based on 7 full tracts) | ||||||||||||
| A) FHA, FSA/RHS & VA Home Purchase Loans | B) Conventional Home Purchase Loans | C) Refinancings | D) Home Improvement Loans | F) Non-occupant Loans on < 5 Family Dwellings (A B C & D) | G) Loans On Manufactured Home Dwelling (A B C & D) | |||||||
|---|---|---|---|---|---|---|---|---|---|---|---|---|
| Number | Average Value | Number | Average Value | Number | Average Value | Number | Average Value | Number | Average Value | Number | Average Value | |
| LOANS ORIGINATED | 98 | $111,245 | 164 | $86,122 | 461 | $94,421 | 145 | $33,897 | 95 | $53,253 | 108 | $51,213 |
| APPLICATIONS APPROVED, NOT ACCEPTED | 15 | $103,200 | 17 | $75,118 | 43 | $98,628 | 10 | $37,800 | 2 | $49,500 | 15 | $60,867 |
| APPLICATIONS DENIED | 23 | $95,739 | 50 | $70,040 | 176 | $104,307 | 61 | $29,623 | 5 | $37,200 | 41 | $52,122 |
| APPLICATIONS WITHDRAWN | 10 | $108,900 | 8 | $73,500 | 114 | $114,105 | 10 | $68,800 | 1 | $80,000 | 12 | $64,333 |
| FILES CLOSED FOR INCOMPLETENESS | 4 | $135,250 | 1 | $52,000 | 25 | $102,600 | 1 | $77,000 | 0 | $0 | 4 | $64,750 |
| Private Mortgage Insurance Companies Aggregated Statistics For Year 2009 (Based on 6 full tracts) | ||||
| A) Conventional Home Purchase Loans | B) Refinancings | |||
|---|---|---|---|---|
| Number | Average Value | Number | Average Value | |
| LOANS ORIGINATED | 4 | $119,000 | 9 | $105,444 |
| APPLICATIONS APPROVED, NOT ACCEPTED | 3 | $97,667 | 5 | $100,600 |
| APPLICATIONS DENIED | 2 | $171,000 | 3 | $179,667 |
| APPLICATIONS WITHDRAWN | 0 | $0 | 0 | $0 |
| FILES CLOSED FOR INCOMPLETENESS | 0 | $0 | 0 | $0 |
| Most common first names in Lincoln County, OK among deceased individuals | ||
| Name | Count | Lived (average) |
|---|---|---|
| John | 230 | 77.1 years |
| William | 228 | 75.7 years |
| James | 217 | 72.9 years |
| Mary | 174 | 79.5 years |
| Charles | 126 | 73.6 years |
| Robert | 104 | 72.1 years |
| George | 99 | 75.5 years |
| Frank | 70 | 77.0 years |
| Henry | 64 | 77.0 years |
| Helen | 62 | 76.8 years |
| Most common last names in Lincoln County, OK among deceased individuals | ||
| Last name | Count | Lived (average) |
|---|---|---|
| Smith | 108 | 76.6 years |
| Miller | 77 | 77.9 years |
| Brown | 76 | 75.2 years |
| Johnson | 70 | 79.7 years |
| Jones | 68 | 77.4 years |
| Davis | 68 | 74.5 years |
| Wilson | 66 | 73.0 years |
| Williams | 59 | 77.5 years |
| Martin | 47 | 78.4 years |
| Hall | 46 | 78.6 years |
| Businesses in Lincoln County, OK | ||||
| Name | Count | Name | Count | |
|---|---|---|---|---|
| AT&T | 2 | Jones New York | 1 | |
| Ace Hardware | 1 | McDonald's | 3 | |
| Best Western | 1 | SONIC Drive-In | 3 | |
| Chevrolet | 1 | Subway | 5 | |
| DHL | 1 | True Value | 3 | |
| Econo Lodge | 1 | U-Haul | 3 | |
| FedEx | 2 | UPS | 2 | |
| Ford | 1 | Walmart | 1 | |
| H&R Block | 2 | |||