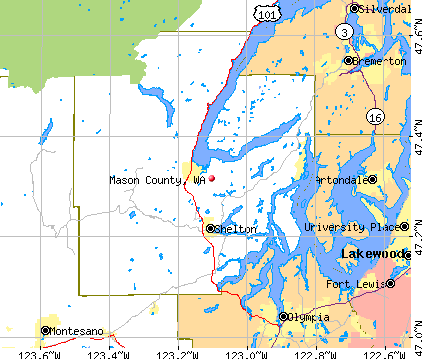
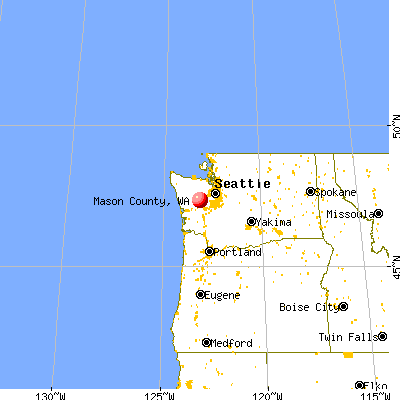
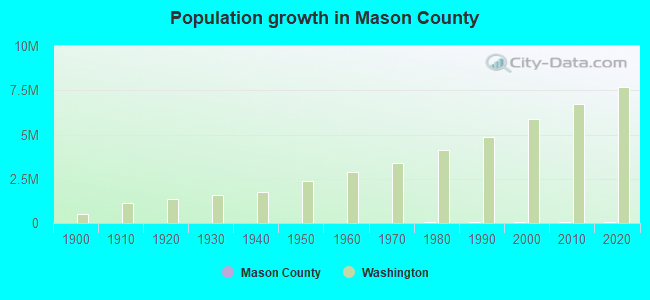
Mason County, Washington (WA)
County owner-occupied free and clear houses and condos in 2010: 6,031
County owner-occupied houses and condos in 2000: 14,947
Renter-occupied apartments: 5,358 (it was 3,965 in 2000)
| % of renters here: | 21% |
| State: | 36% |
Land area: 961 sq. mi.
Water area: 90.0 sq. mi.
Population density: 71 people per square mile (average).
Industries providing employment: Educational, health and social services (18.9%), Public administration (10.5%), Professional, scientific, management, administrative, and waste management services (10.5%).
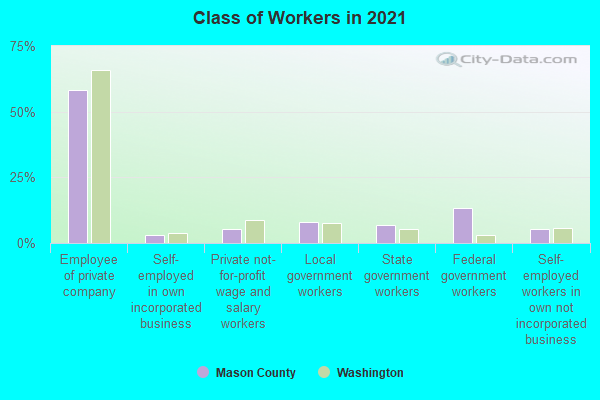
Type of workers:
- Private wage or salary: 65%
- Government: 28%
- Self-employed, not incorporated: 7%
- Unpaid family work: 0%
- OSM Map
- General Map
- Google Map
- MSN Map

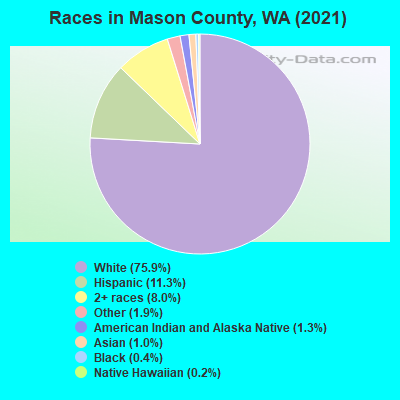
- 51,31875.3%White Non-Hispanic Alone
- 8,21612.1%Hispanic or Latino
- 4,3596.4%Two or more races
- 2,3313.4%American Indian and Alaska Native alone
- 1,1431.7%Black Non-Hispanic Alone
- 6430.9%Asian alone
- 880.1%Native Hawaiian and Other
Pacific Islander alone - 680.10%Some other race alone
| Median resident age: | 45.3 years |
| Washington median age: | 38.4 years |
| Males: 35,324 | |
| Females: 32,842 |

 | Washington State relocation questions (55 replies) |
| Best downtowns of Puget Sound cities/towns (besides the obvious) (60 replies) |
| Full Time RV Living Should Have "No" Time Restrictions (104 replies) |
| Real Estate Prices are Unaffordable for Senior Citizen (41 replies) |
| Washington State Fire Season 2021 (11 replies) |
| where can i afford to live in WA (14 replies) |
| Mason County: | 2.0 people |
| Washington: | 3 people |
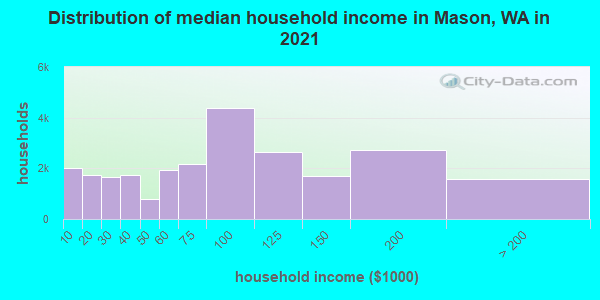
Estimated median household income in 2022: $80,139 ($39,586 in 1999)
| This county: | $80,139 |
| Washington: | $91,306 |
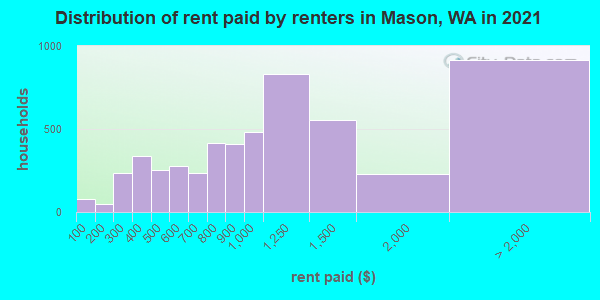
Median contract rent in 2022 for apartments: $1,001 (lower quartile is $626, upper quartile is $1,338)
| This county: | $1001 |
| State: | $1495 |
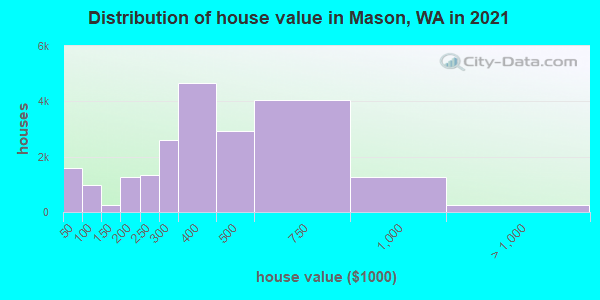
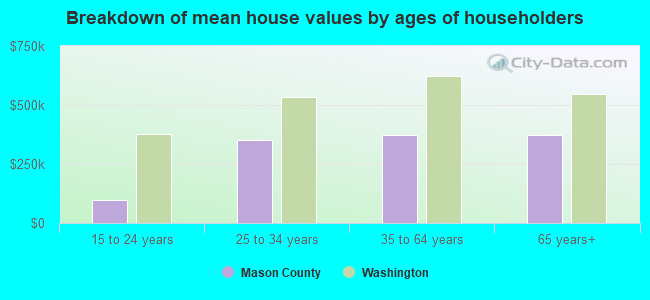
Estimated median house or condo value in 2022: $429,300 (it was $120,400 in 2000)
| Mason: | $429,300 |
| Washington: | $569,500 |
Mean price in 2022:
Median monthly housing costs for homes and condos with a mortgage: $1,725Detached houses: $537,101
Here: $537,101 State: $734,307 Townhouses or other attached units: $1,519,725
Here: $1,519,725 State: $657,697 In 2-unit structures: $473,026
Here: $473,026 State: $534,634 In 5-or-more-unit structures: $829,126
Here: $829,126 State: $503,183 Mobile homes: $246,485
Here: $246,485 State: $218,362 Occupied boats, RVs, vans, etc.: $117,920
Here: $117,920 State: $159,523
Median monthly housing costs for units without a mortgage: $524
Institutionalized population: 2,208
Crime in 2021 (reported by the sheriff's office or county police, not the county total):
- Murders: 1
- Rapes: 15
- Robberies: 14
- Assaults: 56
- Burglaries: 239
- Thefts: 453
- Auto thefts: 94
Crime in 2020 (reported by the sheriff's office or county police, not the county total):
- Murders: 2
- Rapes: 15
- Robberies: 5
- Assaults: 52
- Burglaries: 328
- Thefts: 419
- Auto thefts: 89
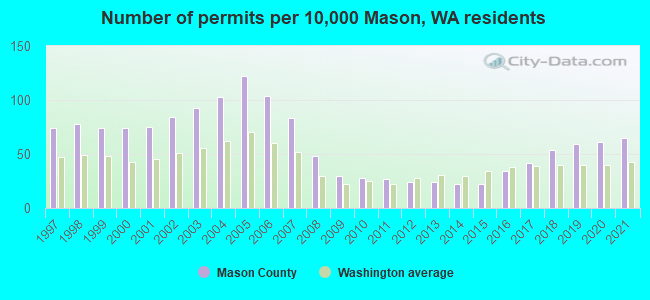
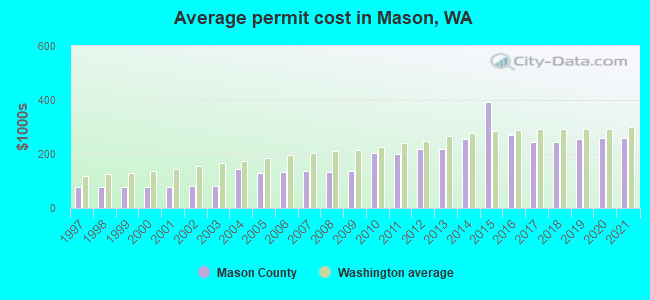
Single-family new house construction building permits:
- 2022: 240 buildings, average cost: $297,700
- 2021: 322 buildings, average cost: $258,400
- 2020: 303 buildings, average cost: $259,200
- 2019: 291 buildings, average cost: $254,700
- 2018: 266 buildings, average cost: $243,900
- 2017: 208 buildings, average cost: $244,900
- 2016: 166 buildings, average cost: $269,500
- 2015: 111 buildings, average cost: $394,200
- 2014: 108 buildings, average cost: $256,800
- 2013: 120 buildings, average cost: $219,600
- 2012: 121 buildings, average cost: $219,800
- 2011: 134 buildings, average cost: $200,100
- 2010: 140 buildings, average cost: $202,800
- 2009: 149 buildings, average cost: $137,200
- 2008: 236 buildings, average cost: $134,400
- 2007: 411 buildings, average cost: $136,500
- 2006: 516 buildings, average cost: $135,200
- 2005: 601 buildings, average cost: $129,400
- 2004: 508 buildings, average cost: $145,900
- 2003: 460 buildings, average cost: $81,800
- 2002: 413 buildings, average cost: $82,000
- 2001: 373 buildings, average cost: $78,800
- 2000: 364 buildings, average cost: $78,100
- 1999: 364 buildings, average cost: $77,100
- 1998: 385 buildings, average cost: $78,500
- 1997: 367 buildings, average cost: $77,600
Median real estate property taxes paid for housing units with mortgages in 2022: $2,737 (0.6%)
Median real estate property taxes paid for housing units with no mortgage in 2022: $2,966 (0.7%)
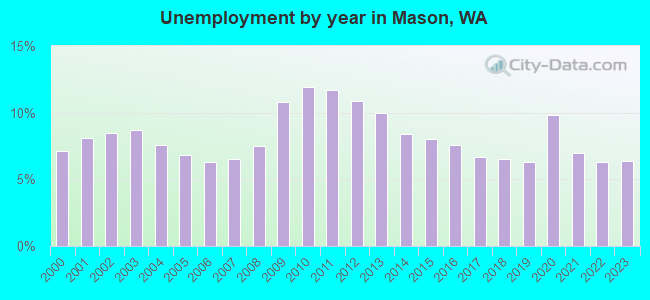
| Mason County: | 10.9% |
| Washington: | 10.0% |
Median age of residents in 2022: 45.3 years old
(Males: 44.1 years old, Females: 46.4 years old)
(Median age for: White residents: 51.4 years old, Black residents: 43.7 years old, American Indian residents: 30.3 years old, Asian residents: 44.1 years old, Hispanic or Latino residents: 24.1 years old, Other race residents: 16.6 years old)
Fair market rent in 2006 for a 1-bedroom apartment in Mason County is $540 a month.
Fair market rent for a 2-bedroom apartment is $647 a month.
Fair market rent for a 3-bedroom apartment is $884 a month.
Cities in this county include: Shelton, Belfair, Olympic, Tahuya, Kamilche, Allyn-Grapeview, Allyn, Grapeview, Skokomish Reservation, Union.
2023 air pollution in Mason County:
Particulate Matter (PM2.5) Annual: 4.3 µg/m3(standard limit: 15.0 µg/m3). Below U.S. average.
Neighboring counties: Bayfield County, Wisconsin  , Fallon County, Montana , Island County
  , Idaho County, Idaho , Missoula County, Montana , Whatcom County , Shoshone County, Idaho , Rosebud County, Montana , Norman County, Minnesota .
| Here: | 6.4% |
| Washington: | 4.6% |
Current college students: 1,522
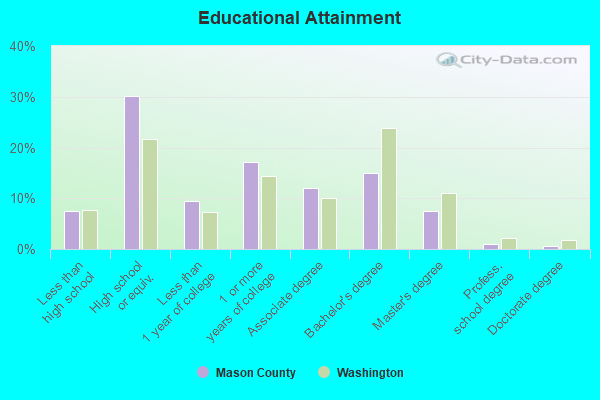
People 25 years of age or older with a high school degree or higher: 90.2%
People 25 years of age or older with a bachelor's degree or higher: 24.4%
Number of foreign born residents: 4,849 (26.0% naturalized citizens)
| Mason County: | 7.1% |
| Whole state: | 15.3% |
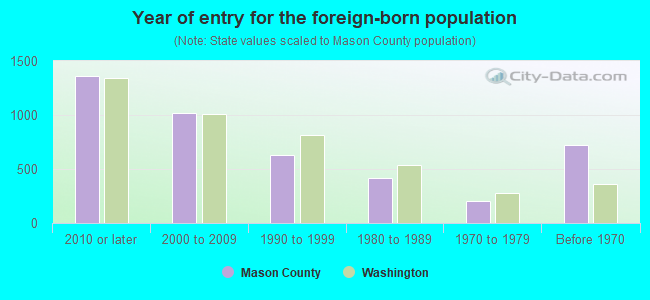
- Year of entry for the foreign-born population
- 1,8332010 or later
- 9612000 to 2009
- 6611990 to 1999
- 4151980 to 1989
- 2031970 to 1979
- 723Before 1970
Mean travel time to work (commute): ' minutes
Percentage of county residents living and working in this county: 98.2%


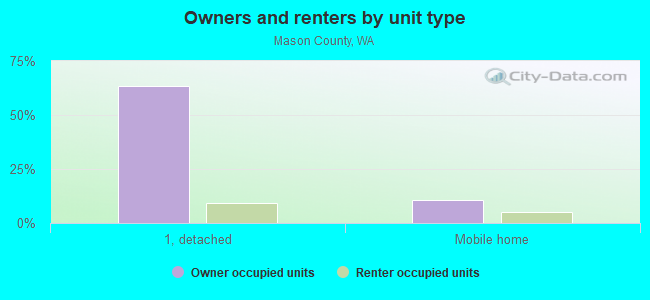
Housing units in structures:
- One, detached: 26,339
- One, attached: 303
- Two: 358
- 3 or 4: 314
- 5 to 9: 232
- 10 to 19: 145
- 20 to 49: 110
- 50 or more: 182
- Mobile homes: 5,538
- Boats, RVs, vans, etc.: 392
Housing units in Mason County with a mortgage: 14,233 (1,248 second mortgage, 149 home equity loan, 783 both second mortgage and home equity loan)
Houses without a mortgage: 280
| Here: | 4.8% with mortgage |
| State: | 98.0% with mortgage |
Religion statistics for Mason County
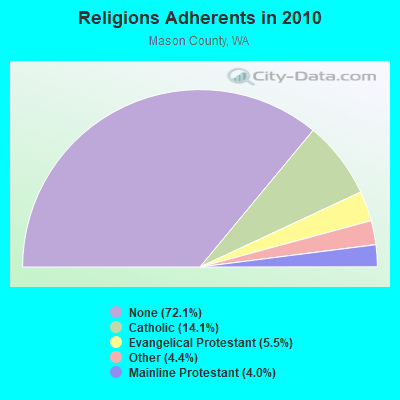
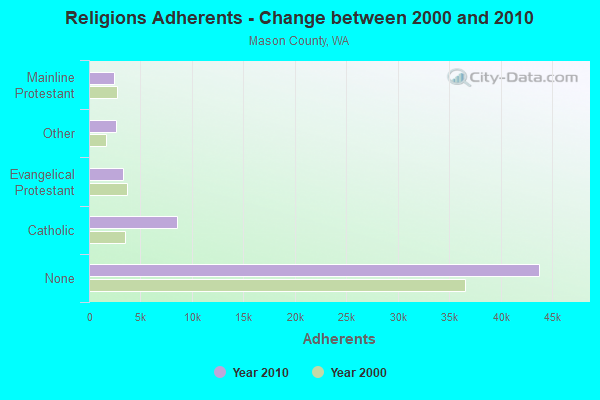
| Religion | Adherents | Congregations |
|---|---|---|
| Catholic | 8,536 | 2 |
| Evangelical Protestant | 3,327 | 26 |
| Other | 2,649 | 8 |
| Mainline Protestant | 2,435 | 12 |
| None | 43,752 | - |
Source: Clifford Grammich, Kirk Hadaway, Richard Houseal, Dale E.Jones, Alexei Krindatch, Richie Stanley and Richard H.Taylor. 2012. 2010 U.S.Religion Census: Religious Congregations & Membership Study. Association of Statisticians of American Religious Bodies. Jones, Dale E., et al. 2002. Congregations and Membership in the United States 2000. Nashville, TN: Glenmary Research Center.
Food Environment Statistics:
| Mason County: | 1.06 / 10,000 pop. |
| State: | 2.06 / 10,000 pop. |
| Here: | 0.35 / 10,000 pop. |
| Washington: | 0.19 / 10,000 pop. |
| This county: | 1.76 / 10,000 pop. |
| Washington: | 1.18 / 10,000 pop. |
| Mason County: | 3.87 / 10,000 pop. |
| Washington: | 2.67 / 10,000 pop. |
| This county: | 5.63 / 10,000 pop. |
| State: | 8.26 / 10,000 pop. |
| Mason County: | 8.8% |
| Washington: | 7.7% |
| Mason County: | 29.9% |
| State: | 25.7% |
| Here: | 13.7% |
| State: | 13.9% |
Agriculture in Mason County:
Average size of farms: 68 acresAverage value of agricultural products sold per farm: $162,524
Average value of crops sold per acre for harvested cropland: $1008.13
The value of nursery, greenhouse, floriculture, and sod as a percentage of the total market value of agricultural products sold: 5.39%
The value of livestock, poultry, and their products as a percentage of the total market value of agricultural products sold: 90.27%
Average total farm production expenses per farm: $68,528
Harvested cropland as a percentage of land in farms: 23.20%
Irrigated harvested cropland as a percentage of land in farms: 14.56%
Average market value of all machinery and equipment per farm: $45,072
The percentage of farms operated by a family or individual: 91.88%
Average age of principal farm operators: 54 years
Average number of cattle and calves per 100 acres of all land in farms: 7.17
Milk cows as a percentage of all cattle and calves: 1.68%
Vegetables: 123 harvested acres
Land in orchards: 53 acres
Earthquake activity:
Mason County-area historical earthquake activity is significantly above Washington state average. It is 1291% greater than the overall U.S. average.On 4/13/1949 at 19:55:42, a magnitude 7.0 (7.0 UK, Class: Major, Intensity: VIII - XII) earthquake occurred 28.7 miles away from Mason County center, causing $80,000,000 total damage
On 2/28/2001 at 18:54:32, a magnitude 6.8 (6.8 MD, Depth: 32.2 mi, Class: Strong, Intensity: VII - IX) earthquake occurred 21.1 miles away from the county center
On 2/28/2001 at 18:54:32, a magnitude 6.8 (6.5 MB, 6.6 MS, 6.8 MW) earthquake occurred 29.1 miles away from the county center, causing $2,000,000,000 total damage and $305,000,000 insured losses
On 4/29/1965 at 15:28:43, a magnitude 6.6 (6.6 UK) earthquake occurred 36.2 miles away from the county center, causing $28,000,000 total damage
On 7/3/1999 at 01:43:54, a magnitude 5.8 (5.4 MB, 5.5 MS, 5.8 MW, 5.3 ME, Depth: 25.2 mi, Class: Moderate, Intensity: VI - VII) earthquake occurred 18.6 miles away from Mason County center
On 1/31/1922 at 13:17:28, a magnitude 7.6 (7.6 UK) earthquake occurred 473.3 miles away from the county center
Magnitude types: body-wave magnitude (MB), duration magnitude (MD), energy magnitude (ME), surface-wave magnitude (MS), moment magnitude (MW)
Most recent natural disasters:
- Washington Covid-19 Pandemic, Incident Period: January 20, 2020, Major Disaster (Presidential) Declared DR-4481-WA: March 22, 2020, FEMA Id: 4481, Natural disaster type: Other
- Washington Severe Storms, Flooding, Landslides, And Mudslides, Incident Period: January 20, 2020 - February 10, 2020, FEMA Id: 4539, Natural disaster type: Storm, Mudslide, Landslide, Flood
- Washington Severe Winter Storms, Straight-line Winds, Flooding, Landslides, Mudslides, Tornado, Incident Period: December 10, 2018 - December 24, 2018, FEMA Id: 4418, Natural disaster type: Winter Storm, Tornado, Mudslide, Landslide, Flood, Wind
- Washington Severe Winter Storm, Straight-Line Winds, Flooding, Landslides, Mudslides, and a Tornado, Incident Period: December 01, 2015 to December 14, 2015, Major Disaster (Presidential) Declared DR-4253: February 02, 2016, FEMA Id: 4253, Natural disaster type: Winter Storm, Tornado, Mudslide, Landslide, Flood, Wind
- Washington Severe Storms, Straight-line Winds, Flooding, Landslides, and Mudslides, Incident Period: November 12, 2015 to November 21, 2015, Major Disaster (Presidential) Declared DR-4249: January 15, 2016, FEMA Id: 4249, Natural disaster type: Storm, Mudslide, Landslide, Flood, Wind
- Washington Severe Winter Storm, Flooding, Landslides, and Mudslides, Incident Period: January 14, 2012 to January 23, 2012, Major Disaster (Presidential) Declared DR-4056: March 05, 2012, FEMA Id: 4056, Natural disaster type: Winter Storm, Mudslide, Landslide, Flood
- Washington Severe Winter Storm, Landslides, Mudslides, and Flooding, Incident Period: January 06, 2009 to January 16, 2009, Major Disaster (Presidential) Declared DR-1817: January 30, 2009, FEMA Id: 1817, Natural disaster type: Winter Storm, Mudslide, Landslide, Flood
- Washington Severe Winter Storm and Record and Near Record Snow, Incident Period: December 12, 2008 to January 05, 2009, Major Disaster (Presidential) Declared DR-1825: March 02, 2009, FEMA Id: 1825, Natural disaster type: Winter Storm, Snow
- Washington Severe Storms, Flooding, Landslides, and Mudslides, Incident Period: December 01, 2007 to December 17, 2007, Major Disaster (Presidential) Declared DR-1734: December 08, 2007, FEMA Id: 1734, Natural disaster type: Storm, Mudslide, Landslide, Flood
- Washington Severe Winter Storm, Landslides, and Mudslides, Incident Period: December 14, 2006 to December 15, 2006, Major Disaster (Presidential) Declared DR-1682: February 14, 2007, FEMA Id: 1682, Natural disaster type: Winter Storm, Mudslide, Landslide
- 15 other natural disasters have been reported since 1953.
The number of natural disasters in Mason County (25) is a lot greater than the US average (15).
Major Disasters (Presidential) Declared: 22
Emergencies Declared: 1
Causes of natural disasters: Floods: 17, Storms: 12, Mudslides: 11, Landslides: 10, Winter Storms: 7, Winds: 5, Earthquakes: 2, Snows: 2, Tornadoes: 2, Heavy Rain: 1, Hurricane: 1, Volcanic Eruption: 1, Other: 1 (Note: some incidents may be assigned to more than one category).
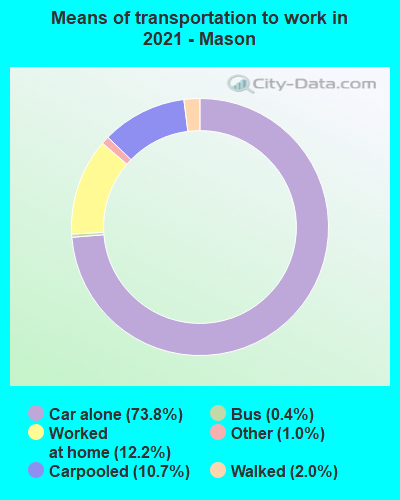
Means of transportation to work:
- Drove a car alone: 12,516 (68.5%)
- Carpooled: 1,917 (10.5%)
- Bus: 15 (0.1%)
- Ferryboat: 8 (0.0%)
- Taxicab, motorcycle, or other means: 160 (0.9%)
- Bicycle: 6 (0.0%)
- Walked: 327 (1.8%)
- Worked at home: 3,457 (18.9%)

- Health care and social assistance (20%)
- Public administration (11%)
- Finance and insurance (8%)
- Manufacturing (8%)
- Educational services (7%)
- Retail trade (6%)
- Administrative and support and waste management services (6%)
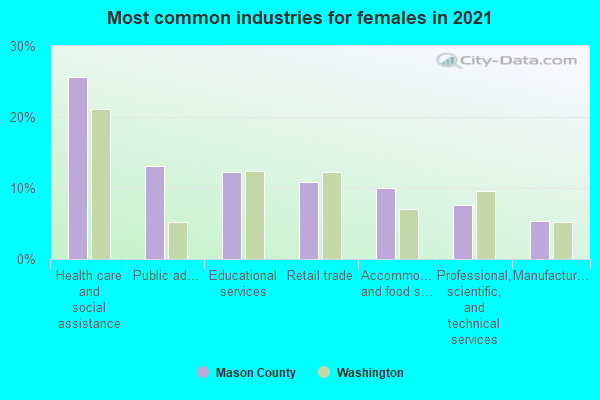
- Health care and social assistance (24%)
- Public administration (13%)
- Finance and insurance (10%)
- Manufacturing (9%)
- Educational services (8%)
- Retail trade (7%)
- Administrative and support and waste management services (7%)
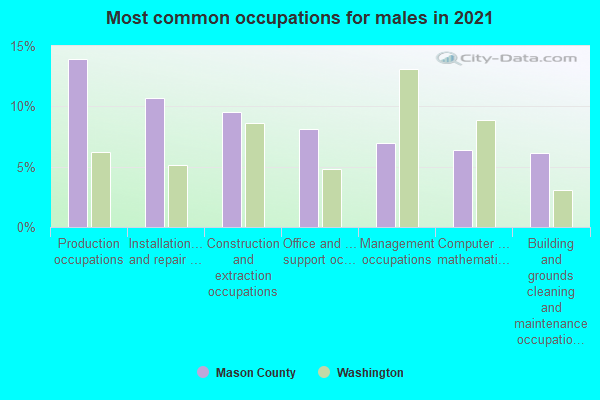
- Management occupations (15%)
- Construction and extraction occupations (13%)
- Installation, maintenance, and repair occupations (8%)
- Production occupations (7%)
- Farming, fishing, and forestry occupations (6%)
- Business and financial operations occupations (6%)
- Building and grounds cleaning and maintenance occupations (5%)
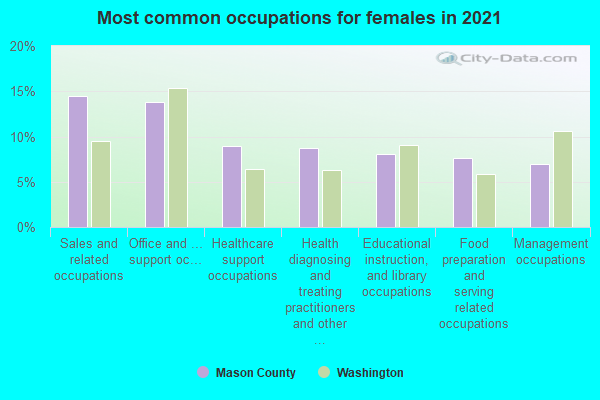
- Office and administrative support occupations (25%)
- Management occupations (12%)
- Sales and related occupations (9%)
- Health diagnosing and treating practitioners and other technical occupations (9%)
- Educational instruction, and library occupations (6%)
- Healthcare support occupations (6%)
- Personal care and service occupations (5%)
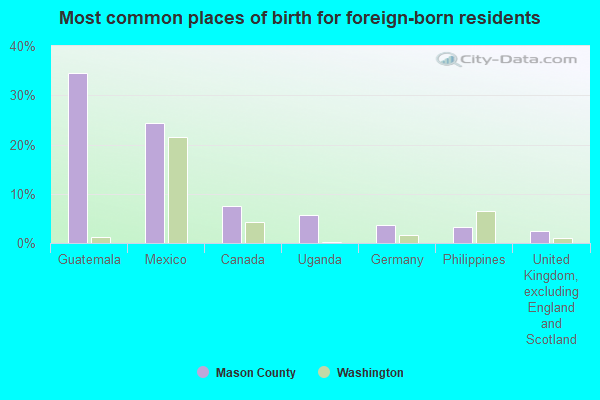
- Guatemala (33%)
- Mexico (20%)
- Canada (7%)
- Germany (4%)
- Uganda (4%)
- Vietnam (4%)
- Philippines (3%)
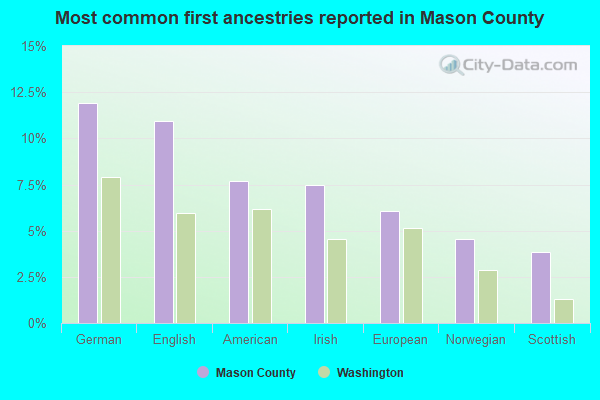
- German (11%)
- English (9%)
- American (8%)
- European (7%)
- Irish (7%)
- Norwegian (5%)
- Scottish (3%)
People in group quarters in Mason County, Washington in 2010:
- 1,851 people in state prisons
- 206 people in nursing facilities/skilled-nursing facilities
- 100 people in local jails and other municipal confinement facilities
- 84 people in other noninstitutional facilities
- 51 people in correctional facilities intended for juveniles
- 26 people in emergency and transitional shelters (with sleeping facilities) for people experiencing homelessness
- 14 people in group homes intended for adults
People in group quarters in Mason County, Washington in 2000:
- 1,833 people in state prisons
- 157 people in nursing homes
- 132 people in other noninstitutional group quarters
- 97 people in local jails and other confinement facilities (including police lockups)
- 60 people in training schools for juvenile delinquents
- 45 people in other group homes
- 7 people in other workers' dormitories
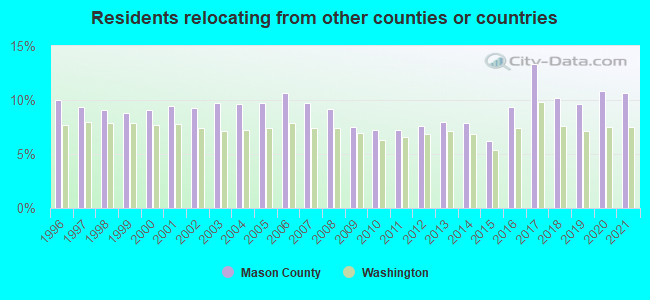
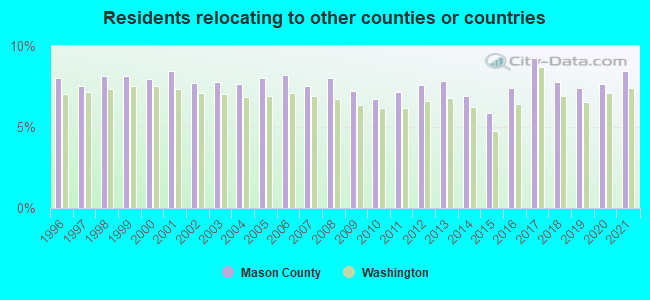
10.61% of this county's 2021 resident taxpayers lived in other counties in 2020 ($72,584 average adjusted gross income)
| Here: | 10.61% |
| Washington average: | 7.53% |
10 or fewer of this county's residents moved from foreign countries.
8.03% relocated from other counties in Washington ($56,282 average AGI)
2.58% relocated from other states ($16,303 average AGI)
Mason County: 2.58% Washington average: 3.85%
Top counties from which taxpayers relocated into this county between 2020 and 2021:
| from Kitsap County, WA | |
| from Thurston County, WA | |
| from Pierce County, WA | |
| from King County, WA | |
| from Grays Harbor County, WA | |
| from Snohomish County, WA | |
| from Lewis County, WA |
8.47% of this county's 2020 resident taxpayers moved to other counties in 2021 ($52,032 average adjusted gross income)
| Here: | 8.47% |
| Washington average: | 7.40% |
10 or fewer of this county's residents moved to foreign countries.
5.83% relocated to other counties in Washington ($34,001 average AGI)
2.64% relocated to other states ($18,031 average AGI)
Mason County: 2.64% Washington average: 3.73%
Top counties to which taxpayers relocated from this county between 2020 and 2021:
| to Thurston County, WA | |
| to Kitsap County, WA | |
| to Pierce County, WA | |
| to King County, WA | |
| to Grays Harbor County, WA | |
| to Snohomish County, WA | |
| to Maricopa County, AZ |
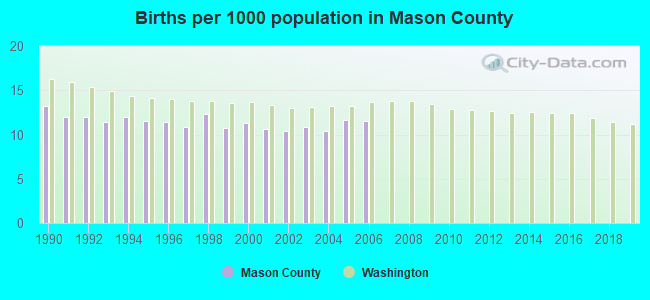
Births per 1000 population from 1990 to 1999: 11.7
Births per 1000 population from 2000 to 2006: 10.9
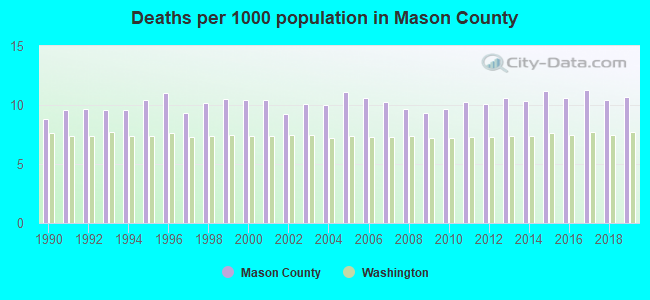
Deaths per 1000 population from 1990 to 1999: 9.9
Deaths per 1000 population from 2000 to 2009: 10.1
Deaths per 1000 population from 2010 to 2020: 10.5
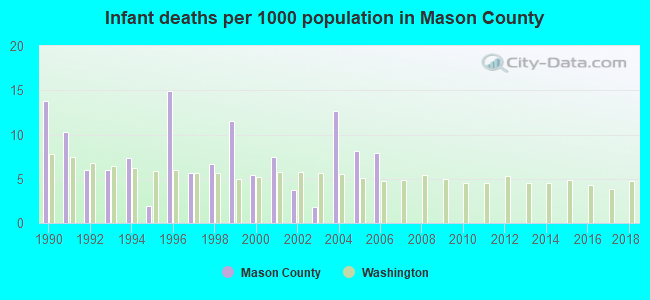
Infant deaths per 1000 live births from 1990 to 1999: 8.4
Infant deaths per 1000 live births from 2000 to 2006: 6.7
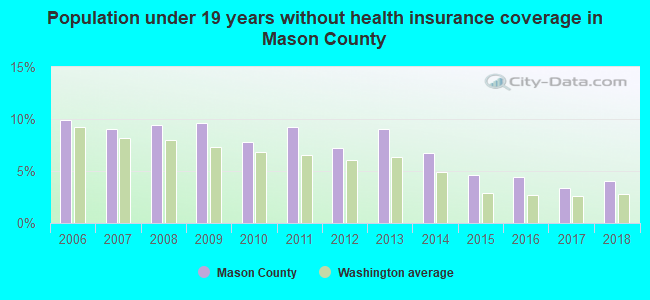
Persons under 19 years old without health insurance coverage in 2018: 4.0%

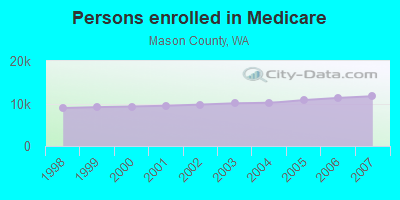
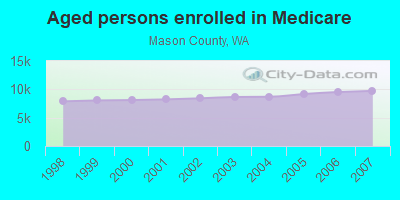
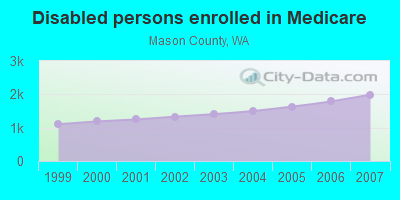
Persons enrolled in hospital insurance and/or supplemental medical insurance (Medicare) in July 1, 2007: 11,718 (9,724 aged, 1,994 disabled)
Children under 18 without health insurance coverage in 2007: 1,146 (9%)
Most common underlying causes of death in Mason County, Washington in 1999 - 2019:
- Bronchus or lung, unspecified - Malignant neoplasms (1,021)
- Atherosclerotic heart disease (777)
- Chronic obstructive pulmonary disease, unspecified (632)
- Alzheimer disease, unspecified (552)
- Acute myocardial infarction, unspecified (457)
- Stroke, not specified as haemorrhage or infarction (313)
- Hypertensive heart disease without (congestive) heart failure (253)
- Atherosclerotic cardiovascular disease, so described (125)
- Unspecified dementia (121)
- Pancreas, unspecified - Malignant neoplasms (103)
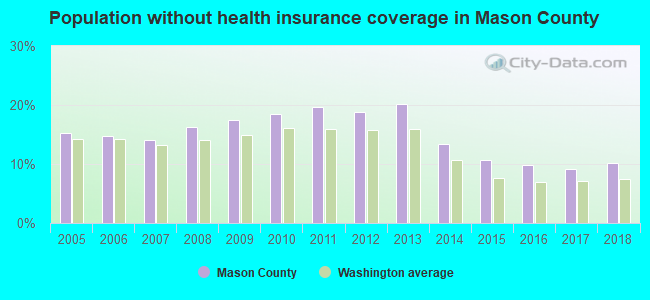
Population without health insurance coverage in 2000: 14%
Children under 18 without health insurance coverage in 2000: 12%
Short term general hospital admissions per 100,000 population in 2004: 4,585
Short term general hospital beds per 100,000 population in 2004: 91
Emergency room visits per 100,000 population in 2004: 24,910
General practice office based MDs per 100,000 population in 2005: 977
Medical specialist MDs per 100,000 population in 2005: 1,014
Dentists per 100,000 population in 1998: 6
Total births per 100,000 population, July 2005 - July 2006 : 18
Total deaths per 100,000 population, July 2005 - July 2006: 72
Limited-service eating places per 100,000 population in 2005 : 9
EPA green book nonattainment status in 2004-2006: 1
Suicides per 1,000,000 population from 2000 to 2006: 145.8. This is more than state average.
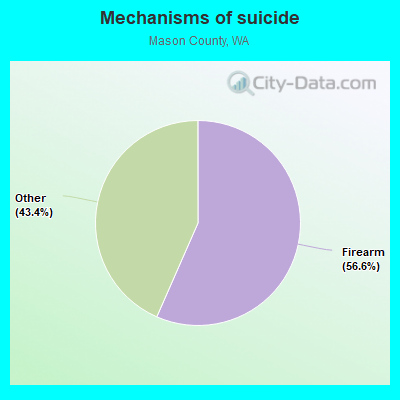
- Firearm - 82.5
- Other - 63.3
Household type by relationship:
Households: 68,166- Male householders: 13,995 (2,103 living alone), Female householders: 13,104 (3,247 living alone)
14,876 spouses (14,714 opposite-sex spouses), 2,372 unmarried partners, (2,352 opposite-sex unmarried partners), 16,270 children (15,138 natural, 117 adopted, 1,015 stepchildren), 1,086 grandchildren, 541 brothers or sisters, 285 parents, 0 foster children, 1,730 other relatives, 1,920 non-relatives
- In group quarters: 1,987
Size of family households: 10,294 2-persons, 3,944 3-persons, 2,599 4-persons, 1,037 5-persons, 633 6-persons, 330 7-or-more-persons.
Size of nonfamily households: 5,350 1-person, 2,673 2-persons, 172 3-persons, 67 5-persons.
7,670 married couples with children.
2,872 single-parent households (1,134 men, 1,738 women).
91.0% of residents of Mason speak English at home.
6.7% of residents speak Spanish at home (45% speak English very well, 24% speak English well, 19% speak English not well, 13% don't speak English at all).
0.8% of residents speak other Indo-European language at home (71% speak English very well, 5% speak English well, 24% speak English not well).
1.1% of residents speak Asian or Pacific Island language at home (60% speak English very well, 27% speak English well, 13% speak English not well, 1% don't speak English at all).
0.4% of residents speak other language at home (48% speak English very well, 16% speak English well, 35% speak English not well, 1% don't speak English at all).
In fiscal year 2004:
Federal Government expenditure: $314,262,000 ($5,859 per capita)
Department of Defense expenditure: $19,499,000
Federal direct payments to individuals for retirement and disability: $197,172,000
Federal other direct payments to individuals: $60,444,000
Federal direct payments not to individuals: $6,028,000
Federal grants: $42,204,000
Federal procurement contracts: $3,200,000 ($1,001,000 Department of Defense)
Federal salaries and wages: $5,214,000 ($0,000 Department of Defense)
Federal Government direct loans: $3,945,000
Federal guaranteed/insured loans: $36,297,000
Federal Government insurance: $45,700,000
Population change from April 1, 2000 to July 1, 2005:
Births: 2,918| Here: | 54 per 1000 residents |
| State: | 66 per 1000 residents |
Deaths: 2,743
| Here: | 50 per 1000 residents |
| State: | 38 per 1000 residents |
Net international migration: +357
| Here: | +7 per 1000 residents |
| State: | +21 per 1000 residents |
Net internal migration: +4,503
| Here: | +83 per 1000 residents |
| State: | +13 per 1000 residents |
Total withdrawal of fresh water for public supply: 3.80 millions of gallons per day (all from ground)
| Here: | 5.7 |
| State: | 6.5 |
| Here: | 4.4 |
| State: | 3.9 |
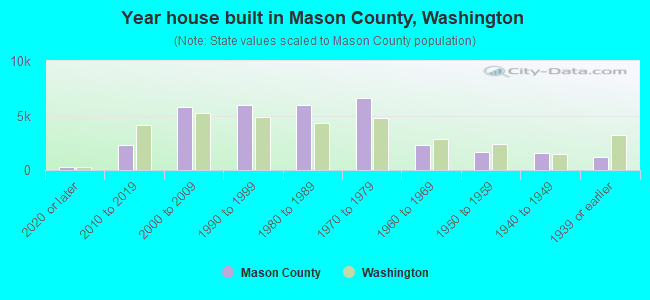
- Year house built in Mason County, Washington
- 6202020 or later
- 2,6252010 to 2019
- 7,3582000 to 2009
- 7,1331990 to 1999
- 3,8821980 to 1989
- 4,8311970 to 1979
- 2,7091960 to 1969
- 1,5591950 to 1959
- 1,5721940 to 1949
- 1,8621939 or earlier

- Rooms in owner-occupied houses in Mason County, Washington
- 681 room
- 7282 rooms
- 1,7903 rooms
- 2,2444 rooms
- 5,2445 rooms
- 4,4726 rooms
- 3,2527 rooms
- 2,5808 rooms
- 1,9849+ rooms
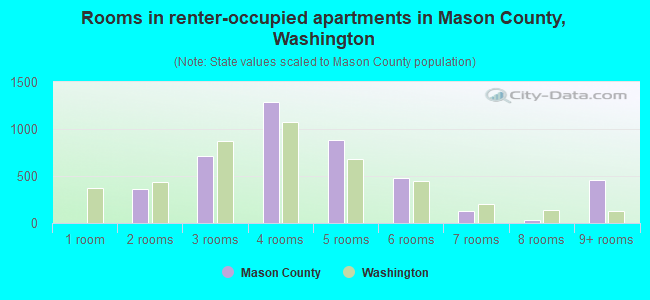
- Rooms in renter-occupied apartments in Mason County, Washington
- 2821 room
- 1972 rooms
- 8803 rooms
- 1,0754 rooms
- 1,4505 rooms
- 5326 rooms
- 2427 rooms
- 798 rooms
- 09+ rooms
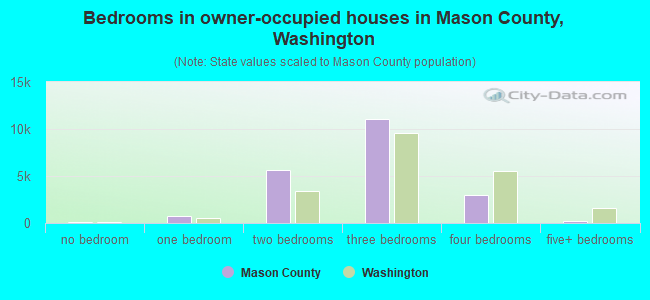
- Bedrooms in owner-occupied houses in Mason County, Washington
- 117no bedroom
- 1,8371 bedroom
- 5,0492 bedrooms
- 12,0543 bedrooms
- 2,7764 bedrooms
- 5295+ bedrooms
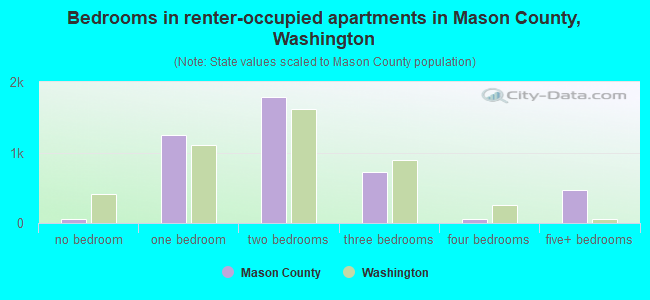
- Bedrooms in renter-occupied apartments in Mason County, Washington
- 282no bedroom
- 9111 bedroom
- 1,9672 bedrooms
- 1,4523 bedrooms
- 1254 bedrooms
- 05+ bedrooms
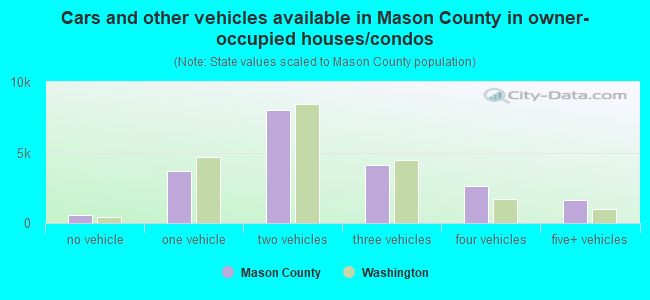
- Cars and other vehicles available in Mason County in owner-occupied houses/condos
- 905no vehicle
- 4,2421 vehicle
- 8,4062 vehicles
- 5,3323 vehicles
- 2,1744 vehicles
- 1,3035+ vehicles
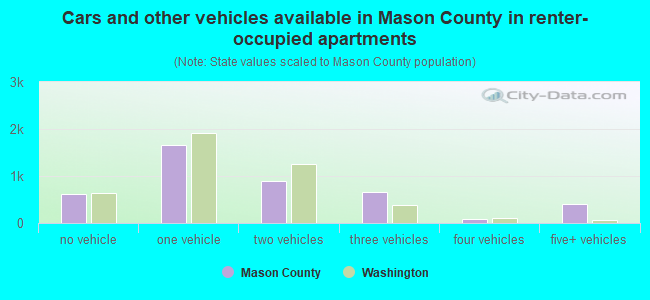
- Cars and other vehicles available in Mason County in renter-occupied apartments
- 612no vehicle
- 1,3511 vehicle
- 1,9722 vehicles
- 5303 vehicles
- 664 vehicles
- 2065+ vehicles
89.9% of Mason County residents lived in the same house 1 years ago.
Out of people who lived in different houses, 24% lived in this county.
Out of people who lived in different counties, 76% lived in Washington.
| Mason County: | 89.9% |
| State average: | 85.2% |
Place of birth for U.S.-born residents:
- This state: 37,694
- Other state: 24,664
- Northeast: 2,403
- Midwest: 6,438
- South: 5,304
- West: 10,519
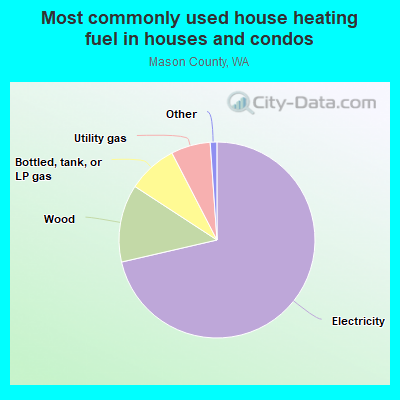
- 72.1%Electricity
- 11.5%Wood
- 8.6%Bottled, tank, or LP gas
- 6.7%Utility gas
- 0.8%Other fuel
- 0.2%Fuel oil, kerosene, etc.
- 0.1%No fuel used
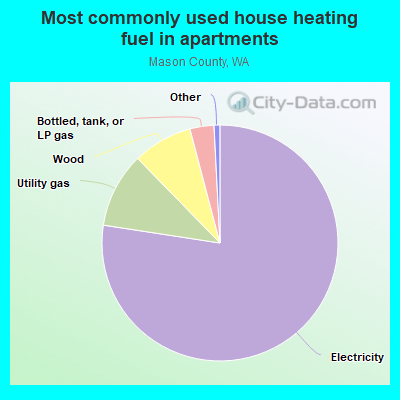
- 77.3%Electricity
- 10.7%Utility gas
- 6.5%Wood
- 4.1%Bottled, tank, or LP gas
- 1.0%No fuel used
- 0.3%Fuel oil, kerosene, etc.
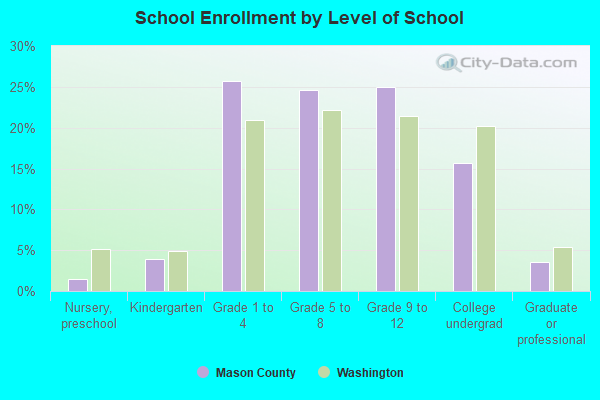
Private vs. public school enrollment:
| Here: | 6.3% |
| Washington: | 12.4% |
| Here: | 3.4% |
| Washington: | 9.2% |
| Here: | 15.4% |
| Washington: | 16.5% |

Mason County government finances - Expenditure in 2020:
- Bond Funds - Cash and Securities: $2,927,000
- Charges - Other: $6,686,000
Other: $5,209,000
Solid Waste Management: $4,300,000
Solid Waste Management: $3,445,000
Sewerage: $2,190,000
Sewerage: $2,167,000
Regular Highways: $131,000
Regular Highways: $118,000
Natural Resources - Other: $55,000
Parks and Recreation: $53,000
Parks and Recreation: $45,000
Natural Resources - Other: $12,000
- Construction - Regular Highways: $4,434,000
Regular Highways: $3,601,000
Parks and Recreation: $938,000
Judicial and Legal Services: $213,000
General Public Buildings: $196,000
Parks and Recreation: $149,000
Correctional Institutions: $65,000
Judicial and Legal Services: $51,000
General Public Buildings: $9,000
General - Other: $7,000
Financial Administration: $5,000
- Current Operations - Regular Highways: $10,718,000
Regular Highways: $9,647,000
Police Protection: $8,889,000
Police Protection: $8,773,000
Health - Other: $5,568,000
Judicial and Legal Services: $5,450,000
Correctional Institutions: $5,319,000
Correctional Institutions: $5,235,000
Health - Other: $5,071,000
Judicial and Legal Services: $4,602,000
Financial Administration: $3,941,000
Solid Waste Management: $3,854,000
Financial Administration: $3,374,000
Natural Resources - Other: $3,216,000
General - Other: $3,122,000
Solid Waste Management: $3,002,000
General - Other: $2,729,000
Natural Resources - Other: $2,513,000
Sewerage: $2,017,000
Local Fire Protection: $1,857,000
Central Staff Services: $1,737,000
Sewerage: $1,714,000
Central Staff Services: $1,633,000
Public Welfare - Other: $1,435,000
Housing and Community Development: $1,294,000
Corrections - Other: $1,196,000
General Public Buildings: $1,039,000
General Public Buildings: $998,000
Housing and Community Development: $992,000
Corrections - Other: $936,000
Public Welfare - Other: $675,000
Parks and Recreation: $495,000
Parks and Recreation: $474,000
Water Utilities: $196,000
Water Utilities: $125,000
Protective Inspection and Regulation - Other: $75,000
Protective Inspection and Regulation - Other: $62,000
Libraries: $30,000
Local Fire Protection: $27,000
Libraries: $18,000
- Federal Intergovernmental - Natural Resources: $323,000
Other: $297,000
General Local Government Support: $289,000
General Local Government Support: $263,000
Natural Resources: $141,000
Other: $103,000
Health and Hospitals: $54,000
- General - Interest on Debt: $1,421,000
Interest on Debt: $1,039,000
- Intergovernmental to Local - Other - Local Fire Protection: $1,254,000
Other - General - Other: $304,000
Other - Health - Other: $174,000
Other - Solid Waste Management: $134,000
Other - Natural Resources - Other: $112,000
Other - Financial Administration: $99,000
Other - Sewerage: $45,000
Other - Central Staff Services: $39,000
Other - Regular Highways: $37,000
Other - Water Utilities: $13,000
Other - Housing and Community Development: $2,000
Other - Health - Other: $1,000
- Intergovernmental to State - Health - Other: $5,000
- Local Intergovernmental - Other: $1,344,000
Health and Hospitals: $815,000
Other: $805,000
Health and Hospitals: $740,000
- Long Term Debt - Beginning Outstanding - Unspecified Public Purpose: $52,195,000
Outstanding Unspecified Public Purpose: $50,861,000
Outstanding Unspecified Public Purpose: $46,263,000
Beginning Outstanding - Unspecified Public Purpose: $42,057,000
Issue, Unspecified Public Purpose: $17,962,000
Retired Unspecified Public Purpose: $14,537,000
Retired Unspecified Public Purpose: $9,157,000
Issue, Unspecified Public Purpose: $8,604,000
- Miscellaneous - Rents: $1,499,000
Interest Earnings: $1,167,000
Fines and Forfeits: $985,000
General Revenue - Other: $928,000
Fines and Forfeits: $885,000
Sale of Property: $751,000
Donations From Private Sources: $358,000
Donations From Private Sources: $301,000
General Revenue - Other: $258,000
Special Assessments: $223,000
Sale of Property: $206,000
Rents: $174,000
Special Assessments: $81,000
Interest Earnings: $0
- Other Capital Outlay - Health - Other: $560,000
Regular Highways: $481,000
Sewerage: $368,000
Solid Waste Management: $224,000
Solid Waste Management: $220,000
Water Utilities: $215,000
Regular Highways: $149,000
Police Protection: $111,000
Natural Resources - Other: $104,000
Natural Resources - Other: $72,000
General - Other: $69,000
Health - Other: $56,000
Correctional Institutions: $36,000
Transit Utilities: $33,000
Sewerage: $33,000
Financial Administration: $30,000
Judicial and Legal Services: $23,000
Police Protection: $23,000
Financial Administration: $11,000
- Other Funds - Cash and Securities: $1,517,000
Cash and Securities: $1,190,000
- Revenue - Water Utilities: $220,000
Water Utilities: $209,000
- State Intergovernmental - Other: $9,730,000
Other: $7,288,000
Highways: $4,049,000
Highways: $3,603,000
General Local Government Support: $1,900,000
Health and Hospitals: $1,716,000
Health and Hospitals: $1,526,000
General Local Government Support: $312,000
Housing and Community Development: $161,000
Housing and Community Development: $133,000
- Tax - Property: $21,220,000
Property: $19,479,000
General Sales and Gross Receipts: $10,406,000
General Sales and Gross Receipts: $7,586,000
Documentary and Stock Transfer: $2,528,000
Documentary and Stock Transfer: $2,103,000
Public Utilities Sales: $1,782,000
Other: $1,471,000
Other: $1,254,000
Other License: $1,197,000
Public Utilities Sales: $1,089,000
Severance: $1,032,000
Other License: $961,000
Other Selective Sales: $621,000
Other Selective Sales: $398,000
Motor Vehicle License: $372,000
Motor Vehicle License: $340,000
Occupation and Business License - Other: $188,000
Occupation and Business License - Other: $164,000
Amusements Sales: $77,000
Amusements Sales: $53,000
Public Utility License: $36,000
Severance: $26,000
- Total Salaries and Wages: $26,390,000
: $26,034,000
Mason County government finances - Revenue in 2020:
- Bond Funds - Cash and Securities: $2,927,000
- Charges - Other: $6,686,000
Other: $5,209,000
Solid Waste Management: $4,300,000
Solid Waste Management: $3,445,000
Sewerage: $2,190,000
Sewerage: $2,167,000
Regular Highways: $131,000
Regular Highways: $118,000
Natural Resources - Other: $55,000
Parks and Recreation: $53,000
Parks and Recreation: $45,000
Natural Resources - Other: $12,000
- Construction - Regular Highways: $4,434,000
Regular Highways: $3,601,000
Parks and Recreation: $938,000
Judicial and Legal Services: $213,000
General Public Buildings: $196,000
Parks and Recreation: $149,000
Correctional Institutions: $65,000
Judicial and Legal Services: $51,000
General Public Buildings: $9,000
General - Other: $7,000
Financial Administration: $5,000
- Current Operations - Regular Highways: $10,718,000
Regular Highways: $9,647,000
Police Protection: $8,889,000
Police Protection: $8,773,000
Health - Other: $5,568,000
Judicial and Legal Services: $5,450,000
Correctional Institutions: $5,319,000
Correctional Institutions: $5,235,000
Health - Other: $5,071,000
Judicial and Legal Services: $4,602,000
Financial Administration: $3,941,000
Solid Waste Management: $3,854,000
Financial Administration: $3,374,000
Natural Resources - Other: $3,216,000
General - Other: $3,122,000
Solid Waste Management: $3,002,000
General - Other: $2,729,000
Natural Resources - Other: $2,513,000
Sewerage: $2,017,000
Local Fire Protection: $1,857,000
Central Staff Services: $1,737,000
Sewerage: $1,714,000
Central Staff Services: $1,633,000
Public Welfare - Other: $1,435,000
Housing and Community Development: $1,294,000
Corrections - Other: $1,196,000
General Public Buildings: $1,039,000
General Public Buildings: $998,000
Housing and Community Development: $992,000
Corrections - Other: $936,000
Public Welfare - Other: $675,000
Parks and Recreation: $495,000
Parks and Recreation: $474,000
Water Utilities: $196,000
Water Utilities: $125,000
Protective Inspection and Regulation - Other: $75,000
Protective Inspection and Regulation - Other: $62,000
Libraries: $30,000
Local Fire Protection: $27,000
Libraries: $18,000
- Federal Intergovernmental - Natural Resources: $323,000
Other: $297,000
General Local Government Support: $289,000
General Local Government Support: $263,000
Natural Resources: $141,000
Other: $103,000
Health and Hospitals: $54,000
- General - Interest on Debt: $1,421,000
Interest on Debt: $1,039,000
- Intergovernmental to Local - Other - Local Fire Protection: $1,254,000
Other - General - Other: $304,000
Other - Health - Other: $174,000
Other - Solid Waste Management: $134,000
Other - Natural Resources - Other: $112,000
Other - Financial Administration: $99,000
Other - Sewerage: $45,000
Other - Central Staff Services: $39,000
Other - Regular Highways: $37,000
Other - Water Utilities: $13,000
Other - Housing and Community Development: $2,000
Other - Health - Other: $1,000
- Intergovernmental to State - Health - Other: $5,000
- Local Intergovernmental - Other: $1,344,000
Health and Hospitals: $815,000
Other: $805,000
Health and Hospitals: $740,000
- Long Term Debt - Beginning Outstanding - Unspecified Public Purpose: $52,195,000
Outstanding Unspecified Public Purpose: $50,861,000
Outstanding Unspecified Public Purpose: $46,263,000
Beginning Outstanding - Unspecified Public Purpose: $42,057,000
Issue, Unspecified Public Purpose: $17,962,000
Retired Unspecified Public Purpose: $14,537,000
Retired Unspecified Public Purpose: $9,157,000
Issue, Unspecified Public Purpose: $8,604,000
- Miscellaneous - Rents: $1,499,000
Interest Earnings: $1,167,000
Fines and Forfeits: $985,000
General Revenue - Other: $928,000
Fines and Forfeits: $885,000
Sale of Property: $751,000
Donations From Private Sources: $358,000
Donations From Private Sources: $301,000
General Revenue - Other: $258,000
Special Assessments: $223,000
Sale of Property: $206,000
Rents: $174,000
Special Assessments: $81,000
Interest Earnings: $0
- Other Capital Outlay - Health - Other: $560,000
Regular Highways: $481,000
Sewerage: $368,000
Solid Waste Management: $224,000
Solid Waste Management: $220,000
Water Utilities: $215,000
Regular Highways: $149,000
Police Protection: $111,000
Natural Resources - Other: $104,000
Natural Resources - Other: $72,000
General - Other: $69,000
Health - Other: $56,000
Correctional Institutions: $36,000
Transit Utilities: $33,000
Sewerage: $33,000
Financial Administration: $30,000
Judicial and Legal Services: $23,000
Police Protection: $23,000
Financial Administration: $11,000
- Other Funds - Cash and Securities: $1,517,000
Cash and Securities: $1,190,000
- Revenue - Water Utilities: $220,000
Water Utilities: $209,000
- State Intergovernmental - Other: $9,730,000
Other: $7,288,000
Highways: $4,049,000
Highways: $3,603,000
General Local Government Support: $1,900,000
Health and Hospitals: $1,716,000
Health and Hospitals: $1,526,000
General Local Government Support: $312,000
Housing and Community Development: $161,000
Housing and Community Development: $133,000
- Tax - Property: $21,220,000
Property: $19,479,000
General Sales and Gross Receipts: $10,406,000
General Sales and Gross Receipts: $7,586,000
Documentary and Stock Transfer: $2,528,000
Documentary and Stock Transfer: $2,103,000
Public Utilities Sales: $1,782,000
Other: $1,471,000
Other: $1,254,000
Other License: $1,197,000
Public Utilities Sales: $1,089,000
Severance: $1,032,000
Other License: $961,000
Other Selective Sales: $621,000
Other Selective Sales: $398,000
Motor Vehicle License: $372,000
Motor Vehicle License: $340,000
Occupation and Business License - Other: $188,000
Occupation and Business License - Other: $164,000
Amusements Sales: $77,000
Amusements Sales: $53,000
Public Utility License: $36,000
Severance: $26,000
- Total Salaries and Wages: $26,390,000
: $26,034,000
Mason County government finances - Debt in 2020:
- Bond Funds - Cash and Securities: $2,927,000
- Charges - Other: $6,686,000
Other: $5,209,000
Solid Waste Management: $4,300,000
Solid Waste Management: $3,445,000
Sewerage: $2,190,000
Sewerage: $2,167,000
Regular Highways: $131,000
Regular Highways: $118,000
Natural Resources - Other: $55,000
Parks and Recreation: $53,000
Parks and Recreation: $45,000
Natural Resources - Other: $12,000
- Construction - Regular Highways: $4,434,000
Regular Highways: $3,601,000
Parks and Recreation: $938,000
Judicial and Legal Services: $213,000
General Public Buildings: $196,000
Parks and Recreation: $149,000
Correctional Institutions: $65,000
Judicial and Legal Services: $51,000
General Public Buildings: $9,000
General - Other: $7,000
Financial Administration: $5,000
- Current Operations - Regular Highways: $10,718,000
Regular Highways: $9,647,000
Police Protection: $8,889,000
Police Protection: $8,773,000
Health - Other: $5,568,000
Judicial and Legal Services: $5,450,000
Correctional Institutions: $5,319,000
Correctional Institutions: $5,235,000
Health - Other: $5,071,000
Judicial and Legal Services: $4,602,000
Financial Administration: $3,941,000
Solid Waste Management: $3,854,000
Financial Administration: $3,374,000
Natural Resources - Other: $3,216,000
General - Other: $3,122,000
Solid Waste Management: $3,002,000
General - Other: $2,729,000
Natural Resources - Other: $2,513,000
Sewerage: $2,017,000
Local Fire Protection: $1,857,000
Central Staff Services: $1,737,000
Sewerage: $1,714,000
Central Staff Services: $1,633,000
Public Welfare - Other: $1,435,000
Housing and Community Development: $1,294,000
Corrections - Other: $1,196,000
General Public Buildings: $1,039,000
General Public Buildings: $998,000
Housing and Community Development: $992,000
Corrections - Other: $936,000
Public Welfare - Other: $675,000
Parks and Recreation: $495,000
Parks and Recreation: $474,000
Water Utilities: $196,000
Water Utilities: $125,000
Protective Inspection and Regulation - Other: $75,000
Protective Inspection and Regulation - Other: $62,000
Libraries: $30,000
Local Fire Protection: $27,000
Libraries: $18,000
- Federal Intergovernmental - Natural Resources: $323,000
Other: $297,000
General Local Government Support: $289,000
General Local Government Support: $263,000
Natural Resources: $141,000
Other: $103,000
Health and Hospitals: $54,000
- General - Interest on Debt: $1,421,000
Interest on Debt: $1,039,000
- Intergovernmental to Local - Other - Local Fire Protection: $1,254,000
Other - General - Other: $304,000
Other - Health - Other: $174,000
Other - Solid Waste Management: $134,000
Other - Natural Resources - Other: $112,000
Other - Financial Administration: $99,000
Other - Sewerage: $45,000
Other - Central Staff Services: $39,000
Other - Regular Highways: $37,000
Other - Water Utilities: $13,000
Other - Housing and Community Development: $2,000
Other - Health - Other: $1,000
- Intergovernmental to State - Health - Other: $5,000
- Local Intergovernmental - Other: $1,344,000
Health and Hospitals: $815,000
Other: $805,000
Health and Hospitals: $740,000
- Long Term Debt - Beginning Outstanding - Unspecified Public Purpose: $52,195,000
Outstanding Unspecified Public Purpose: $50,861,000
Outstanding Unspecified Public Purpose: $46,263,000
Beginning Outstanding - Unspecified Public Purpose: $42,057,000
Issue, Unspecified Public Purpose: $17,962,000
Retired Unspecified Public Purpose: $14,537,000
Retired Unspecified Public Purpose: $9,157,000
Issue, Unspecified Public Purpose: $8,604,000
- Miscellaneous - Rents: $1,499,000
Interest Earnings: $1,167,000
Fines and Forfeits: $985,000
General Revenue - Other: $928,000
Fines and Forfeits: $885,000
Sale of Property: $751,000
Donations From Private Sources: $358,000
Donations From Private Sources: $301,000
General Revenue - Other: $258,000
Special Assessments: $223,000
Sale of Property: $206,000
Rents: $174,000
Special Assessments: $81,000
Interest Earnings: $0
- Other Capital Outlay - Health - Other: $560,000
Regular Highways: $481,000
Sewerage: $368,000
Solid Waste Management: $224,000
Solid Waste Management: $220,000
Water Utilities: $215,000
Regular Highways: $149,000
Police Protection: $111,000
Natural Resources - Other: $104,000
Natural Resources - Other: $72,000
General - Other: $69,000
Health - Other: $56,000
Correctional Institutions: $36,000
Transit Utilities: $33,000
Sewerage: $33,000
Financial Administration: $30,000
Judicial and Legal Services: $23,000
Police Protection: $23,000
Financial Administration: $11,000
- Other Funds - Cash and Securities: $1,517,000
Cash and Securities: $1,190,000
- Revenue - Water Utilities: $220,000
Water Utilities: $209,000
- State Intergovernmental - Other: $9,730,000
Other: $7,288,000
Highways: $4,049,000
Highways: $3,603,000
General Local Government Support: $1,900,000
Health and Hospitals: $1,716,000
Health and Hospitals: $1,526,000
General Local Government Support: $312,000
Housing and Community Development: $161,000
Housing and Community Development: $133,000
- Tax - Property: $21,220,000
Property: $19,479,000
General Sales and Gross Receipts: $10,406,000
General Sales and Gross Receipts: $7,586,000
Documentary and Stock Transfer: $2,528,000
Documentary and Stock Transfer: $2,103,000
Public Utilities Sales: $1,782,000
Other: $1,471,000
Other: $1,254,000
Other License: $1,197,000
Public Utilities Sales: $1,089,000
Severance: $1,032,000
Other License: $961,000
Other Selective Sales: $621,000
Other Selective Sales: $398,000
Motor Vehicle License: $372,000
Motor Vehicle License: $340,000
Occupation and Business License - Other: $188,000
Occupation and Business License - Other: $164,000
Amusements Sales: $77,000
Amusements Sales: $53,000
Public Utility License: $36,000
Severance: $26,000
- Total Salaries and Wages: $26,390,000
: $26,034,000
Mason County government finances - Cash and Securities in 2020:
- Bond Funds - Cash and Securities: $2,927,000
- Charges - Other: $6,686,000
Other: $5,209,000
Solid Waste Management: $4,300,000
Solid Waste Management: $3,445,000
Sewerage: $2,190,000
Sewerage: $2,167,000
Regular Highways: $131,000
Regular Highways: $118,000
Natural Resources - Other: $55,000
Parks and Recreation: $53,000
Parks and Recreation: $45,000
Natural Resources - Other: $12,000
- Construction - Regular Highways: $4,434,000
Regular Highways: $3,601,000
Parks and Recreation: $938,000
Judicial and Legal Services: $213,000
General Public Buildings: $196,000
Parks and Recreation: $149,000
Correctional Institutions: $65,000
Judicial and Legal Services: $51,000
General Public Buildings: $9,000
General - Other: $7,000
Financial Administration: $5,000
- Current Operations - Regular Highways: $10,718,000
Regular Highways: $9,647,000
Police Protection: $8,889,000
Police Protection: $8,773,000
Health - Other: $5,568,000
Judicial and Legal Services: $5,450,000
Correctional Institutions: $5,319,000
Correctional Institutions: $5,235,000
Health - Other: $5,071,000
Judicial and Legal Services: $4,602,000
Financial Administration: $3,941,000
Solid Waste Management: $3,854,000
Financial Administration: $3,374,000
Natural Resources - Other: $3,216,000
General - Other: $3,122,000
Solid Waste Management: $3,002,000
General - Other: $2,729,000
Natural Resources - Other: $2,513,000
Sewerage: $2,017,000
Local Fire Protection: $1,857,000
Central Staff Services: $1,737,000
Sewerage: $1,714,000
Central Staff Services: $1,633,000
Public Welfare - Other: $1,435,000
Housing and Community Development: $1,294,000
Corrections - Other: $1,196,000
General Public Buildings: $1,039,000
General Public Buildings: $998,000
Housing and Community Development: $992,000
Corrections - Other: $936,000
Public Welfare - Other: $675,000
Parks and Recreation: $495,000
Parks and Recreation: $474,000
Water Utilities: $196,000
Water Utilities: $125,000
Protective Inspection and Regulation - Other: $75,000
Protective Inspection and Regulation - Other: $62,000
Libraries: $30,000
Local Fire Protection: $27,000
Libraries: $18,000
- Federal Intergovernmental - Natural Resources: $323,000
Other: $297,000
General Local Government Support: $289,000
General Local Government Support: $263,000
Natural Resources: $141,000
Other: $103,000
Health and Hospitals: $54,000
- General - Interest on Debt: $1,421,000
Interest on Debt: $1,039,000
- Intergovernmental to Local - Other - Local Fire Protection: $1,254,000
Other - General - Other: $304,000
Other - Health - Other: $174,000
Other - Solid Waste Management: $134,000
Other - Natural Resources - Other: $112,000
Other - Financial Administration: $99,000
Other - Sewerage: $45,000
Other - Central Staff Services: $39,000
Other - Regular Highways: $37,000
Other - Water Utilities: $13,000
Other - Housing and Community Development: $2,000
Other - Health - Other: $1,000
- Intergovernmental to State - Health - Other: $5,000
- Local Intergovernmental - Other: $1,344,000
Health and Hospitals: $815,000
Other: $805,000
Health and Hospitals: $740,000
- Long Term Debt - Beginning Outstanding - Unspecified Public Purpose: $52,195,000
Outstanding Unspecified Public Purpose: $50,861,000
Outstanding Unspecified Public Purpose: $46,263,000
Beginning Outstanding - Unspecified Public Purpose: $42,057,000
Issue, Unspecified Public Purpose: $17,962,000
Retired Unspecified Public Purpose: $14,537,000
Retired Unspecified Public Purpose: $9,157,000
Issue, Unspecified Public Purpose: $8,604,000
- Miscellaneous - Rents: $1,499,000
Interest Earnings: $1,167,000
Fines and Forfeits: $985,000
General Revenue - Other: $928,000
Fines and Forfeits: $885,000
Sale of Property: $751,000
Donations From Private Sources: $358,000
Donations From Private Sources: $301,000
General Revenue - Other: $258,000
Special Assessments: $223,000
Sale of Property: $206,000
Rents: $174,000
Special Assessments: $81,000
Interest Earnings: $0
- Other Capital Outlay - Health - Other: $560,000
Regular Highways: $481,000
Sewerage: $368,000
Solid Waste Management: $224,000
Solid Waste Management: $220,000
Water Utilities: $215,000
Regular Highways: $149,000
Police Protection: $111,000
Natural Resources - Other: $104,000
Natural Resources - Other: $72,000
General - Other: $69,000
Health - Other: $56,000
Correctional Institutions: $36,000
Transit Utilities: $33,000
Sewerage: $33,000
Financial Administration: $30,000
Judicial and Legal Services: $23,000
Police Protection: $23,000
Financial Administration: $11,000
- Other Funds - Cash and Securities: $1,517,000
Cash and Securities: $1,190,000
- Revenue - Water Utilities: $220,000
Water Utilities: $209,000
- State Intergovernmental - Other: $9,730,000
Other: $7,288,000
Highways: $4,049,000
Highways: $3,603,000
General Local Government Support: $1,900,000
Health and Hospitals: $1,716,000
Health and Hospitals: $1,526,000
General Local Government Support: $312,000
Housing and Community Development: $161,000
Housing and Community Development: $133,000
- Tax - Property: $21,220,000
Property: $19,479,000
General Sales and Gross Receipts: $10,406,000
General Sales and Gross Receipts: $7,586,000
Documentary and Stock Transfer: $2,528,000
Documentary and Stock Transfer: $2,103,000
Public Utilities Sales: $1,782,000
Other: $1,471,000
Other: $1,254,000
Other License: $1,197,000
Public Utilities Sales: $1,089,000
Severance: $1,032,000
Other License: $961,000
Other Selective Sales: $621,000
Other Selective Sales: $398,000
Motor Vehicle License: $372,000
Motor Vehicle License: $340,000
Occupation and Business License - Other: $188,000
Occupation and Business License - Other: $164,000
Amusements Sales: $77,000
Amusements Sales: $53,000
Public Utility License: $36,000
Severance: $26,000
- Total Salaries and Wages: $26,390,000
: $26,034,000
Supplemental Security Income (SSI) in 2006:
- Total number of recipients: 1,264
- Number of aged recipients: 58
- Number of blind and disabled recipients: 1,206
- Number of recipients under 18: 155
- Number of recipients between 18 and 64: 971
- Number of recipients older than 64: 138
- Number of recipients also receiving OASDI: 399
- Amount of payments (thousands of dollars): 687
| Most common first names in Mason County, WA among deceased individuals | ||
| Name | Count | Lived (average) |
|---|---|---|
| Robert | 180 | 71.1 years |
| John | 171 | 76.8 years |
| William | 162 | 73.8 years |
| Mary | 125 | 79.0 years |
| George | 121 | 76.1 years |
| James | 117 | 74.8 years |
| Charles | 97 | 76.5 years |
| Helen | 87 | 81.3 years |
| Donald | 85 | 69.9 years |
| Richard | 84 | 67.7 years |
| Most common last names in Mason County, WA among deceased individuals | ||
| Last name | Count | Lived (average) |
|---|---|---|
| Smith | 88 | 73.5 years |
| Johnson | 85 | 78.1 years |
| Anderson | 66 | 75.0 years |
| Brown | 45 | 78.0 years |
| Miller | 36 | 73.9 years |
| Wilson | 30 | 77.2 years |
| Nelson | 28 | 77.4 years |
| White | 28 | 75.4 years |
| Jones | 25 | 75.0 years |
| Carlson | 24 | 76.3 years |
| Businesses in Mason County, WA | ||||
| Name | Count | Name | Count | |
|---|---|---|---|---|
| Ace Hardware | 2 | McDonald's | 3 | |
| Blockbuster | 1 | Pizza Hut | 1 | |
| Burger King | 1 | Rite Aid | 1 | |
| Curves | 1 | Safeway | 2 | |
| Dairy Queen | 1 | Starbucks | 3 | |
| Dennys | 1 | Subway | 4 | |
| Domino's Pizza | 1 | Super 8 | 1 | |
| FedEx | 4 | T-Mobile | 1 | |
| Ford | 1 | Taco Bell | 1 | |
| H&R Block | 2 | True Value | 1 | |
| Jack In The Box | 1 | U-Haul | 2 | |
| Kroger | 2 | UPS | 4 | |
| La-Z-Boy | 1 | Vons | 2 | |
| Lane Furniture | 1 | Walmart | 1 | |
| MasterBrand Cabinets | 3 | |||