Medina County, Texas (TX)
County owner-occupied free and clear houses and condos in 2010: 5,596
County owner-occupied houses and condos in 2000: 10,262
Renter-occupied apartments: 3,286 (it was 2,618 in 2000)
| % of renters here: | 20% |
| State: | 36% |
Land area: 1328 sq. mi.
Water area: 6.8 sq. mi.
Population density: 40 people per square mile (low).
Industries providing employment: Educational, health and social services (23.4%), Retail trade (12.5%).
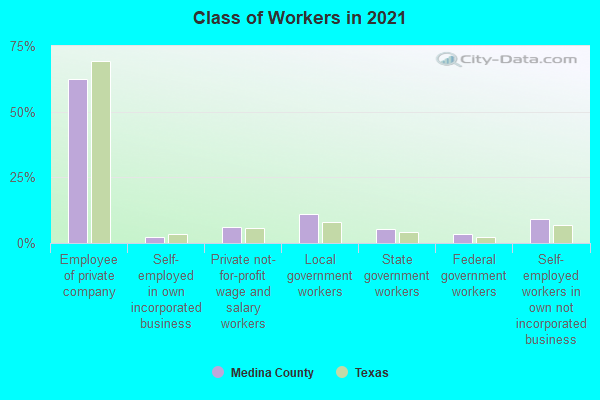
Type of workers:
- Private wage or salary: 71%
- Government: 20%
- Self-employed, not incorporated: 9%
- Unpaid family work: 0%
- OSM Map
- General Map
- Google Map
- MSN Map

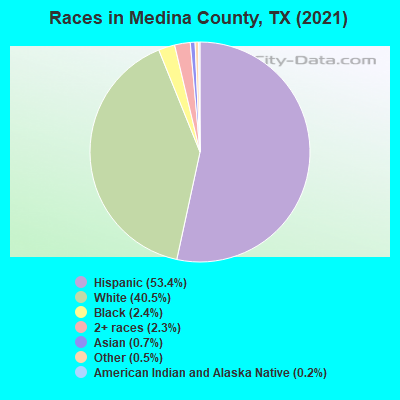
- 28,26253.6%Hispanic or Latino
- 21,00639.8%White Non-Hispanic Alone
- 1,2552.4%Black Non-Hispanic Alone
- 1,2332.3%Two or more races
- 5471.0%Some other race alone
- 3690.7%Asian alone
- 990.2%American Indian and Alaska Native alone
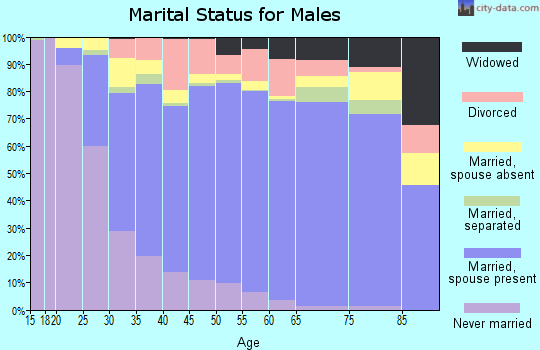
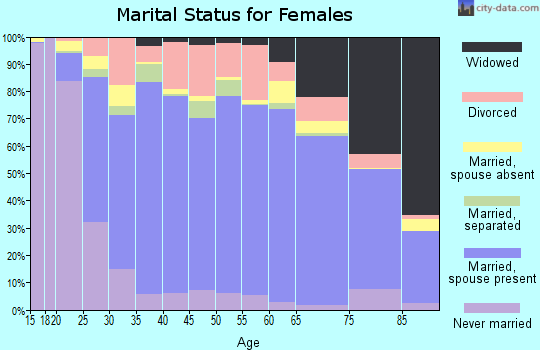
| Median resident age: | 39.8 years |
| Texas median age: | 35.6 years |
| Males: 27,428 | |
| Females: 25,386 |

 | Which places in Medina County are commutable to Lackland AFB (4 replies) |
| Owners of pitbulls that killed an elderly are released from jail (19 replies) |
| What other Texas city would you live in? (68 replies) |
| First Observations of SA (71 replies) |
| What is life like in Kerrville? (30 replies) |
| Does Anyone from West Texas Commute to Work in San Antonio (30 replies) |
| Medina County: | 2.0 people |
| Texas: | 3 people |
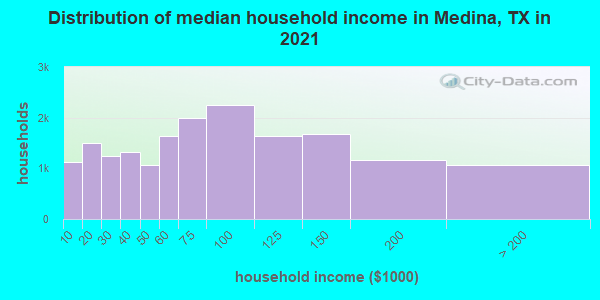
Estimated median household income in 2022: $72,308 ($36,063 in 1999)
| This county: | $72,308 |
| Texas: | $72,284 |
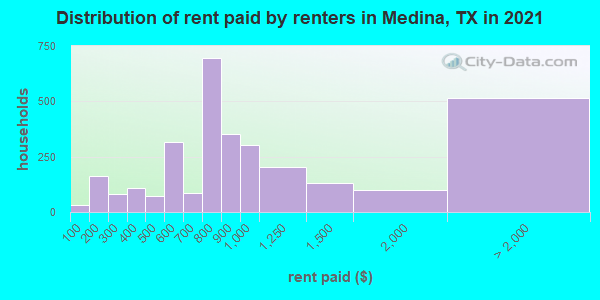
Median contract rent in 2022 for apartments: $854 (lower quartile is $594, upper quartile is $1,101)
| This county: | $854 |
| State: | $1117 |
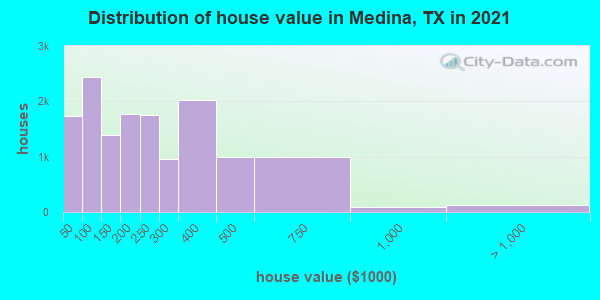
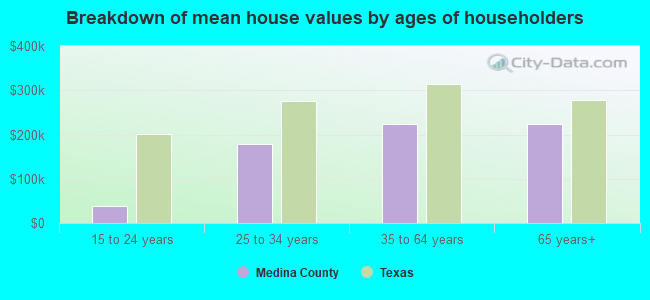
Estimated median house or condo value in 2022: $215,460 (it was $65,900 in 2000)
| Medina: | $215,460 |
| Texas: | $275,400 |
Mean price in 2022:
Median monthly housing costs for homes and condos with a mortgage: $1,662Detached houses: $334,355
Here: $334,355 State: $369,058 Townhouses or other attached units: $445,409
Here: $445,409 State: $327,631 Mobile homes: $125,277
Here: $125,277 State: $124,413 Occupied boats, RVs, vans, etc.: $36,732
Here: $36,732 State: $73,921
Median monthly housing costs for units without a mortgage: $589
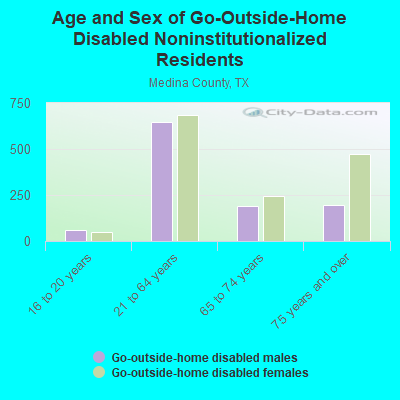
Institutionalized population: 2,196
Crime in 2021 (reported by the sheriff's office or county police, not the county total):
- Murders: 1
- Rapes: 7
- Robberies: 1
- Assaults: 35
- Burglaries: 38
- Thefts: 125
- Auto thefts: 31
Crime in 2020 (reported by the sheriff's office or county police, not the county total):
- Murders: 2
- Rapes: 11
- Robberies: 6
- Assaults: 50
- Burglaries: 99
- Thefts: 176
- Auto thefts: 60
Health of residents in Medina County based on CDC Behavioral Risk Factor Surveillance System Survey Questionnaires from 2013 to 2021:
General health status score of residents in this county from 1 (poor) to 5 (excellent) is 3.4. This is worse than average.71.2% of residents exercised in the past month. This is about average.
37.5% of residents smoked 100+ cigarettes in their lives. This is less than average.
53.6% of adult residents drank alcohol in the past 30 days. This is less than average.
65.3% of residents visited a dentist within the past year. This is less than average.
Average weight of males is 199 pounds. This is more than average.
Average weight of females is 163 pounds. This is about average.
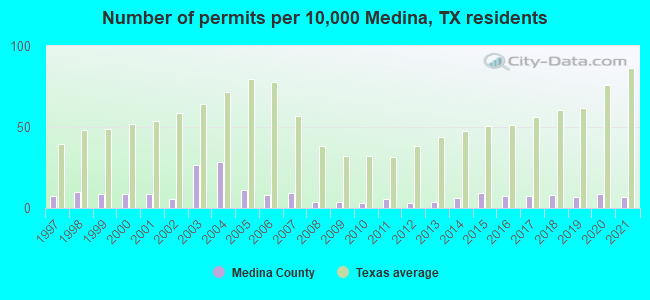
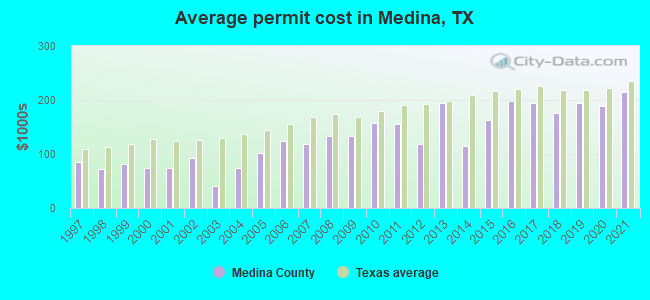
Single-family new house construction building permits:
- 2022: 27 buildings, average cost: $357,700
- 2021: 27 buildings, average cost: $214,300
- 2020: 34 buildings, average cost: $188,100
- 2019: 26 buildings, average cost: $194,100
- 2018: 31 buildings, average cost: $176,100
- 2017: 30 buildings, average cost: $194,300
- 2016: 29 buildings, average cost: $198,700
- 2015: 36 buildings, average cost: $163,000
- 2014: 25 buildings, average cost: $114,100
- 2013: 15 buildings, average cost: $193,500
- 2012: 13 buildings, average cost: $118,900
- 2011: 22 buildings, average cost: $155,800
- 2010: 12 buildings, average cost: $156,800
- 2009: 14 buildings, average cost: $132,800
- 2008: 15 buildings, average cost: $133,400
- 2007: 37 buildings, average cost: $119,400
- 2006: 31 buildings, average cost: $124,500
- 2005: 43 buildings, average cost: $100,800
- 2004: 111 buildings, average cost: $75,200
- 2003: 104 buildings, average cost: $41,200
- 2002: 21 buildings, average cost: $92,200
- 2001: 33 buildings, average cost: $74,200
- 2000: 35 buildings, average cost: $74,800
- 1999: 35 buildings, average cost: $82,300
- 1998: 38 buildings, average cost: $72,100
- 1997: 28 buildings, average cost: $85,800
Median real estate property taxes paid for housing units with mortgages in 2022: $3,358 (1.3%)
Median real estate property taxes paid for housing units with no mortgage in 2022: $2,074 (1.2%)
| Medina County: | 10.3% |
| Texas: | 14.0% |
Median age of residents in 2022: 39.8 years old
(Males: 39.0 years old, Females: 41.1 years old)
(Median age for: White residents: 48.5 years old, Black residents: 33.6 years old, American Indian residents: 37.7 years old, Asian residents: 36.8 years old, Hispanic or Latino residents: 34.0 years old, Other race residents: 40.8 years old)
Fair market rent in 2006 for a 1-bedroom apartment in Medina County is $473 a month.
Fair market rent for a 2-bedroom apartment is $557 a month.
Fair market rent for a 3-bedroom apartment is $666 a month.
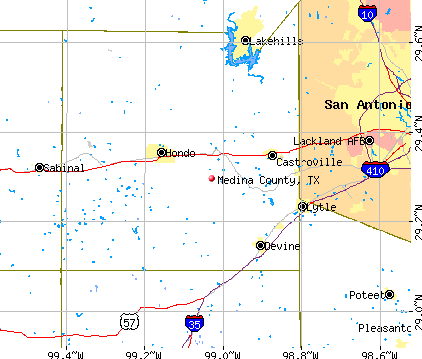
Cities in this county include: Hondo, Devine, Castroville, Natalia, D'Hanis, LaCoste.
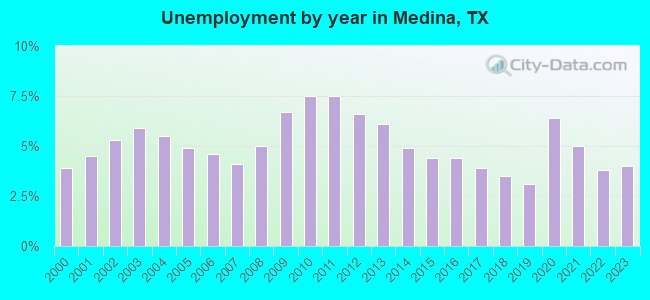
| Here: | 3.3% |
| Texas: | 3.5% |
Current college students: 1,529
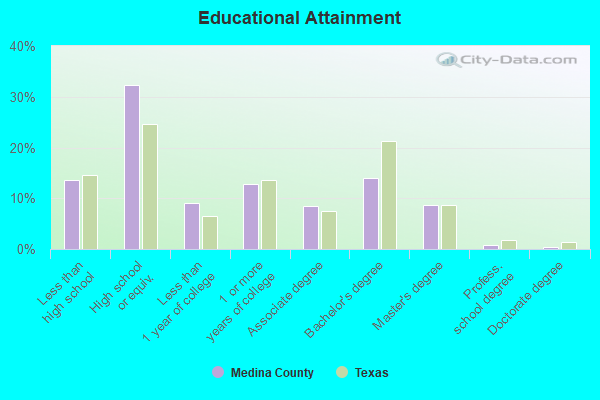
People 25 years of age or older with a high school degree or higher: 86.0%
People 25 years of age or older with a bachelor's degree or higher: 22.2%
Number of foreign born residents: 3,066 (50.1% naturalized citizens)
| Medina County: | 5.8% |
| Whole state: | 17.2% |
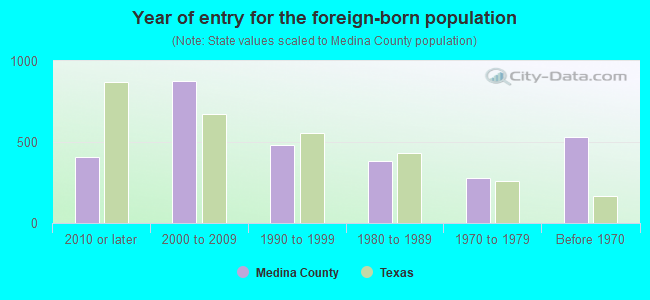
- Year of entry for the foreign-born population
- 4112010 or later
- 1,0232000 to 2009
- 4801990 to 1999
- 3831980 to 1989
- 2771970 to 1979
- 531Before 1970
Mean travel time to work (commute): minutes
Percentage of county residents living and working in this county: 99.6%
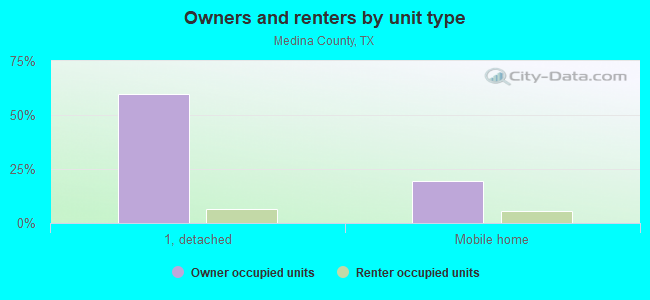
Housing units in structures:
- One, detached: 13,561
- One, attached: 206
- Two: 116
- 3 or 4: 465
- 5 to 9: 346
- 10 to 19: 21
- 20 to 49: 58
- 50 or more: 217
- Mobile homes: 4,976
- Boats, RVs, vans, etc.: 206
Housing units in Medina County with a mortgage: 6,634 (333 second mortgage, 38 home equity loan, 276 both second mortgage and home equity loan)
Houses without a mortgage: 168
| Here: | 3.4% with mortgage |
| State: | 98.4% with mortgage |
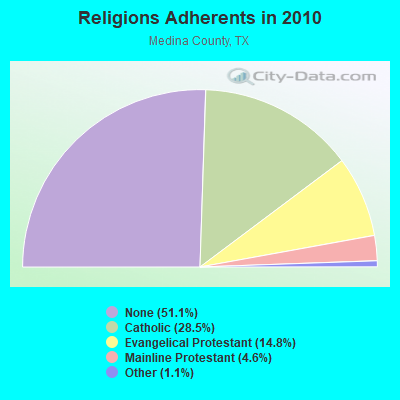
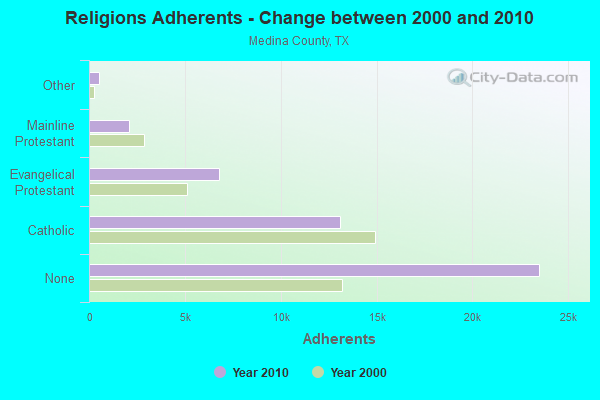
Religion statistics for Medina County
| Religion | Adherents | Congregations |
|---|---|---|
| Catholic | 13,097 | 8 |
| Evangelical Protestant | 6,803 | 37 |
| Mainline Protestant | 2,095 | 8 |
| Other | 513 | 4 |
| None | 23,498 | - |
Source: Clifford Grammich, Kirk Hadaway, Richard Houseal, Dale E.Jones, Alexei Krindatch, Richie Stanley and Richard H.Taylor. 2012. 2010 U.S.Religion Census: Religious Congregations & Membership Study. Association of Statisticians of American Religious Bodies. Jones, Dale E., et al. 2002. Congregations and Membership in the United States 2000. Nashville, TN: Glenmary Research Center.
Food Environment Statistics:
| Medina County: | 1.37 / 10,000 pop. |
| State: | 1.47 / 10,000 pop. |
| This county: | 0.91 / 10,000 pop. |
| Texas: | 1.11 / 10,000 pop. |
| Medina County: | 4.57 / 10,000 pop. |
| Texas: | 3.95 / 10,000 pop. |
| This county: | 7.77 / 10,000 pop. |
| State: | 6.13 / 10,000 pop. |
| Medina County: | 8.8% |
| Texas: | 8.9% |
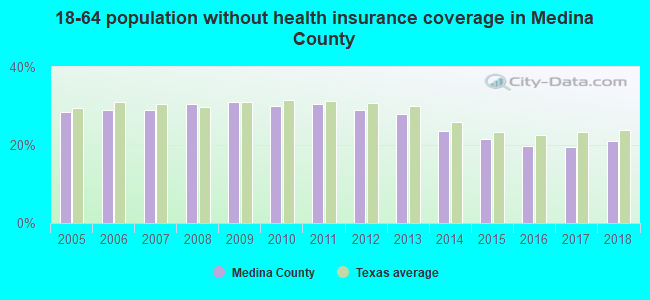
| Medina County: | 28.3% |
| State: | 26.6% |
| Here: | 19.5% |
| State: | 15.7% |
Agriculture in Medina County:
Average size of farms: 413 acresAverage value of agricultural products sold per farm: $31,134
Average value of crops sold per acre for harvested cropland: $187.10
The value of nursery, greenhouse, floriculture, and sod as a percentage of the total market value of agricultural products sold: 0.10%
The value of livestock, poultry, and their products as a percentage of the total market value of agricultural products sold: 61.85%
Average total farm production expenses per farm: $32,025
Harvested cropland as a percentage of land in farms: 15.39%
Irrigated harvested cropland as a percentage of land in farms: 39.51%
Average market value of all machinery and equipment per farm: $30,612
The percentage of farms operated by a family or individual: 91.03%
Average age of principal farm operators: 58 years
Average number of cattle and calves per 100 acres of all land in farms: 9.17
Milk cows as a percentage of all cattle and calves: 0.40%
Corn for grain: 30389 harvested acres
All wheat for grain: 20548 harvested acres
Upland cotton: 4373 harvested acres
Vegetables: 2,232 harvested acres
Land in orchards: 934 acres
Earthquake activity:
Medina County-area historical earthquake activity is significantly above Texas state average. It is 26% smaller than the overall U.S. average.On 10/20/2011 at 12:24:41, a magnitude 4.8 (4.8 MW, Depth: 3.1 mi, Class: Light, Intensity: IV - V) earthquake occurred 64.8 miles away from Medina County center
On 4/14/1995 at 00:32:56, a magnitude 5.7 (5.6 MB, 5.7 MS, 5.7 MW, Depth: 11.1 mi, Class: Moderate, Intensity: VI - VII) earthquake occurred 269.0 miles away from the county center
On 4/9/1993 at 12:29:19, a magnitude 4.3 (4.1 MB, 4.3 LG, Depth: 3.1 mi) earthquake occurred 64.2 miles away from the county center
On 6/16/1978 at 11:46:54, a magnitude 5.3 (4.4 MB, 4.6 UK, 5.3 ML) earthquake occurred 278.0 miles away from the county center
On 5/1/2018 at 16:28:56, a magnitude 4.0 (4.0 MW, Depth: 3.1 mi) earthquake occurred 66.7 miles away from Medina County center
On 4/7/2008 at 09:51:12, a magnitude 3.9 (3.9 MW, Depth: 3.1 mi, Class: Light, Intensity: II - III) earthquake occurred 65.6 miles away from the county center
Magnitude types: regional Lg-wave magnitude (LG), body-wave magnitude (MB), local magnitude (ML), surface-wave magnitude (MS), moment magnitude (MW)
Most recent natural disasters:
- Texas Covid-19 Pandemic, Incident Period: January 20, 2020, FEMA Id: 4485, Natural disaster type: Other
- Texas Tropical Storm Alex, Incident Period: June 27, 2010 to August 14, 2010, Emergency Declared EM-3313: June 29, 2010, FEMA Id: 3313, Natural disaster type: Tropical Storm
- Texas Wildfires, Incident Period: March 14, 2008 to September 01, 2008, Emergency Declared EM-3284: March 14, 2008, FEMA Id: 3284, Natural disaster type: Fire
- Texas Tropical Storm Erin, Incident Period: August 14, 2007 to August 20, 2007, Major Disaster (Presidential) Declared DR-1730: October 02, 2007, FEMA Id: 1730, Natural disaster type: Tropical Storm
- Texas Severe Storms, Tornadoes, and Flooding, Incident Period: June 16, 2007 to August 03, 2007, Major Disaster (Presidential) Declared DR-1709: June 29, 2007, FEMA Id: 1709, Natural disaster type: Storm, Tornado, Flood
- Texas Hurricane Rita, Incident Period: September 23, 2005 to October 14, 2005, Major Disaster (Presidential) Declared DR-1606: September 24, 2005, FEMA Id: 1606, Natural disaster type: Hurricane
- Texas Hurricane Rita, Incident Period: September 20, 2005 to October 14, 2005, Emergency Declared EM-3261: September 21, 2005, FEMA Id: 3261, Natural disaster type: Hurricane
- Texas Hurricane Katrina, Incident Period: August 29, 2005 to October 01, 2005, Emergency Declared EM-3216: September 02, 2005, FEMA Id: 3216, Natural disaster type: Hurricane
- Texas Severe Storms and Flooding, Incident Period: June 29, 2002 to July 31, 2002, Major Disaster (Presidential) Declared DR-1425: July 04, 2002, FEMA Id: 1425, Natural disaster type: Storm, Flood
- Texas Extreme Fire Hazards, Incident Period: August 01, 1999 to December 10, 1999, Emergency Declared EM-3142: September 01, 1999, FEMA Id: 3142, Natural disaster type: Fire
- 3 other natural disasters have been reported since 1953.
The number of natural disasters in Medina County (13) is near the US average (15).
Major Disasters (Presidential) Declared: 6
Emergencies Declared: 6
Causes of natural disasters: Floods: 4, Storms: 4, Fires: 3, Hurricanes: 3, Tornadoes: 2, Tropical Storms: 2, Other: 1 (Note: some incidents may be assigned to more than one category).

Means of transportation to work:
- Drove a car alone: 10,384 (66.8%)
- Carpooled: 1,938 (12.5%)
- Taxicab, motorcycle, or other means: 231 (1.5%)
- Bicycle: 44 (0.3%)
- Walked: 369 (2.4%)
- Worked at home: 2,789 (17.9%)
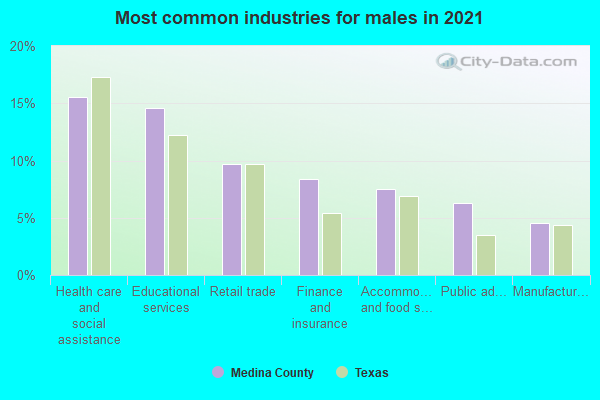
- Health care and social assistance (18%)
- Educational services (14%)
- Retail trade (10%)
- Finance and insurance (8%)
- Accommodation and food services (5%)
- Public administration (5%)
- Professional, scientific, and technical services (5%)
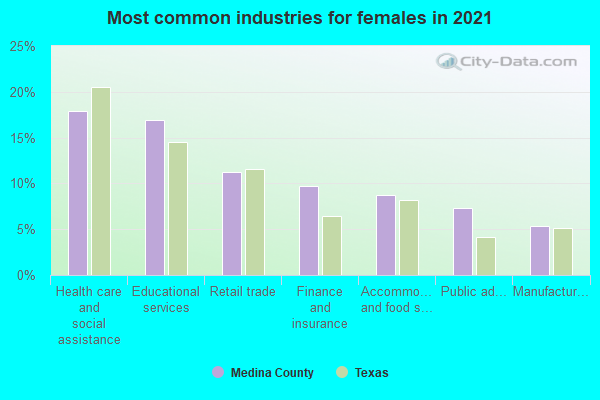
- Health care and social assistance (21%)
- Educational services (17%)
- Retail trade (12%)
- Finance and insurance (10%)
- Accommodation and food services (6%)
- Public administration (6%)
- Professional, scientific, and technical services (5%)
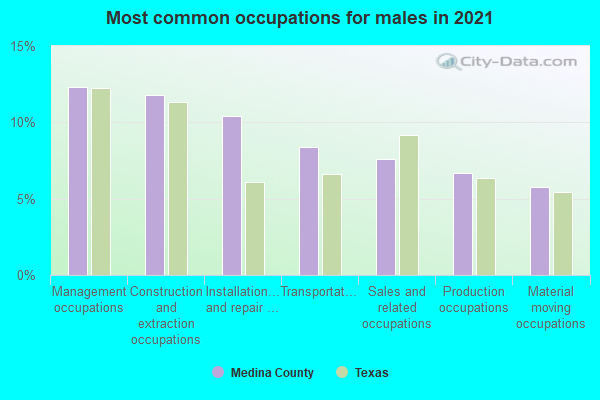
- Management occupations (14%)
- Construction and extraction occupations (13%)
- Installation, maintenance, and repair occupations (11%)
- Sales and related occupations (10%)
- Production occupations (8%)
- Transportation occupations (6%)
- Material moving occupations (4%)
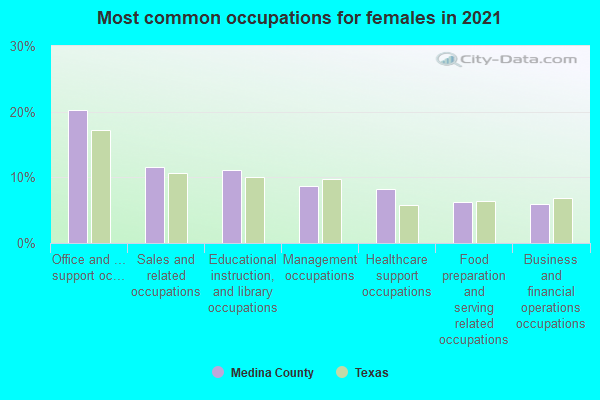
- Office and administrative support occupations (21%)
- Educational instruction, and library occupations (11%)
- Sales and related occupations (10%)
- Management occupations (8%)
- Healthcare support occupations (8%)
- Food preparation and serving related occupations (7%)
- Business and financial operations occupations (6%)
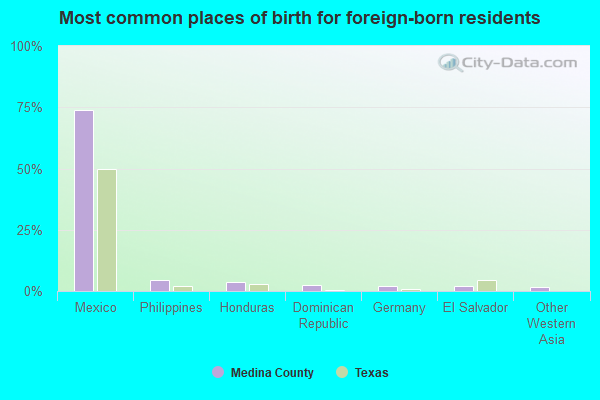
- Mexico (71%)
- Honduras (6%)
- India (3%)
- El Salvador (3%)
- Guatemala (2%)
- Philippines (2%)
- Spain (2%)
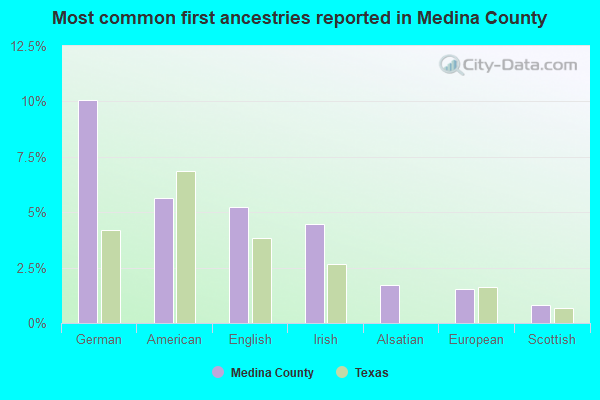
- German (10%)
- American (8%)
- Irish (5%)
- English (5%)
- Alsatian (1%)
- European (1%)
- Scottish (1%)
People in group quarters in Medina County, Texas in 2010:
- 1,818 people in state prisons
- 314 people in nursing facilities/skilled-nursing facilities
- 71 people in group homes intended for adults
- 64 people in local jails and other municipal confinement facilities
- 40 people in workers' group living quarters and job corps centers
- 2 people in other noninstitutional facilities
People in group quarters in Medina County, Texas in 2000:
- 1,292 people in state prisons
- 276 people in nursing homes
- 74 people in homes for the mentally ill
- 72 people in other noninstitutional group quarters
- 50 people in local jails and other confinement facilities (including police lockups)
- 12 people in homes for the mentally retarded
- 4 people in religious group quarters
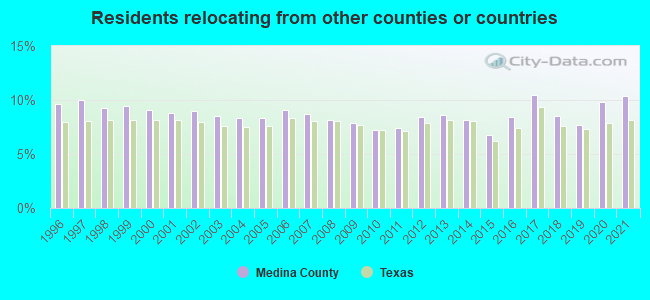
10.35% of this county's 2021 resident taxpayers lived in other counties in 2020 ($62,377 average adjusted gross income)
| Here: | 10.35% |
| Texas average: | 8.12% |
10 or fewer of this county's residents moved from foreign countries.
8.74% relocated from other counties in Texas ($50,306 average AGI)
1.62% relocated from other states ($12,072 average AGI)
Medina County: 1.62% Texas average: 2.83%
Top counties from which taxpayers relocated into this county between 2020 and 2021:
| from Bexar County, TX | |
| from Atascosa County, TX | |
| from Frio County, TX | |
| from Harris County, TX | |
| from Travis County, TX | |
| from Uvalde County, TX | |
| from Guadalupe County, TX |
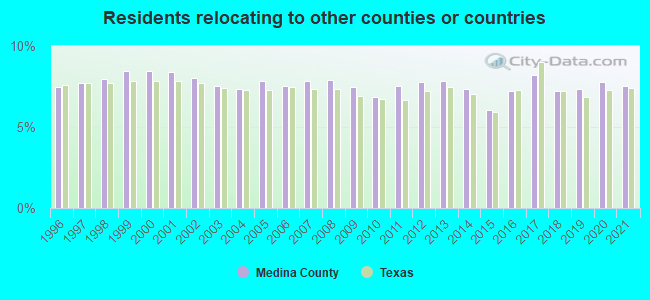
7.52% of this county's 2020 resident taxpayers moved to other counties in 2021 ($53,265 average adjusted gross income)
| Here: | 7.52% |
| Texas average: | 7.40% |
10 or fewer of this county's residents moved to foreign countries.
6.36% relocated to other counties in Texas ($43,245 average AGI)
1.16% relocated to other states ($10,020 average AGI)
Medina County: 1.16% Texas average: 2.08%
Top counties to which taxpayers relocated from this county between 2020 and 2021:
| to Bexar County, TX | |
| to Atascosa County, TX | |
| to Frio County, TX | |
| to Uvalde County, TX | |
| to Bandera County, TX | |
| to Comal County, TX | |
| to Guadalupe County, TX |
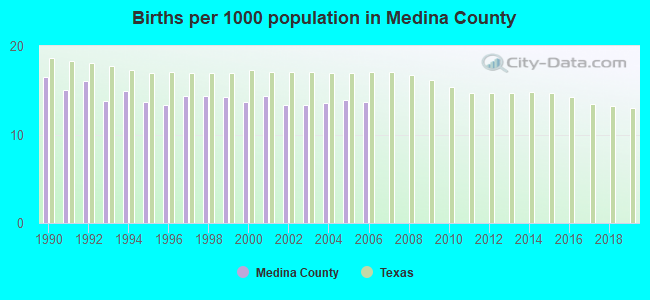
Births per 1000 population from 1990 to 1999: 14.6
Births per 1000 population from 2000 to 2006: 13.7
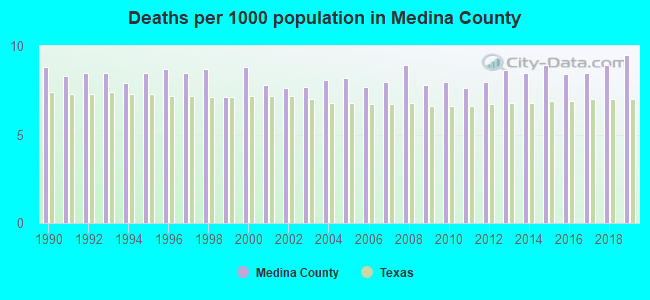
Deaths per 1000 population from 1990 to 1999: 8.3
Deaths per 1000 population from 2000 to 2009: 8.1
Deaths per 1000 population from 2010 to 2020: 8.6
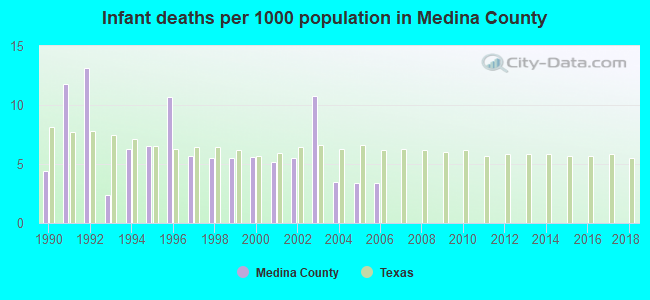
Infant deaths per 1000 live births from 1990 to 1999: 7.2
Infant deaths per 1000 live births from 2000 to 2006: 5.3
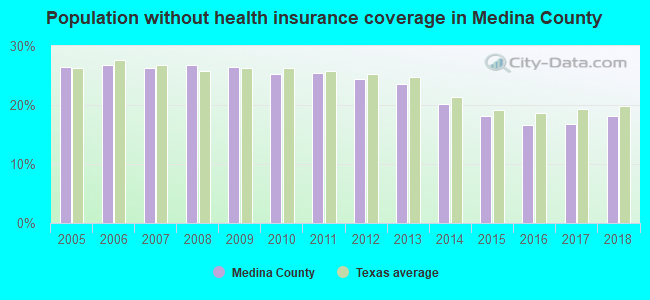
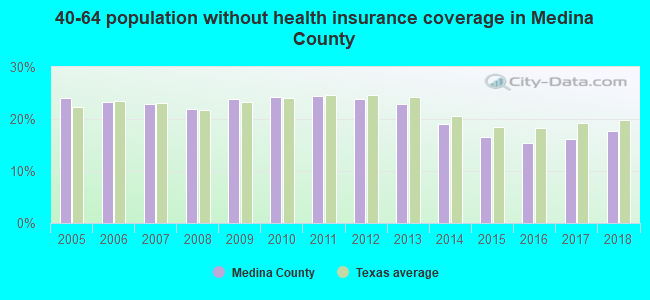
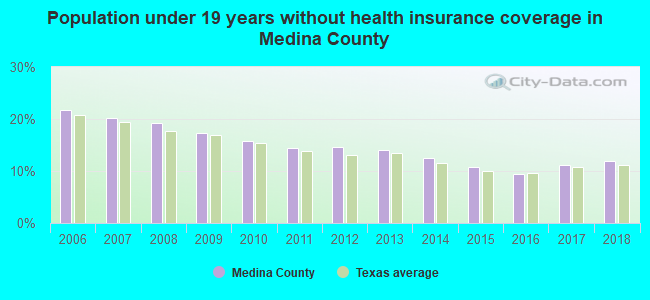
Persons under 19 years old without health insurance coverage in 2018: 11.9%
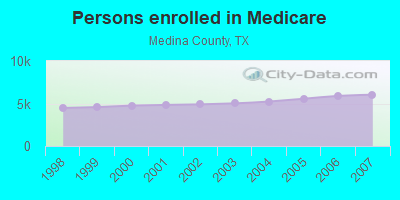
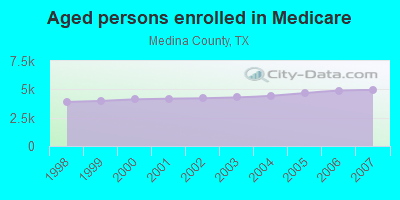
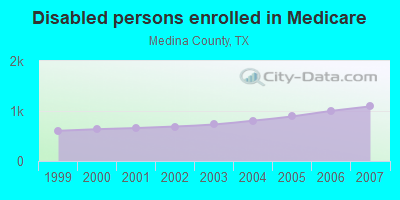
Persons enrolled in hospital insurance and/or supplemental medical insurance (Medicare) in July 1, 2007: 6,036 (4,943 aged, 1,093 disabled)
Children under 18 without health insurance coverage in 2007: 2,241 (19%)
Most common underlying causes of death in Medina County, Texas in 1999 - 2019:
- Acute myocardial infarction, unspecified (816)
- Atherosclerotic heart disease (448)
- Bronchus or lung, unspecified - Malignant neoplasms (387)
- Chronic obstructive pulmonary disease, unspecified (292)
- Unspecified dementia (226)
- Stroke, not specified as haemorrhage or infarction (208)
- Alzheimer disease, unspecified (114)
- Congestive heart failure (91)
- Heart failure, unspecified (72)
- Senile degeneration of brain, not elsewhere classified (71)
Population without health insurance coverage in 2000: 19%
Children under 18 without health insurance coverage in 2000: 19%
Short term general hospital admissions per 100,000 population in 2004: 1,973
Short term general hospital beds per 100,000 population in 2004: 59
Emergency room visits per 100,000 population in 2004: 18,962
General practice office based MDs per 100,000 population in 2005: 1,364
Medical specialist MDs per 100,000 population in 2005: 825
Dentists per 100,000 population in 1998: 14
Total births per 100,000 population, July 2005 - July 2006 : 21
Total deaths per 100,000 population, July 2005 - July 2006: 58
Limited-service eating places per 100,000 population in 2005 : 5
Suicides per 1,000,000 population from 2000 to 2006: 97.1. This is less than state average.
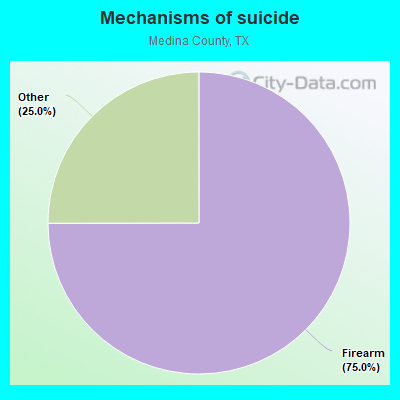
- Firearm - 72.8
- Other - 24.3
Household type by relationship:
Households: 52,814- Male householders: 8,852 (1,682 living alone), Female householders: 9,432 (2,075 living alone)
10,957 spouses (10,928 opposite-sex spouses), 763 unmarried partners, (747 opposite-sex unmarried partners), 15,948 children (14,560 natural, 521 adopted, 871 stepchildren), 1,723 grandchildren, 375 brothers or sisters, 857 parents, 0 foster children, 560 other relatives, 967 non-relatives
- In group quarters: 2,339
Size of family households: 6,180 2-persons, 3,214 3-persons, 2,153 4-persons, 1,314 5-persons, 654 6-persons, 291 7-or-more-persons.
Size of nonfamily households: 3,758 1-person, 654 2-persons, 31 3-persons, 1 5-persons.
7,944 married couples with children.
2,524 single-parent households (720 men, 1,804 women).
74.5% of residents of Medina speak English at home.
24.9% of residents speak Spanish at home (71% speak English very well, 15% speak English well, 9% speak English not well, 5% don't speak English at all).
0.7% of residents speak other Indo-European language at home (67% speak English very well, 8% speak English well, 25% speak English not well).
0.1% of residents speak Asian or Pacific Island language at home (57% speak English very well, 43% speak English well).
0.1% of residents speak other language at home (3% speak English very well, 97% speak English well).
In fiscal year 2004:
Federal Government expenditure: $179,279,000 ($4,241 per capita)
Department of Defense expenditure: $15,364,000
Federal direct payments to individuals for retirement and disability: $95,938,000
Federal other direct payments to individuals: $37,617,000
Federal direct payments not to individuals: $4,015,000
Federal grants: $35,668,000
Federal procurement contracts: $1,012,000 ($79,000 Department of Defense)
Federal salaries and wages: $5,030,000 ($1,327,000 Department of Defense)
Federal Government direct loans: $25,000
Federal guaranteed/insured loans: $15,047,000
Federal Government insurance: $64,600,000
Population change from April 1, 2000 to July 1, 2005:
Births: 2,836| Here: | 66 per 1000 residents |
| State: | 85 per 1000 residents |
Deaths: 1,609
| Here: | 37 per 1000 residents |
| State: | 35 per 1000 residents |
Net international migration: +101
| Here: | +2 per 1000 residents |
| State: | +29 per 1000 residents |
Net internal migration: +2,452
| Here: | +57 per 1000 residents |
| State: | +10 per 1000 residents |
Total withdrawal of fresh water for public supply: 6.30 millions of gallons per day (99% from ground, 1% from surface)
| Here: | 6.1 |
| State: | 6.3 |
| Here: | 4.3 |
| State: | 4.0 |
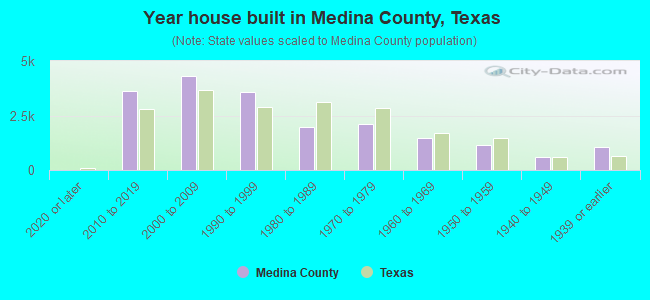
- Year house built in Medina County, Texas
- 302020 or later
- 4,0352010 to 2019
- 4,2222000 to 2009
- 3,3941990 to 1999
- 2,3231980 to 1989
- 2,0301970 to 1979
- 1,1621960 to 1969
- 1,1381950 to 1959
- 5231940 to 1949
- 1,0781939 or earlier
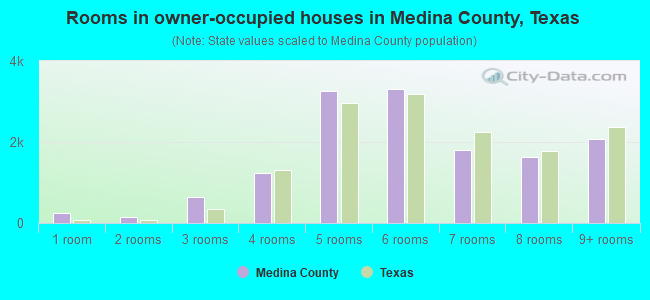
- Rooms in owner-occupied houses in Medina County, Texas
- 1991 room
- 2082 rooms
- 6753 rooms
- 1,4064 rooms
- 2,8815 rooms
- 3,8286 rooms
- 1,9277 rooms
- 1,8848 rooms
- 2,0749+ rooms
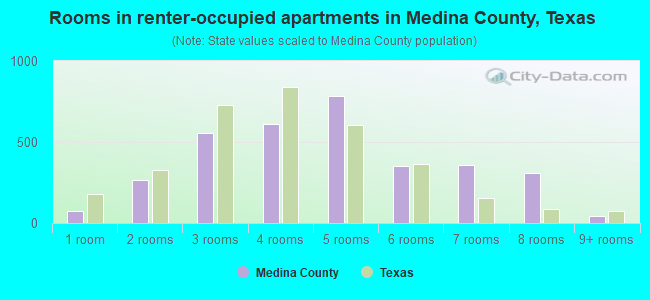
- Rooms in renter-occupied apartments in Medina County, Texas
- 1231 room
- 2752 rooms
- 5863 rooms
- 7194 rooms
- 7515 rooms
- 3946 rooms
- 2647 rooms
- 838 rooms
- 449+ rooms
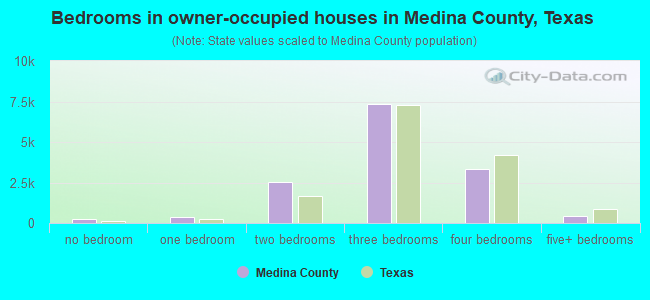
- Bedrooms in owner-occupied houses in Medina County, Texas
- 221no bedroom
- 3551 bedroom
- 2,4032 bedrooms
- 8,2193 bedrooms
- 3,2994 bedrooms
- 4955+ bedrooms
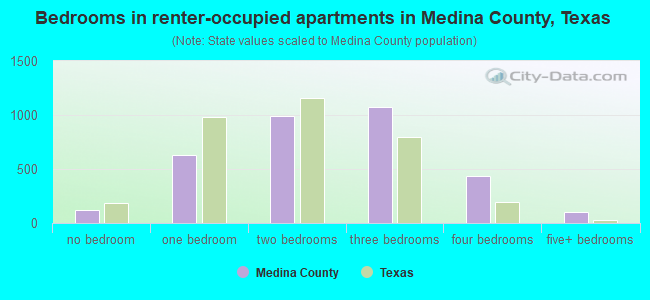
- Bedrooms in renter-occupied apartments in Medina County, Texas
- 187no bedroom
- 6131 bedroom
- 1,1012 bedrooms
- 1,0603 bedrooms
- 2094 bedrooms
- 885+ bedrooms
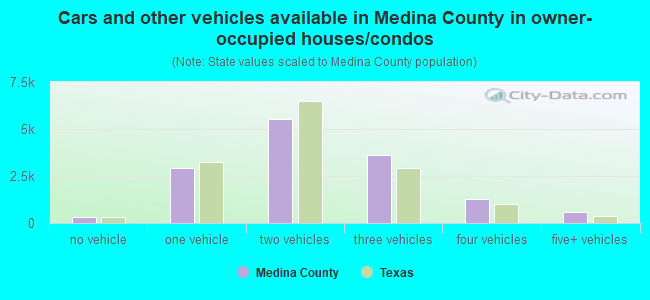
- Cars and other vehicles available in Medina County in owner-occupied houses/condos
- 352no vehicle
- 2,9861 vehicle
- 6,4022 vehicles
- 3,6503 vehicles
- 1,1564 vehicles
- 4465+ vehicles
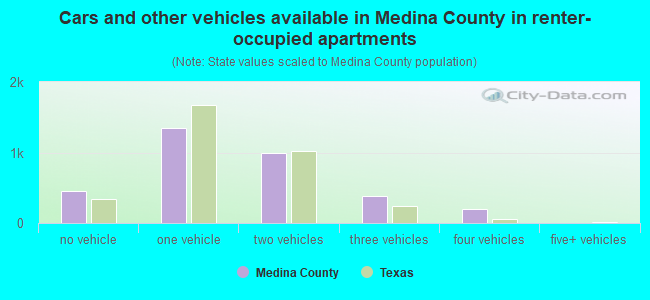
- Cars and other vehicles available in Medina County in renter-occupied apartments
- 538no vehicle
- 1,3741 vehicle
- 8692 vehicles
- 3253 vehicles
- 1634 vehicles
- 05+ vehicles
87.0% of Medina County residents lived in the same house 1 years ago.
Out of people who lived in different houses, 32% lived in this county.
Out of people who lived in different counties, 87% lived in Texas.
| Medina County: | 87.0% |
| State average: | 85.7% |
Place of birth for U.S.-born residents:
- This state: 37,931
- Other state: 10,544
- Northeast: 926
- Midwest: 2,231
- South: 3,610
- West: 3,824
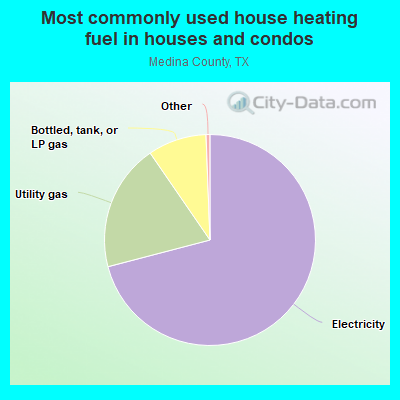
- 69.9%Electricity
- 20.4%Utility gas
- 9.0%Bottled, tank, or LP gas
- 0.4%No fuel used
- 0.3%Wood
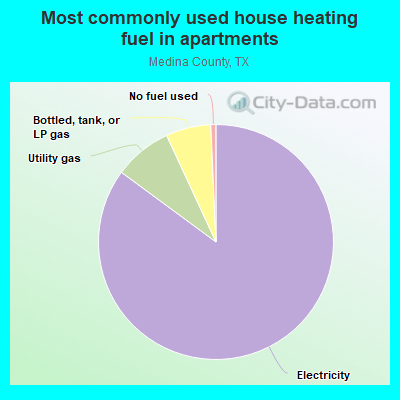
- 86.8%Electricity
- 8.1%Utility gas
- 4.9%Bottled, tank, or LP gas
- 0.2%No fuel used
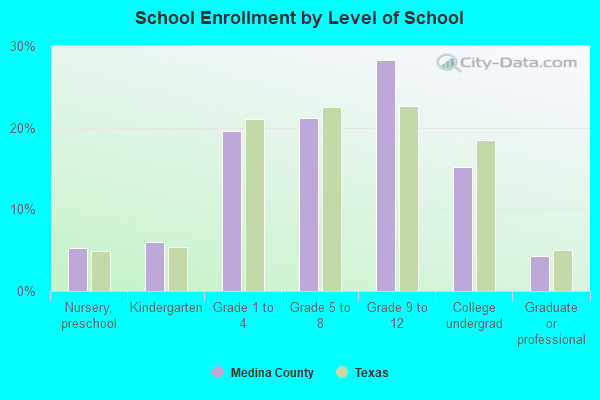
Private vs. public school enrollment:
| Here: | 22.1% |
| Texas: | 8.8% |
| Here: | 16.9% |
| Texas: | 8.0% |
| Here: | 11.1% |
| Texas: | 16.2% |
Medina County government finances - Expenditure in 2017:
- Current Operations - Regular Highways: $3,960,000
Police Protection: $3,654,000
Central Staff Services: $3,434,000
Judicial and Legal Services: $2,658,000
Correctional Institutions: $2,624,000
Financial Administration: $1,541,000
Health - Other: $1,181,000
General Public Buildings: $591,000
Public Welfare - Other: $567,000
Corrections - Other: $384,000
General - Other: $351,000
Public Welfare, Vendor Payments for Medical Care: $227,000
Protective Inspection and Regulation - Other: $171,000
Libraries: $55,000
- Federal Intergovernmental - Public Welfare: $325,000
- General - Interest on Debt: $161,000
- Intergovernmental to Local - Other - Judicial and Legal Services: $464,000
Other - Correctional Institutions: $201,000
- Local Intergovernmental - Other: $152,000
- Miscellaneous - General Revenue - Other: $1,579,000
Fines and Forfeits: $1,435,000
Interest Earnings: $163,000
Sale of Property: $160,000
Donations From Private Sources: $8,000
Rents: $3,000
- Other Capital Outlay - General Public Building: $588,000
- Other Funds - Cash and Securities: $3,424,000
- Sinking Funds - Cash and Securities: $47,000
- State Intergovernmental - Health and Hospitals: $873,000
Other: $628,000
Public Welfare: $533,000
General Local Government Support: $173,000
Highways: $73,000
- Tax - Property: $14,039,000
General Sales and Gross Receipts: $1,522,000
Motor Vehicle License: $1,103,000
- Total Salaries and Wages: $6,929,000
Medina County government finances - Revenue in 2017:
- Current Operations - Regular Highways: $3,960,000
Police Protection: $3,654,000
Central Staff Services: $3,434,000
Judicial and Legal Services: $2,658,000
Correctional Institutions: $2,624,000
Financial Administration: $1,541,000
Health - Other: $1,181,000
General Public Buildings: $591,000
Public Welfare - Other: $567,000
Corrections - Other: $384,000
General - Other: $351,000
Public Welfare, Vendor Payments for Medical Care: $227,000
Protective Inspection and Regulation - Other: $171,000
Libraries: $55,000
- Federal Intergovernmental - Public Welfare: $325,000
- General - Interest on Debt: $161,000
- Intergovernmental to Local - Other - Judicial and Legal Services: $464,000
Other - Correctional Institutions: $201,000
- Local Intergovernmental - Other: $152,000
- Miscellaneous - General Revenue - Other: $1,579,000
Fines and Forfeits: $1,435,000
Interest Earnings: $163,000
Sale of Property: $160,000
Donations From Private Sources: $8,000
Rents: $3,000
- Other Capital Outlay - General Public Building: $588,000
- Other Funds - Cash and Securities: $3,424,000
- Sinking Funds - Cash and Securities: $47,000
- State Intergovernmental - Health and Hospitals: $873,000
Other: $628,000
Public Welfare: $533,000
General Local Government Support: $173,000
Highways: $73,000
- Tax - Property: $14,039,000
General Sales and Gross Receipts: $1,522,000
Motor Vehicle License: $1,103,000
- Total Salaries and Wages: $6,929,000
Medina County government finances - Debt in 2017:
- Current Operations - Regular Highways: $3,960,000
Police Protection: $3,654,000
Central Staff Services: $3,434,000
Judicial and Legal Services: $2,658,000
Correctional Institutions: $2,624,000
Financial Administration: $1,541,000
Health - Other: $1,181,000
General Public Buildings: $591,000
Public Welfare - Other: $567,000
Corrections - Other: $384,000
General - Other: $351,000
Public Welfare, Vendor Payments for Medical Care: $227,000
Protective Inspection and Regulation - Other: $171,000
Libraries: $55,000
- Federal Intergovernmental - Public Welfare: $325,000
- General - Interest on Debt: $161,000
- Intergovernmental to Local - Other - Judicial and Legal Services: $464,000
Other - Correctional Institutions: $201,000
- Local Intergovernmental - Other: $152,000
- Miscellaneous - General Revenue - Other: $1,579,000
Fines and Forfeits: $1,435,000
Interest Earnings: $163,000
Sale of Property: $160,000
Donations From Private Sources: $8,000
Rents: $3,000
- Other Capital Outlay - General Public Building: $588,000
- Other Funds - Cash and Securities: $3,424,000
- Sinking Funds - Cash and Securities: $47,000
- State Intergovernmental - Health and Hospitals: $873,000
Other: $628,000
Public Welfare: $533,000
General Local Government Support: $173,000
Highways: $73,000
- Tax - Property: $14,039,000
General Sales and Gross Receipts: $1,522,000
Motor Vehicle License: $1,103,000
- Total Salaries and Wages: $6,929,000
Medina County government finances - Cash and Securities in 2017:
- Current Operations - Regular Highways: $3,960,000
Police Protection: $3,654,000
Central Staff Services: $3,434,000
Judicial and Legal Services: $2,658,000
Correctional Institutions: $2,624,000
Financial Administration: $1,541,000
Health - Other: $1,181,000
General Public Buildings: $591,000
Public Welfare - Other: $567,000
Corrections - Other: $384,000
General - Other: $351,000
Public Welfare, Vendor Payments for Medical Care: $227,000
Protective Inspection and Regulation - Other: $171,000
Libraries: $55,000
- Federal Intergovernmental - Public Welfare: $325,000
- General - Interest on Debt: $161,000
- Intergovernmental to Local - Other - Judicial and Legal Services: $464,000
Other - Correctional Institutions: $201,000
- Local Intergovernmental - Other: $152,000
- Miscellaneous - General Revenue - Other: $1,579,000
Fines and Forfeits: $1,435,000
Interest Earnings: $163,000
Sale of Property: $160,000
Donations From Private Sources: $8,000
Rents: $3,000
- Other Capital Outlay - General Public Building: $588,000
- Other Funds - Cash and Securities: $3,424,000
- Sinking Funds - Cash and Securities: $47,000
- State Intergovernmental - Health and Hospitals: $873,000
Other: $628,000
Public Welfare: $533,000
General Local Government Support: $173,000
Highways: $73,000
- Tax - Property: $14,039,000
General Sales and Gross Receipts: $1,522,000
Motor Vehicle License: $1,103,000
- Total Salaries and Wages: $6,929,000
Supplemental Security Income (SSI) in 2006:
- Total number of recipients: 1,150
- Number of aged recipients: 225
- Number of blind and disabled recipients: 925
- Number of recipients under 18: 154
- Number of recipients between 18 and 64: 630
- Number of recipients older than 64: 366
- Number of recipients also receiving OASDI: 523
- Amount of payments (thousands of dollars): 447
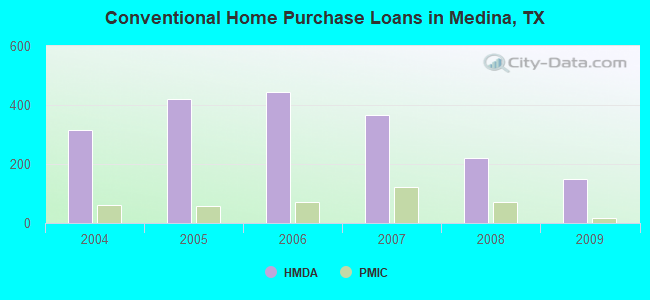
| Home Mortgage Disclosure Act Aggregated Statistics For Year 2009 (Based on 6 full tracts) | ||||||||||||
| A) FHA, FSA/RHS & VA Home Purchase Loans | B) Conventional Home Purchase Loans | C) Refinancings | D) Home Improvement Loans | F) Non-occupant Loans on < 5 Family Dwellings (A B C & D) | G) Loans On Manufactured Home Dwelling (A B C & D) | |||||||
|---|---|---|---|---|---|---|---|---|---|---|---|---|
| Number | Average Value | Number | Average Value | Number | Average Value | Number | Average Value | Number | Average Value | Number | Average Value | |
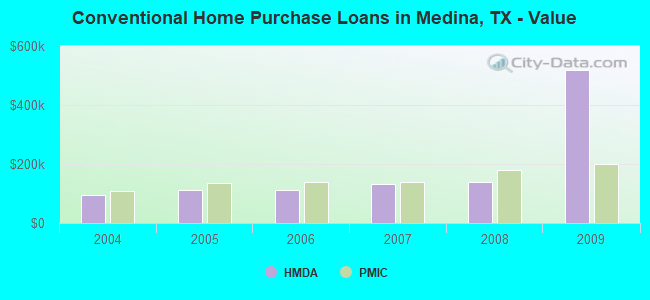
| LOANS ORIGINATED | 124 | $152,927 | 149 | $518,315 | 322 | $398,441 | 84 | $33,833 | 36 | $130,278 | 74 | $324,568 |
| APPLICATIONS APPROVED, NOT ACCEPTED | 14 | $89,500 | 27 | $100,444 | 42 | $153,810 | 12 | $40,750 | 4 | $68,000 | 28 | $72,107 |
| APPLICATIONS DENIED | 25 | $116,000 | 98 | $108,184 | 178 | $181,309 | 79 | $40,835 | 15 | $94,267 | 87 | $54,425 |
| APPLICATIONS WITHDRAWN | 15 | $153,067 | 22 | $136,818 | 93 | $167,914 | 12 | $73,250 | 9 | $107,222 | 12 | $69,667 |
| FILES CLOSED FOR INCOMPLETENESS | 3 | $164,667 | 12 | $108,167 | 21 | $163,476 | 5 | $72,600 | 3 | $79,333 | 11 | $55,545 |
| Private Mortgage Insurance Companies Aggregated Statistics For Year 2009 (Based on 6 full tracts) | ||||||||
| A) Conventional Home Purchase Loans | B) Refinancings | C) Non-occupant Loans on < 5 Family Dwellings (A & B) | D) Loans On Manufactured Home Dwelling (A & B) | |||||
|---|---|---|---|---|---|---|---|---|
| Number | Average Value | Number | Average Value | Number | Average Value | Number | Average Value | |
| LOANS ORIGINATED | 18 | $201,111 | 6 | $289,833 | 0 | $0 | 0 | $0 |
| APPLICATIONS APPROVED, NOT ACCEPTED | 7 | $193,571 | 7 | $296,571 | 1 | $54,000 | 1 | $54,000 |
| APPLICATIONS DENIED | 4 | $165,250 | 6 | $213,667 | 0 | $0 | 0 | $0 |
| APPLICATIONS WITHDRAWN | 4 | $303,000 | 1 | $290,000 | 0 | $0 | 0 | $0 |
| FILES CLOSED FOR INCOMPLETENESS | 0 | $0 | 0 | $0 | 0 | $0 | 0 | $0 |
| Most common first names in Medina County, TX among deceased individuals | ||
| Name | Count | Lived (average) |
|---|---|---|
| Mary | 135 | 79.0 years |
| John | 126 | 74.6 years |
| William | 108 | 76.6 years |
| James | 107 | 74.5 years |
| Maria | 101 | 77.3 years |
| Robert | 96 | 72.9 years |
| Jose | 73 | 74.6 years |
| George | 71 | 76.1 years |
| Charles | 66 | 74.5 years |
| Joe | 52 | 71.7 years |
| Most common last names in Medina County, TX among deceased individuals | ||
| Last name | Count | Lived (average) |
|---|---|---|
| Rodriguez | 76 | 77.1 years |
| Hernandez | 75 | 74.0 years |
| Garcia | 71 | 70.6 years |
| Gonzales | 66 | 75.0 years |
| Martinez | 63 | 73.8 years |
| Smith | 52 | 75.7 years |
| Lopez | 46 | 66.1 years |
| Ramirez | 45 | 73.5 years |
| Perez | 41 | 74.5 years |
| Garza | 41 | 71.9 years |
| Businesses in Medina County, TX | ||||
| Name | Count | Name | Count | |
|---|---|---|---|---|
| AT&T | 2 | H&R Block | 3 | |
| Ace Hardware | 1 | Little Caesars Pizza | 1 | |
| Alco Stores | 1 | McDonald's | 3 | |
| Best Western | 1 | Nike | 1 | |
| Blockbuster | 1 | Pizza Hut | 2 | |
| Chevrolet | 2 | RadioShack | 2 | |
| Church's Chicken | 3 | SONIC Drive-In | 4 | |
| Cricket Wireless | 4 | T-Mobile | 1 | |
| Dairy Queen | 1 | True Value | 2 | |
| Domino's Pizza | 1 | U-Haul | 1 | |
| FedEx | 3 | UPS | 4 | |
| Ford | 2 | Walmart | 1 | |
Medina County on our top lists:
- #49 on the list of "Top 101 counties with the lowest surface withdrawal of fresh water for public supply"